Article

A Raman Spectroscopic Analysis of Polymer Membranes with Graphene Oxide and Reduced Graphene Oxide

by
Anna Kołodziej
1,
Elżbieta Długoń
2,
Małgorzata Świętek
3,
Magdalena Ziąbka
2,
Emilia Dawiec
1,
Maciej Gubernat
2,
Marek Michalec
1 and
Aleksandra Wesełucha-Birczyńska
1,*
1
Faculty of Chemistry, Jagiellonian University, Gronostajowa 2, 30-387 Kraków, Poland
2
Faculty of Materials Science and Ceramics, AGH-University of Science and Technology, Mickiewicza 30, 30-059 Kraków, Poland
3
Institute of Macromolecular Chemistry, Czech Academy of Sciences, Heyrovského Sq. 2, 162 06 Prague 6, Czech Republic
*
Author to whom correspondence should be addressed.
J. Compos. Sci. 2021, 5(1), 20; https://doi.org/10.3390/jcs5010020
Submission received: 21 November 2020 / Revised: 29 December 2020 / Accepted: 3 January 2021 / Published: 8 January 2021
(This article belongs to the Special Issue Feature Papers in Journal of Composites Science in 2020)

Abstract

:
Nowadays, despite significant advances in the field of biomaterials for tissue engineering applications, novel bone substituents still need refinement so they can be successfully implemented into the medical treatment of bone fractures. Generally, a scaffold made of synthetic polymer blended with nanofillers was proven to be a very promising biomaterial for tissue engineering, however the choice of components for the said scaffold remains questionable. The objects of the presented study were novel composites consisting of poly(ε-caprolactone) (PCL) and two types of graphene materials: graphene oxide (GO) and partially reduced graphene oxide (rGO). The technique of choice, that was used to characterize the obtained composites, was Raman micro-spectroscopy. It revealed that the composite PCL/GO differs substantially from the PCL/rGO composite. The incorporation of the GO particles into the polymer influenced the structure organisation of the polymeric matrix more significantly than rGO. The crystallinity parameters confirmed that the level of crystallinity is generally higher in the PCL/GO membrane in comparison to PCL/rGO (and even in raw PCL) that leads to the conclusion that the GO acts as a nucleation agent enhancing the crystallization of PCL. Interestingly, the characteristics of the studied nanofillers, for example: the level of the organisation (D/G ratio) and the in-plane size of the nano-crystallites (La) almost do not differ. However, they have an ability to influence polymeric matrix differently.

1. Introduction

In the last several years there has been a rapid growth in the field of tissue engineering for medical purposes caused by its huge potential as an alternative to current traditional transplant procedures. The ultimate goal of tissue engineering is to design a scaffold that would behave as a native extracellular matrix supporting growth and coordinating the regulation of host cells [1].
A number of synthetic polymers were tested as a basic material of scaffold because of their high mechanical strength, biocompatibility and low costs. Among them the poly(ε-caprolactone) (PCL) emerged to be highly suitable for application in the field of bone tissue engineering [2]. However, PCL, semi-crystalline aliphatic polyester, despite having distinctive mechanical qualities, long-term biodegradability, great solubility and exceptional blend-compatibility, is reported to be not applicable alone. The serious drawback of raw PCL is its hydrophobicity as well as its mechanical properties that are not sufficient enough to withstand the forces acting upon it [3,4]. The way to improve PCL behaviour as a scaffold is a blending with another polymer or (nano)filler. It has already been proven that graphene derivatives used as a modifying nanoparticles (in low concentration due to their toxicity in higher doses [5,6] are able to modify physical and mechanical properties, and also act as nucleation agents to enhance the crystallization of PCL [7]. Furthermore, graphene derivatives are able to improve the biocompatibility and osteogenic potential of the PCL scaffold by promoting adhesion, proliferation, and differentiation of cell [6,8,9,10,11,12,13,14,15,16]. A single graphene layer is a two-dimensional graphitic structure of sp2 hybridization carbon atoms (one atom thick) that forms a honeycomb pattern with excellent mechanical, thermal, and electrical properties [7].
In the presented research two types of graphene derivatives were used to obtain polymer (PCL) nanocomposites: graphene oxide (GO) and partially reduced graphene oxide (rGO). The GO have functional, oxygen-containing groups attached to their surface that gives them unique properties, hydrophilic character that prevents their aggregation in water, and also improves their biocompatibility and ability of blending with the polar polymers such as PCL [8,17]. Graphene materials are also considered to be especially attractive compared to any other carbon nanomaterials because of their lower levels of metallic impurities [18]. Generally, the GO is obtained by oxidation under oxidative treatment of either synthetic or natural graphite. The GO can further be modified by the reduction pathway into the reduced form of the graphene, i.e., rGO. In the rGO the created chemical functional groups on the surface of the graphene layer, as well as on its edges are removed due to the reduction process. Both forms of graphene, i.e., GO and rGO, are the subject of numerous studies due to their potential applications in technique and medicine [19].
In the given study graphite-derived graphene structures were incorporated into the PCL polymeric matrix (Figure 1). The quantity of both forms of graphenes (GO, rGO) was set at a low level of 0.5 wt% in order to prevent any toxic effects. The main aim of the study was to decode and differentiate the phenomenon that occurs in the polymer in contact with the GO that is rich in hydrophilic functional groups, and with rGO that lacked most of those groups. Raman spectroscopy was the method of choice on account of its exceptional ability to test short-range ordering. The procedure of curve fitting in the chosen regions was performed in order to obtain the parameters of crystallinity of both the PCL matrix and graphene components.

2. Materials and Methods

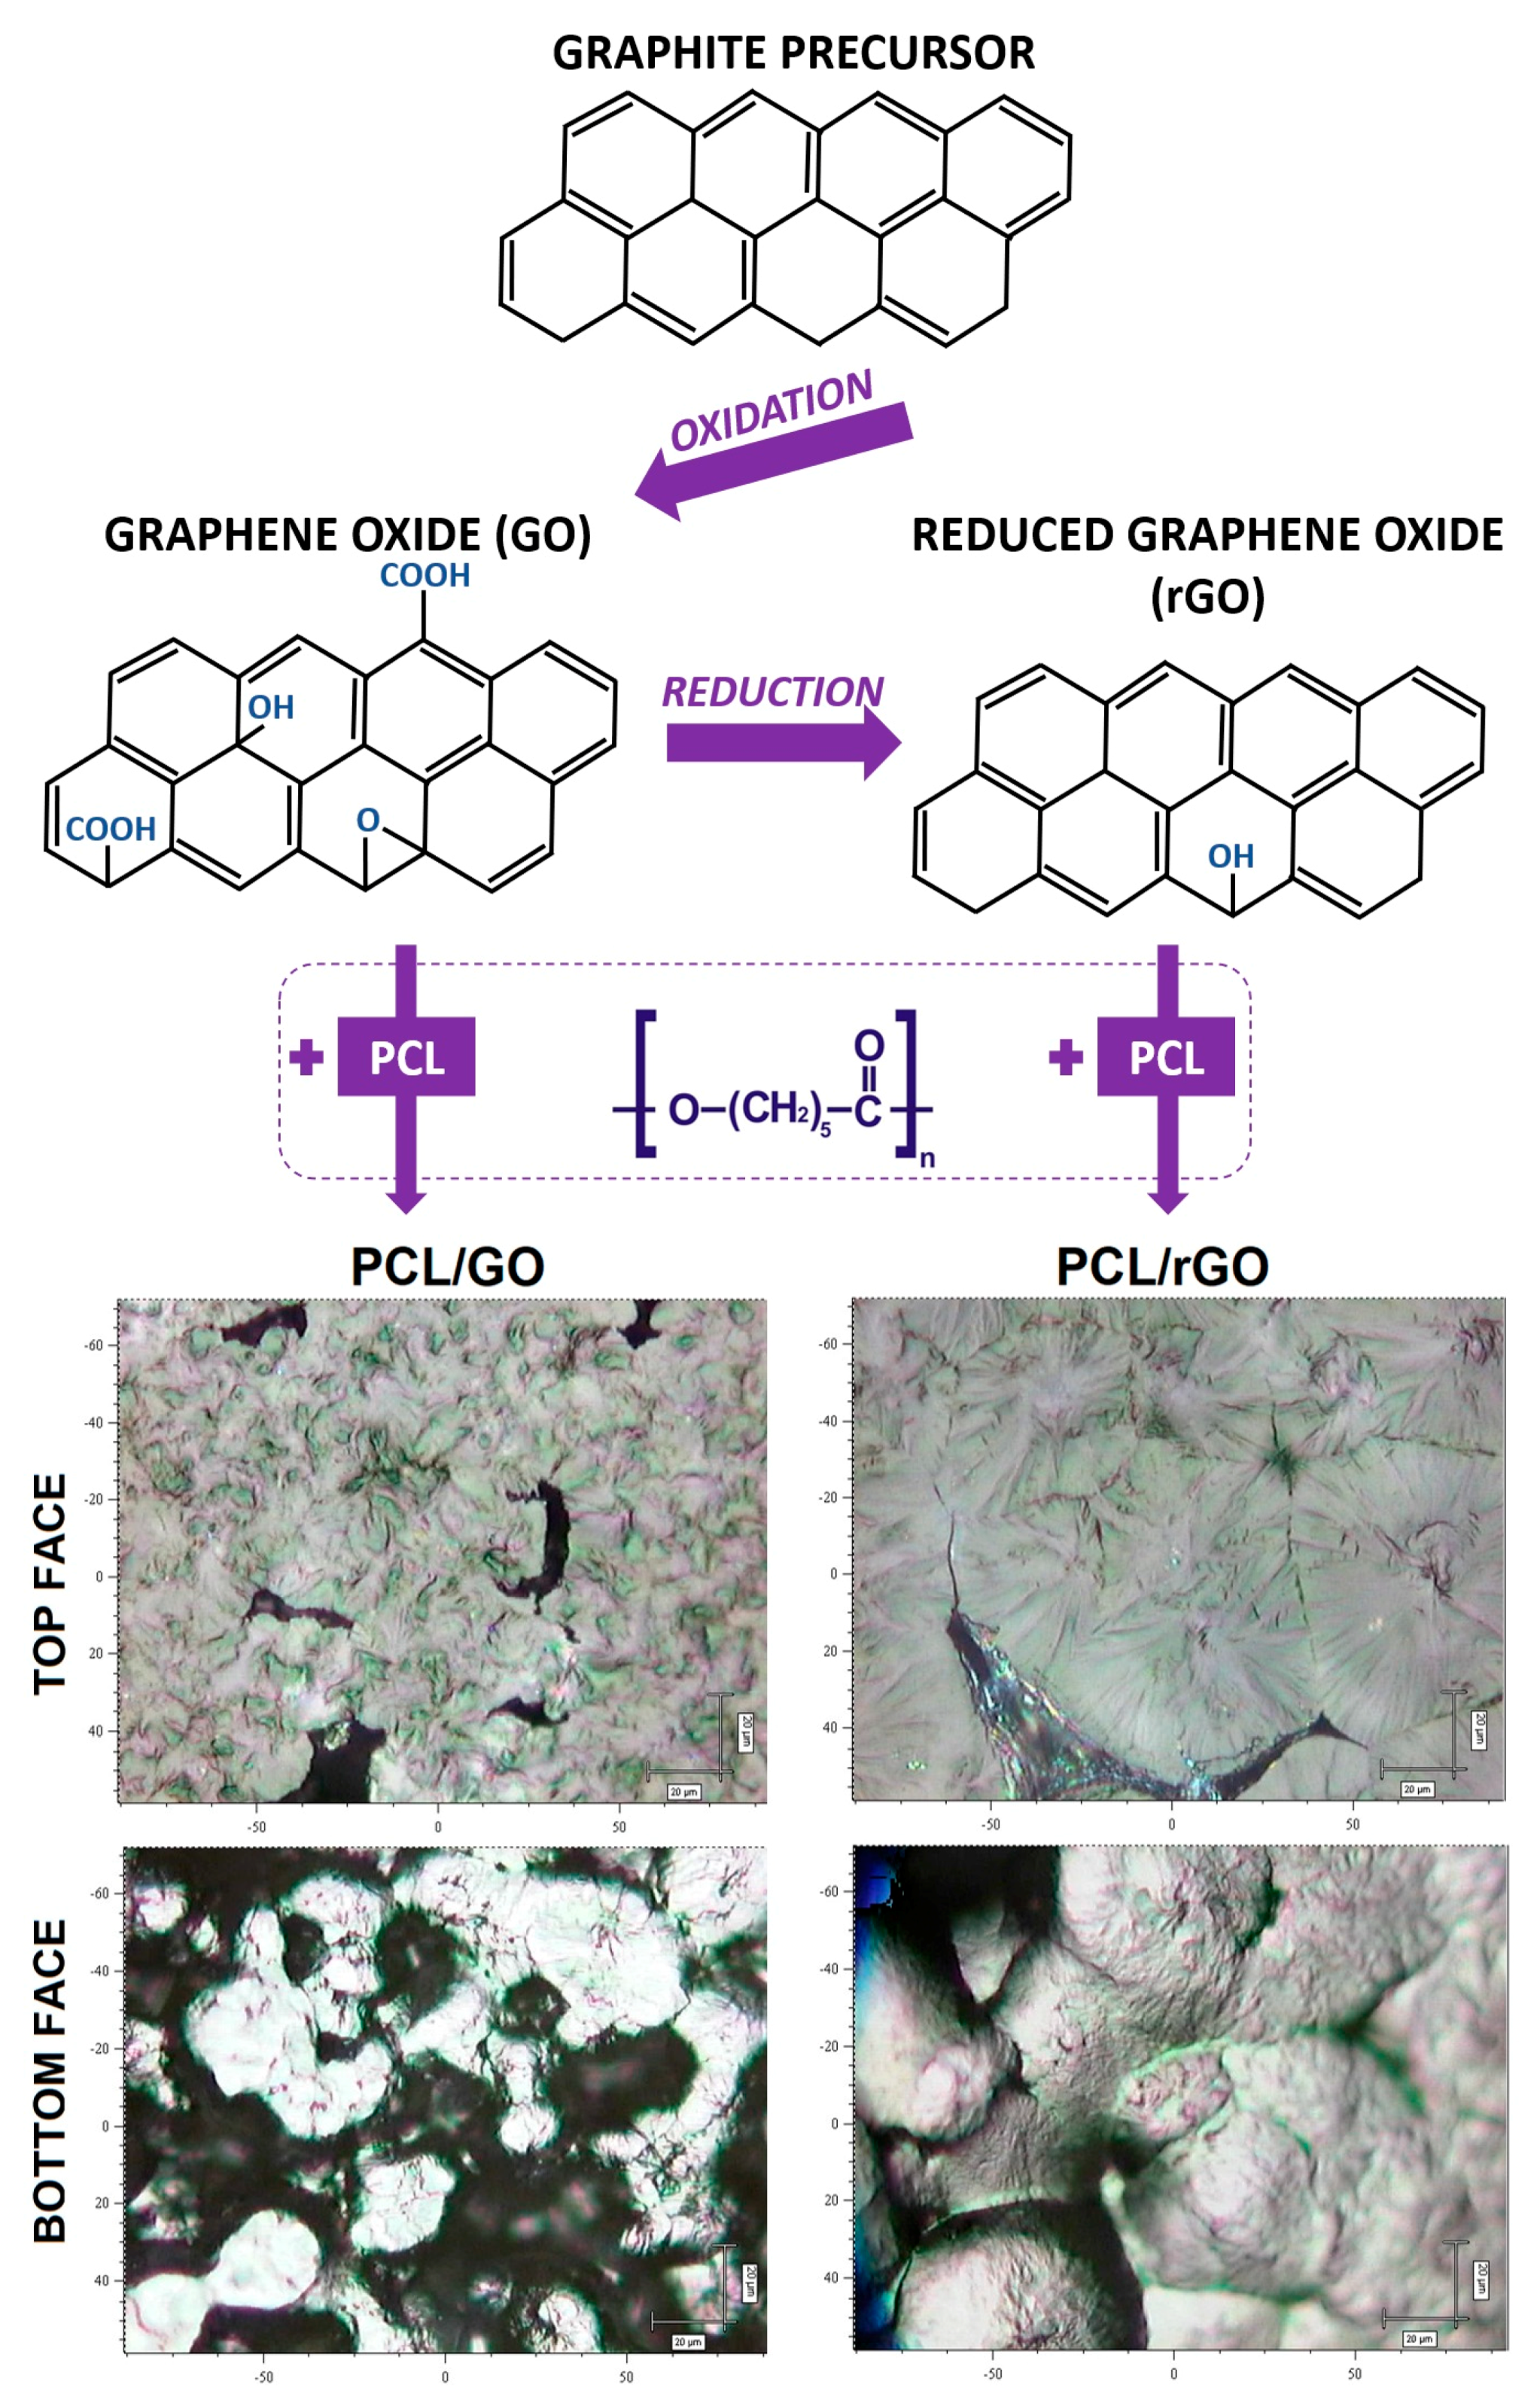
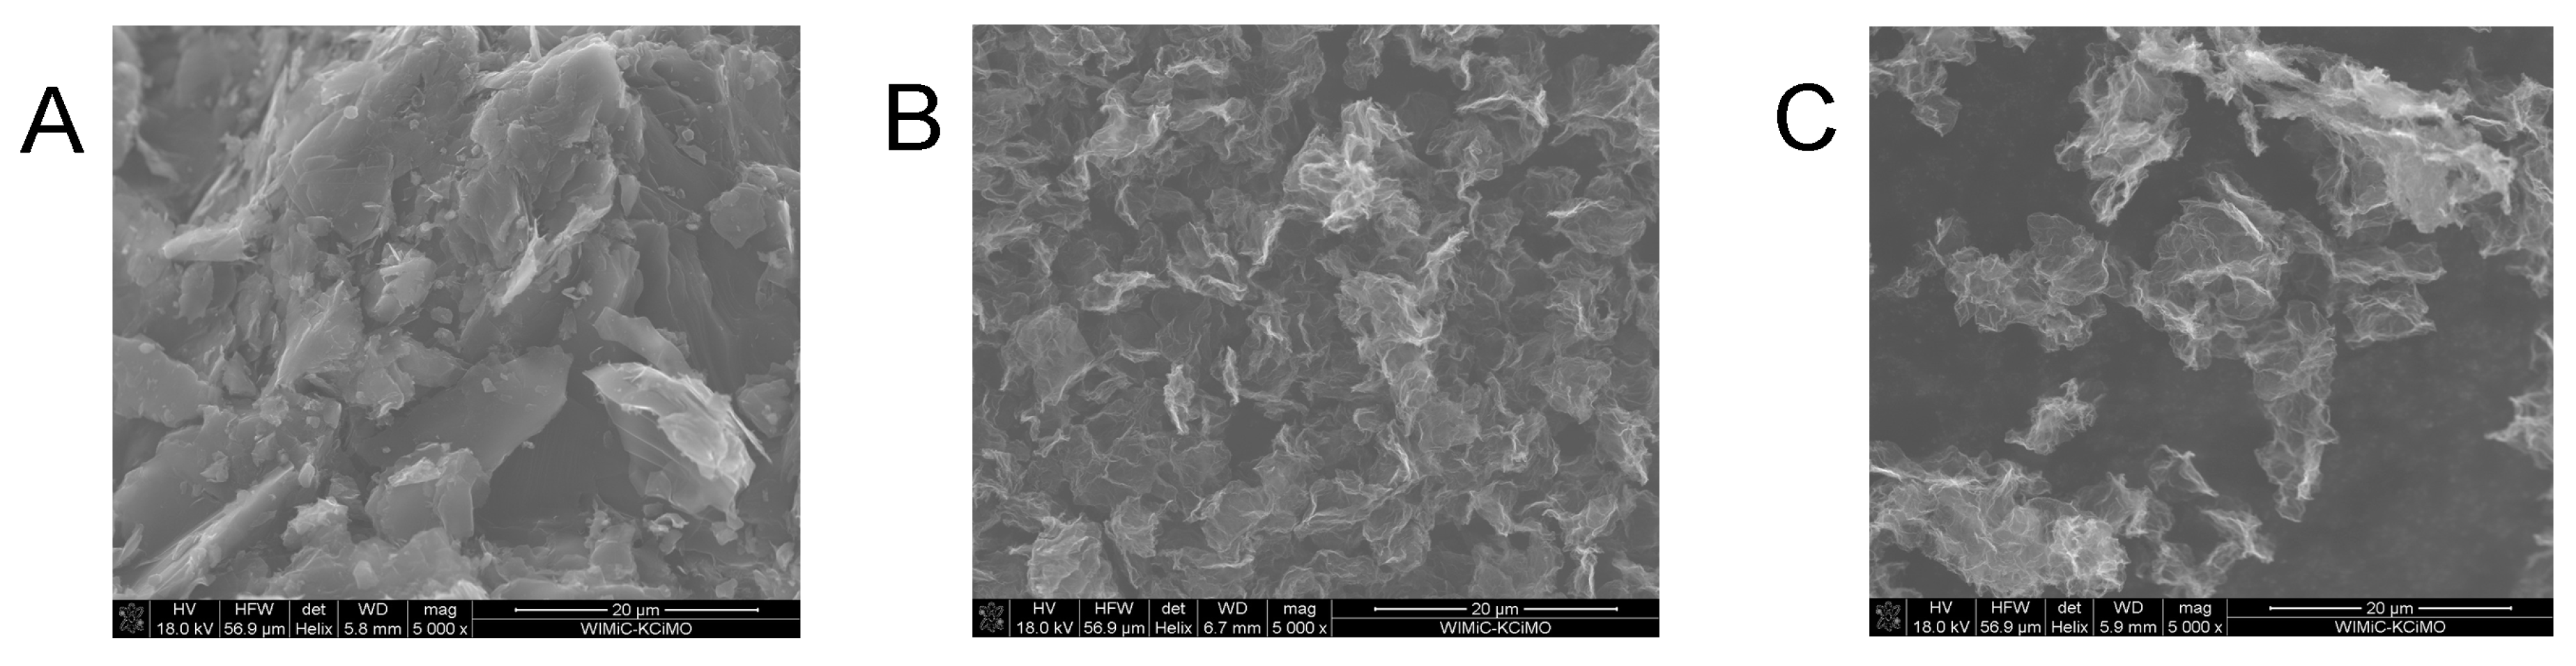
2.1. The Graphene Oxide and Reduced Graphene Oxide Preparation

The GO samples were obtained from a graphite precursor (the average grain size was 16 μm) by its oxidation according to a modified Hummers method, whereas the rGO samples were prepared by their chemical reduction to obtain the reduced structure of GO [20,21,22]. For the manufacture of GO we used a mixture of sulfuric acid (VI), sodium nitrate (V) and potassium permanganate. The thermal method of reducing GO was used, involving heating the sample at 180 C for 10 h. As a result of this process, oxygen functional groups were removed from the surface of GO grains, and at the same time the structure of graphene with sp2 hybridization was restored. However, as a result of this process there is no complete reduction, and rGO is a material with a structure between GO and pure graphene, as shown in the diagram in Figure 1.

2.2. Preparation of the Nanocomposite Membranes

The 10 wt% solution of the PCL (poly(ε-caprolactone) (Mn 45 000) from Sigma Aldrich, Poland) in dichloromethane (DCM) was stirred overnight at RT. The GO/rGO were dispersed in DCM. To obtain a uniform dispersion of the graphene materials, the ultrasonic bath (10 min; L&R Manufacturing Co., Kearny, NJ, USA) and the sonification process (3 min; 30% amplitude; BANDELIN electronic GmbH & Co. KG, Berlin, Germany) were used. Suspension was immediately mixed with the PCL solution and sonicated again (the same conditions as above). The mixtures of GO/rGO in the PCL were then poured onto a Petri dish. The time of PCL crystallization was about 24 h and due to different conditions of evaporating, the top and bottom membranes’ surfaces differ. The amount of nanoaddition was the same for both types of nanocomposites and equal to 0.5 wt%. The obtained polymer nanocomposite membranes were denoted as PCL/GO and PCL/rGO. The raw PCL membrane was manufactured with the same method and denoted as reference a PCL membrane. The obtained materials are presented in Figure 1.

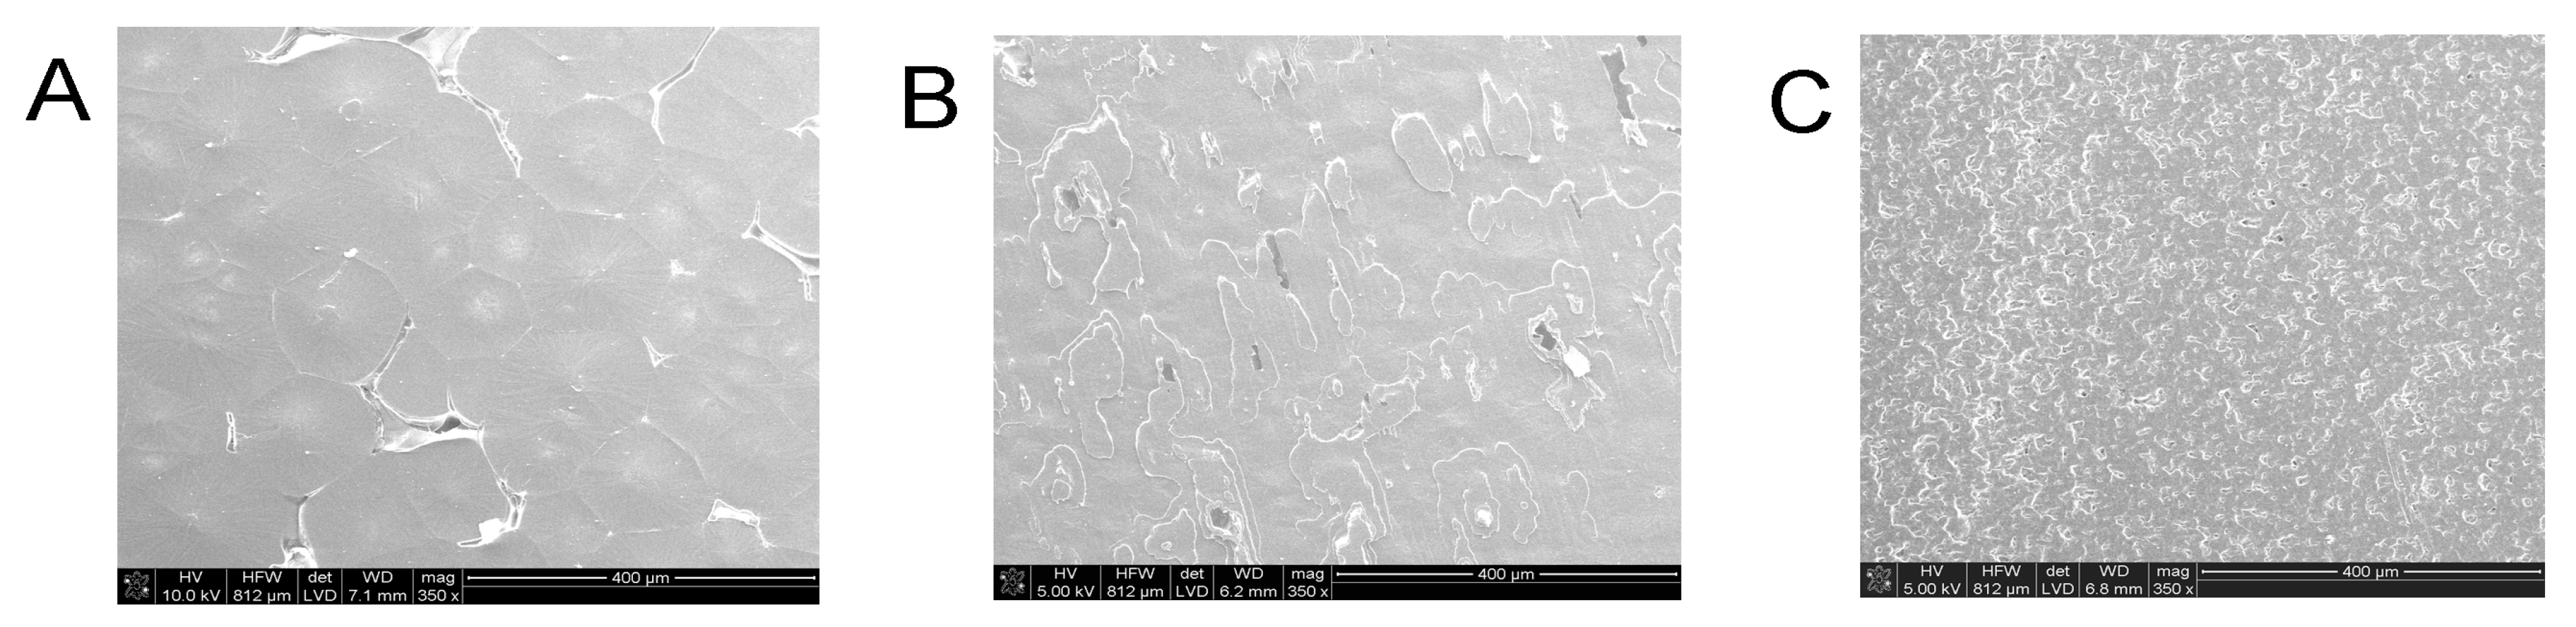
2.3. Scanning Electron Microscopy

Scanning electron microscopy (SEM) images were taken using a Nova NanoSEM 200 microscope (FEI, Eindhoven, Netherlands). The morphology of additives and microstructural observation of polymer composites were performed in low vacuum conditions, using the secondary electron detectors (LVD and Helix) and the accelerated voltage of 5–18 kV.

2.4. Contact Angle Measurements

The contact angle measurements were conducted on a SAM10Mk1 (KRÜS, Hamburg, Germany) goniometer using deionized water and methylene iodide. The top and bottom surfaces of the membranes were tested.

2.5. X-ray Diffraction Analysis

The X-ray powder diffraction data for the reference PCL membrane and PCL/GO and PCL/rGO nanomaterials in the form of membranes were collected on the Philips diffractometer type X’Pert Pro in the Bragg-Brentano geometry. CuKα radiation (λ = 0.154184 nm wavelength) diffracted by sample was selected by a graphite monochromator. The scanning voltage of the X-ray tube was 40 kV, the current was 30 mA. The exposure time was 3 s and the measured angle, 2θ, was from 5 o to 45 deg. The scanning step was 0.02 deg.

2.6. Surface Roughness

Roughness of the surface samples was determined by the surface profilometry technique (Hommel Tester, T1500, Jenoptik, Jena, Germany). The surface roughness parameter Ra, i.e., an average deviation of the linear profile was determined from five line measurements made on the surface of the samples.

2.7. Raman Micro-Spectroscopy

Raman spectroscopic measurements were taken by the Renishaw inVia spectrometer (Renishaw, Gloucestershire, United Kingdom) equipped with a Leica microscope. The spectra were obtained from ten different spatial positions of each material and then an average spectrum for both the upper and lower surfaces of the membranes was obtained and used for calculation. A laser line of 785 nm was focused through a 50× magnification objective. A diffraction grating with 1200 grooves/mm was used. The spectral range of 2000–500 cm−1 was selected and the power of the laser was kept at the same level for all of the probes (adequately low to prevent the samples’ destruction or disturbances). Renishaw, WiRE v. 2.0 and v. 3.4 software (Renishaw, Gloucestershire, United Kingdom) has been used to develop the spectra.
The spectral curve fitting method was applied in order to evaluate the crystallinity parameters for the two components of nanomaterial: a poly (ε-caprolactone) matrix and carbon nanoparticles. Therefore, the specific areas of the spectra where the characteristic for these components bands appear, were chosen for analysis. The study of the PCL crystallinity was carried out in three different areas marked in the sample spectrum (Figure 2): 1770–1700 cm−1, 1380–1200 cm−1, and 1150–1000 cm−1. To assess the crystallinity of the graphene materials, the ratio of the integral intensities of the D1 band (approx. 1300 cm−1) to the G band (approx. 1600 cm−1), i.e., (ID1/IG), was calculated.

3. Results and Discussion

3.1. The Morphology of the Samples

Scanning electron microscopy (SEM) measurements were performed to analyze the morphology of the samples studied, i.e., The synthetic graphite, and the graphite-derived graphene phases and composite membranes. Figure 3 depicts the SEM micrographs of the initial graphite grains (Figure 3A), GO and rGO (Figure 3B,C respectively). The morphology of these two graphene particles does not differ significantly. For both samples the folded and wrinkled morphology can be observed. However, in the case of the rGO (Figure 3C) the individual flakes are separated by larger porous areas. These images show graphite-based nanocomponents prior to the deagglomeration process that precedes combining these materials with the polymer matrix described in Section 2.2.
In Figure 4. the microphotographs of the polymer nanocomposites are shown. Due to the fragility of the polymeric matrix the magnification is lower than for the graphene derivates. The reference membrane of the unmodified PCL (Figure 4A) is built of micro-spherulites connected to each other along to the 3D directions. Comparing the influence of the graphene derivates on the structure of polymer, it can be assumed that rGO affects the PCL matrix more significantly than GO, the surface is more wrinkled or is dispersed more efficiently than GO (Figure 4B,C).

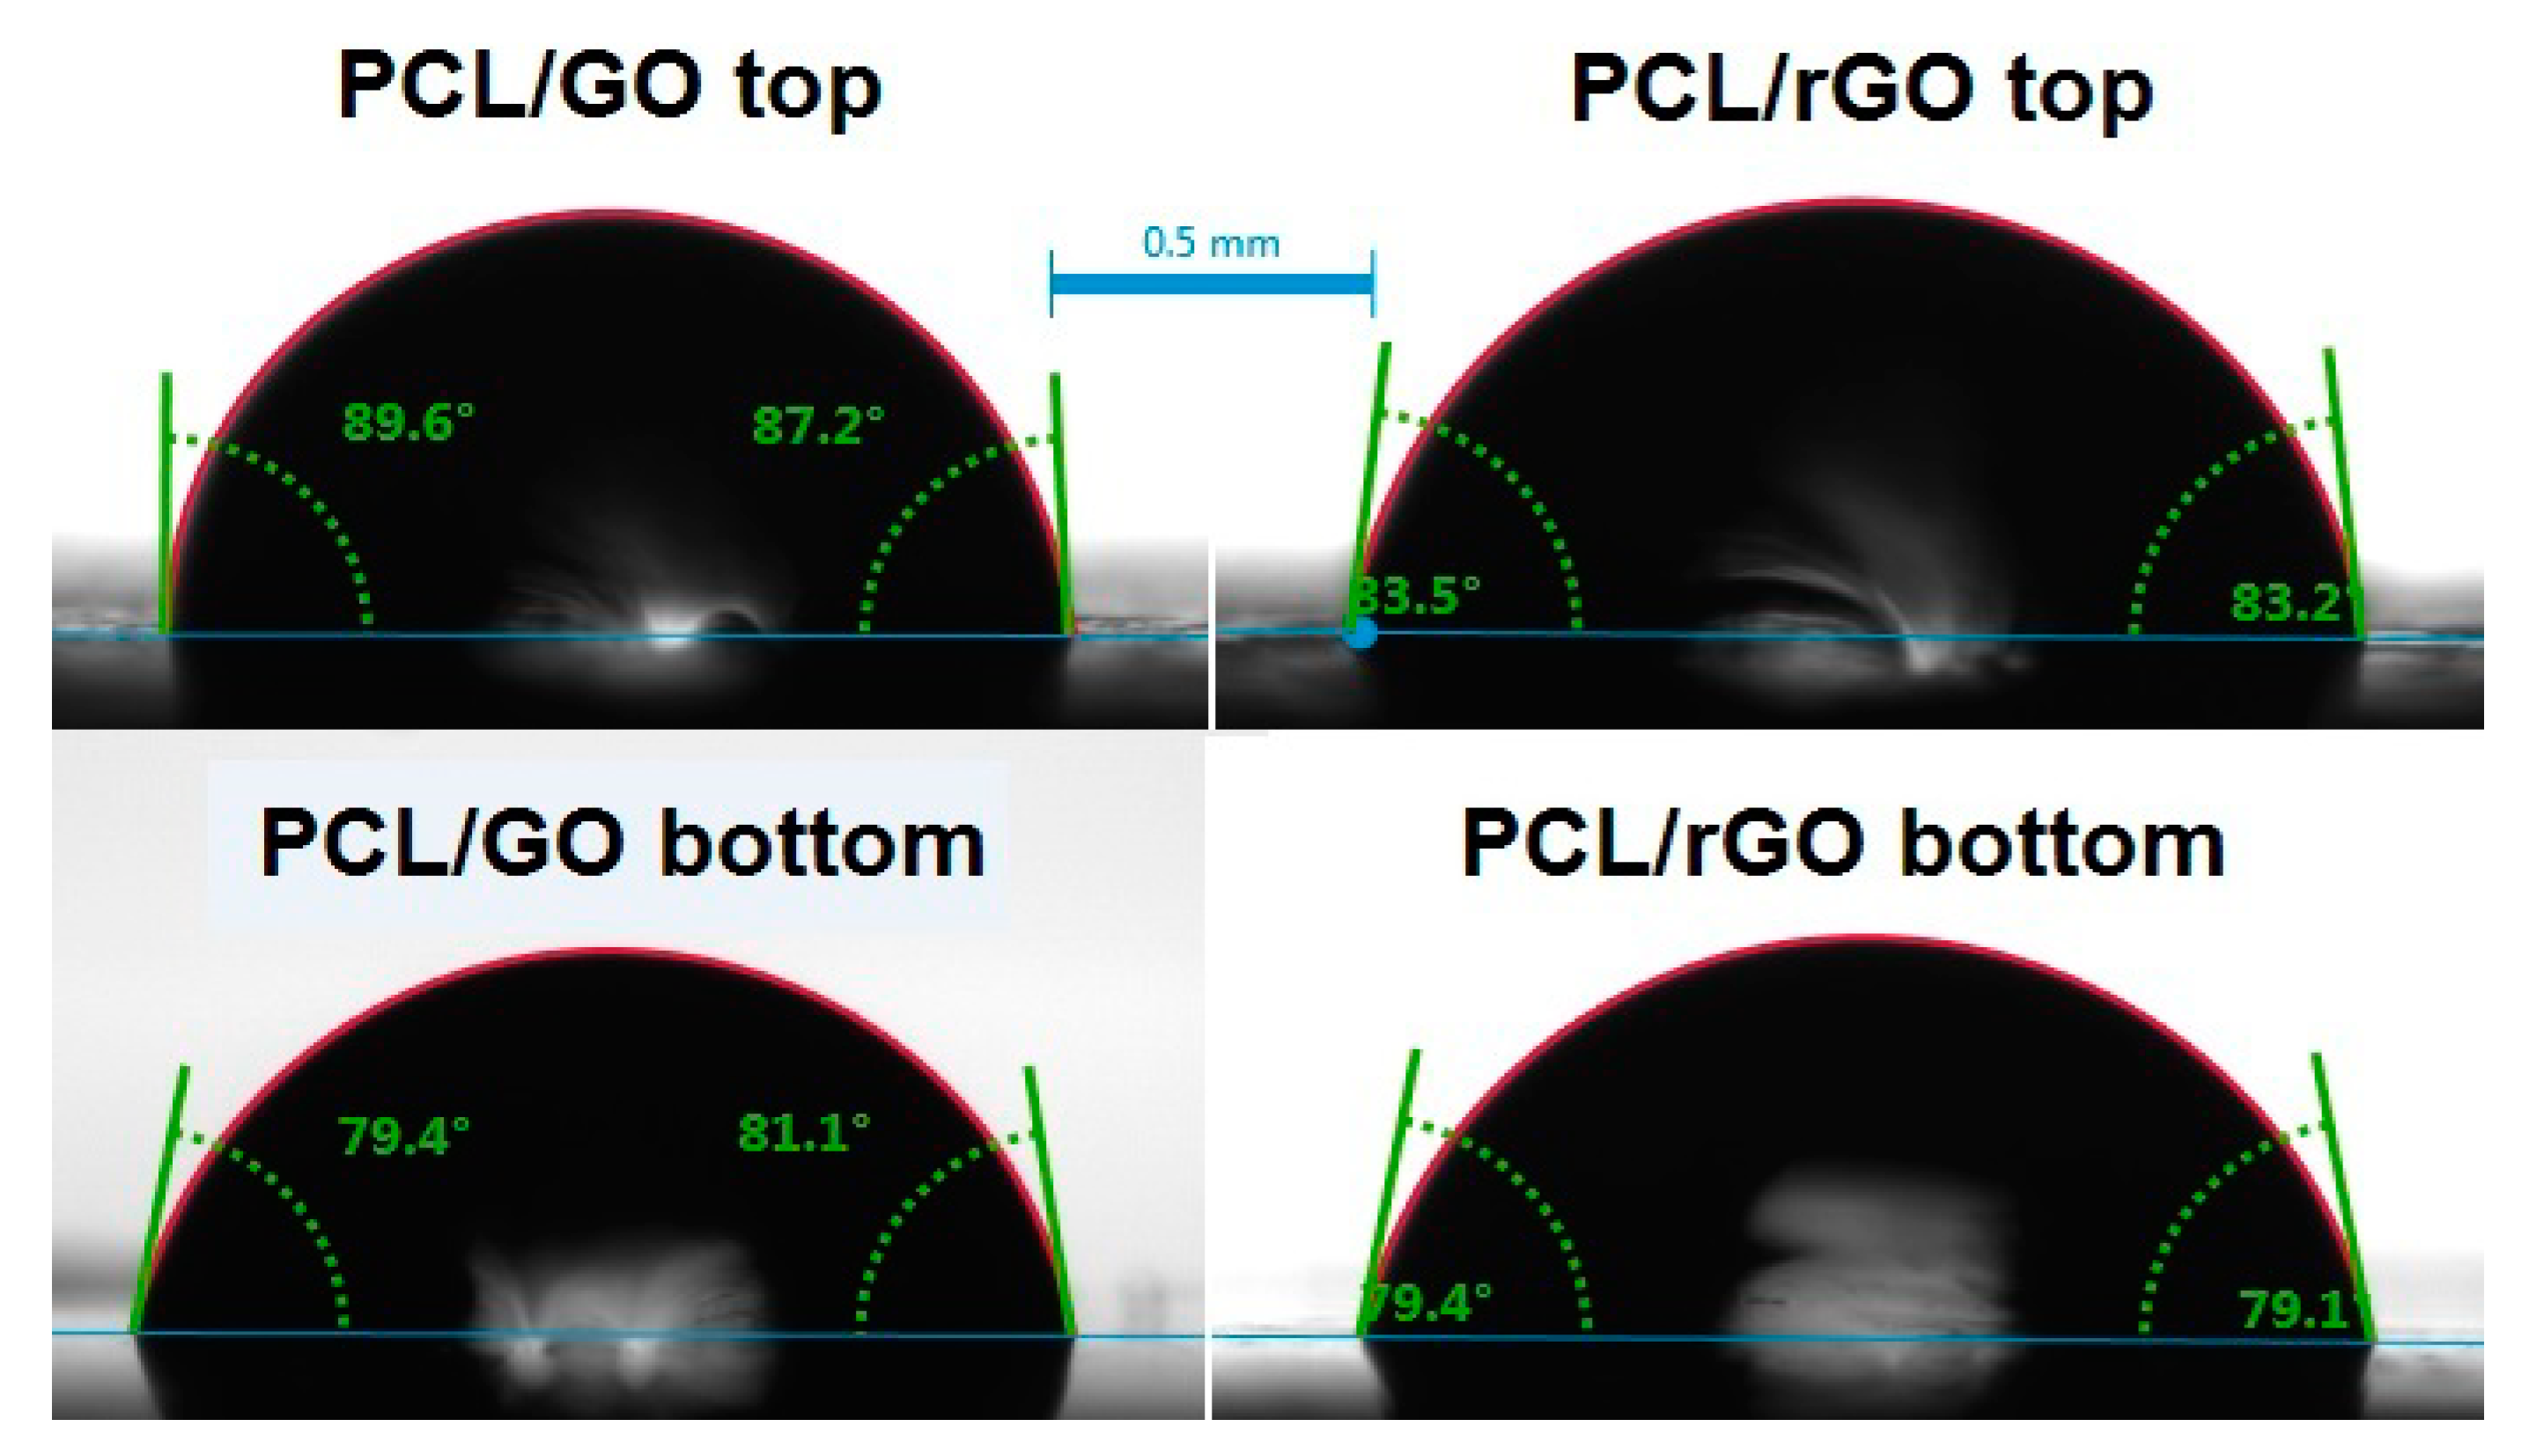
3.2. Contact Angle, Surface Roughness and SFE Measurements

The contact angle measurements that is the standard method for material testing, allow to calculate the level of hydrophobicity and surface free energies. The obtained values are presented in Table 1. The hydrophobicity of the top surface of PCL/GO is higher than the reference PCL, however this difference is within the standard deviation range. When it comes to top face of the PCL/rGO membrane, the hydrophobicity went down compare to the unmodified PCL. Generally, the hydrophobicity is lower for the bottom surface of the composites than the upper ones. The surface free energy turned out to go up as the polymeric matrix was modified by the graphene derivates. The depiction of the exemplary water contact angle measurements for nanocomposites is shown in Figure 5. A higher surface free energy of the bottom nanocomposite layer is observed, which indicates a greater density of carbon nanoparticles near the bottom surface. This is confirmed by the results for the PCL reference membrane, for which the SFE top surface is higher than for the lower one, due to the crystallization conditions. The calculated SFE value of PCL/rGO top surface is greater than the PCL/GO, which is consistent with their morphology, Figure 4B,C. Increased surface energy is attributed to increased surface nano-roughness for PCL/rGO [23]. For this membrane, the greater polar component of energy is noteworthy, Table 1. The differences in the Ra values occur mainly between both surfaces of the samples (top, bottom). These differences may be due to the method of preparation the samples. The surface of the sample in contact with the glass surface (Petri dish) has slightly lower roughness.

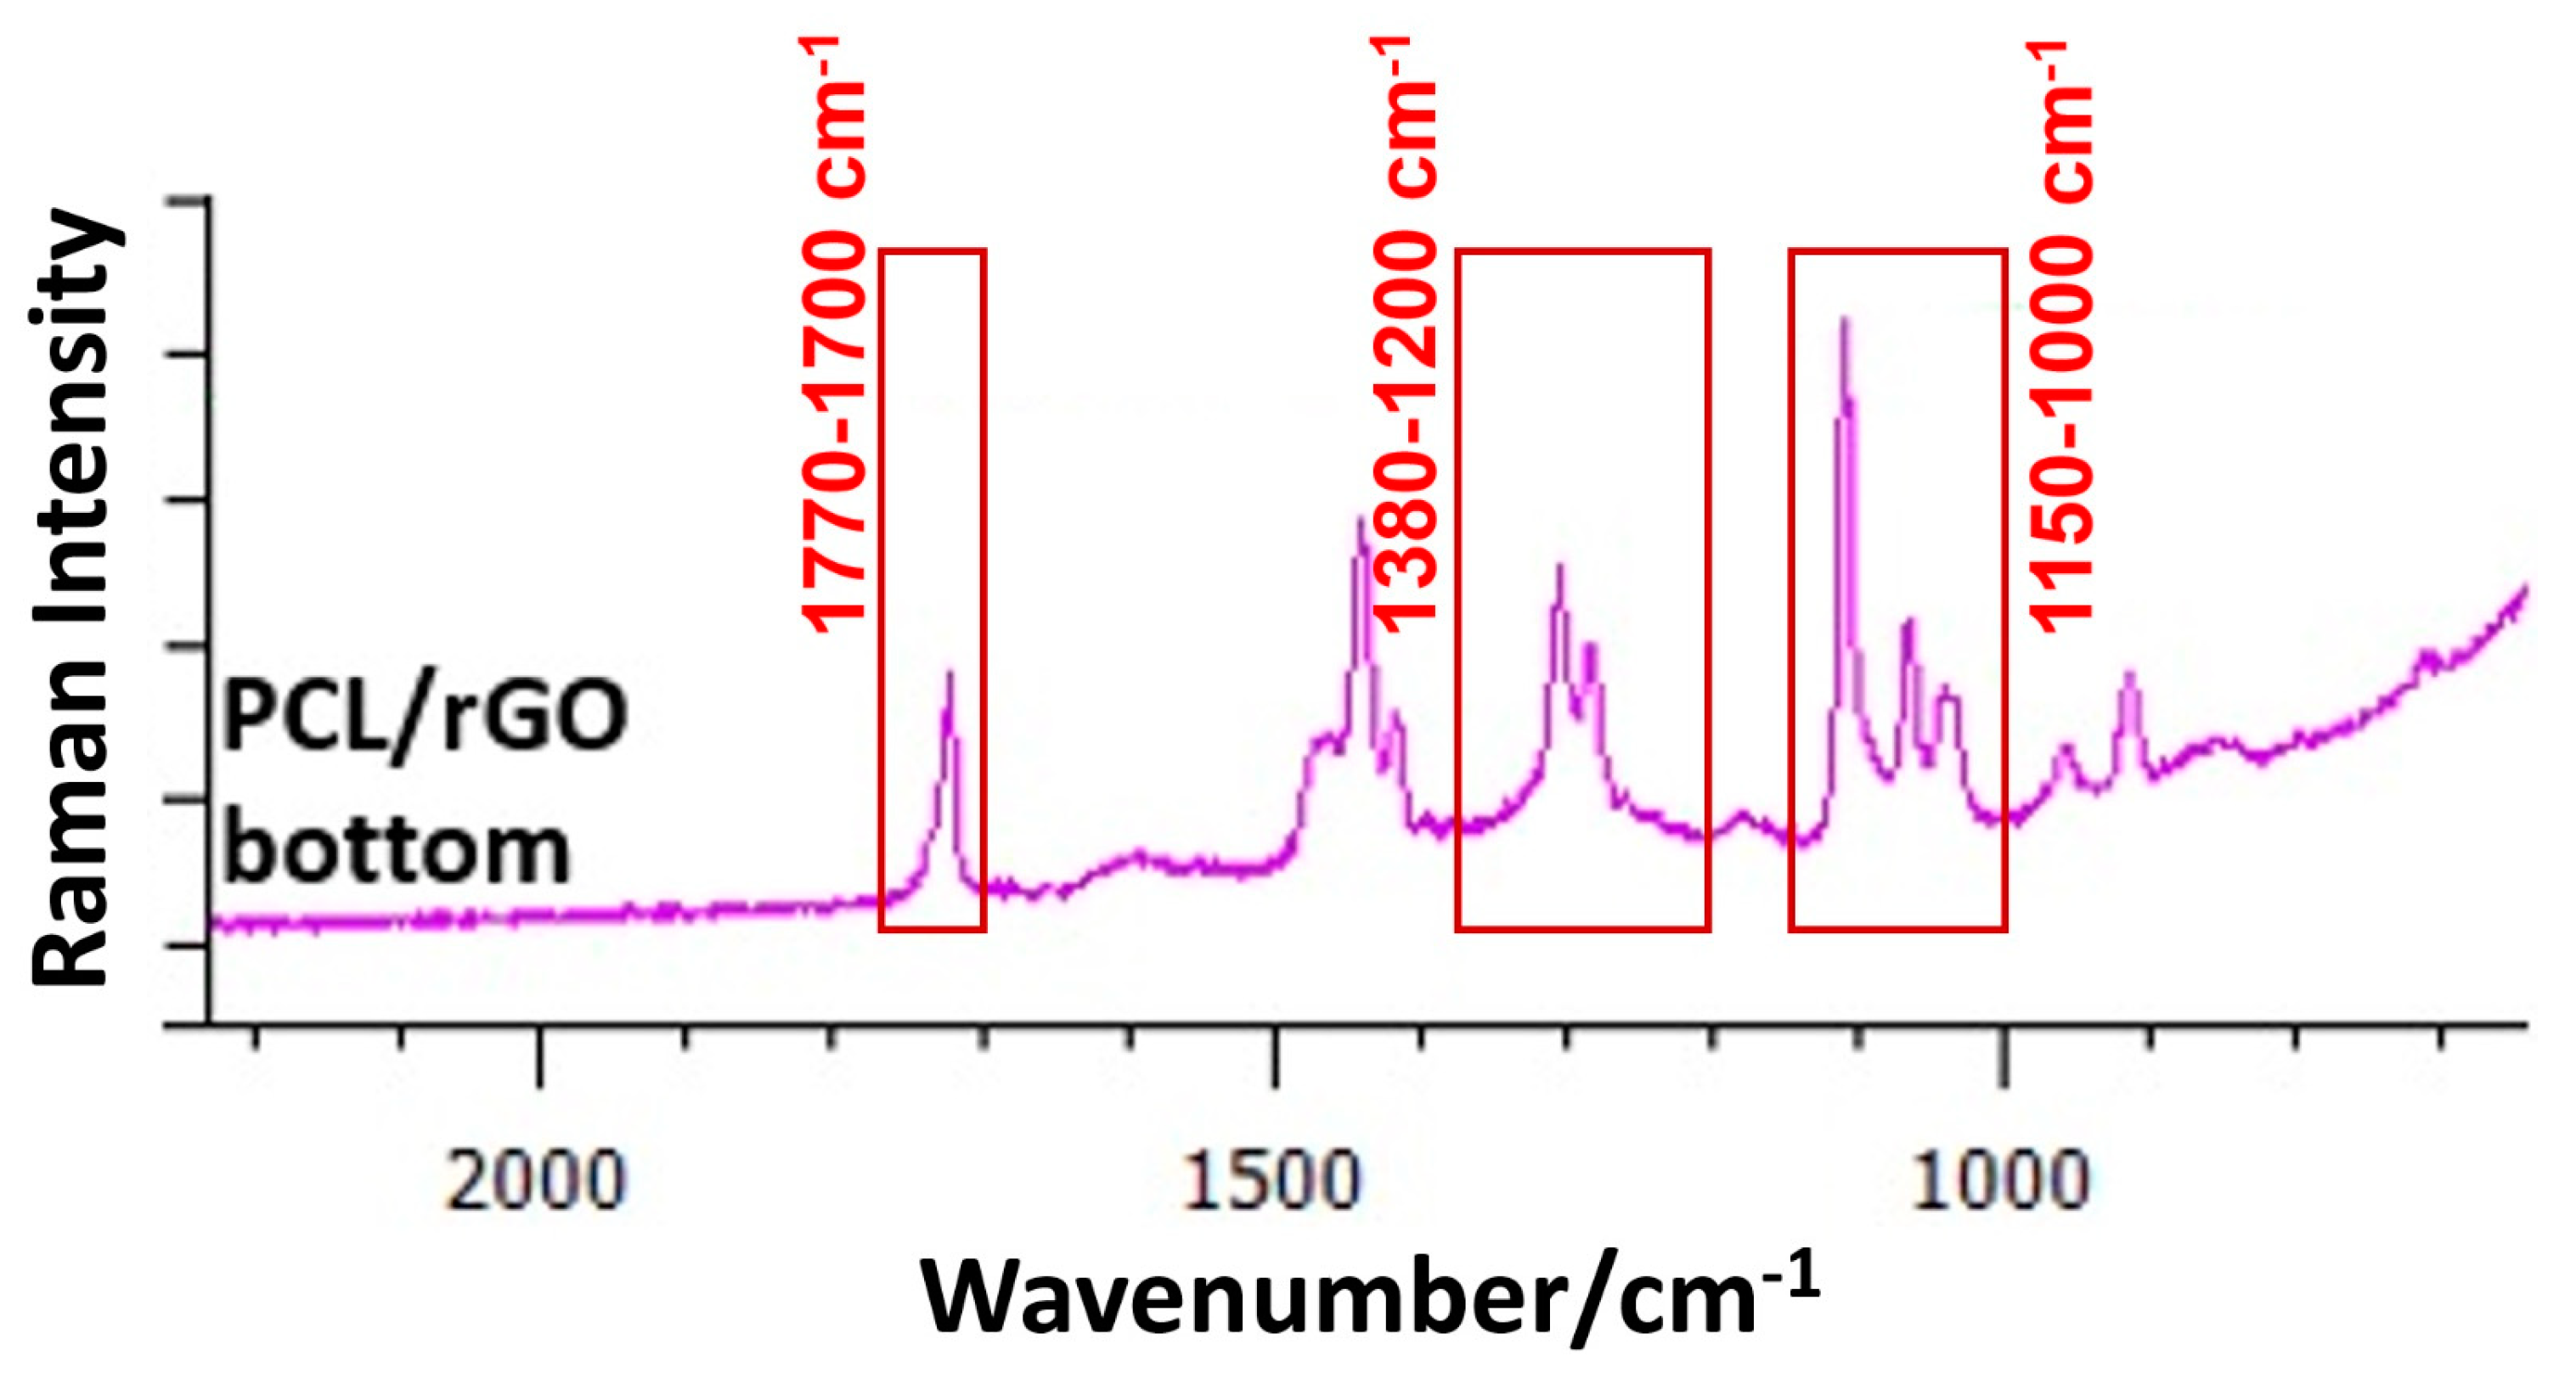
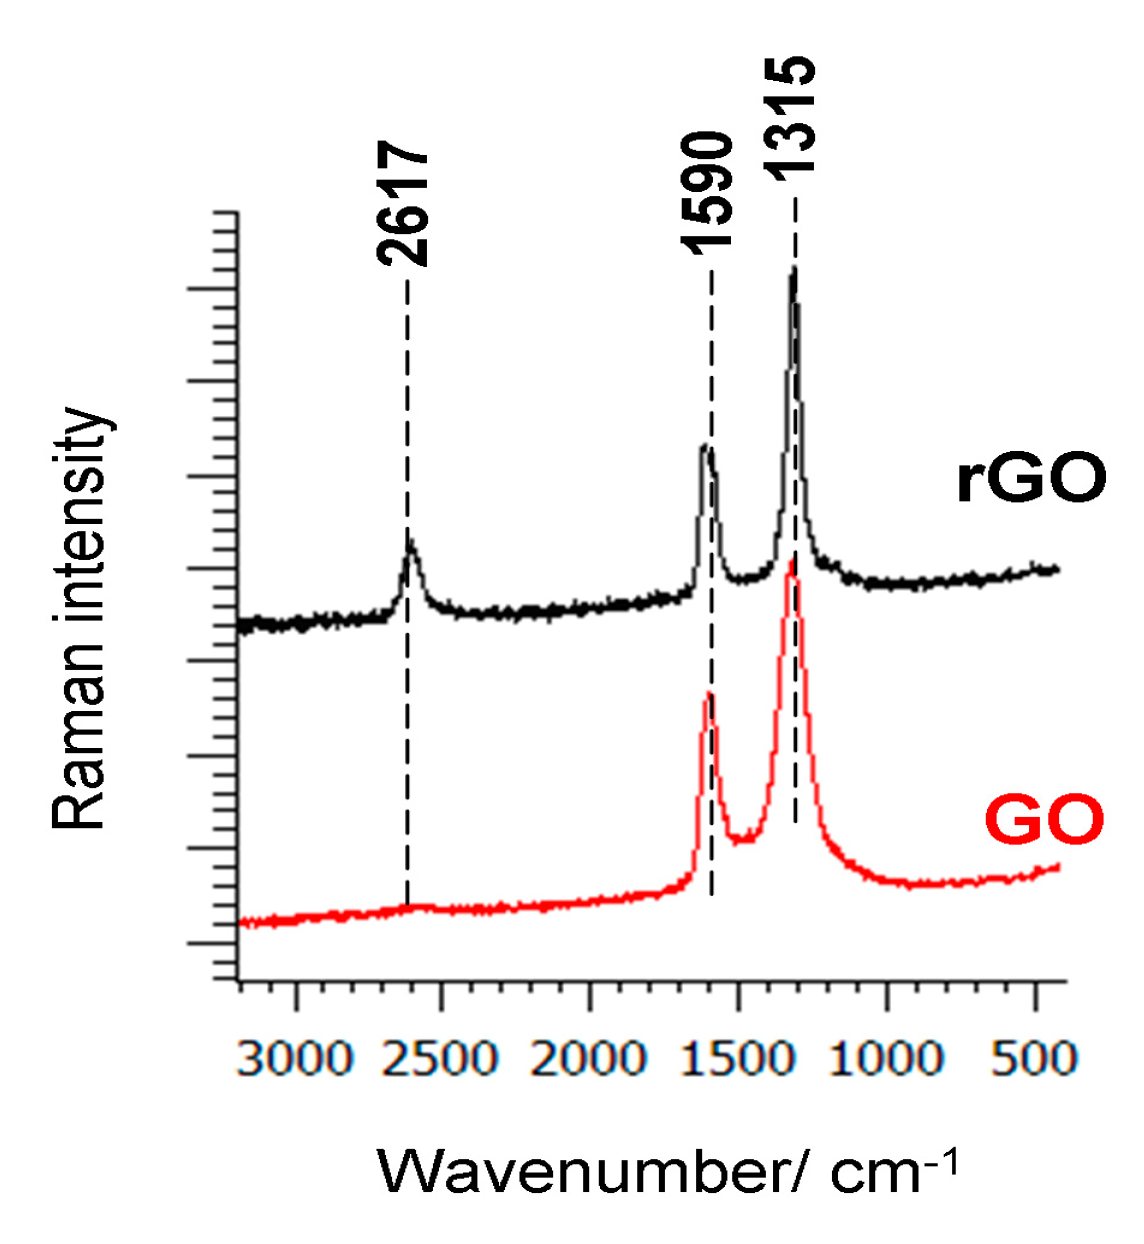
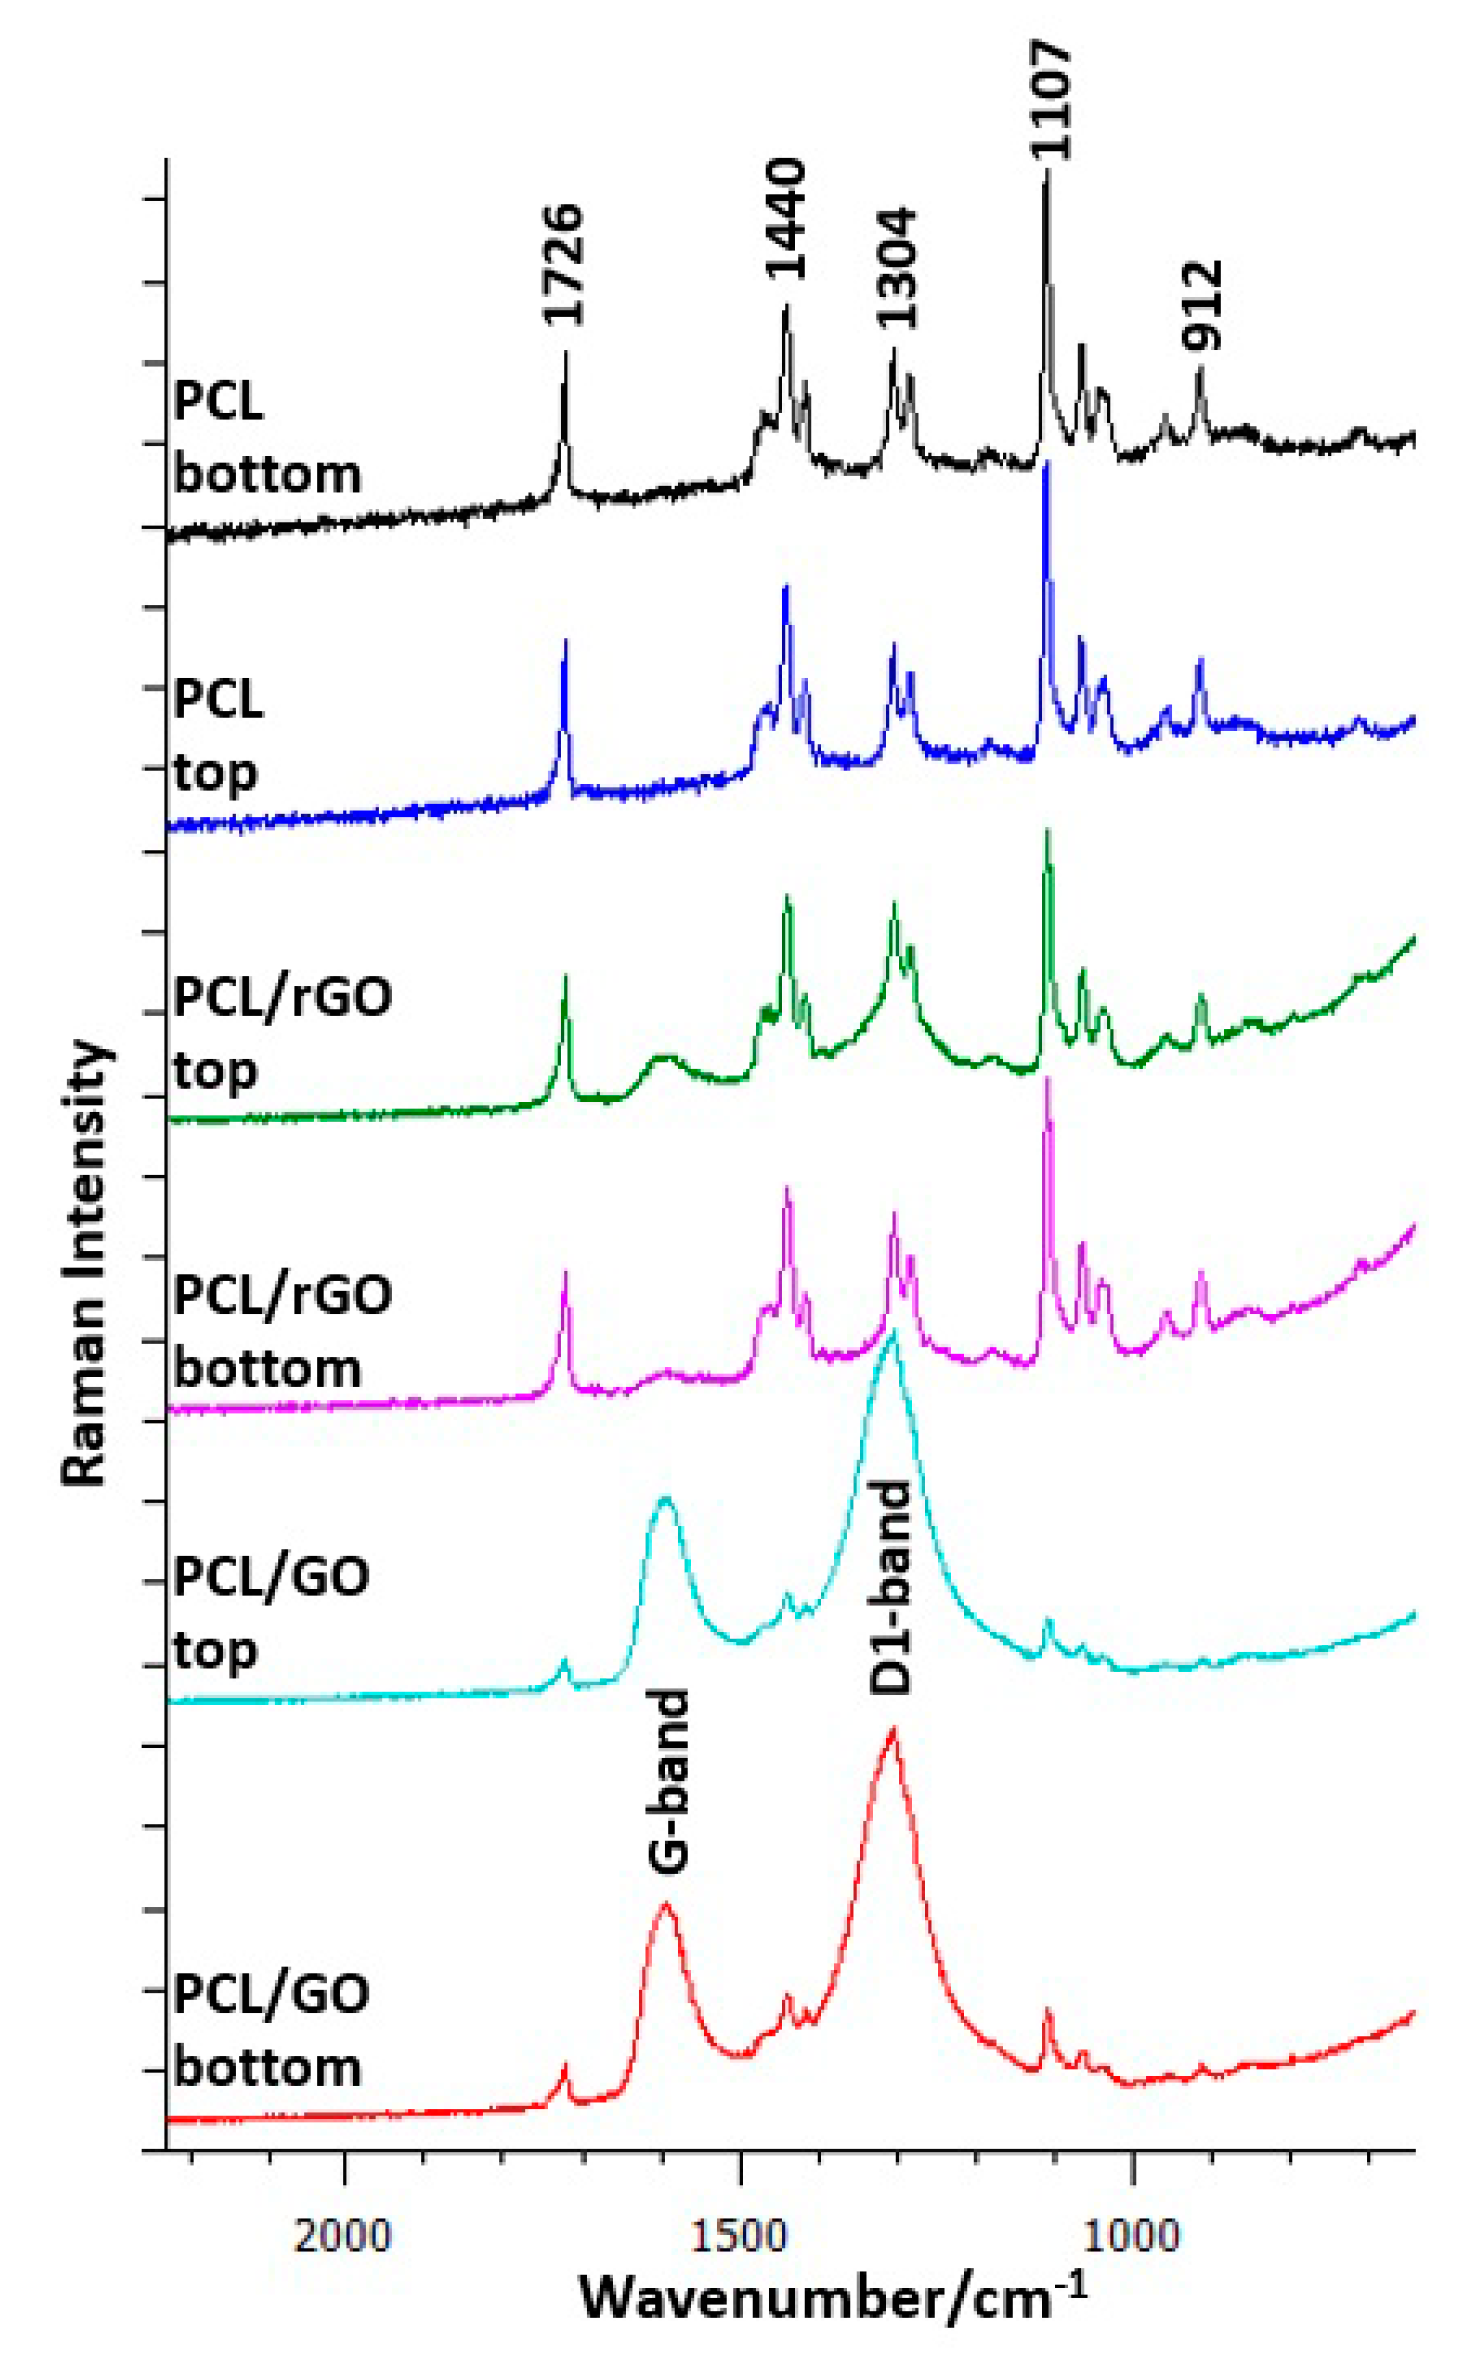
3.3. The Raman Micro-Spectroscopy Analysis

Raman micro-spectroscopy is a method of choice for the analysis of carbon nanomaterials since it is an effective method to characterize the details of short-range ordering. The Raman spectroscopy technique is a standard characterization tool that is widely used and is excellent for distinguishing between the bond type, internal stresses in amorphous and nanocrystalline carbon material and the size of ordered domains [24,25].
The average Raman spectra of the measured nanoparticles: the oxide graphene GO and the reduced oxide graphene rGO are presented in Figure 6. The characteristic G-band appears at around 1590 cm−1 and it is related to the presence of carbon materials. The graphitic G-band is a result of the in-plane vibrations of the sp2 carbon networks and originates as a doubly degenerate phonon mode of E2g symmetry. The second most frequently observed peak is the D1 disorder-induced band at ca. 1315 cm−1 originating from the out-of-plane vibrations caused by the presence of structural defects, curved graphite sheets and lattice distortions in the carbon structures, and is absent with highly crystalline graphitic materials. The half-width of this band is two times smaller for rGO than for GO. Additionally the appearance of the 2D secondary band for rGO at wavenumber 26,917 cm−1 may indicate that carbon nanosheets preserve the relatively isolated graphene structure [26]. The graphene used for this study comes from the standard production. It was decided that our research should be as close as possible to the practical conditions for the production of nanocomposites because the samples used for the production of the material must be available in large quantities but at the same time at reasonable price.
The spectra of the nanocomposites (Figure 7) show all of the typical bands for the poly(ε-caprolactone) and also the characteristic graphitic G- and D1-band can be observed. The presence of carbonous nanoaddition is more significantly apparent in the PCL/GO than in the PCL/rGO (what appears in the broadening and higher intensities of graphitic D- and G-bands of the PCL/GO spectra) although, the amount of graphene derivates was exactly the same in both type of nanocomposites (0.5 wt%). The PCL/GO in comparison to PCL/rGO, seems to exhibit a stronger resonance Raman effect or other quantum effects. Additionally, the specific arrangement of nanoparticles may result from a more efficient dispersion in the polymer due to the presence of oxygen-containing groups that can form bonds with the polymer and therefore, did not deagglomerate during the crystallization process. The position of the bands and their assignment are collected in Table 2.

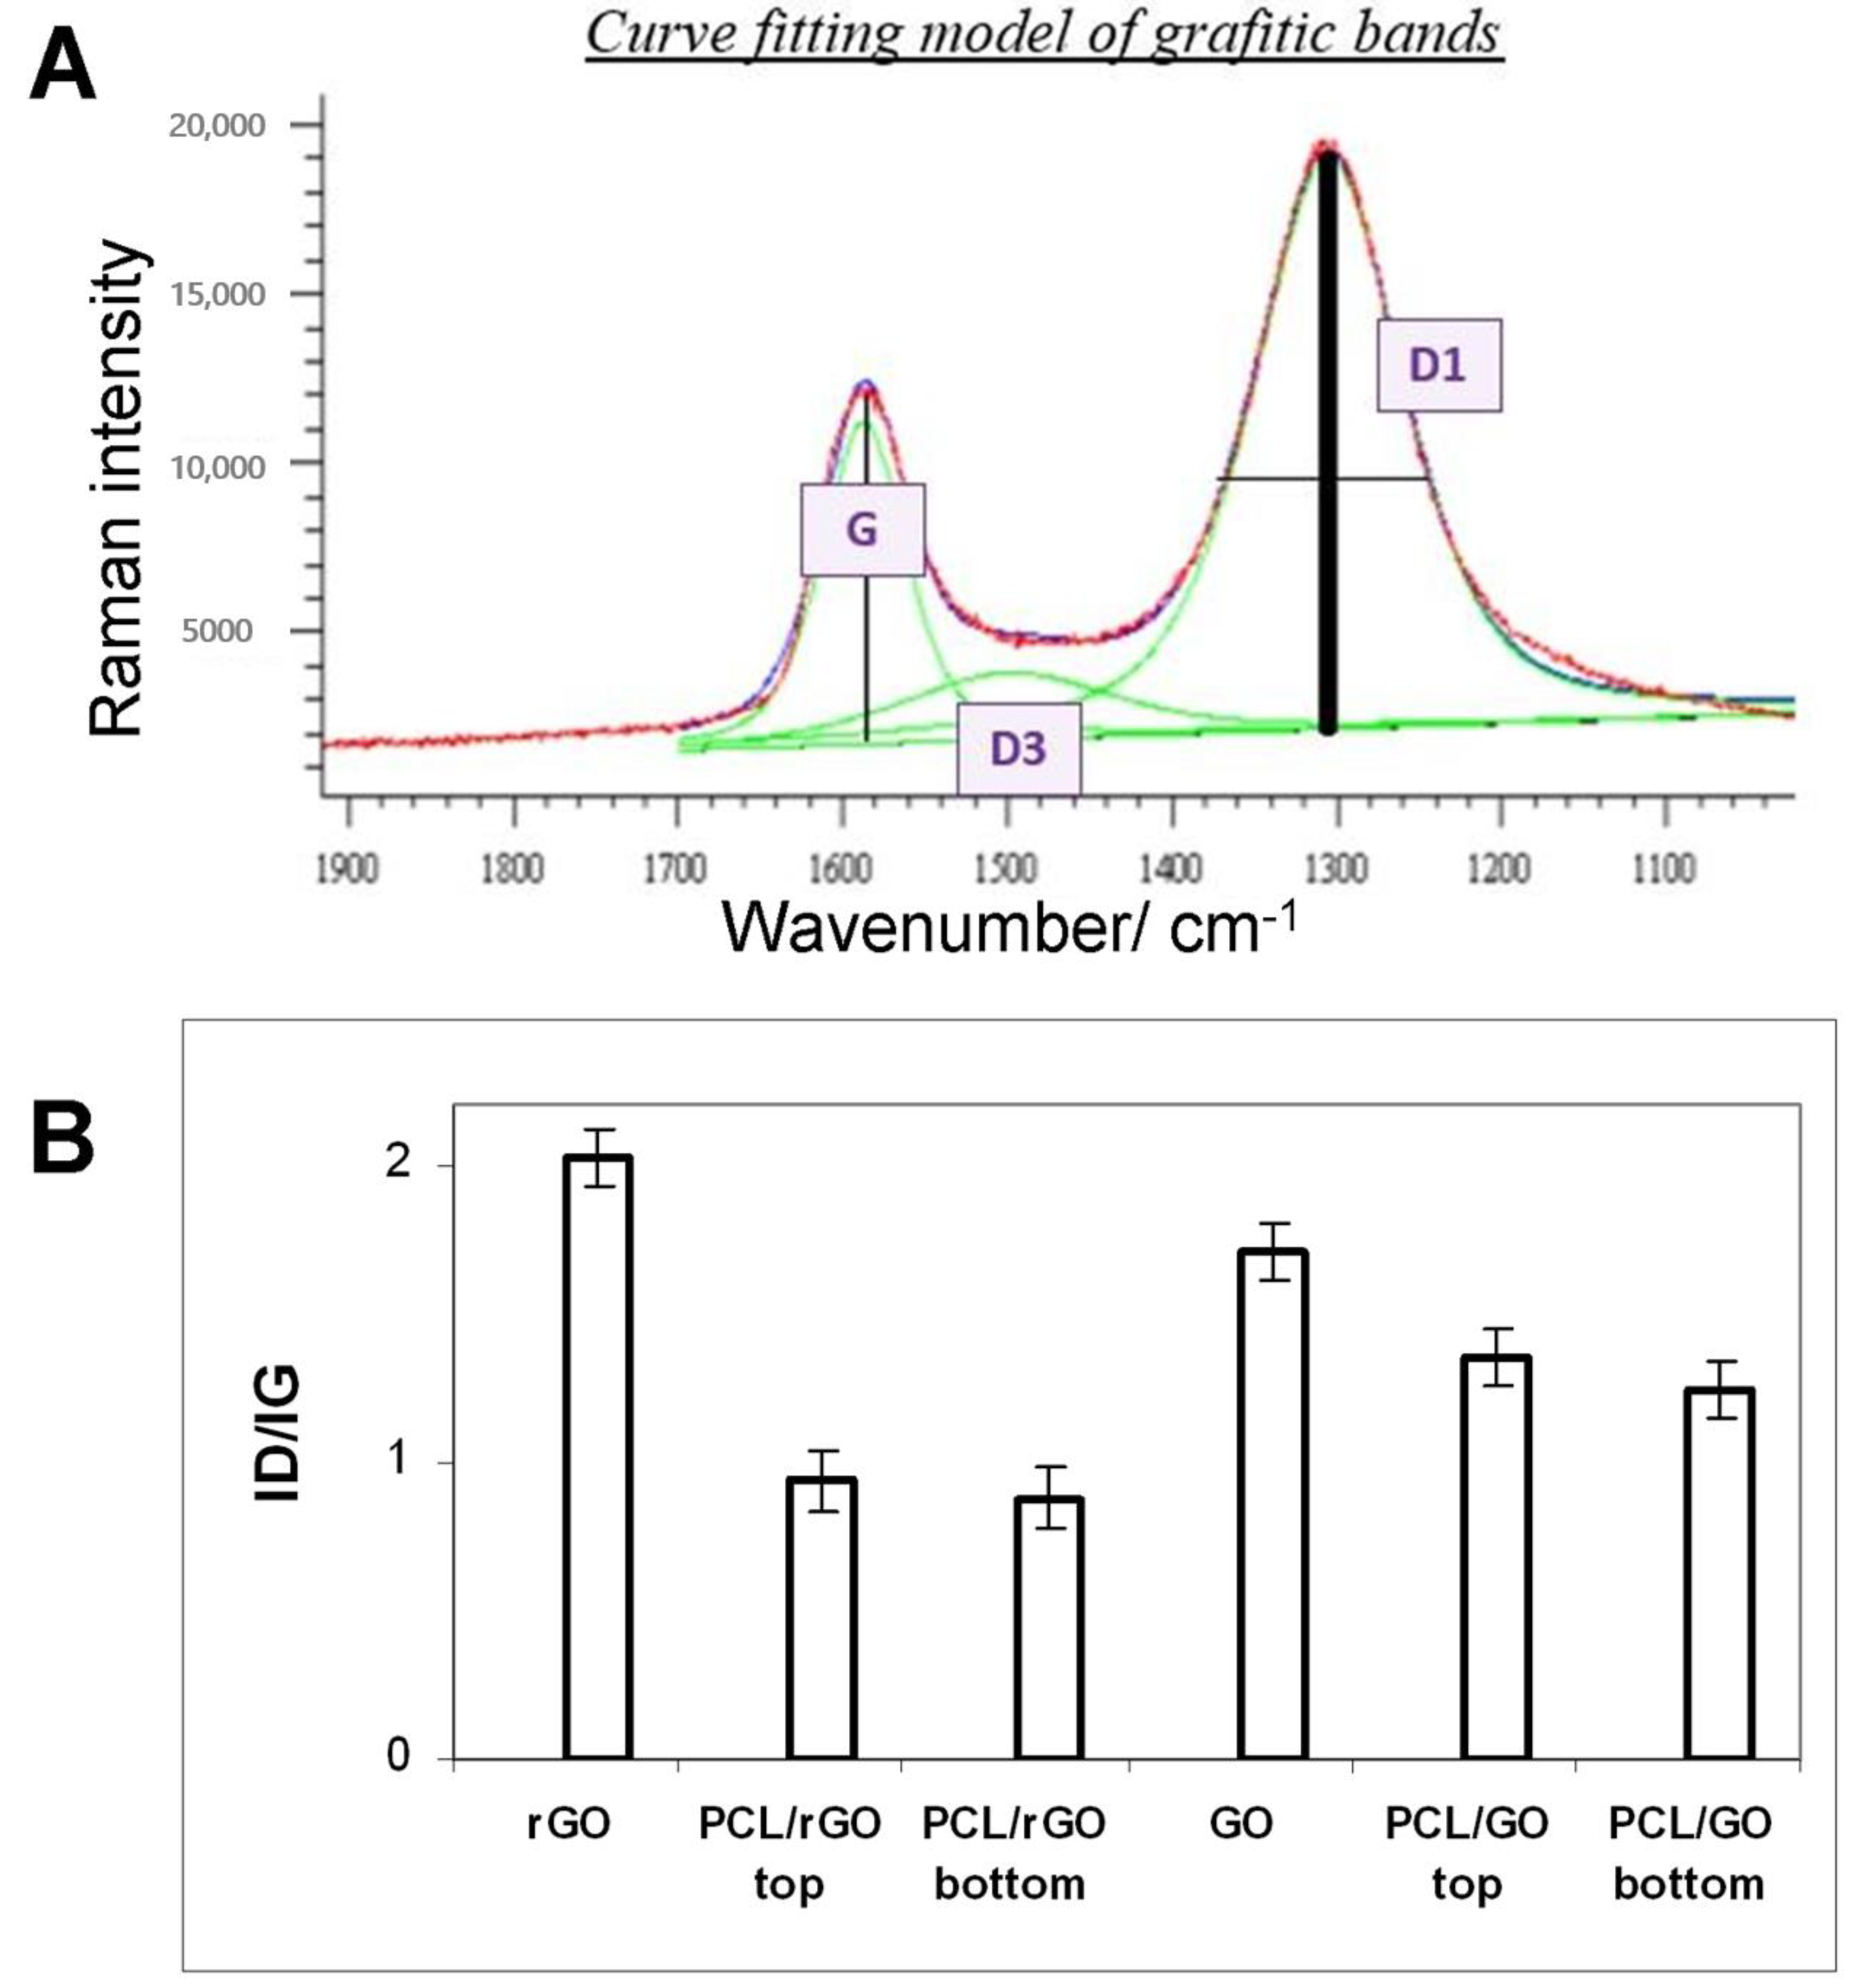
3.4. The Curve Fitting Models and Crystallinity Parameters Assessment

In order to obtain more detailed information on the structure and crystallinity of graphene nanoparticles and changes in these parameters in the nanocomposite membranes, a Raman spectra analysis was performed. The standard procedure of peak fitting was conducted, the mixed Gaussian/Lorenz peaks with linear background subtraction were employed in every spectrum.

3.4.1. The Graphene D/G Intensity Ratio

In order to assess the crystallinity level of the studied materials the ratio of intensities ID1/IG was calculated [30]. The three band model was adopted in the curve fitting procedure (Figure 8A): the mentioned before G-band (ca. 1590 cm−1), the D1-band (ca. 1320 cm−1), and also the graphite D3 band resulting from the defects located outside the plane of the aromatic layers [31,32]. It is believed that the ID1/IG ratio reveals information about the number of defects in the structure of carbon nanomaterials, and thus is a measure of their degree of organization [33].
The ID1/IG intensity ratios are presented in the Figure 8B, where a comparison of the upper and lower surfaces of the membranes is also presented. A higher ID/IG intensity ratio for GO indicates that 2D graphene layer is substantially inhomogenous [34]. Although the level of crystallinity for both the GO and rGO graphene materials is comparable, there are clear alterations in the crystallinity level of the graphene derivatives after their incorporation into the polymeric matrix. For both types of nanofillers the level of crystallinity increases. The material is more structured in the case of PCL/rGO that can be connected with the lower quantity of the oxide-containing groups in the rGO in comparison to the GO. However, it seems that the composites’ evaporation conditions during their manufacturing did not significantly influence the ordering structure in the graphene phases that are incorporated into the polymeric matrix and then in the top surface of the membrane in comparison to the bottom surface since the ratio ID1/IG barely shifted. What is even more remarkable, is that the ID1/IG parameter does not change its value in the rGO against to the GO nanoparticles. Since, the degree of organisation is the same for the GO and the rGO, it can be concluded that the reduction process did not influence the quantity of the defects in the oxide graphene layers.
Due to the inversive proportionality of the ID1/IG ratio to the size of the ordered nanocrystallite in the plane (La), the La parameters for the studied materials were evaluated. Calculations were performed by the employment of Equation (1) [35]. The obtained results are collected in Table 3.
La(nm) = (2.4 × 10⁻¹⁰) × λ4laser × (ID1/IG)−1
The La parameter confirms that the in-plane size of the nano-crystallites almost does not change after reductive treatment of graphene oxide. However, for both graphene derivatives, the rGO and the GO, the size of the nano-crystallites increases as the result of the incorporation of these nanofillers into the polymer matrix. The La value increases for PCL/rGO by about 20 nm compared to PCL/GO. In both of the nanocomposite membranes, the size of the nano-crystallites is slightly larger in the bottom surface. However, it is important to mention that some studies have reported that the proportional relationship between ID1/IG and crystallite size may not be valid in some cases (especially over the 1.1 ID1/IG values) [35,36].

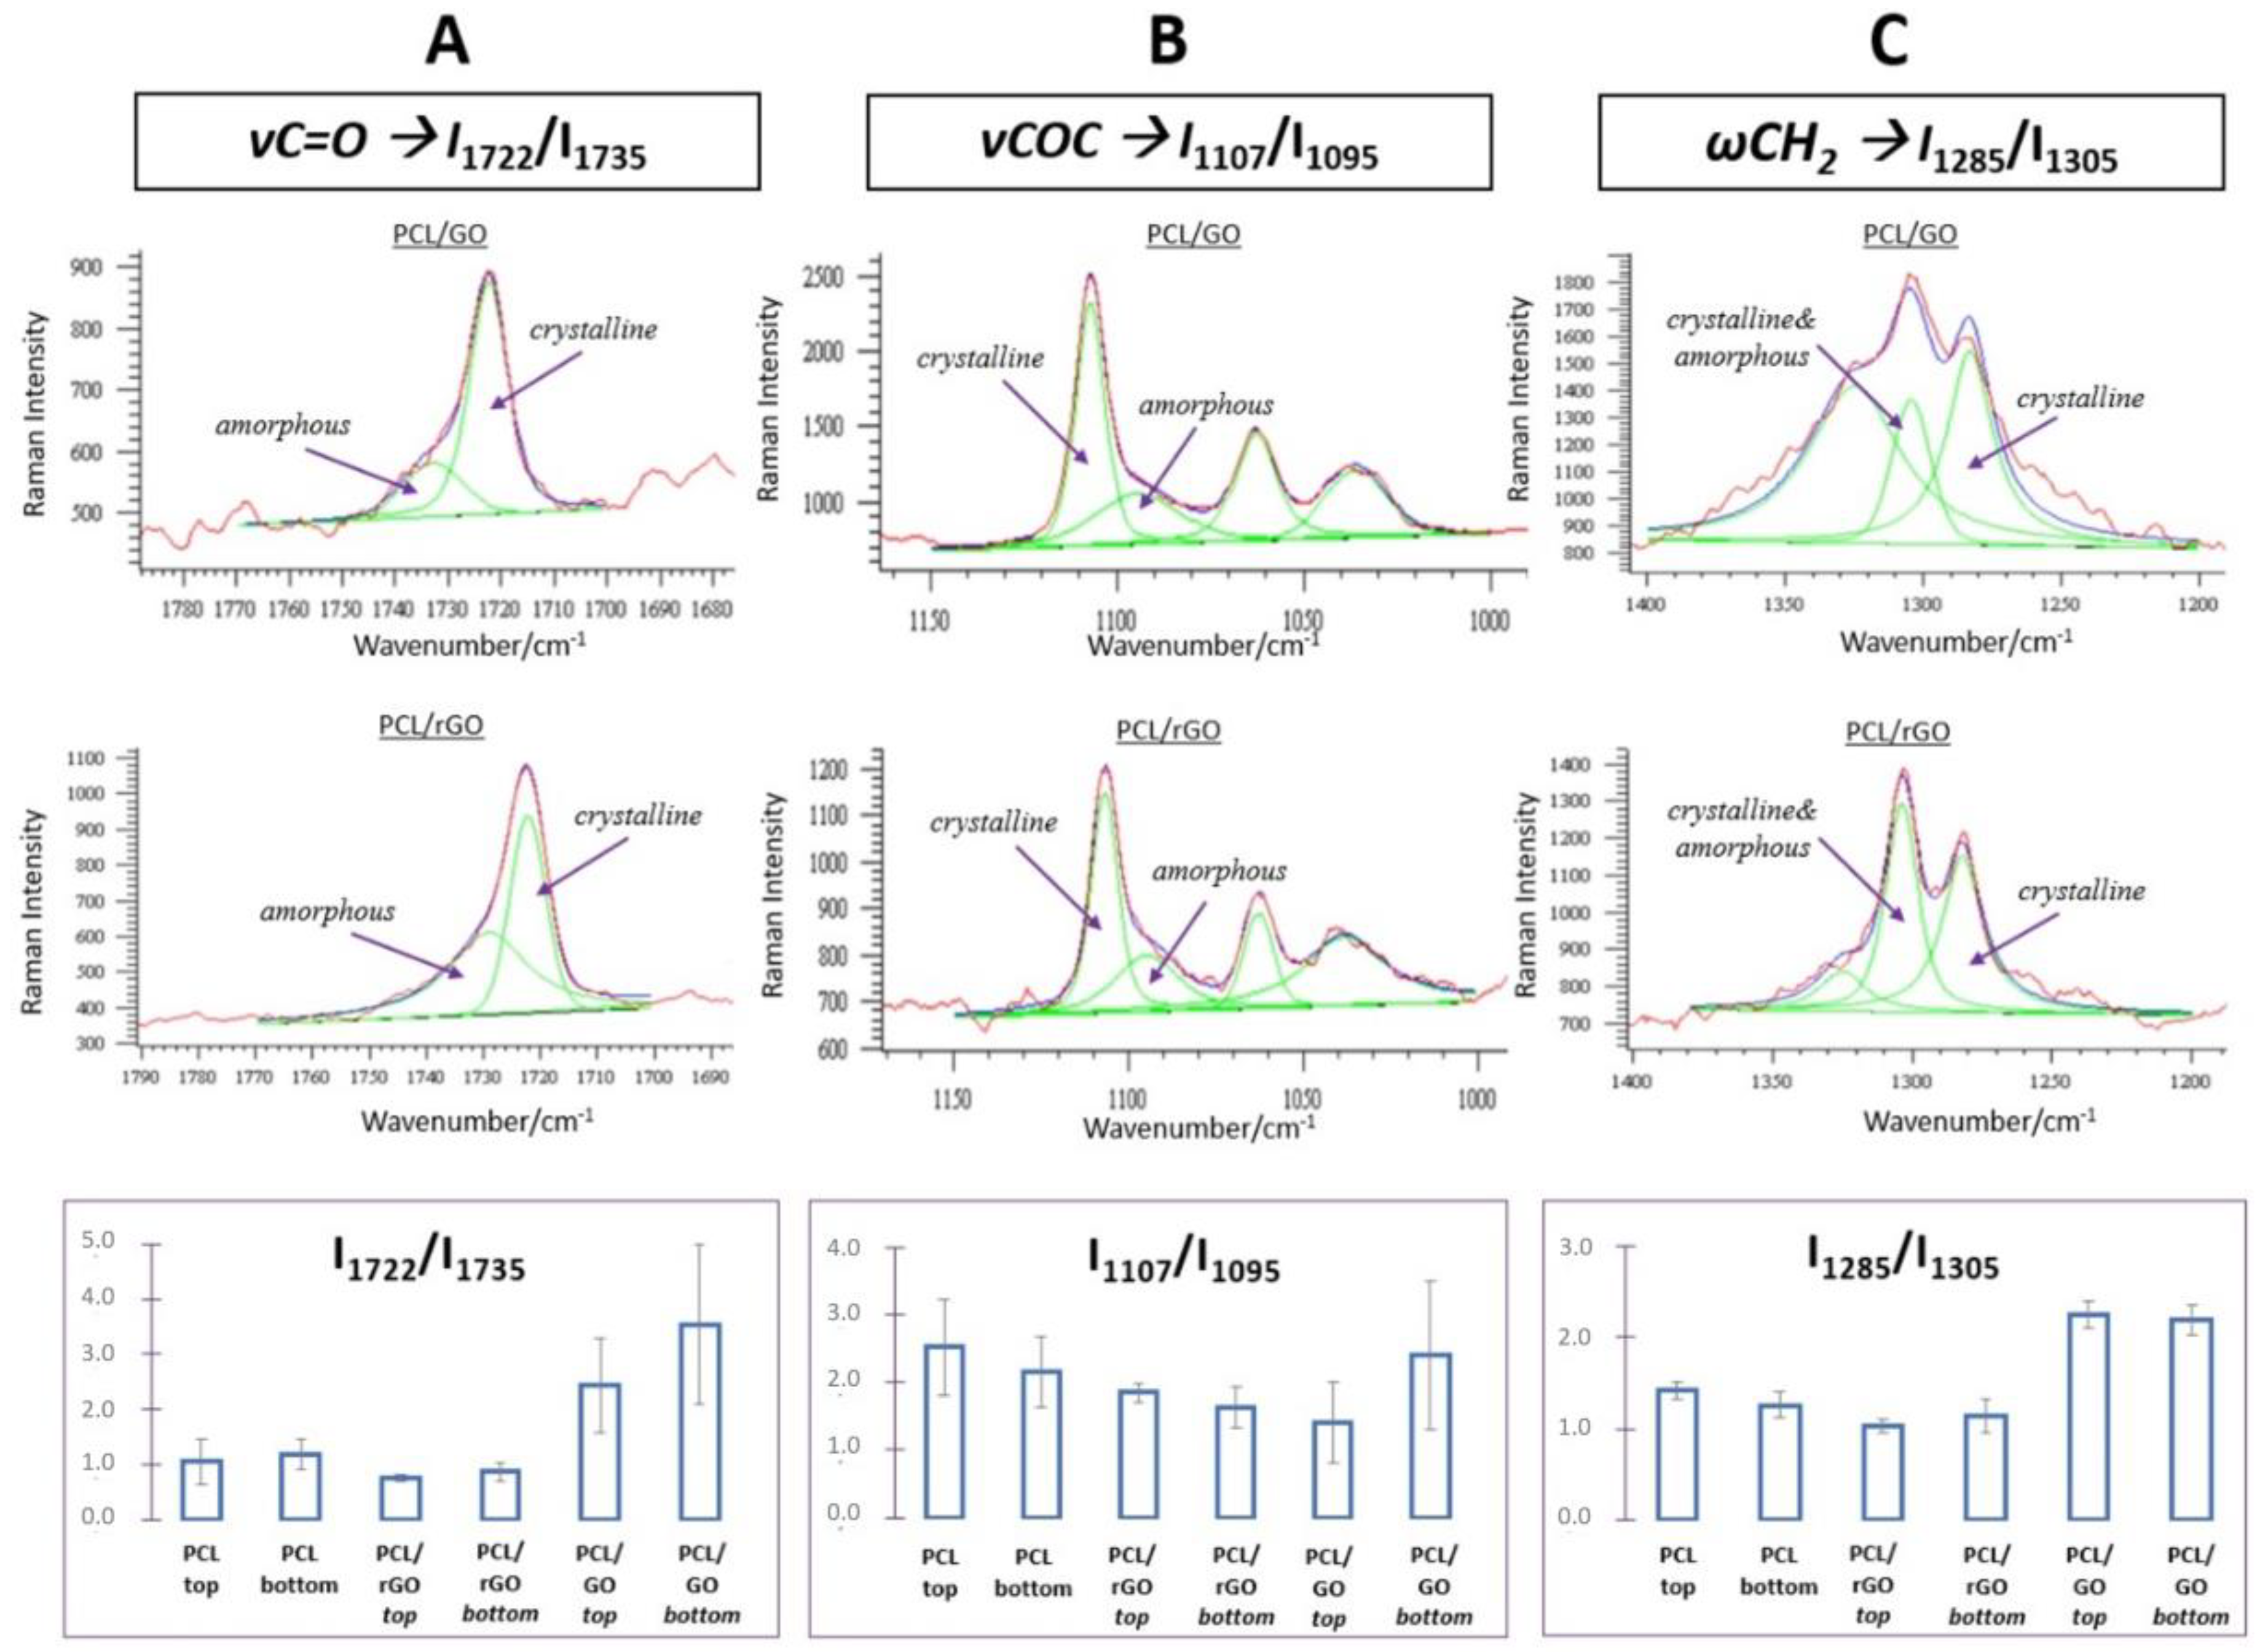
3.4.2. Assessment of the Crystallinity of the PCL Matrix

The crystallinity parameters of the poly(ε-caprolactone) matrix and its changes after the graphene GO and rGO particles incorporation were evaluated using the spectral curve fitting procedure, which was carried out for three spectral ranges: 1770–1700; 1380–1200; 1150–1000 cm−1. The peak fit models for the individual spectral ranges, and the obtained results, are shown in Figure 9. The relatively high values of standard deviations, especially for the PCL/GO membrane, indicate the heterogenous character of the nanocomposites. This feature may be desirable in specific applications, particularly in those requiring the ability of mimicking tissue environment by the material.
The integrated intensity ratio of I1722/I1735 informs about the crystallinity of the polymer C=O group domains (Figure 9A). For all of the three analysed materials a higher degree of crystallinity is observed in the bottom surface of the membranes. There is only a little difference of I1722/I1735 intensity ratio value between the reference PCL and PCL/rGO membrane, that reveals the decrease of crystallinity after the incorporation of rGO into the polymeric matrix, so the amorphousness rises. However, the pattern of the changes significantly differs in the case of PCL/GO. Here, the ratio I1722/I1735 increases in comparison to raw PCL, what supports the thesis that GO acts as a nucleation agent enhancing the crystallization of PCL [7].
The insight into to the changes of the ester part of the polymeric matrix gives the I1107/I1095 integrated ratio (Figure 9B). The top surfaces of the membranes show a higher crystallinity level in comparison with the reference PCL and the PCL/rGO membranes, but not for the PCL/GO. Generally, the amorphousness within the COC polymer domains increases as a result of the nanofillers’ incorporation. The only exception is the top surface of PCL/GO where almost no changes are observed.
The third analysed range 1380–1200 cm−1 delivers information about the aliphatic parts of the PCL chain (Figure 9C). The integrated intensity ratio I1285/I1305 shows a similar pattern of changes to the shifts of ratio I1722/I1735. The crystallinity od aliphatic part of the polymer increases significantly for PCL/GO, but slightly decreases in the case of PCL/rGO (compare to the raw PCL). The standard deviations are relatively low so the heterogeneity of the whole membranes has its origin in the polymer functional groups of heterogeneous character. Again, the great increase of PCL/GO crystallinity confirms that GO can act as a nucleation agent enhancing the crystallization of PCL. What is more, it seems that the hydrophilic functional groups of GO and their polar-polar interaction with the polymeric matrix play a clue role in this effect.

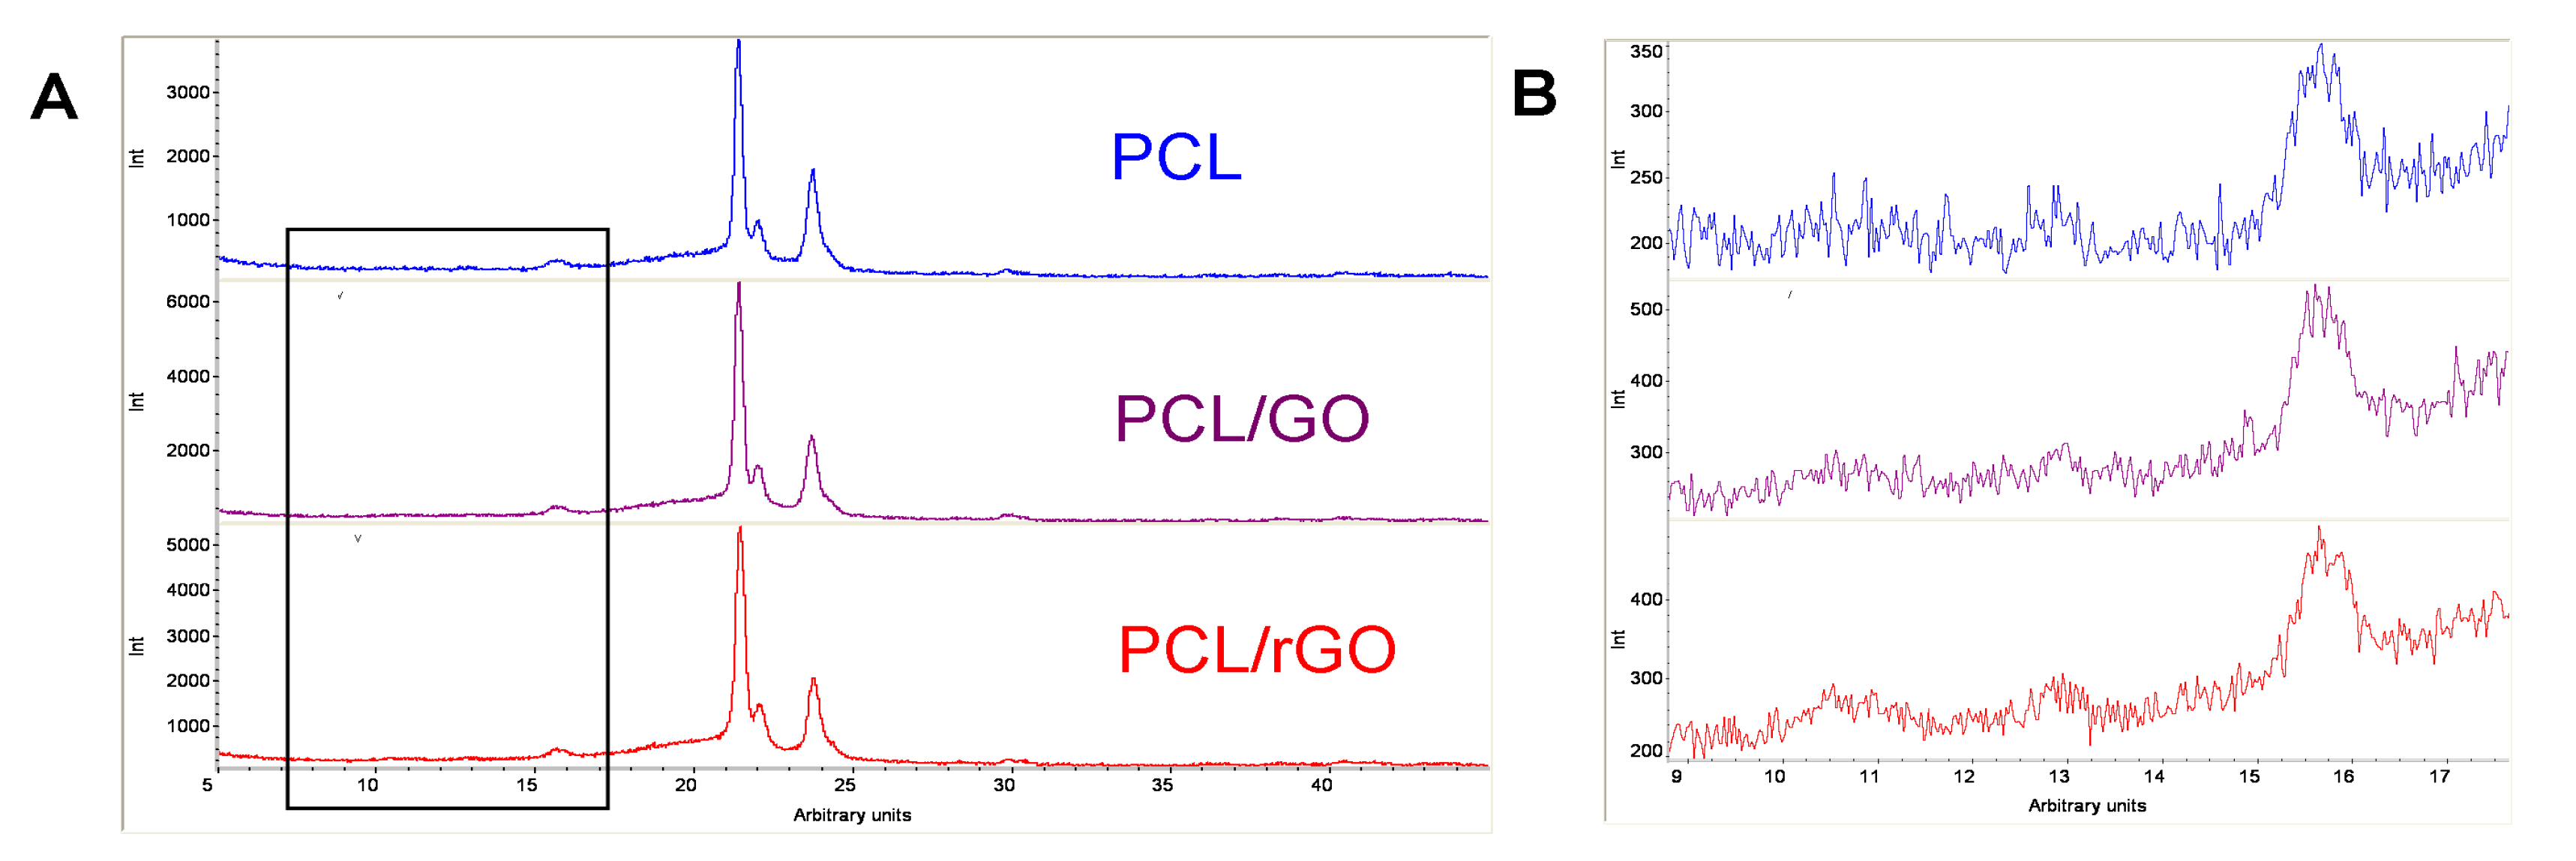
3.5. X-ray Diffraction Analysis

The obtained diffraction patterns of the tested nanocomposite membranes are shown in Figure 10. The PCL polymer is semi-crystalline as evidenced by clearly shaped diffraction maxima with the most pronounced for the 2 Theta 21.389 deg angle [37]. This maximum moves a little in nanocomposites to 21.398 deg and to 21.435 deg for PCL/GO and PCL/rGO, respectively. Due to the relatively low content of carbon nanoadditives in nanocomposites (equal to 0.5 wt%) the pattern of the diffraction maxima of the PCL matrix is dominant (Figure 10A). However, the increase in the intensity of this significant maximum of approx. 1.7 and 1.4 for PCL/GO and PCL/rGO, respectively, proves the influence of nanoadditives on the increase of the crystallinity of nanocomposite membranes. Additionally, in both materials relatively wide maxima appear of about 13.10 deg, while in PCL/rGO there are also two broad bands at 10.50 degrees and 10.90 degrees (Figure 10B). They signify the presence of oxygen functionalities [38,39].

4. Conclusions

The Raman micro-spectroscopy technique turned out to be an inestimable tool for the study of the interactions at the interface of the polymer and the graphene derivatives nanoparticles. PCL/GO and the PCL/rGO differ between each other in plenty of aspects what was confirmed by this study. Beside the similar characteristics of the studied nanofillers such as the level of crystallinity/organisation and the in-plane size of the nano-crystallites, they influenced polymeric matrix differently. In general, the incorporation of the rGO particles into the polymer matrix did not influence the material structure as much as it did the GO particles. It was revealed that the level of crystallinity is generally higher in the PCL/GO membrane as compared to PCL/rGO (and even raw PCL) what confirms the conclusion that the GO acts as a nucleation agent enhancing the crystallization of PCL. Both materials appear to be interesting options for future applications, especially in the field of bone regenerative medicine. However, further biocompatibility tests are necessary to confirm their potential.

Author Contributions

A.K., investigation, writing—original draft preparation; E.D. (Elżbieta Długoń), methodology, investigation, writing—review and editing; M.Ś., methodology, investigation; M.Z., methodology, investigation; E.D. (Emilia Dawiec), investigation, visualization; M.G. methodology, investigation; M.M., methodology, investigation; A.W.-B., Conceptualization, formal analysis, writing—review and editing. All authors have read and agreed to the published version of the manuscript.

Funding

The study was funded by the research part of the subsidy of the Faculty of Chemistry of the Jagiellonian University in Krakow, Poland. A.K. has been partly supported by the EU (European Union) Project POWR.03.02.00-00-I004/16. M.Ś. was supported by grant No. 20-07015S of the Czech Science Foundation.

Conflicts of Interest

The authors declare no conflict of interest.

References

  1. Zhang, L.; Webster, T.J. Nanotechnology and nanomaterials: Promises for improved tissue regeneration. Nano Today 2009, 4, 66–80. [Google Scholar] [CrossRef]
  2. Dash, T.K.; Konkimalla, V.B. Poly-ε-caprolactone based formulations for drug delivery and tissue engineering: A review. J. Control. Release 2012, 158, 15–33. [Google Scholar] [CrossRef] [PubMed]
  3. Woodruff, M.A.; Hutmacher, D.W. The return of a forgotten polymer-Polycaprolactone in the 21st century. Prog. Polym. Sci. 2010, 35, 1217–1256. [Google Scholar] [CrossRef] [Green Version]
  4. Di Foggia, M.; Corda, U.; Plescia, E.; Taddei, P.; Torreggiani, A. Effects of sterilisation by high-energy radiation on biomedical poly-(ε-caprolactone)/hydroxyapatite composites. J. Mater. Sci. Mater. Med. 2010, 21, 1789–1797. [Google Scholar] [CrossRef]
  5. Yang, K.; Li, Y.; Tan, X.; Peng, R.; Liu, Z. Behavior and toxicity of graphene and its functionalized derivatives in biological systems. Small 2013, 9, 1492–1503. [Google Scholar] [CrossRef]
  6. Kumar, S.; Azam, D.; Raj, S.; Kolanthai, E.; Vasu, K.S.; Sood, A.K.; Chatterjee, K. 3D scaffold alters cellular response to graphene in a polymer composite for orthopedic applications. J. Biomed. Mater. Res. Part B Appl. Biomater. 2016, 104, 732–749. [Google Scholar] [CrossRef]
  7. Duan, T.; Lv, Y.; Xu, H.; Jin, J.; Wang, Z. Structural effects of residual groups of graphene oxide on poly(ε-caprolactone)/graphene oxide nanocomposite. Crystals 2018, 8, 270. [Google Scholar] [CrossRef] [Green Version]
  8. Prasadh, S.; Suresh, S.; Wong, R. Osteogenic potential of graphene in bone tissue engineering scaffolds. Materials 2018, 11, 1430. [Google Scholar] [CrossRef] [Green Version]
  9. Sánchez-González, S.; Diban, N.; Urtiaga, A. Hydrolytic degradation and mechanical stability of poly(ε-Caprolactone)/reduced graphene oxide membranes as scaffolds for in vitro neural tissue regeneration. Membranes 2018, 8, 12. [Google Scholar] [CrossRef] [Green Version]
  10. Safaei Firoozabady, A.; Aidun, A.; Kowsari-Esfahan, R.; Allahyari, A. Characterization and Evaluation of Graphene Oxide Incorporated into Nanofibrous Scaffold for Bone Tissue Engineering. J. Tissues Mater. 2019, 2, 1–13. [Google Scholar] [CrossRef]
  11. Wan, C.; Chen, B. Poly(ε-caprolactone)/graphene oxide biocomposites: Mechanical properties and bioactivity. Biomed. Mater. 2011, 6. [Google Scholar] [CrossRef]
  12. Wan, C.; Chen, B. Reinforcement and interphase of polymer/graphene oxide nanocomposites. J. Mater. Chem. 2012, 22, 3637–3646. [Google Scholar] [CrossRef]
  13. Ramazani, S.; Karimi, M. Aligned poly(ε-caprolactone)/graphene oxide and reduced graphene oxide nanocomposite nanofibers: Morphological, mechanical and structural properties. Mater. Sci. Eng. C 2015, 56, 325–334. [Google Scholar] [CrossRef]
  14. Wang, G.S.; Wei, Z.Y.; Sang, L.; Chen, G.Y.; Zhang, W.X.; Dong, X.F.; Qi, M. Morphology, crystallization and mechanical properties of poly(ε-caprolactone)/graphene oxide nanocomposites. Chinese, J. Polym. Sci. 2013, 31, 1148–1160. [Google Scholar] [CrossRef]
  15. Zhang, J.; Qiu, Z. Morphology, crystallization behavior, and dynamic mechanical properties of biodegradable poly(ε-caprolactone)/thermally reduced graphene nanocomposites. Ind. Eng. Chem. Res. 2011, 50, 13885–13891. [Google Scholar] [CrossRef]
  16. Bagheri, M.; Mahmoodzadeh, A. Polycaprolactone/Graphene Nanocomposites: Synthesis, Characterization and Mechanical Properties of Electrospun Nanofibers. J. Inorg. Organomet. Polym. Mater. 2020, 30, 1566–1577. [Google Scholar] [CrossRef]
  17. Türk, M.; Deliormanlı, A.M. Graphene-containing PCL- coated Porous 13-93B3 Bioactive Glass Scaffolds for Bone Regeneration. Mater. Res. Express 2018, 5, 1–13. [Google Scholar] [CrossRef]
  18. Eivazzadeh-Keihan, R.; Maleki, A.; de la Guardia, M.; Bani, M.S.; Chenab, K.K.; Pashazadeh-Panahi, P.; Baradaran, B.; Mokhtarzadeh, A.; Hamblin, M.R. Carbon based nanomaterials for tissue engineering of bone: Building new bone on small black scaffolds: A review. J. Adv. Res. 2019, 18, 185–201. [Google Scholar] [CrossRef]
  19. Ahmad, I.; Yazdani, B.; Zhu, Y. Recent advances on carbon nanotubes and graphene reinforced ceramics nanocomposites. Nanomaterials 2014, 5, 90–114. [Google Scholar] [CrossRef]
  20. Chen, C.; Yang, Q.H.; Yang, Y.; Lv, W.; Wen, Y.; Hou, P.X.; Wang, M.; Cheng, H.M. Self-assembled free-standing graphite oxide membrane. Adv. Mater. 2009, 21, 3007–3011. [Google Scholar] [CrossRef]
  21. Hummers, W.S.; Offeman, R.E. Preparation of Graphitic Oxide. J. Am. Chem. Soc. 1958, 80, 1339. [Google Scholar] [CrossRef]
  22. Liu, R.; Li, F.; Chen, C.; Song, Q.; Zhao, N.; Xiao, F. Nitrogen-functionalized reduced graphene oxide as carbocatalysts with enhanced activity for polyaromatic hydrocarbon hydrogenation. Catal. Sci. Technol. 2017, 7, 1217–1226. [Google Scholar] [CrossRef]
  23. Khang, D.; Kim, S.Y.; Liu-Snyder, P.; Palmore, G.T.R.; Durbin, S.M.; Webster, T.J. Enhanced fibronectin adsorption on carbon nanotube/poly(carbonate) urethane: Independent role of surface nano-roughness and associated surface energy. Biomaterials 2007, 28, 4756–4768. [Google Scholar] [CrossRef] [PubMed]
  24. Chu, P.K.; Li, L. Characterization of amorphous and nanocrystalline carbon films. Mater. Chem. Phys. 2006, 96, 253–277. [Google Scholar] [CrossRef]
  25. Wesełucha-Birczyńska, A.; Frączek-Szczypta, A.; Długoń, E.; Paciorek, K.; Bajowska, A.; Kościelna, A.; Błażewicz, M. Application of Raman spectroscopy to study of the polymer foams modified in the volume and on the surface by carbon nanotubes. Vib. Spectrosc. 2014, 72, 50–56. [Google Scholar] [CrossRef]
  26. Ferrari, A.C. Raman spectroscopy of graphene and graphite: Disorder, electron-phonon coupling, doping and nonadiabatic effects. Solid State Commun. 2007, 143, 47–57. [Google Scholar] [CrossRef]
  27. Kołodziej, A.; Wesełucha-Birczyńska, A.; Świętek, M.; Skalniak, Ł.; Błażewicz, M. Raman microspectroscopic investigations of polymer nanocomposites: Evaluation of physical and biophysical properties. Int. J. Polym. Mater. Polym. Biomater. 2019, 68, 44–52. [Google Scholar] [CrossRef]
  28. Wesełucha-Birczyńska, A.; Kołodziej, A.; Świętek, M.; Moskal, P.; Skalniak, Ł.; Długoń, E.; Błażewicz, M. Does 2D correlation Raman spectroscopy distinguish polymer nanomaterials due to the nanoaddition? J. Mol. Struct. 2020, 1217. [Google Scholar] [CrossRef]
  29. Kołodziej, A.; Wesełucha-Birczyńska, A.; Świętek, M.; Skalniak, Ł.; Błażewicz, M. A 2D-Raman correlation spectroscopy study of the interaction of the polymer nanocomposites with carbon nanotubes and human osteoblast-like cells interface. J. Mol. Struct. 2020, 1212. [Google Scholar] [CrossRef]
  30. Jorio, A.; Pimenta, M.A.; Filho, A.G.S.; Saito, R.; Dresselhaus, G.; Dresselhaus, M.S. Characterizing carbon nanotube samples with resonance Raman scattering. New J. Phys. 2003, 5, 139.1–139.17. [Google Scholar] [CrossRef]
  31. Beyssac, O.; Goffé, B.; Petitet, J.P.; Froigneux, E.; Moreau, M.; Rouzaud, J.N. On the characterization of disordered and heterogeneous carbonaceous materials by Raman spectroscopy. Spectrochim. Acta Part A Mol. Biomol. Spectrosc. 2003, 59, 2267–2276. [Google Scholar] [CrossRef]
  32. Wesełucha-Birczyńska, A.; Babeł, K.; Jurewicz, K. Carbonaceous materials for hydrogen storage investigated by 2D Raman correlation spectroscopy. Vib. Spectrosc. 2012, 60, 206–211. [Google Scholar] [CrossRef]
  33. Tuinstra, F.; Koenig, J.L. Raman Spectrum of Graphite. J. Chem. Phys. 1970, 53, 1126–1130. [Google Scholar] [CrossRef] [Green Version]
  34. Dideikin, A.T.; Vul’, A.Y. Graphene oxide and derivatives: The place in graphene family. Front. Phys. 2019, 6. [Google Scholar] [CrossRef]
  35. Pimenta, M.A.; Dresselhaus, G.; Dresselhaus, M.S.; Cançado, L.G.; Jorio, A.; Saito, R. Studying disorder in graphite-based systems by Raman spectroscopy. Phys. Chem. Chem. Phys. 2007, 9, 1276–1291. [Google Scholar] [CrossRef] [PubMed]
  36. Cho, N.H.; Veirs, D.K.; Ager, J.W.; Rubin, M.D.; Hopper, C.B.; Bogy, D.B. Effects of substrate temperature on chemical structure of amorphous carbon films. J. Appl. Phys. 1992, 71, 2243–2248. [Google Scholar] [CrossRef]
  37. Balu, R.; Sampath Kumar, T.S.; Ramalingam, M.; Ramakrishna, S. Electrospun polycaprolactone/Poly(1,4-butylene adipate-co-polycaprolactam) blends: Potential biodegradable scaffold for bone tissue regeneration. J. Biomater. Tissue Eng. 2011, 1, 30–39. [Google Scholar] [CrossRef]
  38. Chen, Y.; Niu, Y.; Tian, T.; Zhang, J.; Wang, Y.; Li, Y.; Qin, L.C. Microbial reduction of graphene oxide by Azotobacter chroococcum. Chem. Phys. Lett. 2017, 677, 143–147. [Google Scholar] [CrossRef] [Green Version]
  39. Bahrami, A.; Kazeminezhad, I.; Abdi, Y. Pt-Ni/rGO counter electrode: Electrocatalytic activity for dye-sensitized solar cell. Superlattices Microstruct. 2019, 125, 125–137. [Google Scholar] [CrossRef]
Figure 1. Scheme of graphene oxide (GO) and reduced graphene oxide (rGO) preparation from the graphite precursor. The microphotographs of the obtained membranes of the polymer nanocomposites with GO/rGO components; top and bottom surfaces. Magnification ×20.
Jcs 05 00020 g001
Figure 2. An exemplary Raman spectrum with the marked three ranges selected for the analysis of the crystallinity of the poly(ε-caprolactone) (PCL) matrix.
Jcs 05 00020 g002
Figure 3. A scanning electron microscopy (SEM) micrograph of: (A) the graphite powder used to obtain graphene oxide; (B) GO particles; (C) rGO particles.
Jcs 05 00020 g003
Figure 4. The SEM micrographs of: (A) the PCL reference membrane (B) the PCL/GO membrane and (C) the PCL/rGO membrane.
Jcs 05 00020 g004
Figure 5. The water contact angle measurements for PCL/GO and PCL/rGO, both sides of the membrane.
Jcs 05 00020 g005
Figure 6. The Raman spectra of GO and rGO. The Raman range of ca. 3200–500 cm−1, 785 nm laser line.
Jcs 05 00020 g006
Figure 7. The Raman spectra of reference PCL, PCL/rGO, and PCL/GO membranes. The spectral range of 2400–500 cm−1, 785 nm laser line.
Jcs 05 00020 g007
Figure 8. The Raman spectrum of GO sample in the 1900–1100 cm−1 range, with the model of fitting for the G-, D1- and D3-bands marked (A). The ID/IG intensity ratio of the bands of the tested materials (B).
Jcs 05 00020 g008
Figure 9. The Raman spectra in the: (A) 1770–1700 cm−1; (B) 1380–1200 cm−1; (C) 1150–1000 cm−1 range; The curve fitting models and integral intensity ratios of the chosen polymeric bands of the tested materials (the top surface of each material was tested, 785 nm laser line).
Jcs 05 00020 g009
Figure 10. The XRD patterns for reference PCL membrane and two nanocomposite membranes PCL/GO and PCL/rGO in the: (A) 5–45 deg range; (B) in the ca.10–20 deg range.
Jcs 05 00020 g010
Table 1. The water contact angle, surface roughness and surface free energy of the top and bottom membranes’ surfaces of the tested materials.
SampleWater Contact Angle [°]Surface Roughness [nm]Surface Free Energy [J/m2]Disperse [mN/m]Polar [mN/m]
PCL top85.34 ± 1.2918 ± 345.83 ± 1.1244.51 ± 1.121.32 ± 0.29
PCL bottom83.12 ± 2.5014 ± 243.37 ± 1.9241.76 ± 1.651.00 ± 0.27
PCL/GO top 88.44 ± 2.4023 ± 446.20 ± 1.7345.52 ± 1.370.68 ± 0.37
PCL/GO bottom79.75 ± 1.6121 ± 347.41 ± 1.1544.75 ± 0.682.66 ± 0.47
PCL/rGO top83.74 ± 1.6425 ± 447.01 ± 0.9345.46 ± 0.561.55 ± 0.37
PCL/rGO bottom79.01 ± 0.9518 ± 349.20 ± 1.2246.63 ± 0.922.57 ± 0.30
Table 2. Assignment of characteristic Raman bands of PCL/GO, PCL/rGO, and the reference PCL membrane [27,28,29].
PCL/GOPCL/rGOPCLAssignment
912912915ν(C-COO) crystalline
956955959ν(C-COO)
103610361039ν(COC)
109210941097ν(COC) amorphous
110711071110ν(COC) crystalline
128312821287ω(CH) crystalline
130713051306ω(CH) crystalline&amorphous
~1320(hidden)~1318(hidden)-D1-band
141614161420δ(CH2) crystalline
144014401442δ(CH2) crystalline
146814651466δ(CH2) crystalline
~1594~1595-G-band
172617241725ν(C=O) crystalline
173517331733ν(C=O) amorphous
Table 3. The Value of the La Parameters for the Studied Materials.
SampleLa [nm]
rGO50.63 ± 1.23
PCL/rGOTop96.98 ± 7.41
Bottom103.45 ± 9.76
GO51.42 ± 1.46
PCL/GOTop67.25 ± 1.11
Bottom73.39 ± 3.16
Publisher’s Note: MDPI stays neutral with regard to jurisdictional claims in published maps and institutional affiliations.

