Review

Seed Silhouettes as Geometric Objects: New Applications of Elliptic Fourier Transform to Seed Morphology

by
Emilio Cervantes
1,*,
José Luis Rodríguez-Lorenzo
2,
Diego Gutiérrez del Pozo
3,
José Javier Martín-Gómez
1,
Bohuslav Janousek
3,
Ángel Tocino
4 and
Ana Juan
5
1
Instituto de Recursos Naturales y Agrobiología del Consejo Superior de Investigaciones Científicas (IRNASA-CSIC), Cordel de Merinas, 40, 37008 Salamanca, Spain
2
Plant Developmental Genetics, Institute of Biophysics v.v.i, Academy of Sciences of the Czech Republic, Královopolská 135, 612 65 Brno, Czech Republic
3
Herbario Amazónico del Ecuador ECUAMZ, Universidad Estatal Amazónica, Carretera Tena a Puyo Km. 44, Carlos Julio Arosemena Tola 150950, Napo, Ecuador
4
Departamento de Matemáticas, Facultad de Ciencias, Universidad de Salamanca, Plaza de la Merced 1-4, 37008 Salamanca, Spain
5
Departamento de Ciencias Ambientales y Recursos Naturales, University of de Alicante, 03690 San Vicente, Alicante, Spain
*
Author to whom correspondence should be addressed.
Horticulturae 2022, 8(10), 974; https://doi.org/10.3390/horticulturae8100974
Submission received: 29 September 2022 / Revised: 18 October 2022 / Accepted: 18 October 2022 / Published: 20 October 2022
(This article belongs to the Section Propagation and Seeds)

Abstract

:
Historically, little attention has been paid to the resemblance between seed silhouettes to geometric figures. Cardioid and derivatives, ellipses, heart curves, lemniscates, lenses, lunes, ovals, superellipses, waterdrops, and other figures can be used to describe seed shape, as well as models for quantification. Algebraic expressions representing the average silhouettes for a group of seeds are available, and their shape can be described and quantified by comparison with geometric models. Bidimensional closed-plane figures resulting from the representation of Fourier equations can be used as models for shape analysis. Elliptic Fourier Transform equations reproduce the seed silhouettes for any closed-plane curve corresponding to the contour of the image of a seed. We review the geometric properties of the silhouettes from seed images and discuss them in the context of seed development, plant taxonomy, and environmental adaptation. Silene is proposed as a model for the study of seed morphology. Three groups have been recently defined among Silene species based on the structure of their seed silhouettes, and their geometric properties are discussed. Using models based on Fourier Transform equations is useful in Silene species where the seeds are homogenous in shape but don’t adjust to described figures.

1. Introduction

Seed shape description is usually mixed with size observations (see, for example, [1]). Measurements derived from size often distract attention from the absence of quantification data from the seed shape itself. Size measurements have been a constant in seed science, finding published databases of both seed size and weight [2,3]. On the other hand, the descriptions of seed shape contain terms without correspondence to precisely defined geometric objects (calycine, cuneiform, globoid, globose, globular, obovate, piriform, renifo, etc.), lacking in shape measurements. Seed shape quantification is infrequent in the botanical literature, and only a preliminary seed shape dataset has been recently published [4]. Nevertheless, the seeds of many plant species resemble geometric objects, and their images can be described by their similarity to geometric figures. This property can also be used in the process of seed shape quantification that may be useful for phenotype characterization.
The seeds of the Silene species resemble in their lateral views the cardioid and related figures, which can be used as models for the quantification of seed shape. The models used in the quantification of lateral and dorsal views of Silene can be obtained by the representation of diverse algebraic equations [5,6,7,8,9], thus switching the morphological description of seeds from purely descriptive to a quantitative, analytical method.
The following sections focus on describing some of the approaches to get the geometric forms that define better seed images. We also include the connection between seed shape and developmental processes and provide a review of the distribution of geometric seed forms on Angiosperms. Seed form is related to the type of ovule development, as well as with the relationship between the ovules in fruit and with diverse adaptations to seed dispersal [10]. While seed shape usually remains relatively constant for each species, it can vary notably in some families. In certain plant families, like the Arecaceae and the Vitaceae [11,12], seeds resemble multiple types of geometric figures, while in others, a reduced number of morphological types are predominant, such as ellipses in the Campanulaceae [13] and Oleaceae [14], ovals in the Cucurbitaceae [15], Euphorbiaceae [16,17], and Rutaceae [13]. Seeds of the Caryophyllaceae present interesting features, with ovules hemianatropous to campylotropous [18,19,20], and the embryo corresponds to a peripheral type [21]. The genus Silene L. has an interesting diversity of seed shapes and is proposed here as a model for studying variations in seed morphology [5,6,7,8,9].

A Historical Anecdote

The absence of data based on seed shape quantification linked to geometric models may be due to the influence of animal biologists and paleontologists on plant morphologists. For example, in an article published in the journal Human Evolution, Professor Dwight Read stated [22]:
“I first consider—and then discard as inadequate—two commonly used representations of form. The first one makes the strong theoretical assumption that the empirical form can be idealized and replaced by a geometric figure.”
Nevertheless, it is not incorrect to compare seed images with geometric figures. On the contrary, looking at seed images, or at their silhouettes, as geometric objects is a direct way to achieve mathematical accuracy in seed shape description. This is required to combine morphology with genetics, ecology, or taxonomy.

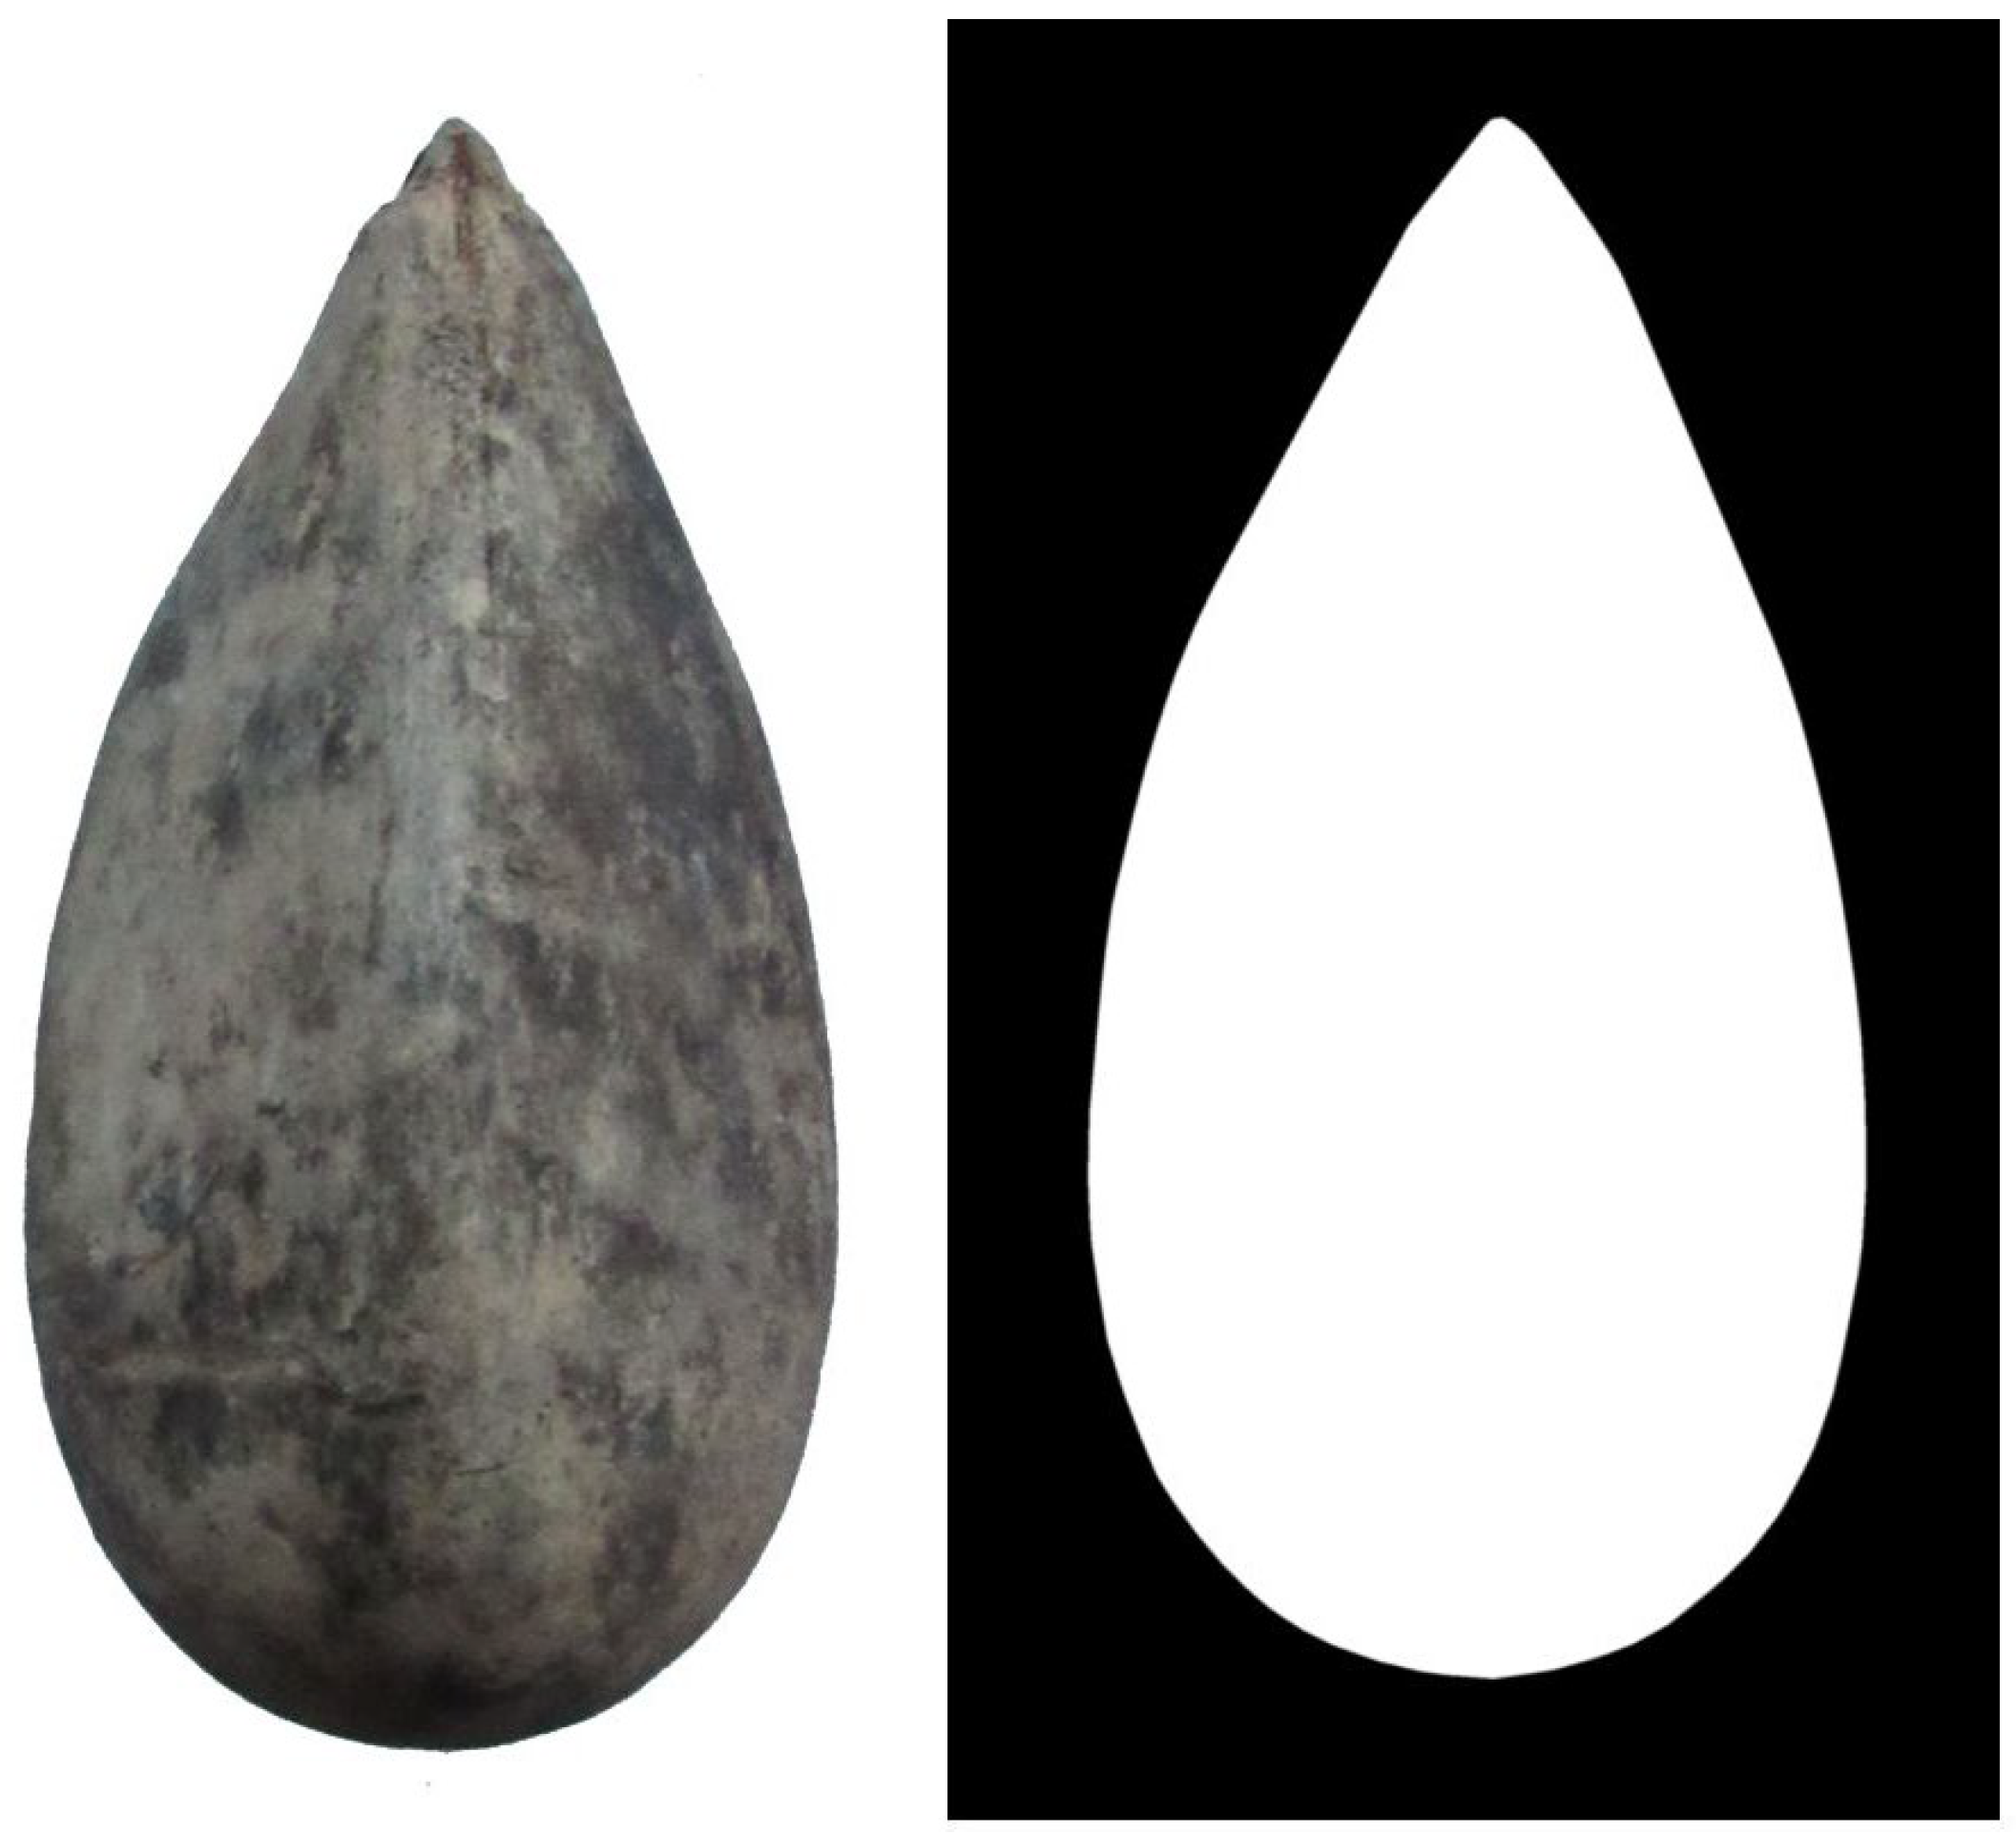
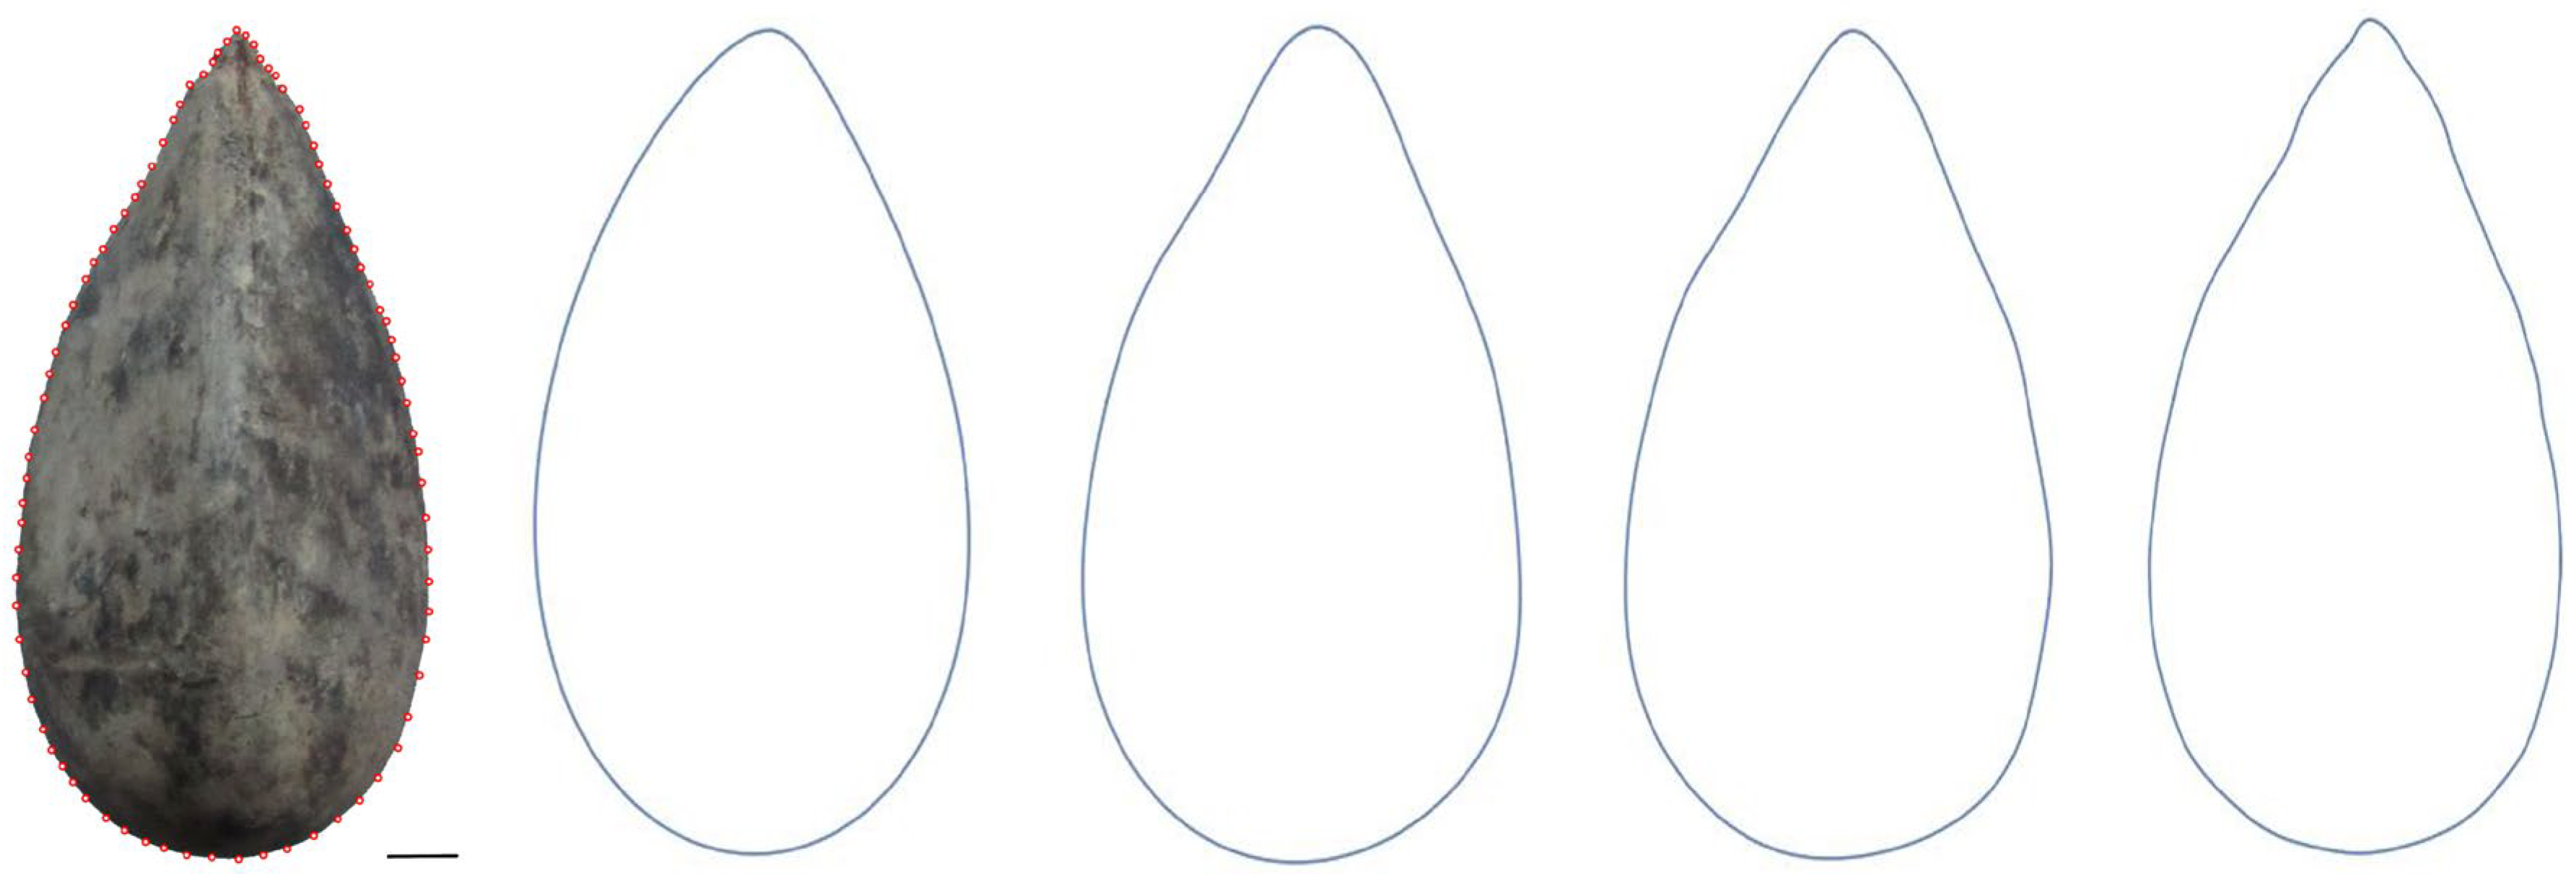
2. Geometric Properties of Seed Silhouettes

Solidity is an important property of closed-plane curves. It is related to convexity and expresses the ratio of two areas: the area of an object to the area of its convex Hull [23] (Figure 1). The convex Hull is the smallest convex set that contains a plane figure.
A figure is convex when the segment that joins any pair of its points is contained. Then solidity of any convex figure equals one. The tangent at any point of a convex curve leaves the complete figure on one side of it. In addition, a closed plane curve is convex if, and only if, its signed curvature does not change sign [23].
Solidity is linked to the ratio of perimeter/area in plane figures and represents an estimation of the surface/volume ratio of the corresponding tridimensional objects. In seeds, surface/volume ratio has a role in regulating metabolic aspects from the gas exchange and oxygen availability to nutrient uptake or water imbibition and evaporation [24]. Given the importance of this ratio, we may consider solidity as an important property of seeds and their relative value as a candidate for taxonomic plant studies.
A measurement related to solidity is the ratio between the perimeter of a plane curve and the perimeter of the corresponding convex hull. Comparing this measurement with the solidity value gives information about the irregularities on a surface. High values of solidity may be combined with low perimeter ratios in curves with many small surface irregularities.

3. Quantification of Seed Shape by Comparison with Models

Seed shape quantification can be done by estimating the percentage surface shared between the seed image and a given model [13,25]. The resulting measurement has been termed the J index. The models used can be either a canonical geometric figure or any other mathematically defined closed curve, such as those from Fourier equations. In both cases, the process requires a manual seed image-model adjustment, which does not impede achieving objective and reproducible values. Seed shape quantification by comparing seed images with canonical models has been applied to various plant species [5,6,7,8,9,11,12,13,14,15,16,17,25,26,27,28,29,30,31,32,33,34].
Multivariate analysis based on Fourier coefficients has been used for shape analysis in Zoology and Palaeontology [35,36], as well as for leaf shape description on trees [37] and seed shape comparison in diverse species [38,39,40,41,42,43]. Nevertheless, the continuous, closed curves represented by Fourier equations can also be used as models for seed shape quantification.

3.1. Quantification by Comparison with Known Geometric Figures as Models

The cardioid is a good model for the description of seed shape in the model legume Lotus japonicus (Regel) K. Larsen [26], species of Capparis Tourn. ex L. (Capparaceae) [27], Searsia tripartita (Ucria) Moffett (Anacardiaceae) (as Rhus tripartita (Ucria) Grande, [28]), and, also in many species of Silene L. (Caryophyllaceae) [5,6,7,8,9]. Slight modifications in the cardioid resulted in curves similar to the seed silhouettes of Medicago truncatula Gaertn. (Fabaceae) and Arabidopsis thaliana (L.) Heynh. (Brassicaceae) [26,29,30]. Mean values of percent similarity (J index) superior to 90 for samples containing at least 20 well-oriented seeds have been reported for many species of Silene choosing the cardioid as a model [5,6,7,8,9].
Seed shape has been described for several species in the Arecaceae. Seed images in this family resemble a compendium of geometric figures serving as models for shape quantification [11]. General equations with variable coefficients corresponding to ellipses, ovals, lemniscates, superellipses, and others allowed us to compare figures with different proportions adjusted to the seed shape of different species [11]. Seeds resembling some of the models described for Arecaceae, such as lenses and superellipses, were also found in Vitaceae [12]. The introduction of further variations in the equation of the ellipse resulted in curves well adapted to seed shape in members of this latter family, including the agricultural grape varieties, and seeds in other species having more complex shapes [12,31,32].

3.2. Closed Curves from Fourier Equations as Models

For seed shape quantification, Fourier curves reproducing the shape of seed images represent an alternative to canonical geometric figures. Fourier analysis is a mathematical method for reducing complex curves into their component spatial frequencies. The parametric functions representing a closed plane curve may be approximated by sums of trigonometric functions and their truncated Fourier expansions [37,44]. In particular, when the parametric components are piecewise linear functions x ( t ) = i = 1 K Δ x i   ,     y ( t ) = i = 1 K Δ y i ,   these expansions are:
X N ( t ) = A 0 + n = 1 N a n c o s ( 2 n π t T ) + b n s i n ( 2 n π t T ) ,
Y N ( t ) = C 0 + n = 1 N c n c o s ( 2 n π t T ) + d n s i n ( 2 n π t T ) ,
where A 0 and C 0 define the mean size of the contour, and the coefficients a n , b n , c n , d n are calculated as
a n = T 2 π 2 n 2 p = 1 K Δ x p Δ t p ( c o s ( 2 n π t p T ) c o s ( 2 n π t p 1 T ) ) ,
b n = T 2 π 2 n 2 p = 1 K Δ x p Δ t p ( s i n ( 2 n π t p T ) s i n ( 2 n π t p 1 T ) ) ,
c n = T 2 π 2 n 2 p = 1 K Δ y p Δ t p ( c o s ( 2 n π t p T ) c o s ( 2 n π t p 1 T ) ) ,
d n = T 2 π 2 n 2 p = 1 K Δ y p Δ t p ( s i n ( 2 n π t p T ) s i n ( 2 n π t p 1 T ) ) .
The position of any point on the outline is approximated by the displacement of a point traveling around a series of superimposed and successively smaller ellipses, corresponding to successive harmonics. For each harmonic, two Fourier coefficients are computed for both the x- and y-projections resulting in a total number of coefficients of 4 N , where N is the number of harmonics used to fit the outline. Departing with basic ellipses obtained with four coefficients, the complexity of the figure increases. The coefficients of the lower order correspond to the overall shape, and the higher order harmonics correspond to the smaller details of the outline [37,44].
Based on the elliptic Fourier analysis described above, it is possible to obtain a figure that reproduces the silhouette of a given seed or the average silhouette for a population of seeds. For example, Figure 2 presents the images corresponding to Fourier equations for a seed silhouette of Aphandra natalia (Balslev & A.J. Hend.) Barfod (Arecaceae) with 2, 6, 10, and 20 harmonics (a Mathematica code for obtaining the Fourier expansion and the corresponding figure from any set of points approximating a closed-plane curve is available at Zenodo; see Supplementary Materials).
In the example of the seed of A. natalia shown in Figure 1, the images corresponding to the equations calculated with different harmonics are represented. For convex figures, a low number of harmonics may give an accurate shape representation. The representation of partial concavities requires a larger number of harmonics. Figure 3 shows the superposition of the convex Hull (see later) with the silhouette obtained with 20 harmonics.

3.3. Curvature Analysis

The trigonometrical polynomials obtained as approximations to the parametric components allow for calculating the curvature values along the curve ([45,46,47,48]; Figure 4). The maximum curvature value at the apex is observed.

4. Seed Shape Diversity Linked to Embryogeny and Fruit Development

4.1. Embryogeny

Davis [19] and Johri and collaborators [20] reviewed how the categories of orthotropous, anatropous, hemianatropous, amphitropous, and campylotropous ovules were distributed among 315 families of angiosperms. Of all of them, 204 had anatropous, 20 orthotropous, 13 hemianatropous, and 11 campylotropous or amphitropous ovules [19,20]. Both the orthotropous and the anatropous types are found in the basal angiosperms and were proposed to have independent origins [49]. In addition, multiple ovule types with differences among genera, or even species, were found in 67 families [19,20]. This number could probably be underestimated, considering that many families were incompletely studied, and their taxonomic value throughout families supports their study [50]. The four main different types of ovules can be classified into two different groups (anatropous-orthotropous vs. campylotropous-amphitropous), depending on the aspect of the nucellus. Anatropous and orthotropous are both characterized by a straight nucellus, which is bent or curved for the campylotropous and amphitropous ovules [51]. These differences might influence seed development, specifically on certain features of the seed morphology.
Orthotropous ovules are found, for example, in some basal angiosperms and magnoliids as the families Amborellaceae, Chloranthaceae, Piperaceae, and Saururaceae, as well as in some eudicots as Casuarinaceae, Juglandaceae, Myricaceae, and Polygonaceae [19,20]. Conversely, the anatropous type is the predominant ovule in most of the angiosperm families [52], including Aristolochiaceae, Bromeliaceae, Lauraceae, Cannaceae, Plumbaginaceae, Tamaricaceae, Anacardiaceae, Vitaceae, Dilleniaceae, among others [19,20]. Campylotropous and amphitropous ovules mostly occur in the families Cactaceae, Caryophyllaceae, Amaranthaceae, Capparaceae, Berberidaceae, and also in some species of the families Brassicaceae, Geraniaceae, Malvaceae (e.g., Hibiscus cannabinus L. [53]), and Menispermaceae [19,20].
However, two-three types of ovules often occur within some families, such as Fabaceae and Caryophyllaceae, which mostly includes campylotropous or anatropous ovules [51], though rare amphitropous ones are also present [54]. The family Arecaceae is a notable example of a high intra-familiar diversity of ovule type. The different Arecaceae subfamilies can show anatropous, orthotropous, hemianatropous, and campylotropous ovules [55], which would be associated with a high diversity of seed shapes [11]. In this respect, the preliminary observations between ovule and seed shape suggest that the anatropous and orthotropous ovules develop oval and/or ellipse-shaped seeds. In contrast, campylotropous and amphitropous ovules seem more similar to a C-shaped morphology related to the cardioid seed shape (Figure 5). Nevertheless, variations in seed shape are also related to changes in developmental processes during seed maturation, with the presence of extended hilum [20,56]. Modifications based on the funiculus in species of Opuntia Mill. (Cactaceae) led Archibald to give the denomination of circinotropous specifically to this genus [56].

4.2. Variations in Seed Shape Related to Fruit Development

The relationships between seed shape and possible ecological, functional, and evolutionary correlation have been less studied, mainly due to the difficulty of accurately defining and quantifying seed shape [58]. Seed shape represents a remarkable feature since it maximizes the efficiency of packing, dispersal, landing, and seedlings establishment [1,10]. The number of seeds per fruit was positively correlated to the number of ovules for many Fabaceae species [59]. Recently, the number of seeds is also strongly correlated even with the flower size [60]. Therefore, the final seed shape depends on the number of ovules and their distribution within the ovary, hence, the proximity among ovules during their development. Seed shape is also related to the structure of mature fruits that may, themselves, be similar to geometric figures. However, this aspect has received more attention from an informational point of view than strictly academic in the literature [61]. The seeds are closely bound within the fruits, and fruit shape might determine the final seed shape for many genera.
For some plants, seeds have different shapes depending on their position within the mature fruit. A notable example corresponds to the maize (Zea mays L., Poaceae), in which the seeds from the most distal row have a more spherical shape than those that remain immersed in the cob. In other cases, seeds also adopt the shape of different types of polyhedrons, whose silhouettes in bi-dimensional images are polygons, or their shape resembles what is known as “lune” (moon). In geometry, lunes are plane figures bounded by two circular arcs of unequal radium [62]. The seeds of Peganum harmala L. (Nitrariaceae) represent a remarkable example of these lune-like and polygonal shapes of the seeds within the same fruit (see Figure 6).

5. Variations in Seed Shape Related to Environmental Adaptations

Variation in seed shape occurs along all taxonomic levels, and fruit and ovary development could be considered important factors on the origin of the shape variations in a given species, as we have reported in the previous section, but not the only ones. On the one hand, different seed morphotypes characterized by different aspect ratios (AR) corresponding to the ratio length/width have been observed in wild populations of Silene diclinis (Lag.) M. Laínz (Caryophyllaceae) [5], Echinocactus platyacanthus Link & Otto (Cactaceae) [33], and diverse species of Capparis Tourn. ex L. (Capparaceae) [27] (data not shown). On the other hand, the process of plant cultivation during hundreds of generations in wheat (Triticum L., Poaceae) has resulted in more rounded seed forms. The old cultivars were characterized by models based on lenses (AR = 3.2), whereas ellipse-based models (AR = 1.8) better define more recent cultivars [34]. Another relevant case corresponded to the remarkable intraspecific variation in seed shape among cultivars of Vitis vinifera L. [31,32].
Many aspects of seed shape can be explained by particular adaptations in some species of the family Hydrangeaceae (Hydrangea integrifolia Hayata, H. barbara (L.) Bernd Schulz) [63], the family Alzateaceae (Alzatea verticillata Ruiz & Pav.), the family Petrosaviaceae (Petrosavia sinii (K.Krause) Gagnep.), and the family Ericaceae (Orthilia secunda (L.) House), whose seeds are fusiform undulated, and resemble the seeds of the family Orchidaceae [64]. These seed forms could be the result of adaptations to seed dispersal. In addition, certain morphological structures of the seed have also been associated with hydrochory and zoochory, as has been reported for the Cactaceae [65].
Seed development includes testa outgrowths, modifications of the funicle, and the incorporation of extra ovular structures, such as the carpel walls in the dispersal units. Some develop plumes (Epilobium ciliatum Raf., Onagraceae; Bombax L., and Gossypium herbaceum L., Malvaceae) that have their origin in the testa, the funiculus (Populus L. and Salix L., Salicaceae), or the carpel walls (Ceiba pentandra (L.) Gaertn, Malvaceae). Other seeds develop wings (Oroxylum indicum (L.) Kurz, Bignoniaceae; Spergularia (Pers.) J.Presl & C.Presl, Caryophyllaceae; Rhinanthus L., Orobanchaceae; Dioscorea Plum. ex L., Dioscoreaceae; Narthecium Huds., Nartheciaceae), and the origin and types of wings are discussed by Stuppy and Kesseler [10]. These structures are mostly related to facilitating their dispersal by air (anemochory).

6. Silene as a Model System for Seed Geometry

Seed images from 95 populations belonging to 52 species of Caryophyllaceae (49 species of Silene and three related species belonging to the genera Atocion Adans. and Viscaria Bernh.) were classified according to the layout of their silhouettes in three groups: smooth, rugose, and echinate [5]. Hereafter, we expose the application of the Fourier analysis to the average silhouettes of representative seeds for each of these three groups and a description of their general morphological properties. Figure 7 shows the images used in the analysis, which correspond to the average silhouettes of the species S. apetala, S. conica, and S. dioica (named hereafter S. apetala AJ283, S. conica AJ300 and S. dioica Pol., respectively). Each one was calculated from 20 seed images of a specific population of the corresponding species in both dorsal and lateral views.
All the silhouettes resemble some geometric models previously described for this genus [5,6,7,8,9], except for the dorsal silhouette of S. apetala AJ283 (Figure 8). Models LM5, LM1, and LM2 resemble, respectively, the lateral views of S. apetala AJ283, S. conica AJ300, and S. dioica Pol.; while models DM5 and DM3 resemble the dorsal views of S. conica AJ300 and S. dioica Pol., respectively.
Fourier analysis provided new models for the quantitative description of seed imaging. The models can be estimated both for seed images that do not resemble known geometric figures, such as the average seed silhouette of S. apetala AJ283 in their dorsal views (Figure 7 and Figure 8), and also for seed images that do not resemble accurately enough the available models. An equation fitting convex images, like the average dorsal silhouette of S. dioica Pol. (Figure 8), can be obtained with a reduced number of harmonics. On the other hand, equations fitting more complex curves, like the average dorsal silhouettes of the seeds of S. conica AJ300 and S. apetala AJ283, require more harmonics.

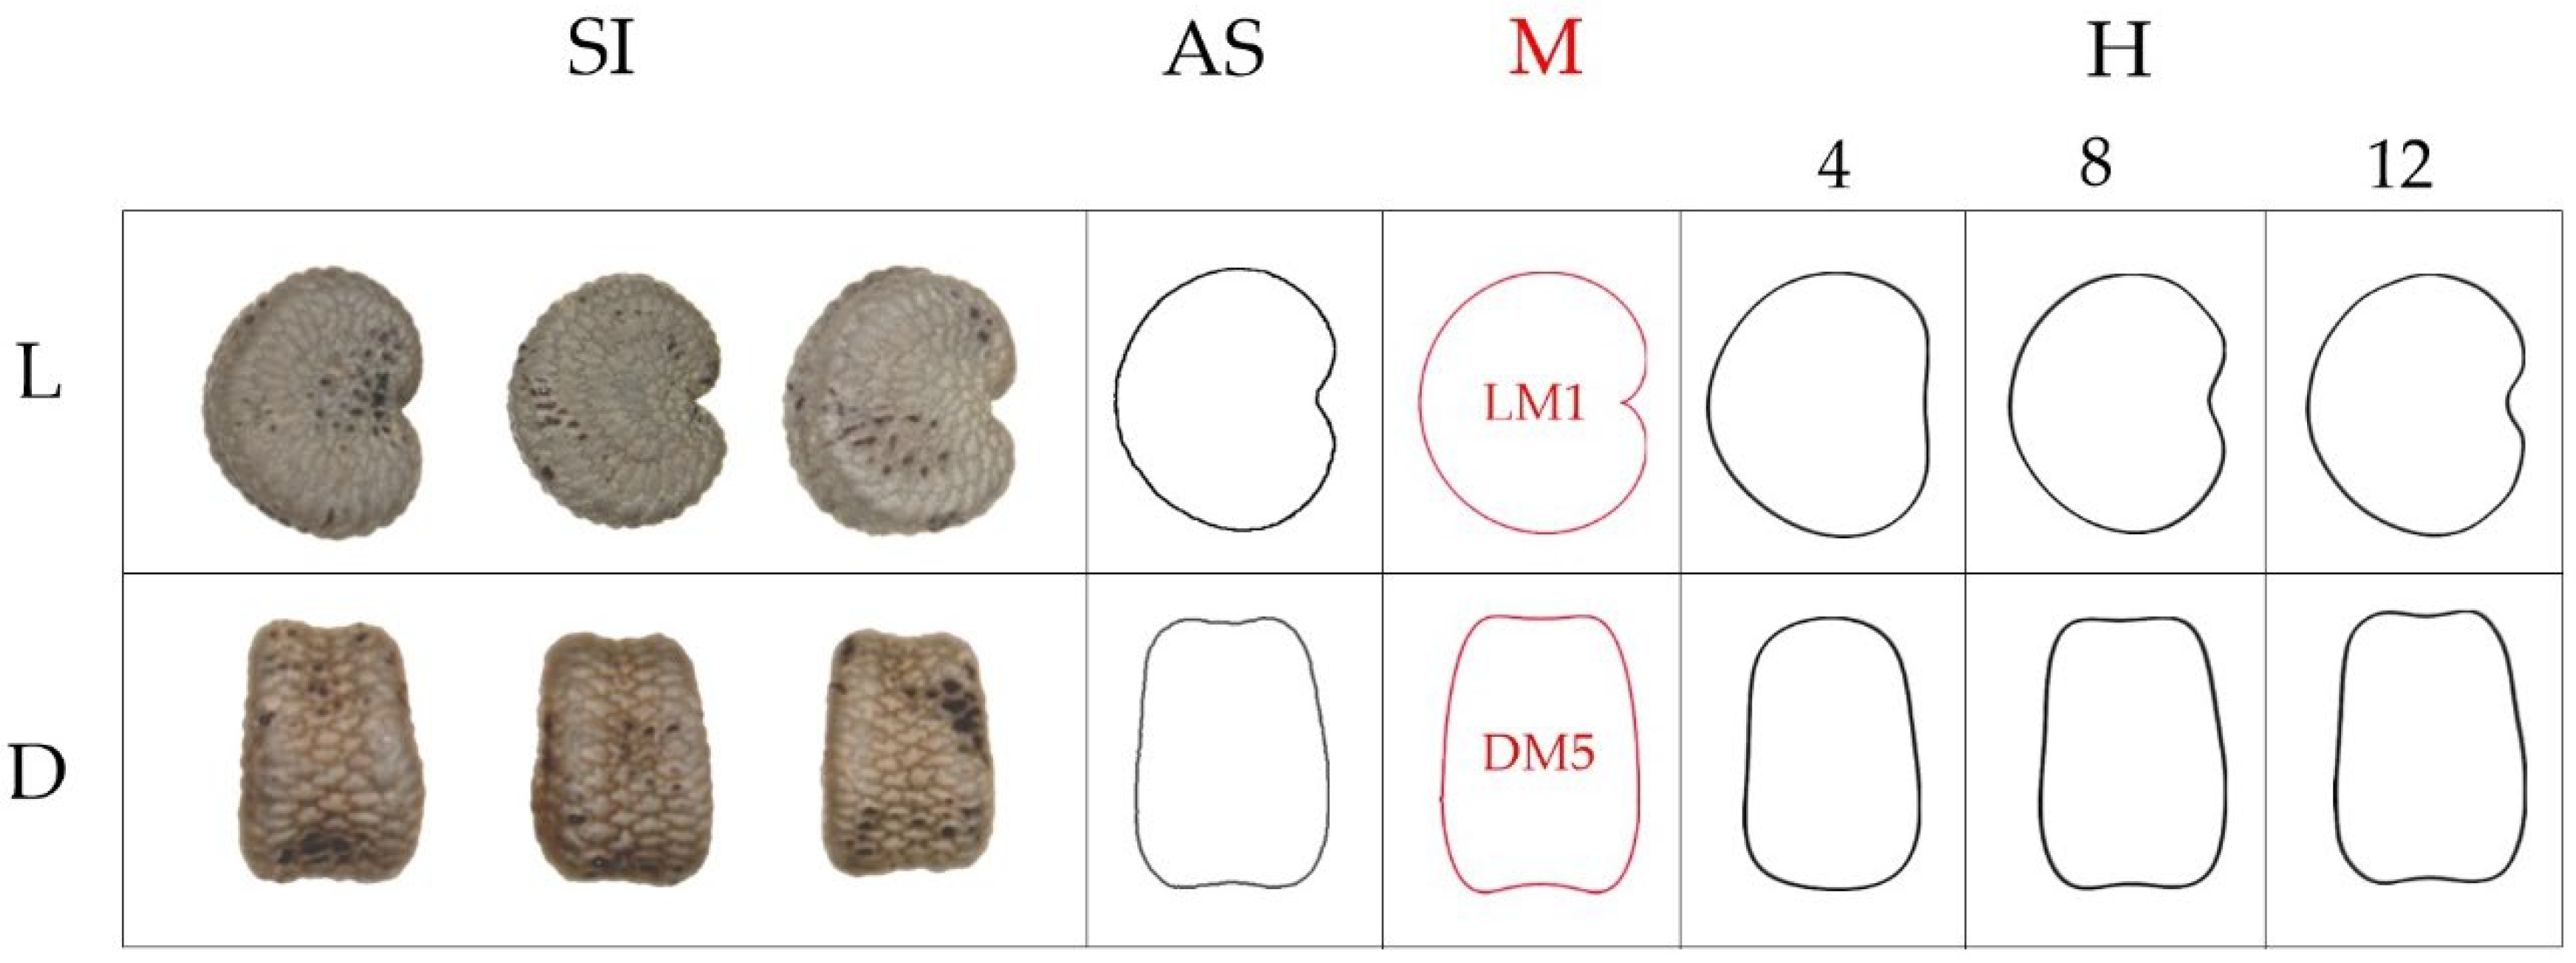
6.1. Fourier Analysis of Seeds: Calculation of Equations Corresponding to New Models

After applying Fourier analysis, we got the equations adjusting to the average silhouettes of the dorsal and lateral views of S. apetala AJ283, S. conica AJ300, and S. dioica Pol. Several points between 100 and 200 were taken along the silhouettes, and the corresponding Fourier equations were obtained. Figure 9 shows the results of the Fourier analysis for the lateral and dorsal seed views of the sample S. apetala AJ283, using 4, 12, and 20 harmonics. With 12 harmonics, the resulting figures reproduced well the lateral views of the seeds, while in the dorsal views, higher similarity with the average silhouette was obtained with 20 harmonics (Figure 9).
In the case of the sample S. conica AJ300, the results of the Fourier analysis yielded reasonably good models with 12 harmonics for both the lateral and the dorsal views (Figure 10).
In S. dioica Pol., the Fourier analysis achieved remarkably good models with only 4 harmonics for the dorsal and lateral views (Figure 11); however, for the lateral view, the adjustment notably improved up to 12 harmonics.
The seeds of S. dioica Pol. could be represented by dorsal and lateral models (named DM3 and LM2, respectively, Figure 11), and similarly, those of S. conica AJ300 by the models DM5 and LM1 (Figure 10). However, for S. apetala AJ283, good modeling resulted from the combination of the lateral model LM5 and a new dorsal model (DM) (Figure 9). In the first case, seeds of S. dioica Pol. are convex in both views, whereas the seeds of S. conica AJ300 present concavities in both the lateral and dorsal views. Finally, the sample of S. apetala AJ283 is characterized by marked concavities, especially on the dorsal view, and a good model could be obtained by Fourier transform analysis with 20 harmonics.

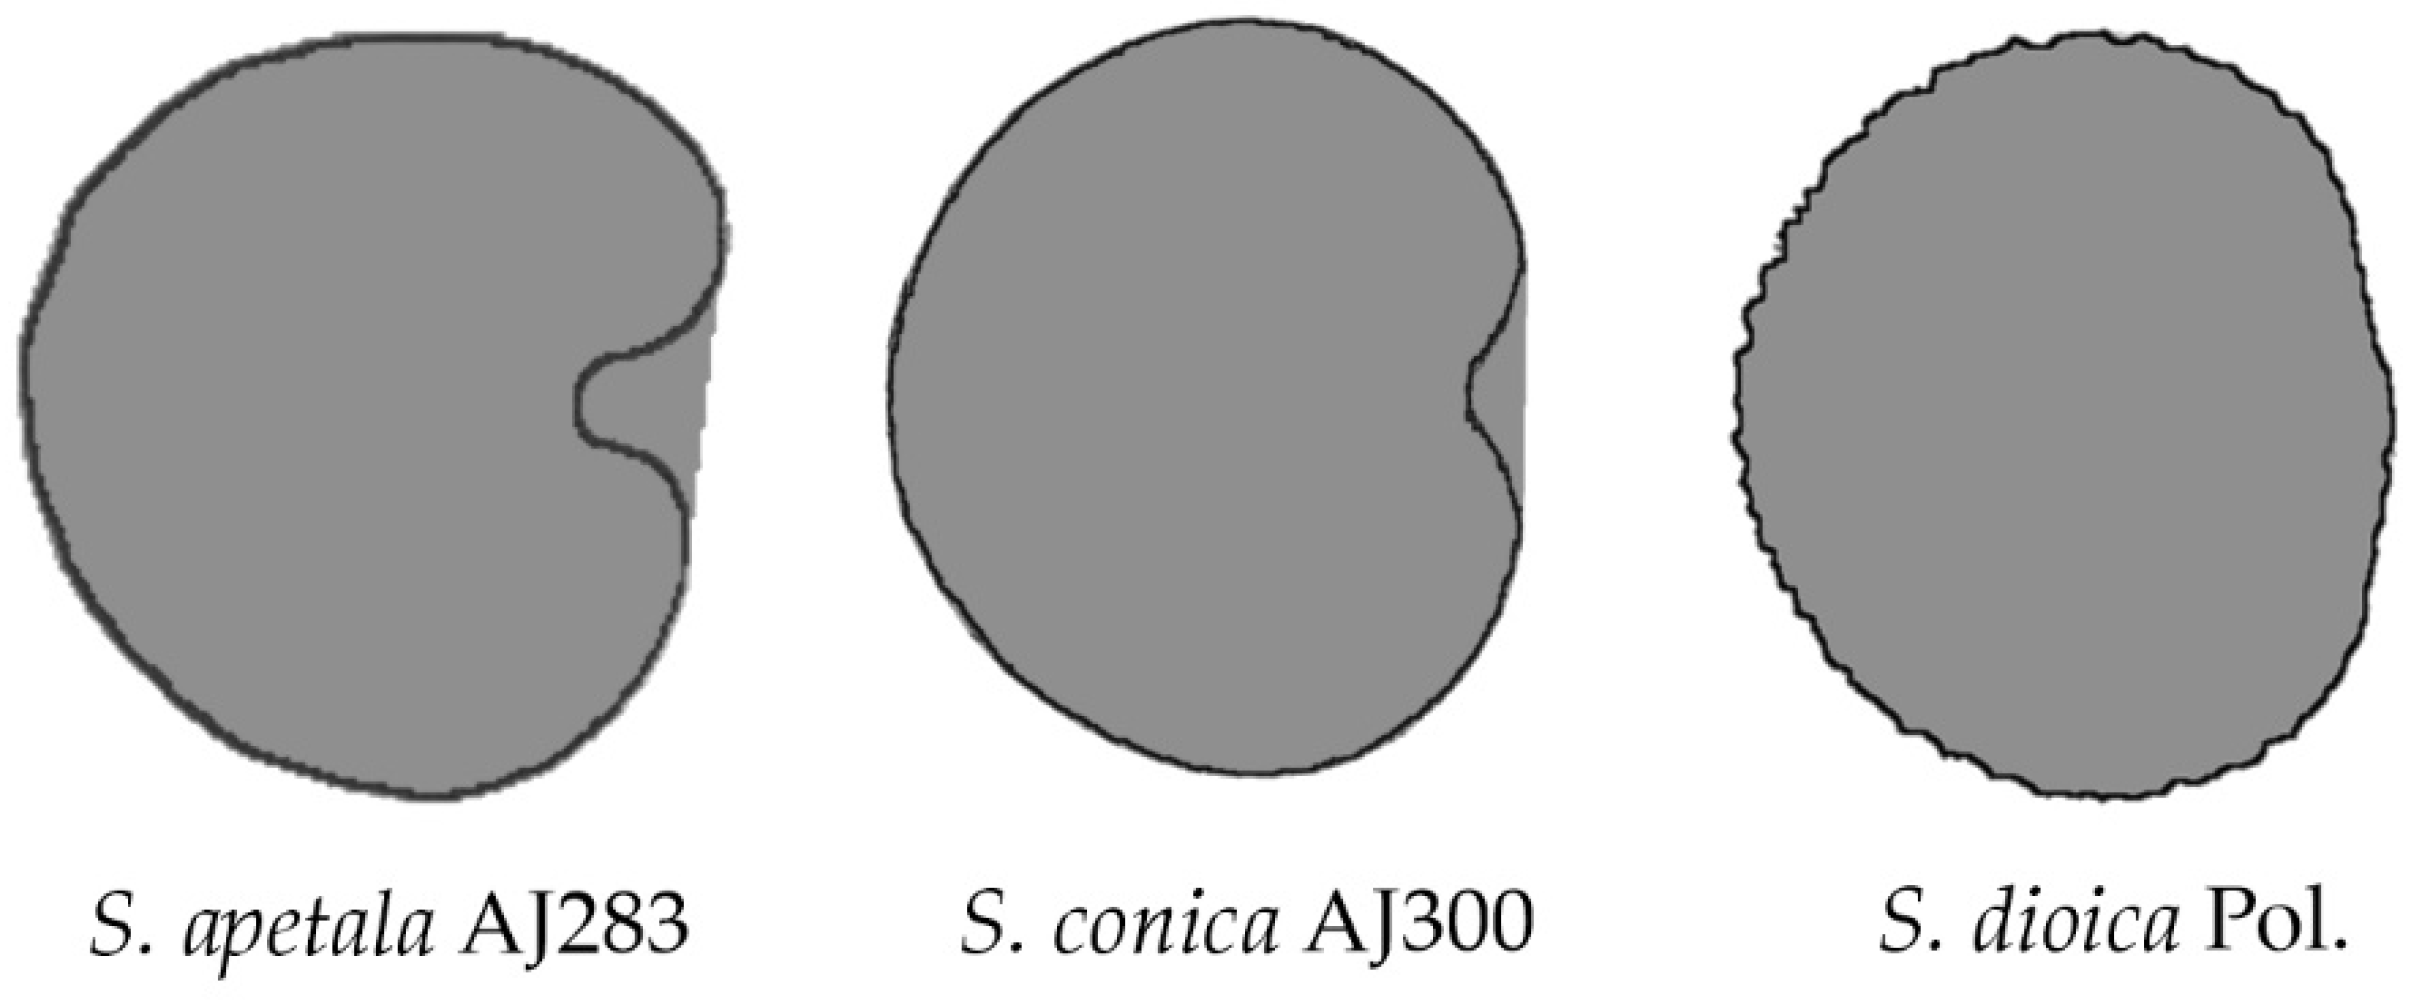
6.2. A Classification According to the Geometric Properties of the Seeds

Concerning the classification of Silene seeds in three groups (smooth, rugose, and echinate [5]), differences between these groups were found in all the measurements (area, perimeter, length, width, aspect ratio, circularity, roundness, and solidity). Solidity was the most conserved index among them, being unique with no differences for the lateral views in these three groups of seeds. Regarding the dorsal view, the highest values of solidity corresponded to the species with echinate seeds (most species of this group belong to S. subg. Behenantha) and the lowest solidity to the smooth seeds (most of the species of this group are included in S. subg. Silene). These higher solidity values were associated with the rounded shape of seeds and the lack of a dorsal channel that was notably marked in the smooths seeds [5,7].
Figure 12 represents the silhouettes of the dorsal view for the smooth, rugose, and echinate seeds. The images show the average silhouettes of 20 seeds from one species population with their corresponding convex hull superimposed.
While there is a remarkable difference between the average silhouette and the convex hull in S. apetala, there is little difference between S. conica and S. dioica. The values of solidity corresponding to the three sample seeds are 0.834 (S. apetala), 0.972 (S. conica), and 0.968 (S. dioica). In the same images, the values of the ratio perimeter of the convex hull/ perimeter are 0.852 (S. apetala), 0.967 (S. conica), and 0.914 (S. dioica). The values of solidity obtained here agree with the results obtained for the populations of different species [5]. At the same time, the calculations of the perimeter ratio are shown here for the first time. Table 1 contains the mean value for solidity and perimeter ratio in the dorsal views of three individual seeds of each species. Statistics were done on IBM SPSS Statistics v28 (SPSS 2021) and R software v. 4.1.2 [66]. Non-parametric Kruskal–Wallis tests were applied to compare populations, followed by stepwise step-down comparisons by the ad hoc procedure developed by Campbell and Skillings [67]; p values inferior to 0.05 were considered significant. The coefficient of variation was calculated as CVtrait = standard deviation trait/mean trait × 100 [68].
In the lateral views (Figure 13), values of solidity for three sample seeds are 0.949 for S. apetala AJ283, 0.970 for S. conica AJ300, and 0.961 for S. dioica Pol. (Table 2). Meanwhile, the values of the ratio perimeter of the convex hull/ perimeter are 0.907 (S. apetala AJ283), 0.864 (S. conica AJ300), and 0.803 (S. dioica Pol.), and there are differences both in solidity as well as in the perimeter ratio (Table 2). Here, the protrusions are also reduced by the obtention of the average silhouette, and the effect is more notable in the seeds of S. dioica Pol. than in S. apetala AJ283 or S. conica AJ300.
In summary and regarding dorsal views, a notable concavity was observed in the basal side of the silhouettes of S. apetala AJ283, corresponding with the dorsal fold expressed by the term “dorso canaliculata”, being this characteristic predominant in the group of smooth seeds, except for S. littorea [5]. Thus, a concave region corresponding to the dorsal side of the seed is more pronounced in S. apetala AJ283, intermediate in S. conica AJ300, and does not exist in S. dioica Pol. and the other members of S. sect. Melandrium, whose dorsal views are convex [5].

7. Conclusions

The shape of seeds is related to ovule types, fruit shape, and developmental conditions. Quantification of seed shape is required for the phenotypical characterization in genetics as well as for the application of seed morphology in taxonomy. An accurate and quantitative form description can be achieved by comparison with geometric figures. Silene seeds show inter-specific variation and constitute a good model for studying morphological variation. Models used for Silene include geometric curves derived from the cardioid, but in some cases (dorsal views), the seeds have a conserved shape that does not fit these models. Images obtained from Fourier Transform analysis can be used as models for seeds that don’t adjust well to canonical geometric figures. Morphological aspects of their silhouettes can be of interest in taxonomy. Nevertheless, seeds are tri-dimensional figures, and the Fourier transform is a step to obtain an accurate representation of seeds but not the final step in the process.

Supplementary Materials

A Mathematica code for obtaining the Fourier expansion and the corresponding figure from any set of points approximating a closed-plane curve is available at: https://zenodo.org/record/7122729#.YzUyhUxBxD8; accessed on 12 April 2021.

Author Contributions

Conceptualization, E.C., J.L.R.-L., Á.T. and A.J.; methodology, E.C. and J.J.M.-G.; software, E.C., J.L.R.-L., Á.T., J.J.M.-G.; validation, E.C., J.L.R.-L., D.G.d.P., J.J.M.-G., B.J., Á.T. and A.J.; investigation, E.C., J.L.R.-L., D.G.d.P., J.J.M.-G., B.J., Á.T. and A.J.; software, E.C., J.L.R.-L., J.J.M.-G. and Á.T.; validation, E.C., J.L.R.-L., D.G.d.P., J.J.M.-G., B.J., Á.T. and A.J.; resources, E.C., J.L.R.-L., D.G.d.P., J.J.M.-G., B.J., Á.T. and A.J.; data curation, J.J.M.-G.; writing—original draft preparation, E.C.; writing—review and editing, E.C., J.L.R.-L., D.G.d.P., J.J.M.-G., B.J., Á.T. and A.J.; visualization, E.C., J.L.R.-L., J.J.M.-G. and Á.T.; supervision, E.C. All authors have read and agreed to the published version of the manuscript.

Funding

Project “CLU-2019-05-IRNASA/CSIC Unit of Excellence”, funded by the Junta de Castilla y León and co-financed by the European Union (ERDF “Europe drives our growth”).

Data Availability Statement

Not applicable.

Conflicts of Interest

The authors declare no conflict of interest.

References

  1. Harper, J.L.; Lovell, P.H.; Moore, K.G. The shapes and size of seeds. Ann. Rev. Ecol. Syst. 1970, 1, 327–356. [Google Scholar] [CrossRef]
  2. Moles, A.T.; Ackerly, D.D.; Tweddle, J.C.; Dickie, J.B.; Smith, R.; Leishman, M.R.; Mayfield, M.M.; Pitman, A.; Wood, J.T.; Westoby, M.; et al. Global patterns in seed size. Glob. Ecol. Biogeogr. 2007, 16, 109–116. [Google Scholar] [CrossRef]
  3. Ganhão, E.; Dias, L.S. Seed Volume Dataset—An ongoing inventory of seed size expressed by volume. Data 2019, 4, 61. [Google Scholar] [CrossRef] [Green Version]
  4. Cervantes, E.; Martín Gómez, J.J.; Gutiérrez del Pozo, D.; Silva Dias, L. An angiosperm species dataset reveals relationships between seed size and two-dimensional shape. Horticulturae 2019, 5, 71. [Google Scholar] [CrossRef] [Green Version]
  5. Martín-Gómez, J.J.; Rodríguez-Lorenzo, J.L.; Juan, A.; Tocino, Á.; Janousek, B.; Cervantes, E. Seed morphological properties related to taxonomy in Silene species. Taxonomy 2022, 2, 298–323. [Google Scholar] [CrossRef]
  6. Martín-Gómez, J.J.; Rewicz, A.; Rodríguez-Lorenzo, J.L.; Janoušek, B.; Cervantes, E. Seed morphology in Silene based on geometric models. Plants 2020, 9, 1787. [Google Scholar] [CrossRef]
  7. Juan, A.; Martín-Gómez, J.J.; Rodríguez-Lorenzo, J.L.; Janoušek, B.; Cervantes, E. New techniques for seed shape description in Silene species. Taxonomy 2022, 2, 1–19. [Google Scholar] [CrossRef]
  8. Rodríguez-Lorenzo, J.L.; Martín-Gómez, J.J.; Tocino, Á.; Juan, A.; Janoušek, B.; Cervantes, E. New geometric models for shape quantification of the dorsal view in seeds of Silene species. Plants 2022, 11, 958. [Google Scholar] [CrossRef]
  9. Martín-Gómez, J.J.; Porceddu, M.; Bacchetta, G.; Cervantes, E. Seed morphology in species from the Silene mollissima aggregate (Caryophyllaceae) by comparison with geometric models. Plants 2022, 11, 901. [Google Scholar] [CrossRef]
  10. Stuppy, W.; Kesseler, R. Seeds: Time Capsules of Life; Papadakis Publishers: London, UK, 2006. [Google Scholar]
  11. Del Pozo, D.G.; Martín-Gómez, J.J.; Tocino, Á.; Cervantes, E. Seed geometry in the Arecaceae. Horticulturae 2020, 6, 64. [Google Scholar] [CrossRef]
  12. Cervantes, E.; Martín-Gómez, J.J.; Gutiérrez Del Pozo, D.; Tocino, Á. Seed geometry in the Vitaceae. Plants 2021, 10, 1695. [Google Scholar] [CrossRef] [PubMed]
  13. Cervantes, E.; Martín Gómez, J.J. Seed shape description and quantification by comparison with geometric models. Horticulturae 2019, 5, 60. [Google Scholar] [CrossRef] [Green Version]
  14. Hannachi, H.; Martín-Gómez, J.J.; Saadaoui, E.; Cervantes, E. Stone diversity in wild and cultivated olive trees (Olea europaea L.). Dendrobiology 2017, 77, 19–32. [Google Scholar] [CrossRef]
  15. Cervantes, E.; Martín-Gómez, J.J. Seed shape quantification in the order Cucurbitales. Mod. Phytomorphol. 2018, 12, 1–13. [Google Scholar]
  16. Martín-Gómez, J.J.; Saadaoui, E.; Cervantes, E. Seed shape of castor bean (Ricinus communis L.) grown in different regions of Tunisia. J. Agric. Ecol. 2016, 8, 1–11. [Google Scholar]
  17. Saadaoui, E.; Martín-Gómez, J.J.; Bouazizi, R.; Ben Romdhane, C.; Grira, M.; Abdelkabir, S.; Khouja, M.L.; Cervantes, E. Phenotypic variability and seed yield of Jatropha curcas L. Introducen to Tunisia. Acta Bot. Mex. 2015, 110, 119–134. [Google Scholar] [CrossRef] [Green Version]
  18. Shamrov, I.I. Diversity and typification of ovules in flowering plants. Wulfenia 2018, 25, 81–109. [Google Scholar]
  19. Davis, G.L. Systematic Embryology of the Angiosperms; John Wiley &Sons, Inc.: Hoboken, NJ, USA; London, UK; Sydney, Australia, 1966; p. 528. [Google Scholar]
  20. Johri, B.M.; Ambegaokar, K.B.; Srivastava, P.S. Comparative Embryology of Angiosperms; Springer: Heidelberg, Germany, 1992; Volume 1. [Google Scholar]
  21. Martin, A.C. The comparative internal morphology of seeds. Am. Midl. Nat. 1946, 36, 513–660. [Google Scholar] [CrossRef]
  22. Read, D.W. From multivariate to qualitative measurement: Representation of shape. Hum. Evol. 1990, 5, 417–429. [Google Scholar] [CrossRef]
  23. Gray, A. Modern Differential Geometry of Curves and Surfaces with Mathematica; CRC Press: Boca Raton, FL, USA, 1998; pp. 163–165. [Google Scholar]
  24. Calero, E.; West, S.H.; Hinson, K. Water absorption of soybean seeds and associated causal factors. Crop Sci. 1981, 21, 926–933. [Google Scholar] [CrossRef]
  25. Cervantes, E.; Martín Gómez, J.J.; Saadaoui, E. Updated methods for seed shape analysis. Scientifica 2016, 2016, 5691825. [Google Scholar] [CrossRef] [PubMed] [Green Version]
  26. Cervantes, E.; Martin-Gómez, J.J.; Chan, P.K.; Gresshoff, P.M.; Tocino, A. Seed shape in model legumes: Approximation by a cardioid reveals differences in ethylene insensitive mutants of Lotus japonicus and Medicago truncatula. J. Plant Physiol. 2012, 169, 1359–1365. [Google Scholar] [CrossRef] [PubMed] [Green Version]
  27. Saadaoui, E.; Martín-Gómez, J.J.; Cervantes, E. Intraspecific variability of seed morphology in Capparis spinosa L. Acta Biol. Crac. Ser. Bot. 2013, 55, 99–106. [Google Scholar] [CrossRef]
  28. Saadaoui, E.; Martín-Gómez, J.J.; Tlili, E.N.; Khaldi, A.; Cervantes, E. Effect of climate in seed diversity of wild Tunisian Rhus tripartita (Ucria) Grande. J. Adv. Biol. Biotechnol. 2017, 13, 1–10. [Google Scholar] [CrossRef] [Green Version]
  29. Cervantes, E.; Martín, J.J.; Ardanuy, R.; De Diego, J.G.; Tocino, Á. Modeling the Arabidopsis seed shape by a cardioid: Efficacy of the adjustment with a scale change with factor equal to the Golden Ratio and analysis of seed shape in ethylene mutants. J. Plant Physiol. 2010, 167, 408–410. [Google Scholar] [CrossRef]
  30. Martín Gómez, J.J.; Tocino, Á.; Ardanuy, R.; de Diego, J.G.; Cervantes, E. Dynamic analysis of Arabidopsis seed shape reveals differences in cellulose mutants. Acta Physiol. Plant. 2014, 36, 1585–1592. [Google Scholar] [CrossRef]
  31. Martín-Gómez, J.J.; Gutiérrez del Pozo, D.; Ucchesu, M.; Bacchetta, G.; Cabello Sáenz de Santamaría, F.; Tocino, Á.; Cervantes, E. Seed morphology in the Vitaceae based on geometric models. Agronomy 2020, 10, 739. [Google Scholar] [CrossRef]
  32. Cervantes, E.; Martín-Gómez, J.J.; Espinosa-Roldán, F.E.; Muñoz-Organero, G.; Tocino, Á.; Cabello-Sáenz de Santamaría, F. Seed Morphology in Key Spanish Grapevine Cultivars. Agronomy 2021, 11, 734. [Google Scholar] [CrossRef]
  33. Martín-Gómez, J.J.; del Pozo, D.G.; Tocino, Á.; Cervantes, E. Geometric models for seed shape description and quantification in the Cactaceae. Plants 2021, 10, 2546. [Google Scholar] [CrossRef]
  34. Martín-Gómez, J.J.; Rewicz, A.; Goriewa-Duba, K.; Wiwart, M.; Tocino, Á.; Cervantes, E. Morphological description and classification of wheat kernels based on geometric models. Agronomy 2019, 9, 399. [Google Scholar] [CrossRef] [Green Version]
  35. Rohlf, F.J.; Archie, J.W. A comparison of Fourier methods for the description of wing shape in mosquitoes (Diptera: Culicidae). Syst. Zool. 1984, 3, 302–317. [Google Scholar] [CrossRef]
  36. Crampton, J.S. Elliptic Fourier shape analysis of fossil bivalves: Some practical considerations. Letahia 1995, 28, 179–186. [Google Scholar] [CrossRef]
  37. McLellan, T.; Endler, J.A. The relative success of some methods for measuring and describing the shape of complex objects. Syst. Biol. 1998, 47, 264–281. [Google Scholar] [CrossRef]
  38. Iwata, H.; Ebana, K.; Uga, Y.; Hayashi, T.; Jannink, J.L. Genome-wide association study of grain shape variation among Oryza sativa L. germplasms based on elliptic Fourier analysis. Mol. Breed. 2010, 25, 203–215. [Google Scholar] [CrossRef]
  39. Ohsawa, R.; Tsutsumi, T.; Uehara, H.; Namai, H.; Ninomiya, S. Quantitative evaluation of common buckwheat (Fagopyrum esculentum Moench) kernel shape by elliptic Fourier descriptor. Euphytica 1998, 101, 175–183. [Google Scholar] [CrossRef]
  40. Terral, J.; Tabard, E.; Bouby, L.; Ivorra, S.; Pastor, T.; Figueiral, I.; Picq, S.; Chevance, J.-B.; Jung, C.; Fabre, L.; et al. Evolution and history of grapevine (Vitis vinifera) under domestication: New morphometric perspectives to understand seed domestication syndrome and reveal origins of ancient European cultivars. Ann. Bot. 2010, 105, 443–455. [Google Scholar] [CrossRef]
  41. Mebatsion, K.K.; Paliwal, J.; Jayas, D.S. Evaluation of variations in the shape of grain types using principal components analysis of the elliptic Fourier descriptors. Comput. Electron. Agric. 2012, 80, 63–70. [Google Scholar] [CrossRef]
  42. Orrù, M.; Grillo, O.; Venora, G.; Bacchetta, G. Computer vision as a method complementary to molecular analysis: Grapevine cultivar seeds case study. C. R. Biol. 2012, 335, 602–615. [Google Scholar] [CrossRef]
  43. Orrù, M.; Grillo, O.; Lovicu, G.; Venora, G.; Bacchetta, G. Morphological characterisation of Vitis vinifera L. seeds by image analysis and comparison with archaeological remains. Veg. Hist. Archaeobot. 2013, 22, 231–242. [Google Scholar] [CrossRef]
  44. Kuhl, F.P.; Giardina, C.R. Elliptic Fourier features of a closed contour. Comput. Graph. Image Process. 1982, 18, 236–258. [Google Scholar] [CrossRef]
  45. Cervantes, E.; Martín-Gómez, J.J.; Espinosa-Roldán, F.E.; Muñoz-Organero, G.; Tocino, Á.; Cabello Sáenz de Santamaría, F. Seed apex curvature in key Spanish grapevine cultivars. Vitic. Data J. 2021, 3, e66478. [Google Scholar] [CrossRef]
  46. Noriega, A.; Cervantes, E.; Tocino, Á. Ethylene responses in Arabidopsis seedlings include the reduction of curvature values in the root cap. J. Plant Physiol. 2008, 165, 960–966. [Google Scholar] [CrossRef] [PubMed]
  47. Tocino, A.; Cervantes, E. Curvature analysis reveals new functions for ethylene signalling pathway in shape determination of seed poles and root apices. Plant Signal. Behav. 2008, 3, 362–366. [Google Scholar] [CrossRef]
  48. Noriega, A.; Cervantes, E.; Tocino, Á. Hydrogen peroxide treatment results in reduced curvature values in the Arabidopsis root apex. J. Plant Physiol. 2009, 166, 554–558. [Google Scholar] [CrossRef]
  49. Yamada, T.; Tobe, H.; Imaichi, R.; Kato, M. Developmental morphology of the ovules of Amborella trichopoda (Amborellaceae) and Chloranthus serratus (Chloranthaceae). Bot. J. Linn. Soc. 2001, 137, 277–290. [Google Scholar] [CrossRef]
  50. Tobe, H. The embryology of angiosperms: Its broad application to the systematic and evolutionary study. Bot. Mag. 1989, 102, 351–367. [Google Scholar] [CrossRef]
  51. Simpson, M.G. Plant Systematics; Academic Press: Cambridge, MA, USA, 2019; pp. 567–582. [Google Scholar]
  52. Rudall, P.J. Evolution and patterning of the ovule in seed plants. Biol. Rev. 2021, 96, 943–960. [Google Scholar] [CrossRef]
  53. Bornand, A.D.V.; Beltramini, V.S. Caracterización morfológica de la semilla de Hibiscus cannabinus (Malvaceae) e influencia del tiempo de almacenamiento sobre la viabilidad. Lilloa 2021, 58, 51–62. [Google Scholar] [CrossRef]
  54. Wang, L.; Zhao, Y.Y.; Liu, J.X. Embryology of Myosoton and Stellaria and its taxonomic significance (Caryophyllaceae). Phytotaxa 2017, 306, 124–134. [Google Scholar] [CrossRef]
  55. Dransfield, J.; Uhl, N.W.; Asmussen, C.B.; Baker, W.J.; Harley, M.M.; Lewis, C.E. Genera Palmarum—The Evolution and Classification of the Palms; Royal Botanic Gardens, Kew: Richmond, UK, 2008; pp. 36–37. [Google Scholar]
  56. Archibald, E.E.A. The development of the ovule and seed of jointed cactus (Opuntia aurantiaca Lindley). S. Afr. J. Sci. 1939, 36, 195–211. [Google Scholar]
  57. Kirkbride, J.H., Jr.; Gunn, C.R.; Dallwitz, M.J. 2000 Onwards. Family Guide for Fruits and Seeds: Descriptions, Illustrations, Identification, and Information Retrieval. Available online: Delta-intkey.com (accessed on 12 April 2021).
  58. Dias, L.S.; Dias, A.S. The relationships between shape and size of diaspores depends on being seeds or fruits. Horticulturae 2019, 5, 65. [Google Scholar] [CrossRef] [Green Version]
  59. López, J.; Devesa, J.A.; Ortega-Olivencia, A.; Ruiz, T. Production and morphology of fruit and seeds in Genisteae (Fabaceae) of south-west Spain. Bot. J. Linn. Soc. 2000, 132, 97–120. [Google Scholar] [CrossRef] [Green Version]
  60. Bawa, K.S.; Ingtv, T.; Revll, L.J.; Shivaprakash, K.N. Correlated evolution of flower size and seed number in flowering plants (monocotyledons). Ann. Bot. 2019, 123, 181–190. [Google Scholar] [CrossRef] [PubMed] [Green Version]
  61. Stuppy, W.; Kesseler, R. Fruit: Edible, Inedible, Incredible; Papadakis Publisher: Newbury, UK; Berkshire: Winterbourne, UK, 2008; p. 264. [Google Scholar] [CrossRef]
  62. Weisstein, E.W. “Lune.” From MathWorld—A Wolfram Web Resource. Available online: https://mathworld.wolfram.com/Lune.html (accessed on 12 April 2021).
  63. Hufford, L. Seed morphology of Hydrangeaceae and its phylogenetic implications. Int. J. Plant Sci. 1995, 156, 555–580. Available online: https://www.jstor.org/stable/2475075 (accessed on 12 April 2021). [CrossRef]
  64. Diantina, S.; McGill, C.; Millner, J.; Nadarajan, J.; Pritchard, H.W.; Clavijo McCormick, A. Comparative seed morphology of Tropical and Temperate orchid species with different growth habits. Plants 2020, 9, 161. [Google Scholar] [CrossRef] [Green Version]
  65. Bregman, R. Forms of seed dispersal in Cactaceae. Acta Bot. Neerl. 1988, 37, 395–402. [Google Scholar] [CrossRef]
  66. R Core Team. R: A Language and Environment for Statistical Computing; R Foundation for Statistical Computing: Vienna, Austria, 2020. [Google Scholar]
  67. Campbell, G.; Skillings, J.H. Nonparametric Stepwise Multiple Comparison Procedures. J. Am. Stat. Assoc. 1985, 80, 998–1003. [Google Scholar] [CrossRef]
  68. Sokal, R.R.; Braumann, C.A. Significance Tests for Coefficients of Variation and Variability Profiles. Syst. Zool. 1980, 29, 50. [Google Scholar] [CrossRef]
Figure 1. (Left) The image of a seed of A. natalia (Balslev & A.J. Hend.) Barfod (Arecaceae). (Right) the corresponding convex Hull.
Horticulturae 08 00974 g001
Figure 2. To obtain a Fourier equation corresponding to the silhouette of a seed of Aphandra natalia reference points are taken along the seed profile, and the information related to the coordinates corresponding to the points is transformed into Fourier coefficients. The entire process is done in Mathematica 12.3®. From left to right: The seed with points marked (bar equals 0.5 cm) and the curves corresponding to Fourier equations with 2, 6, 10, and 20 harmonics, respectively.
Horticulturae 08 00974 g002
Figure 3. Superposition of the convex Hull with the silhouette image of A. natalia (in red, left) and with the silhouette obtained with 20 harmonics (right). Partial concavities correspond with small white areas between the silhouette and the convex Hull.
Horticulturae 08 00974 g003
Figure 4. (Left) The silhouette of the seed image of A. natalia given in Figure 1 with points marked on it. The series of points start in the red point marked and go counter-clockwise. (Right) curvature values corresponding to the points along the silhouette.
Horticulturae 08 00974 g004
Figure 5. Seed images and their corresponding silhouettes from species with diverse ovule types. Above: Orthotropous: Piper nudilimbum C.DC. (Piperaceae); Chloranthus erectus (Buch.-Ham.) Verdc. (Chloranthaceae). Anatropous: Cabomba aquatica Aubl. (Cabombaceae); Canna indica L. (Cannaceae). Below: Amphitropous: Stellaria media (L.) Vill. (Caryophyllaceae). Campylotropous: Hibiscus sabdariffa L. (Malvaceae); Silene noctiflora L. (Caryophyllaceae); Gypsophila elegans M. Bieb. (Caryophyllaceae). The images were obtained and modified from [57], except S. media (https://plants.usda.gov/home/plantProfile?symbol=STME2; accessed on 12 April 2021).
Horticulturae 08 00974 g005
Figure 6. Seed silhouettes with lune-like and polygonal shapes of Peganum harmala L. (Nitrariaceae).
Horticulturae 08 00974 g006
Figure 7. Dorsal and lateral average silhouettes for the images of 20 seeds of S. apetala AJ283, S. conica AJ300, and S. dioica Pol.
Horticulturae 08 00974 g007
Figure 8. Dorsal and lateral average silhouettes for the images of 20 seeds of Silene apetala AJ283, S. conica AJ300, and S. dioica Pol. with the corresponding models superimposed in red. Models LM5, LM1, and LM4 resemble, respectively, the lateral views of S. apetala AJ283, S. conica AJ300, and S. dioica Pol. DM5 and DM3 resemble the dorsal views of S. conica AJ283 and S. dioica Pol. The dorsal view of S. apetala AJ283 does not adjust to any model described.
Horticulturae 08 00974 g008
Figure 9. Silhouettes of seeds of S. apetala AJ283. L: Lateral view; D: Dorsal view; SI: Seed image; AS: Average silhouette of 20 seeds; M: Model calculated, LM5; H: Curves obtained by Fourier equations with 4, 12, and 20 harmonics.
Horticulturae 08 00974 g009
Figure 10. Silhouettes of seeds of S. conica AJ300. L: Lateral view; D: Dorsal view; SI: Seed image; AS: Average silhouette of 20 seeds; M: Models calculated LM1 and DM5; H: Curves obtained by Fourier equations with 4, 8, and 12 harmonics.
Horticulturae 08 00974 g010
Figure 11. Silhouettes of seeds of S. dioica Pol. L: Lateral view; D: Dorsal view; SI: Seed image; AS: Average silhouette of 20 seeds; M: Models calculated LM2 and DM3; H: Curves obtained by Fourier equations with 4, 8, and 12 harmonics.
Horticulturae 08 00974 g011
Figure 12. Average silhouettes for the dorsal views of 20 seeds of S. apetala AJ283, S. conica AJ300, and S. dioica Pol. with the corresponding convex hull superimposed.
Horticulturae 08 00974 g012
Figure 13. Average silhouettes for the lateral views of 20 seeds of S. apetala AJ283 (smooth seed), S. conica AJ300 (rugose seed), and S. dioica Pol. (echinate seed), with the corresponding convex hull.
Horticulturae 08 00974 g013
Table 1. Values of solidity and perimeter ratio (perimeter of the convex hull/ perimeter of the image) in three seeds for the dorsal views of the seed images of S. apetala AJ283, S. conica AJ300, and S. dioica Pol. Values marked with the same superscript letter in each column correspond to populations that do not differ significantly at p < 0.05 (Campbell and Skillings’s test). N indicates the number of seeds analyzed.
NPerimeterConvex Hull PerimeterPerimeter RatioSolidity
S. apetala AJ28331.01 b (6.02)0.86 a (6.02)0.852 a (0.76)0.834 a (1.78)
S. conica AJ30030.88 a (2.78)0.85 a (2.96)0.967 c (0.31)0.972 b (0.06)
S. dioica Pol.31.13 c (1.90)1.03 b (1.10)0.914 b (1.54)0.968 b (0.32)
Table 2. Values of solidity and perimeter ratio (perimeter of the convex hull/ perimeter of the image) in the average silhouettes and as mean of three seeds for the lateral views of the seed images of S. apetala AJ283, S. conica AJ300 and S. dioica Pol. Values marked with the same superscript letter in each column correspond to populations that do not differ significantly at p < 0.05 (Campbell and Skillings’s test). N indicates the number of seeds analyzed.
NPerimeterConvex Hull PerimeterPerimeter RatioSolidity
S. apetala AJ28330.53 a (1.31)0.49 a (1.55)0.924 b (0.33)0.949 a (0.69)
S. conica AJ30030.90 b (0.61)0.88 b (1.00)0.975 c (1.01)0.970 c (0.16)
S. dioica Pol.31.25 c (3.51)1.12 c (4.02)0.897 a (1.17)0.961 b (0.24)
Publisher’s Note: MDPI stays neutral with regard to jurisdictional claims in published maps and institutional affiliations.

