
Effects of a Single Blade Incidence Angle Offset on Adjacent Blades in a Linear Cascade
by
 , , , and
Jiří Fürst
1,2,* ,
,
Martin Lasota
3,
Jan Lepicovsky
2,
Josef Musil
1,2,
Jan Pech
2,
Petr Šidlof
3 and
David Šimurda
2 1
Faculty of Mechanical Engineering, Czech Technical University in Prague, Karlovo Nám. 13, 121 35 Prague 2, Czech Republic
2
Institute of Thermomechanics, Czech Academy of Sciences, Dolejškova 1402/5, 182 00 Prague 8, Czech Republic
3
Faculty of Mechatronics, Technical University of Liberec, Studentská 2, 461 17 Liberec 1, Czech Republic
*
Author to whom correspondence should be addressed.
Processes 2021, 9(11), 1974; https://doi.org/10.3390/pr9111974
Submission received: 30 September 2021
/
Revised: 23 October 2021
/
Accepted: 29 October 2021
/
Published: 4 November 2021
(This article belongs to the Special Issue Experimental and Numerical Methods in Fluid Mechanics and Energy)
Abstract
:The paper presents a numerical and experimental investigation of the effect of incindence angle offset in a two-dimensional section of a flat blade cascade in a high-speed wind tunnel. The aim of the current work is tp determine the aerodynamic excitation forces and approximation of the unsteady blade-loading function using a quasi-stationary approach. The numerical simulations were performed with an in-house finite-volume code built on the top of the OpenFOAM framework. The experimental data were acquired for regimes corresponding to the numerical setup. The comparison of the computational and experimental results is shown for the static pressure distributions on three blades and upstream and downstream of the cascade. The plot of the aerodynamic moments acting on all five blades shows that the adjacent blades are significantly influenced by the angular offset of the middle blade.
1. Introduction
At present, the most important vibration problem faced by designers and operators of large-power turbomachines is blade aeroelastic instability called “blade flutter”—flow-induced oscillation of the turbine or compressor blades. These violent blade vibrations eventually lead to blade fractures with catastrophic consequences. No consistent solution to this problem has been found to date; the most common approach is restricting the machine operation map to “flutter free” zones [1]. Blade flutter problems started to appear with increasing frequency in high-efficiency power-generating turbines with slender and lighter blades, which are more prone to suffering from flutter [2]. In addition, the increased requirements for the flexibile operation of power plants employing steam turbines lead to off-design operation regimes, which often result in an onset of blade flutter [3]. It was reported that although 90% of the potential flutter and high-cycle fatigue problems are covered during development testing, the remaining few problems account for nearly 30% of the total development cost and are responsible for over 25% of all engine distress events [4]. In spite of the significant advancements in structural and aerodynamic computational methods that have been achieved in recent years [5,6], the problem of flutter predictions and blade fatigue failures has not yet been resolved. One of the major reasons for the slow progress in this area is a severe lack of reliable experimental data that can serve as a basis for theoretical build-ups.
Experimental research of blade flutter in real turbomachines is not feasible for operational and expense reasons. Therefore, one must rely on computational fluid dynamic simulations (a review of computational approaches to flutter prediction is given, e.g., in [7,8]), or specialized test facilities dedicated to flutter research of highly loaded blades under conditions close to those in real turbomachines. Only a few such test facilities, which are highly specialized in blade flutter research, exist worldwide. These facilities closely simulate the real machine conditions that lead to flutter onset or ongoing blade oscillations. Among the leading world research laboratories are EPFL Lausanne in Switzerland [9,10], KTH Stockholm in Sweden [11,12,13], and the NASA Glenn Research Center in Cleveland, Ohio, USA [14]. A new experimental setup for controlled flutter testing was recently designed and will enter into full operation at the Institute of Thermomechanics of the Czech Academy of Sciences [15].
The excitation force leading to the onset of blade flutter vibrations is the main unknown in the advanced computational predictions of these dangerous operation regimes. If the aerodynamic excitation force reaches an unfavorable phase with the elastic and inertial force, and the damping is not sufficient to dissipate the energy inflow, blade flutter onset occurs, leading to flow-induced vibration of the blade with the preferred frequency. The inertial and elastic forces depend on the blade’s mechanical properties and can be accurately determined during the process of designing a new blade. There are uncertainties in the damping force determination; nevertheless, this force still can be determined with satisfactory accuracy. The major unknown in this equation is the excitation force. Aerodynamic unsteady pressure loading of a blade during a certain part of the oscillatory cycle contributes to a rising damping force and to its suppression. Without accurate knowledge of the resulting excitation load variation over time, it is impossible to affirm that the blade will continue to flutter after the initial deflection [16]. As the excitation force and moment are not known during the blade design cycle, it is not always possible to construct flutter-resistant blades.
Simple flat blades were selected in the first phase of this blade flutter research. The reasons for this selection were the relatively simple manufacturing and easy instrumentation of blades with static pressure taps, as well as the installation of miniature high-frequency pressure transducers. Flat blades were also used as a first step in flutter research in [17,18]. In their experimental and computational study, the authors prescribed a harmonic transitional movement (bending) of three blades in a cascade as a forward-travelling wave and analysed the resulting aerodynamic forces. They reached good agreement between the experiment and CFD based on the discontinuous Galerkin method.
The experimental investigations of blade flutter occurrences in real machines are extremely technologically complicated and prohibitively expensive. Consequently, unsteady blade loading function is not routinely available for newly designed turbomachines. A quasi-stationary method is being proposed as an alternative approach to approximate unsteady loading function that leads to blade flutter onset. In this simplified approach, time-dependent blade loadings will be substituted by a series of static loadings, determined for a range of blade incidence angle offsets. This sequence of static loadings will be computationally converted into a time-dependent “pseudo-dynamic” function. The assumption is that the dynamic component of the overall blade loading function is substantially smaller than the level of the static loading component. The limits of the usable range of the proposed new method will be determined by direct comparison of the quasi-stationary function with a measured actual dynamic loading function. Due to the investigation complexity on the real turbomachines, the rudimentary verification of this new method will be carried out on a linear blade cascade.
Computational and experimental results for the cascade blade static loadings while a single blade is set at a range of incidence angle offsets are reported in this paper. It should be stressed that this is only the first phase of this complex multiyear research task and no firm conclusions about blade flutter behavior can be drawn until the dynamic testing is completed in the second phase of this task. Nevertheless, the presented results already indicate strong torsion moment interaction among blades under small incidence offset and the adjacent blades. This interaction will surely play a role in the onset and amplification of the blade flutter vibrations. Similar computational and experimental results are not readily available in the open technical literature.
2. Materials and Methods
2.1. Formulation of the Problem
The cascade consists of five flat blades located inside a straight channel; see Figure 1. The height and length of the computational domain is and , respectively. The blade profile is a flat plate of a chord of and a thickness of . The leading and the trailing edges are circular. Setting the angle of blades in the cascade is and the pitch is . Blades are enumerated from the channel floor up. The middle blade (blade no. 3) is located in the center of the channel and has a variable incidence angle . The air enters the channel from the left upstream of the cascade.
The flow regime is characterized by a reference isentropic Mach number evaluated from 20 wall pressure readings () and evenly distributed along a line parallel to the cascade at distance , see Section 2.3. Probe separation downstream of the cascade is and the first probe is located at the lower left end of the line. The reference outlet pressure is then calculated as and the reference isentropic Mach number is
where is the total pressure at the inlet and is the specific heat ratio.
The current study is focused on the effects of different incidence angle offsets of the middle blade on the cascade steady-state regimes. The static pressure distribution along the blades is evaluated, and the aerodynamic forces acting on individual blades are then calculated.
2.2. Numerical Simulations
Numerical simulation of the abovementioned problem was carried out using the two-dimensional Favre-averaged Navier–Stokes equation for compressible flows. The thermophysical parameters of the gas were set to approximate the properties of air, i.e., the ideal gas equation of the state was used with the specific heat at constant pressure . The dynamic viscosity and Prandtl number were considered constant. The effects of the turbulence were modeled using the eddy viscosity approach within the RANS framework. Two variants of the SST model were used for comparison: the standard model, SST [19], and the three equation model with laminar–turbulent transition, -SST [20].
The inlet boundary conditions were set as follows: inlet total pressure , inlet total temperature , horizontal direction of velocity vector , kinetic turbulent energy intensity and viscosity ratio . Outlet boundary conditions were determined by pressure 84,302 Pa, which corresponds to the outlet isentropic Mach number .
The numerical solution was obtained with a second-order finite-volume method using two different solvers based on the OpenFOAM platform [21]. The first one uses approximate Riemann solvers for the evaluation of convective fluxes, combined with a central approximation of viscous terms. The steady-state solution was calculated with the pseudo-time stepping using a matrix-free LU-SGS method [22]. The second solver from the standard OpenFOAM distribution uses a sequential SIMPLE algorithm for compressible flows.
To verify the independence of the numerical solution on the computational mesh, three preliminary calculations were performed with coarse, medium, and fine meshes comprising 165,431, 312,467, and 573,132 cells. The coarse mesh of the entire domain is shown in Figure 2. A zoomed section of the coarse mesh near the middle blade is shown in Figure 3. The wall normal size of the first cell expressed in wall coordinates was approximately 1 for the coarse mesh, for the middle mesh, and for the fine mesh.
The distribution of the pressure along the middle blade (blade no. 3) at is shown in Figure 4. Differences in the pressure distribution can only be seen in a very small region close to the leading edge, where the medium and fine mesh capture a small separation bubble at the lower side; see Figure 5.
The calculated forces acting on the middle blade relative to the results of fine mesh calculation are shown in Figure 6. The vertical component of the force (i.e., the lift) is very well resolved, even on the medium mesh, contrary to the horizontal component of the force (i.e., the drag). Further mesh refinement may be necessary. Fortunately, the horizontal component of the force plays a minor role in the flutter analysis; therefore, the medium mesh was selected for further calculations.
A comparison of the simulated distribution of isentropic Mach number along the middle blade obtained with the LU-SGS scheme with -SST model, LU-SGS scheme with SST model, and SIMPLE scheme with -SST for two angles of attack is shown in Figure 7. It can be seen that there are practically no differences between the models. Therefore, further discussion is limited to the results obtained with the LU-SGS scheme and -SST model.
It should be noted that qualitatively similar results were obtained with a high-order spectral finite-element code Nektar++ [23], see [24]. However, calculations with Nektar++ were performed for 2D incompressible flows without any turbulence model; therefore, these results are not directly comparable with the experimental data due to the incompressibility constraint.
2.3. Experimental Investigation
Experiments were carried out in a dedicated test section designed for research on flutter in linear blade cascades. The advantage of this test section is that the incidence angles of individual blades can be varied, while the stagger angle of the entire cascade stays the same. Therefore, the torsional deformation of real blades can be readily simulated. In the current set of results, all blades are kept stationary. However, the test section is designed and ready for measurements where the middle blade undergoes forced torsional oscillation with frequencies up to 200 Hz.
The test section, which has a width of (along the blade span) and height , was mounted to the suction-type high-speed modular wind tunnel stationed in the Laboratory of Internal Flows of the Institute of Thermomechanics of the Czech Academy of Sciences. The test section is described in more detail in [15]. Scheme of the wind tunnel is provided in Figure 8. The test section with the investigated blade cascade is shown in Figure 9. The aspect ratio of the blades was 1.33.
In the course of the experiments, the inlet total pressure was measured by a Prandtl probe mounted in the inlet channel (Figure 9). Inlet and outlet Mach numbers and were evaluated from the total pressure and average static pressures measured by the static pressure taps on the sidewalls upstream and downstream of the blade cascade. The positions of the 20 static pressure tappings downstream of the blade cascade corresponded to 20 probes used in CFD for evaluation of the reference isentropic Mach number . The regime was set by adjusting the control nozzle (Figure 8, station 9) so that the value of was as close to that from CFD as possible for each cascade setting. This procedure had to be adopted due to the different positions of the outlet boundary condition of CFD that was used to set the simulation and the 20 static pressure tappings that were used to set the regime in the experiment. Static pressure distributions on the blade surfaces were measured by 10 static pressure taps on one side of one blade. Static pressure readings were then used for the evaluation of isentropic Mach number distributions. To obtain distributions on both sides of blades at positions 2, 3 and 4, one blade equipped with static pressure taps was moved to different positions, as needed. Both upper and lower blade surface distributions were measured at positions 2, 3 and 4 each at angle settings of the middle blade (position 3).
3. Results
Figure 10, Figure 11 and Figure 12 show the distribution of the Mach number in the vicinity of the cascade blades for at −3, 0 and 3. One can see that, for each individual inlet angle, the Mach number decreases with increasing blade number (from bottom to top). This effect is more pronounced for negative inlet angles. The flow separates at the lower side of the middle blade for and the separation bubble causes a large increase in the boundary layer thickness; see Figure 10.
The separation bubble can also be seen in the Figure 13. The friction coefficient is negative for almost the first 30 of the lower side of the blade for . Here is the wall shear stress and the reference quantities and are the outlet isentropic density and velocity magnitude, respectively.
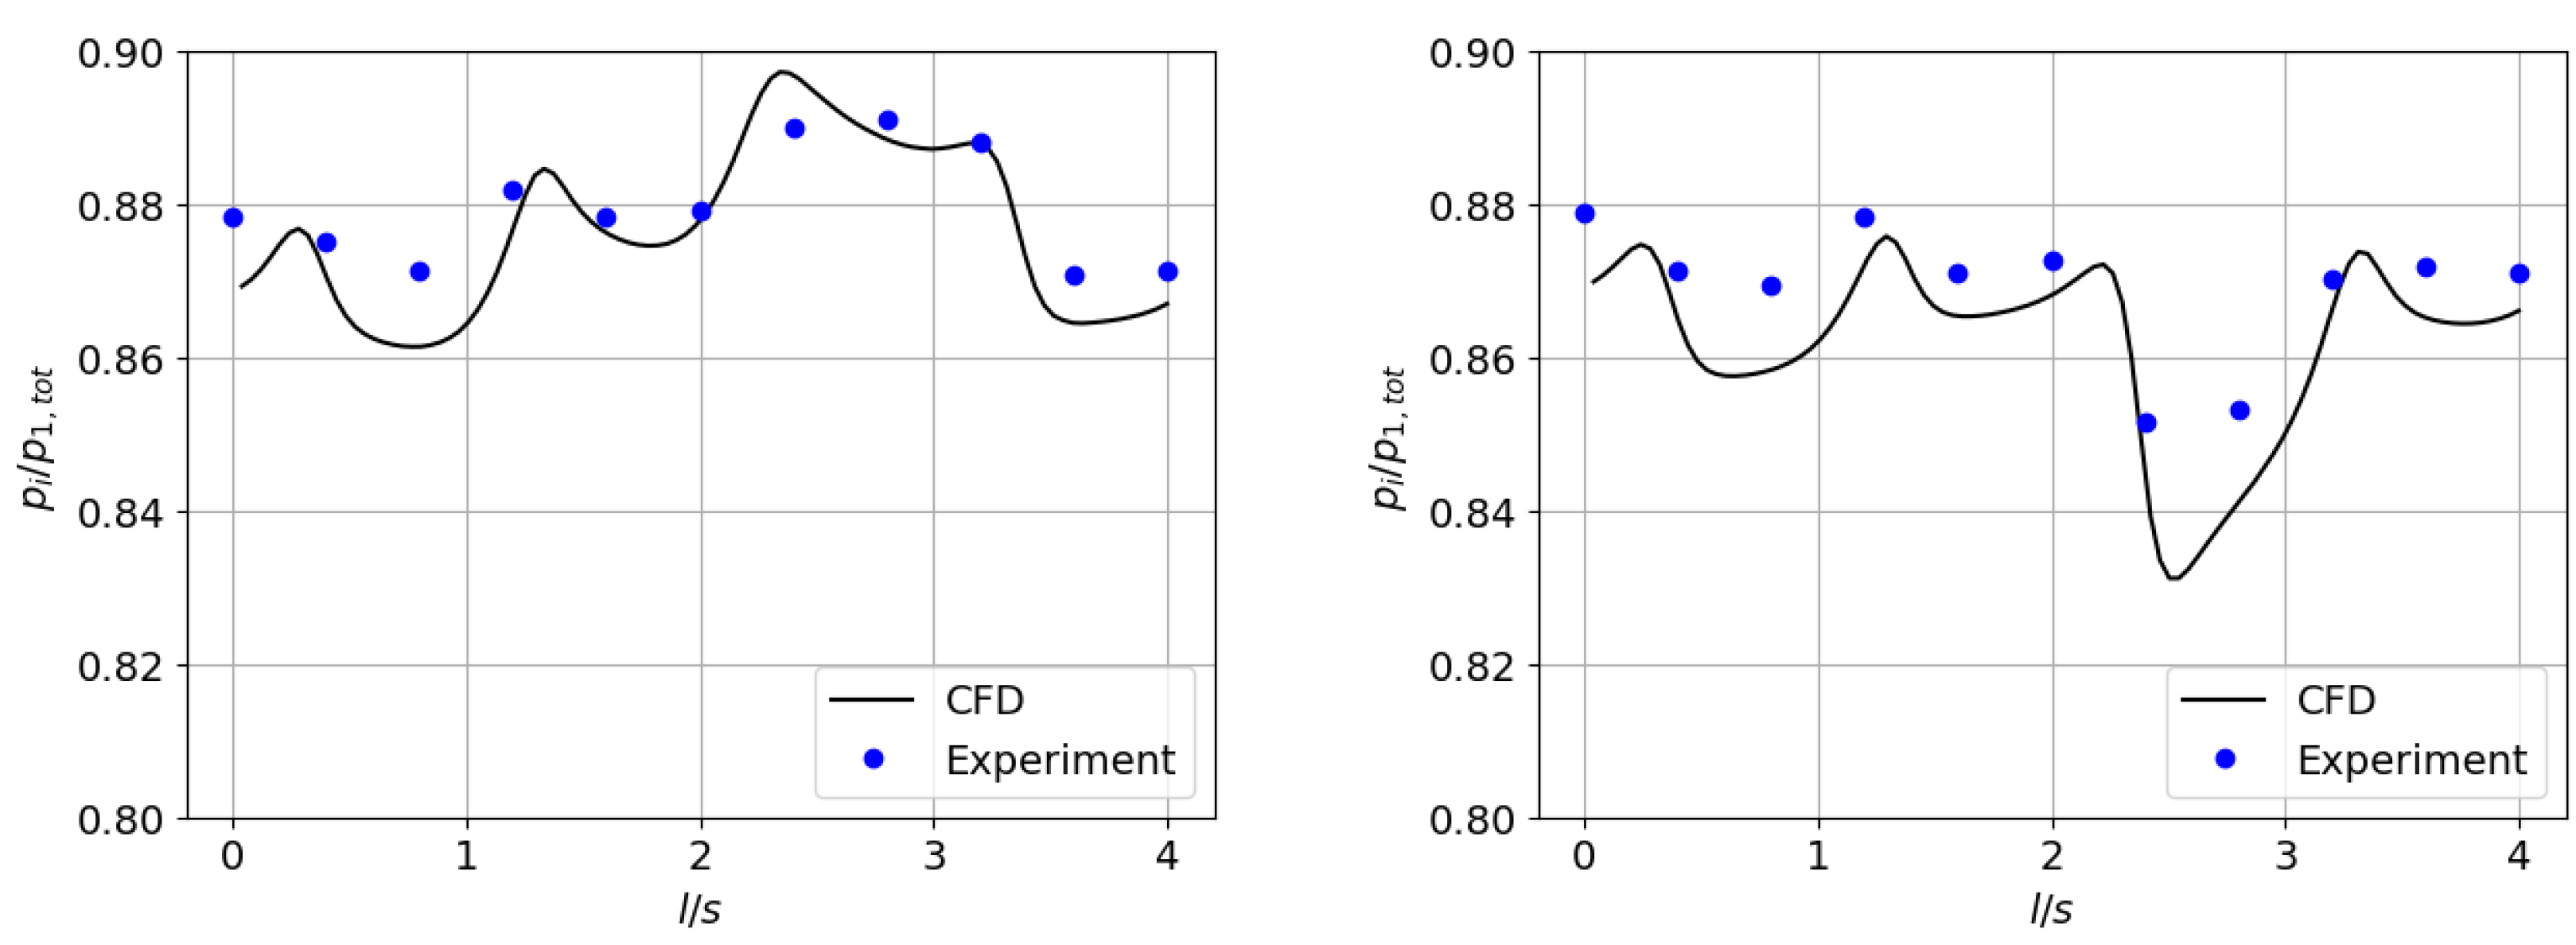
Figure 14 and Figure 15 show the distribution of the static pressure along the inlet and outlet probe lines for two extreme angles. The coordinate l is measured from the lower left point of the line (see also Figure 9). One can see a variation in the pressure across the channel which corresponds to variation of the Mach number mentioned before. Figures also include the experimental data taken in 11 evenly distributed pressure probes along the inlet line and 20 probes along the outlet line. Table 1 gives the values of the outlet reference Mach number calculated from the CFD results.
Figure 16, Figure 17 and Figure 18 give the distribution of the isentropic Mach number along the middle blade for −3, 0 and 3. The calculation results correspond very well to the measurement, especially along the upper side of the blade. There is a slight difference on the front part of the lower side of the blade for , which can be caused by the separation bubble predicted in the simulations.
Figure 19 shows the distribution of the isentropic Mach number along blades no. 2, 3, and 4 for −3, 0 and 3. One can see that blade no. 2 is front loaded for negative and the loading becomes more even with increasing the . Opposite effect, although a bit weaker, can be seen at the blade no. 4.
4. Discussion
According to Mach number distribution on the blades provided in Figure 19, blades 2 and 4 are front-loaded at all middle blade settings. Blade 3 is front-loaded at settings −3 and 0 and rather aft loaded at . In this case, however, the sense of the aerodynamic force is inversed. Therefore, the blade torsional moment acting on all investigated blades 2, 3 and 4 is positive over the whole range of investigated middle-blade angle settings.
Flow field is aperiodic with higher velocities in the lower portion of the blade cascade. This is well documented by the distributions of the relative static pressure in Figure 14 and Figure 15. Outlet pressure in the lower portion of the blade cascade is notably lower, especially at the setting of the middle blade . However, at , the distribution in Figure 15 is relatively periodic. Obviously, aperiodicity is affected by the setting of the middle blade, which works as a flap. Interestingly, aperiodicity is more pronounced in the case of CFD compared to the experiment. This is probably due to the different development of a boundary layer on the bottom and upper wall of the flow channel in th CFD and experiment.
The results also suggest that the inlet flow angle is shifted towards negative values, i.e., the inlet flow is inclined downwards. It can be seen from Figure 10, Figure 11 and Figure 12 that notable flow separation or significant growth in boundary layer thickness always occurs on the lower surfaces of blades. At , flow separates on the lower surface of blade 3 and at , a thick boundary layer develops on the lower surface of blade 4. Accordignly, not even a positive angle setting of blade 3 results in flow separation on its upper surface. This is also probably the reason for the better agreement of Mach number distributions on the upper surfaces in CFD and experiment than on lower surfaces. This inlet flow angle deviation is again most pronounced in the lower part of the channel and diminishes towards the upper part of the channel. This is well documented in Figure 19, where agreement of the Mach number distributions on the lower blade surfaces between CFD and experiment improves from blade 2 towards blade 4.
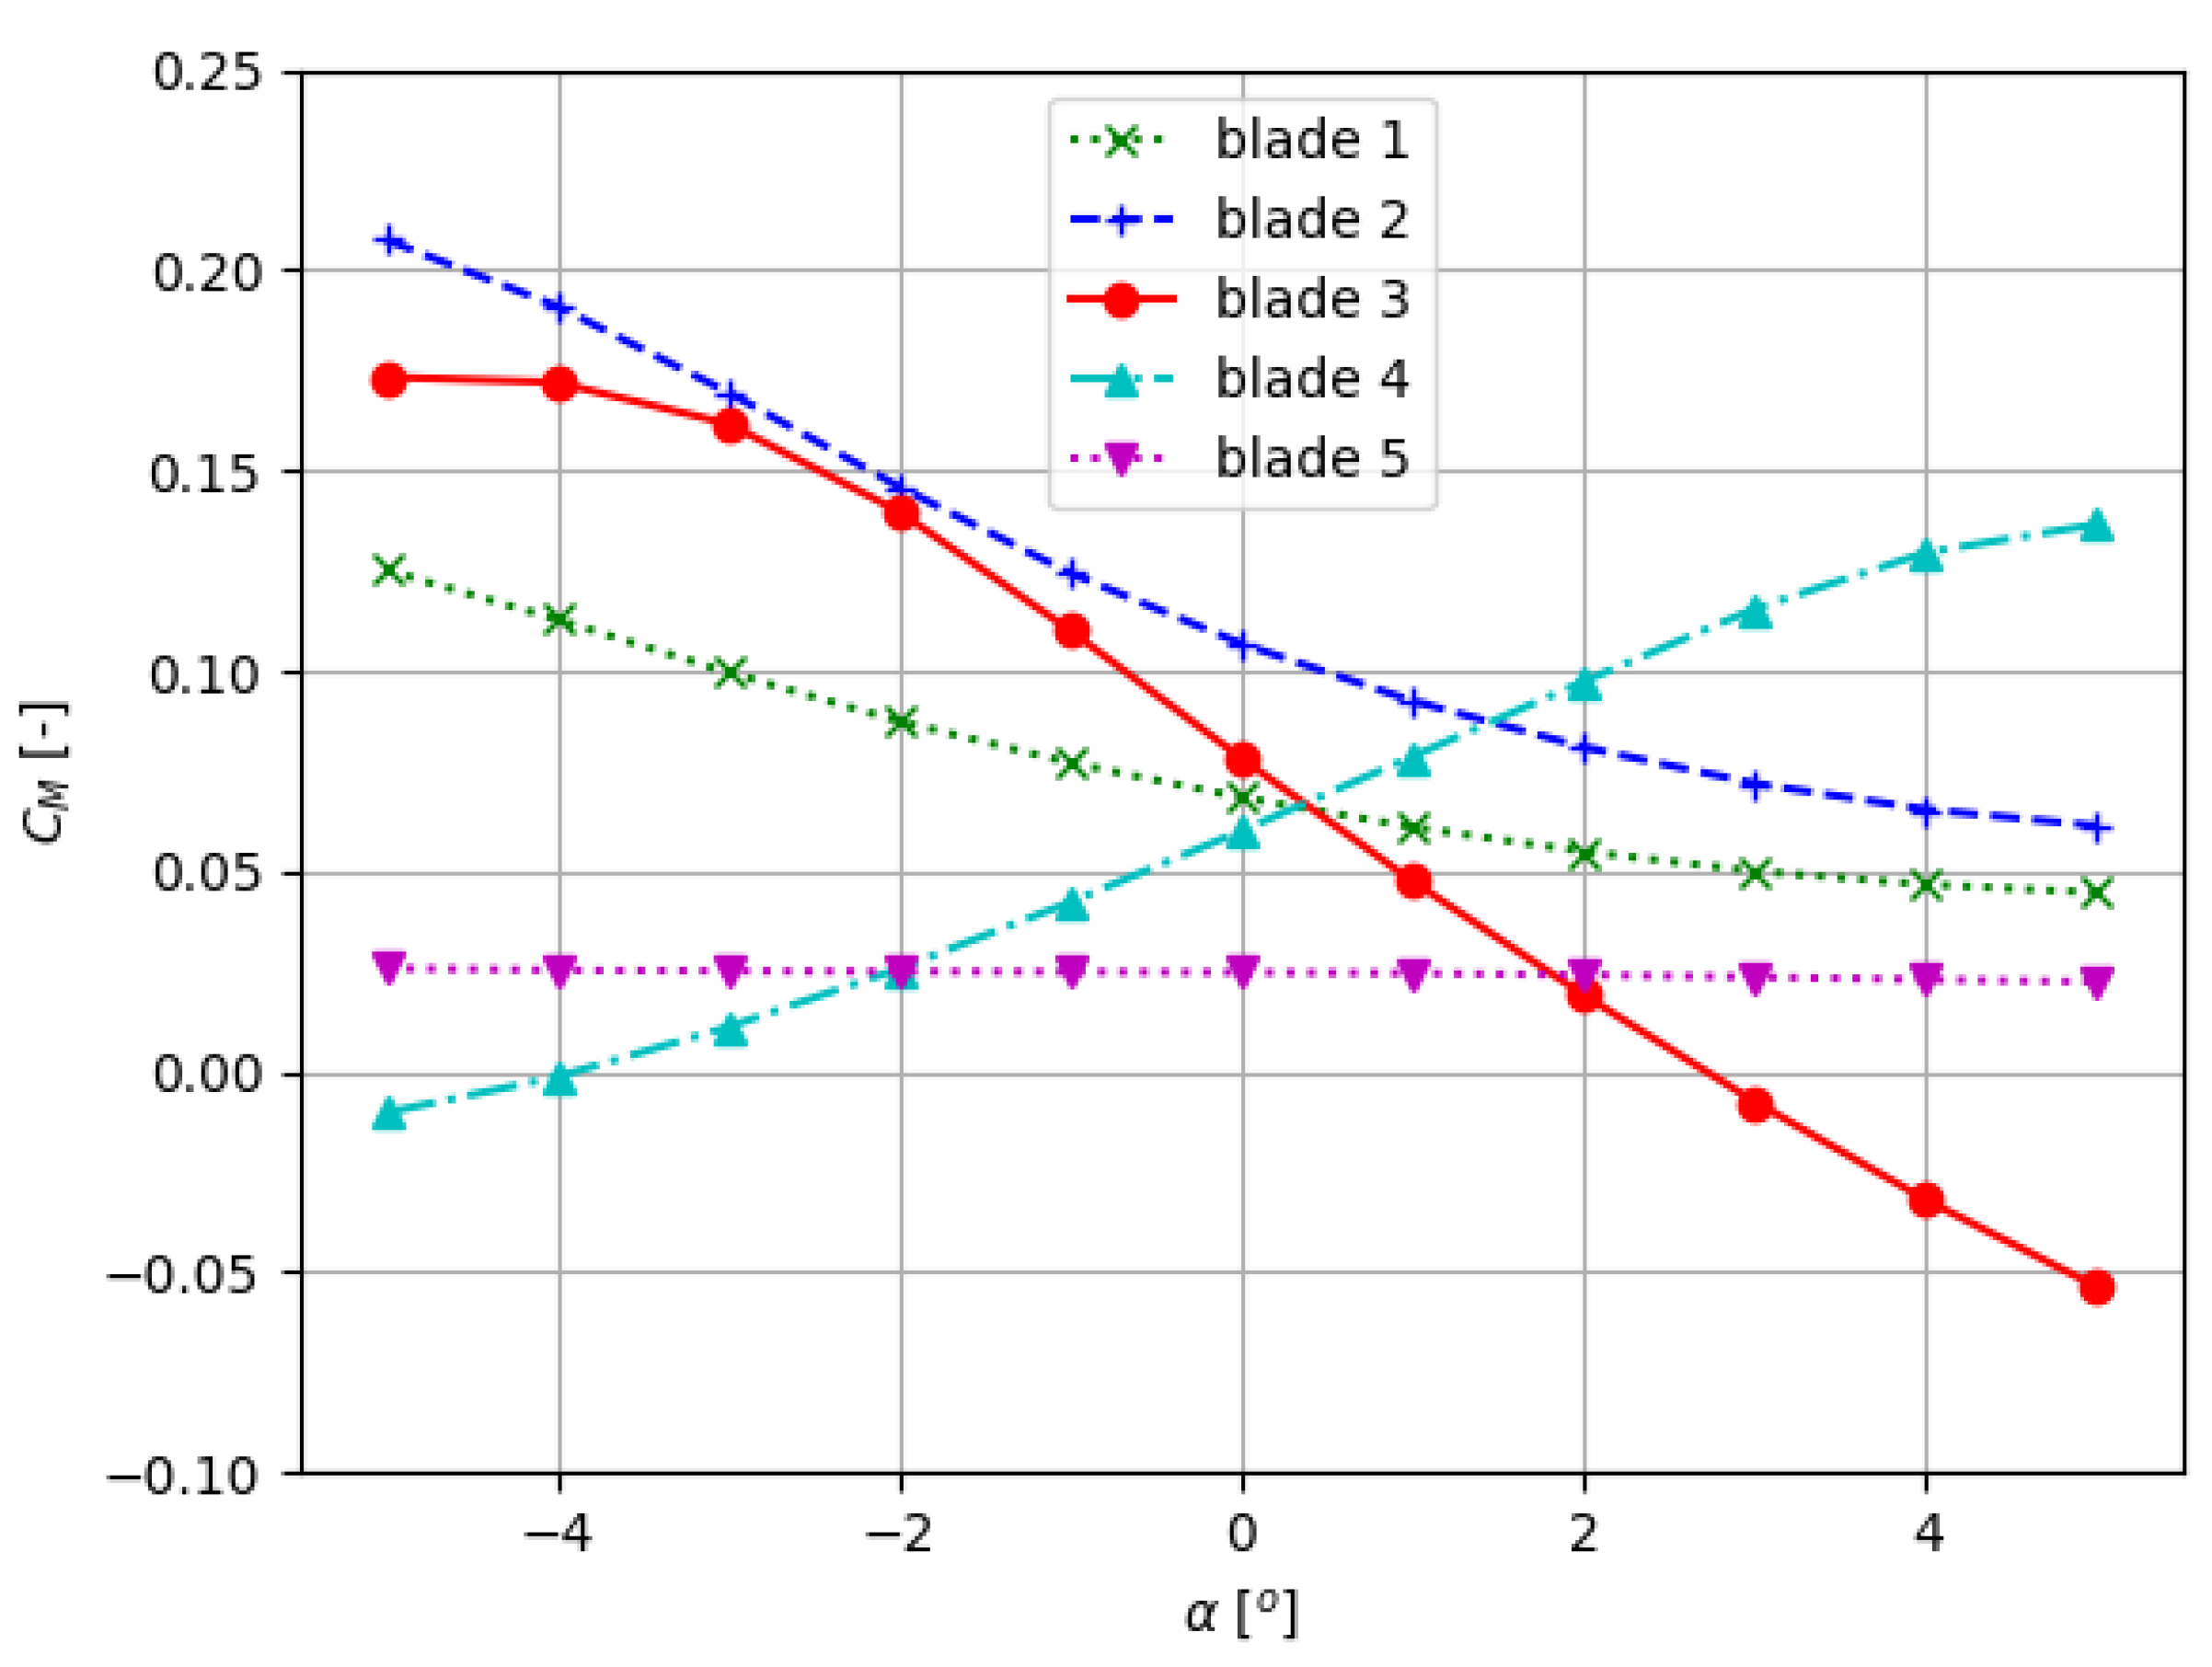
The quasi-steady loading function giving loading of each blade at a specific moment in a loading cycle, as proposed in this paper, is based on a series of static loadings. In case of torsional oscillatory movement, the quasi-steady loading function is the dependence of torsional moment on time/phase. Such oscillatory moment, if present, might initiate the vibration of blades. For the current case, the dependence of a torsional moment coefficient of individual blades on the incidence angle of the middle blade is shown in Figure 20. The torsional moment coefficient is defined as , where M is the torque per unit blade length related to the center axis of a blade, c is the chord, and and are the reference density and velocity, respectively, corresponding to .
It can be seen from this chart that the angular offset of the middle blade induces a torsional moment of comparable magnitude on adjacent blades. Blade number 4 is significantly influenced; even the sense of the moment changes. This influence would likely become more severe ioffixed blades in the blade cascade operated at a non-zero angle of attack.
The by-product of the paper is a dataset published as a Supplementary Material. The dataset contains the experimental data, as well as the results of CFD calculations. Thanks to the very simple geometry of the blades, the dataset can be used as an open validation benchmark for investigations into blade cascades.
Supplementary Materials
The following are available online at https://www.mdpi.com/article/10.3390/pr9111974/s1. Data S1: CFD, Experiment and README.
Author Contributions
Conceptualization, J.L.; Investigation, J.F., M.L., J.M., J.P., P.Š. and D.Š.; Writing—original draft preparation, J.F.; writing—review and editing, M.L., J.M., J.P., P.Š. and D.Š. All authors have read and agreed to the published version of the manuscript.
Funding
The work was supported by the Czech Science Foundation (GACR) under grant no. 20-11537S, by the Institute of Thermomechanics of the Czech Academy of Sceinces with institutional support RVO: 61388998, and by the Student Grant Scheme at the Technical University of Liberec through project no. SGS-2020-3068.
Data Availability Statement
The data presented in this study are available in Supplementary Material.
Conflicts of Interest
The authors declare no conflict of interest.
References
- Srinivasan, A.V. Flutter and Resonant Vibration Characteristics of Engine Blades. In ASME Turbo Expo: Power for Land, Sea and Air; Number 97-GT-533; American Society of Mechanical Engineers: New York, NY, USA, 1997; Volume 4. [Google Scholar] [CrossRef] [Green Version]
- McBean, I.; Hourigan, K.; Thompson, M.; Liu, F. Prediction of Flutter of Turbine Blades in a Transonic Annular Cascade. J. Fluids Eng. 2005, 127, 1053–1058. [Google Scholar] [CrossRef]
- Megerle, B. Unsteady Aerodynamics of Low-Pressure Steam Turbines Operating under Low Volume Flow Conditions. Ph.D. Thesis, EPFL, Lausanne, Switzerland, 2014. [Google Scholar] [CrossRef]
- El-Aini, Y.; deLaneuville, R.; Stoner, A.; Capece, V.; El-Aini, Y.; deLaneuville, R.; Stoner, A.; Capece, V. High cycle fatigue of turbomachinery components—Industry perspective. In Proceedings of the 33rd Joint Propulsion Conference and Exhibit, Seattle, WA, USA, 6–9 July 1997. [Google Scholar] [CrossRef]
- Chen, X.; Zha, G.C.; Hu, Z. Flutter Prediction Based on Fully CoupledFluid-Structural Interactions. In Proceedings of the 9th National Turbine Engine High Cycle Fatigue Conference, Pinehurst, NC, USA, 16–19 March 2004. [Google Scholar]
- May, M.; Mauffrey, Y.; Sicot, F. Numerical flutter analysis of turbomachinery bladings based on time-linearized, time-spectral and time-accurate simulations. In Proceedings of the 15th International Forum on Aeroelasticity and Structural Dynamics, Como, Italy, 25–28 June 2017. [Google Scholar]
- Höhn, W. Numerical Investigation of Blade FLutter at or Near Stall in Axial Turbomachines. Ph.D. Thesis, KTH, Stockholm, Sweden, 2000. [Google Scholar]
- Casoni, M.; Benini, E. A Review of Computational Methods and Reduced Order Models for Flutter Prediction in Turbomachinery. Aerospace 2021, 8, 242. [Google Scholar] [CrossRef]
- Bölcs, A. Volume 1: Turbomachinery. In A Test Facility for the Investigation of Steady and Unsteady Transonic Flows in Annular Cascades; American Society of Mechanical Engineers: NewYork, NY, USA, 1983. [Google Scholar] [CrossRef] [Green Version]
- Rottmeier, F. Experimental Investigation of a Vibrating Axial Turbine Cascade in Presence of Upstream Generated Aerodynamic Gusts. Ph.D. Thesis, EPFL, Lausanne, Switzerland, 2007. [Google Scholar] [CrossRef]
- Vogt, D.M.; Fransson, T.H. A New Turbine Cascade for Aeromechanical Testing. In Proceedings of the 16th Symposium on Measuring Techniques in Transonic and Supersonic Flow in Cascades and Turbomachines, Cambridge, UK, 23–24 September 2002. [Google Scholar]
- Vogt, D.M.; Fransson, T.H. Experimental Investigation of Mode Shape Sensitivity of an Oscillating Low-Pressure Turbine Cascade at Design and Off-Design Conditions. J. Eng. Gas Turbines Power 2007, 129, 530–541. [Google Scholar] [CrossRef]
- Glodic, N.; Guerrero, C.T.; Salas, M.G. Blade oscillation mechanism for aerodynamic damping measurements at high reduced frequencies. In Proceedings of the XXV Biennial Symposium on Measuring Techniques in Turbomachinery, Santorini, Greece, 21–23 September 2020. [Google Scholar]
- Lepicovsky, J. Investigation of flow separation in a transonic-fan linear cascade using visualization methods. Exp. Fluids 2008, 44, 939–949. [Google Scholar] [CrossRef] [Green Version]
- Lepicovsky, J.; Šidlof, P.; Šimurda, D.; Štěpán, M.; Luxa, M. New test facility for forced blade flutter research. AIP Conf. Proc. 2021, 2323, 030001. [Google Scholar] [CrossRef]
- Vedeneev, V.V.; Kolotnikov, M.; Makarov, P. Experimental Validation of Numerical Blade Flutter Prediction. J. Propuls. Power 2015, 31, 1281–1291. [Google Scholar] [CrossRef] [Green Version]
- Vimmr, J.; Bublík, O.; Prausová, H.; Hála, J.; Pešek, L. Numerical simulation of fluid flow through simplified blade cascade with prescribed harmonic motion using discontinuous Galerkin method. EPJ Web Conf. 2018, 180, 1–6. [Google Scholar] [CrossRef]
- Vimmr, J.; Bublík, O.; Pecka, A.; Pešek, L.; Procházka, P. Numerical and experimental study of fluid flow in simplified blade cascade with prescribed harmonic motion. EPJ Web Conf. 2018, 180, 1–5. [Google Scholar] [CrossRef]
- Menter, F.R. Two-equation eddy-viscosity turbulence models for engineering applications. AIAA J. 1994, 32, 1598–1605. [Google Scholar] [CrossRef] [Green Version]
- Menter, F.R.; Smirnov, P.E.; Liu, T.; Avancha, R. A one-equation local correlation-based transition model. Flow Turbul. Combust. 2015, 95, 583–619. [Google Scholar] [CrossRef]
- Weller, H.G.; Tabor, G.; Jasak, H.; Fureby, C. A tensorial approach to computational continuum mechanics using object-oriented techniques. Comput. Phys. 1998, 12, 620–631. [Google Scholar] [CrossRef]
- Fürst, J. Development of a coupled matrix-free LU-SGS solver for turbulent compressible flows. Comput. Fluids 2018, 172, 332–339. [Google Scholar] [CrossRef]
- Cantwell, C.D.; Moxey, D.; Comerford, A.; Bolis, A.; Rocco, G.; Mengaldo, G.; De Grazia, D.; Yakovlev, S.; Lombard, J.E.; Ekelschot, D.; et al. Nektar++: An open-source spectral/hp element framework. Comput. Phys. Commun. 2015, 192, 205–219. [Google Scholar] [CrossRef] [Green Version]
- Fürst, J.; Lasota, M.; Musil, J.; Pech, J. Numerical Investigation of Aeroelastic Flutter in Two-Dimensional Cascade of Compressor Blades. MATEC Web Conf. 2020, 328, 02020. [Google Scholar] [CrossRef]
Figure 1.
Geometry of the cascade.

Figure 2.
Coarse mesh for the case with .

Figure 3.
Detail of the coarse mesh in the vicinity of the middle blade.

Figure 4.
Distribution of the pressure along the middle blade calculated with coarse, medium, and fine mesh ().
Figure 4.
Distribution of the pressure along the middle blade calculated with coarse, medium, and fine mesh ().

Figure 5.
Separation bubbles in the vicinity of the leading edge of the middle blade at .

Figure 6.
Mesh dependency of relative forces acting on the middle blade for -3, 0 and 3, N is the number of mesh elements.
Figure 6.
Mesh dependency of relative forces acting on the middle blade for -3, 0 and 3, N is the number of mesh elements.

Figure 7.
Mach number distribution over middle blade obtained with three different numerical models (left pane , right pane 3).
Figure 7.
Mach number distribution over middle blade obtained with three different numerical models (left pane , right pane 3).

Figure 8.
Scheme of the wind tunnel. 1 silica-gel dryer, 2 pebble and cloth filter, 3 circular contraction, 4 honeycomb and screen, 5 contraction and cross-section change insert, 6 test section, 7 diffuser and cross section change insert, control nozzle, 9 quick acting valve, 10 diffuser, 11 pipe connection to vacuum chamber; dimensions given in mm.

Figure 9.
Scheme of the test section and measurement setup, dimensions are given in .

Figure 10.
Distribution of the Mach number in the domain, , .

Figure 11.
Distribution of the Mach number in the domain, , .

Figure 12.
Distribution of the Mach number in the domain, , .

Figure 13.
Distribution of the friction coefficient along the middle blade for and −3, 0 and 3.

Figure 14.
Pressure distribution along the inlet probe line (left pane , right pane ).

Figure 15.
Pressure distribution along the outlet probe line (left pane , right pane ).

Figure 16.
Isentropic Mach number distribution along the middle blade (blade no. 3) for .

Figure 17.
Isentropic Mach number distribution along the middle blade (blade no. 3) for .

Figure 18.
Isentropic Mach number distribution along the middle blade (blade no. 3) for .

Figure 19.
Isentropic Mach number distribution along blades 2, 3 and 4 at middle blade settings −3, 0 and 3. Solid lines-CFD, symbols-EXP, red-lower surface, blue-upper surface.
Figure 19.
Isentropic Mach number distribution along blades 2, 3 and 4 at middle blade settings −3, 0 and 3. Solid lines-CFD, symbols-EXP, red-lower surface, blue-upper surface.

Figure 20.
Torsional moment coefficient dependence on middle blade incidence angle offset .


Table 1.
Reference isentropic Mach number for outlet pressure corresponding to .
| 0 | 1 | 2 | 3 | ||||
| 0.540 | 0.536 | 0.532 | 0.529 | 0.526 | 0.524 | 0.522 |
Publisher’s Note: MDPI stays neutral with regard to jurisdictional claims in published maps and institutional affiliations. |
© 2021 by the authors. Licensee MDPI, Basel, Switzerland. This article is an open access article distributed under the terms and conditions of the Creative Commons Attribution (CC BY) license (https://creativecommons.org/licenses/by/4.0/).
Share and Cite
MDPI and ACS Style
Fürst, J.; Lasota, M.; Lepicovsky, J.; Musil, J.; Pech, J.; Šidlof, P.; Šimurda, D. Effects of a Single Blade Incidence Angle Offset on Adjacent Blades in a Linear Cascade. Processes 2021, 9, 1974. https://doi.org/10.3390/pr9111974
AMA Style
Fürst J, Lasota M, Lepicovsky J, Musil J, Pech J, Šidlof P, Šimurda D. Effects of a Single Blade Incidence Angle Offset on Adjacent Blades in a Linear Cascade. Processes. 2021; 9(11):1974. https://doi.org/10.3390/pr9111974
Chicago/Turabian StyleFürst, Jiří, Martin Lasota, Jan Lepicovsky, Josef Musil, Jan Pech, Petr Šidlof, and David Šimurda. 2021. "Effects of a Single Blade Incidence Angle Offset on Adjacent Blades in a Linear Cascade" Processes 9, no. 11: 1974. https://doi.org/10.3390/pr9111974
Note that from the first issue of 2016, this journal uses article numbers instead of page numbers. See further details here.