
Photosynthesis Monitoring in Microalgae Cultures Grown on Municipal Wastewater as a Nutrient Source in Large-Scale Outdoor Bioreactors
 , , , ,
  , ,
, ,  , and
, and 
Abstract
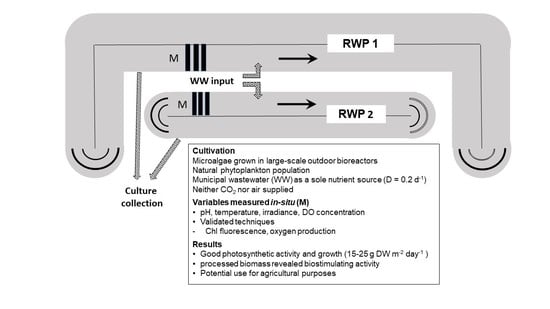
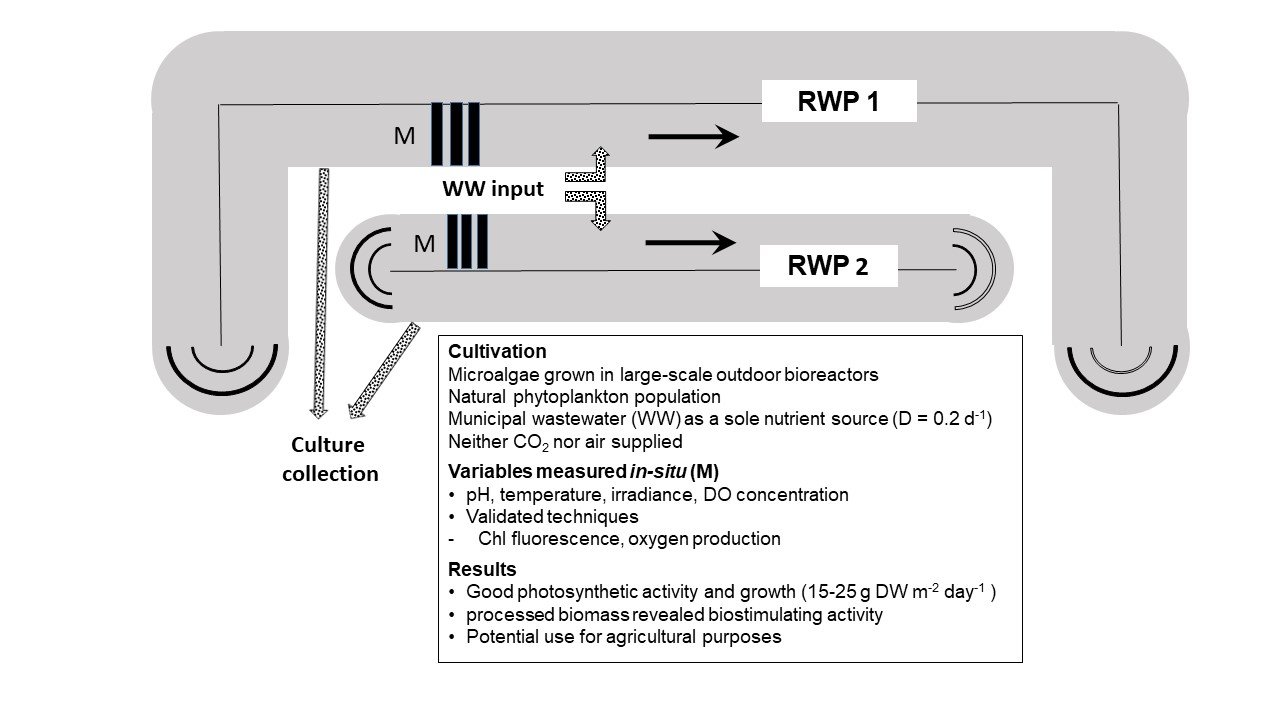
:Simple Summary
Abstract
1. Introduction
2. Materials and Methods
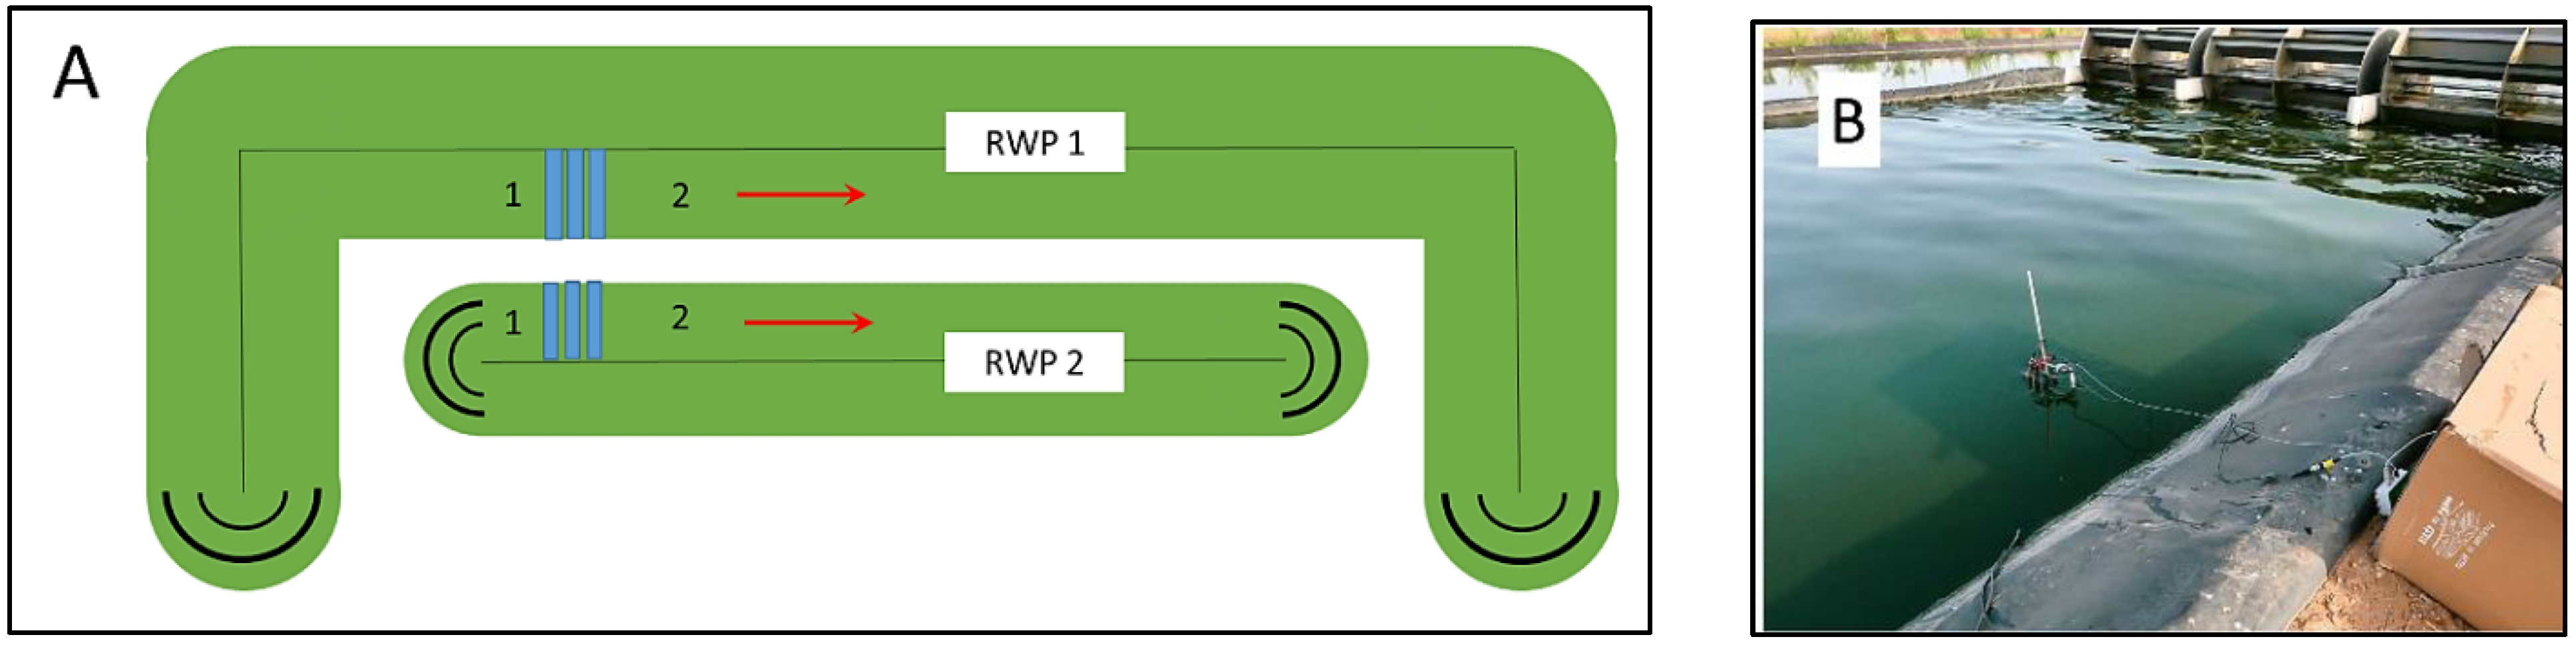
2.1. Cultivation Plant
2.2. Photosynthesis Monitoring
2.2.1. In-Situ Measurements
2.2.2. Ex-Situ Measurements
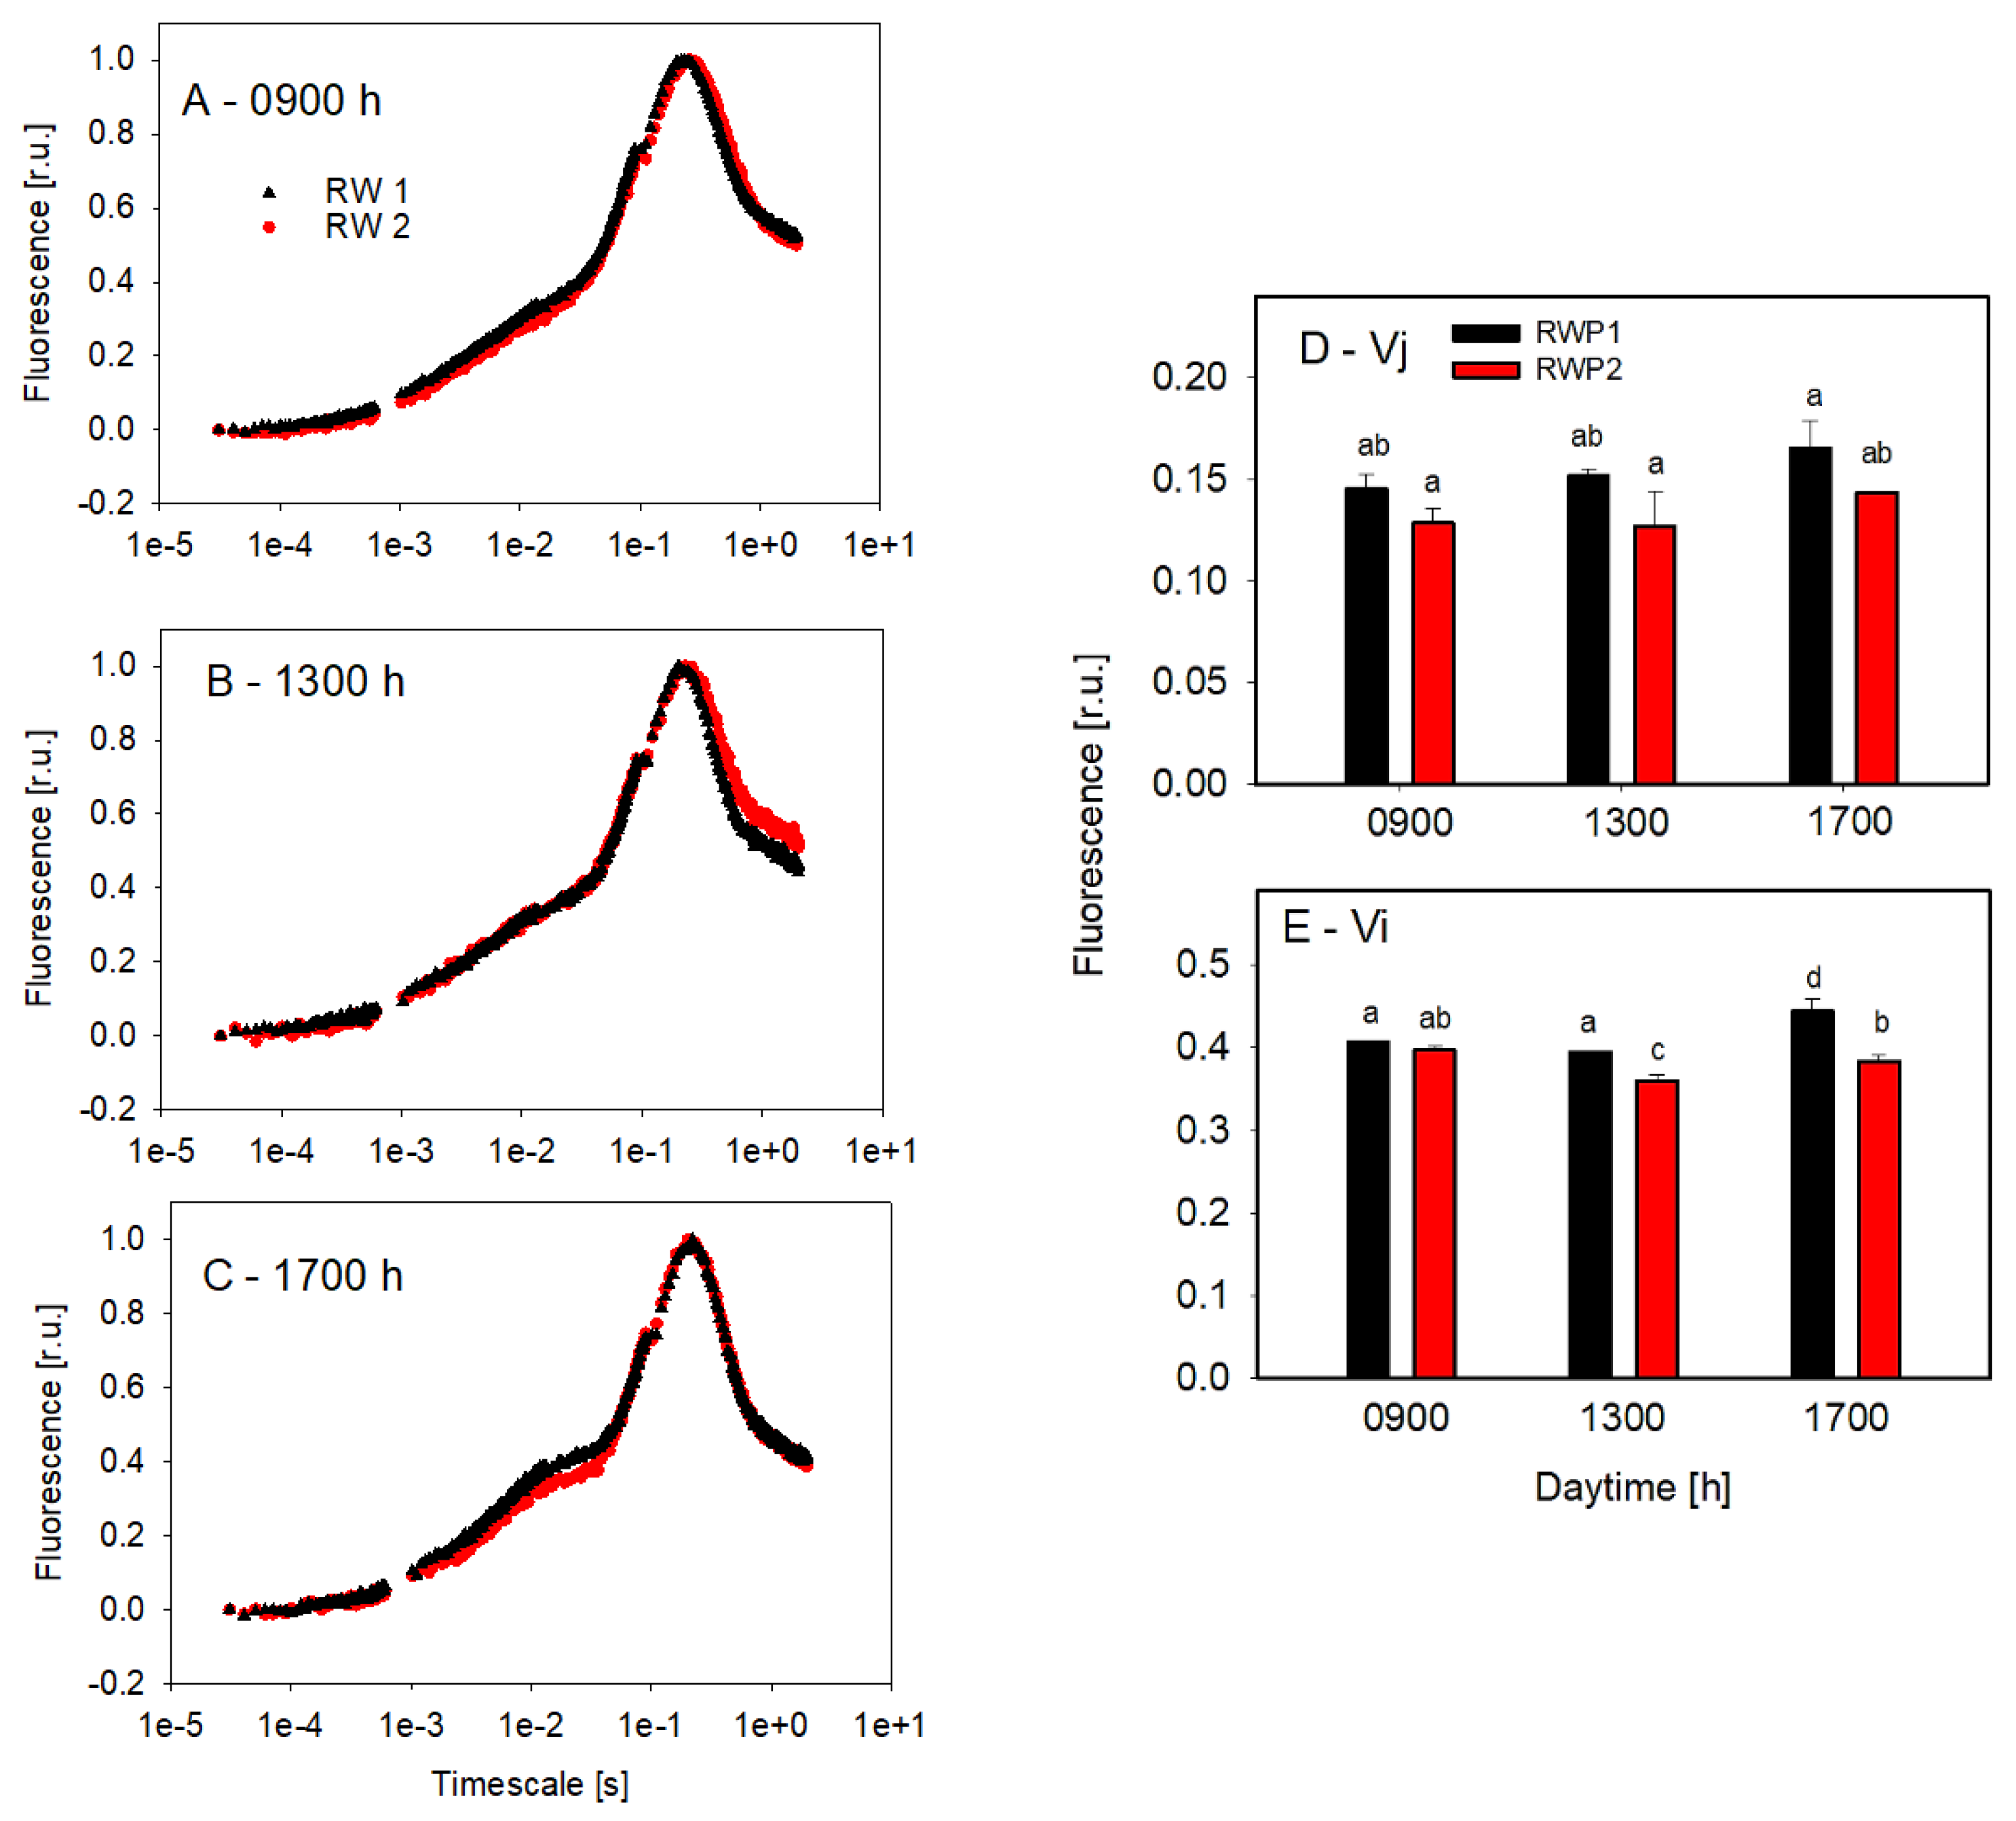
2.2.3. Fast Fluorescence Induction Kinetics (Kautsky Curve or OJIP Test)
2.3. Biomass Determination and Biochemical Measurements
2.4. Determination of Biological Activity
2.4.1. Cucumber Cotyledon Expansion Test
2.4.2. Leaf Chlorophyll Retention Test (Cytokinin-Like Activity)
2.4.3. Mung Bean Rooting Test
2.4.4. Cucumber Cotyledon Root Formation Test
2.5. Statistical Analysis
3. Results
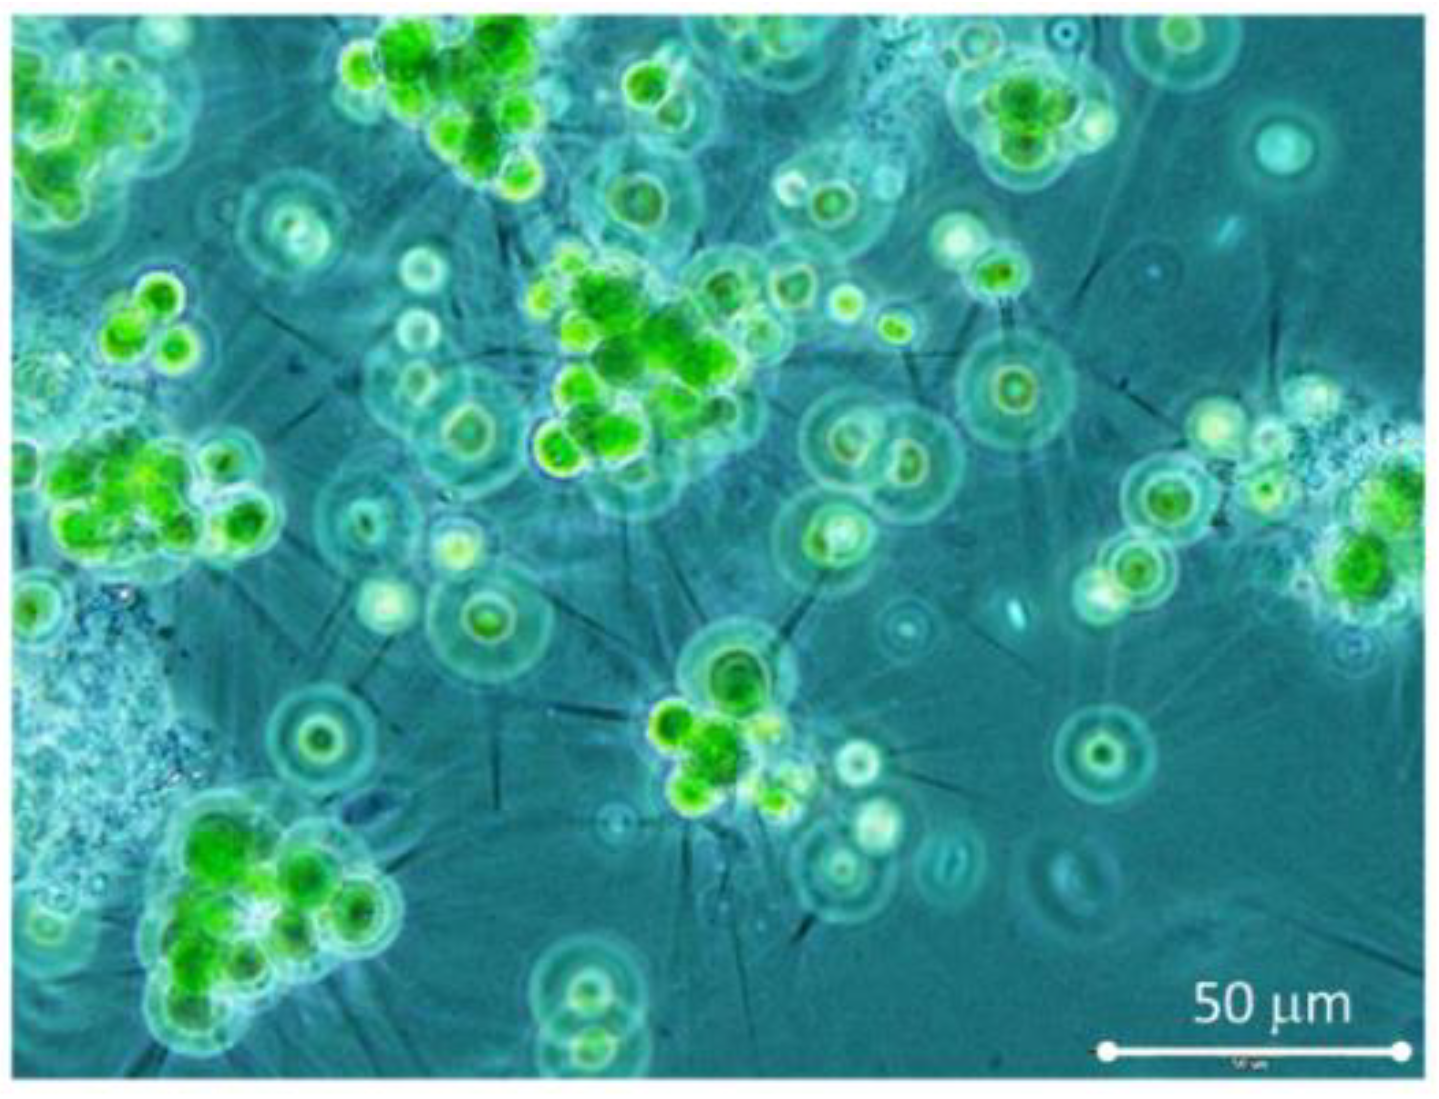
3.1. Cultivation Trials
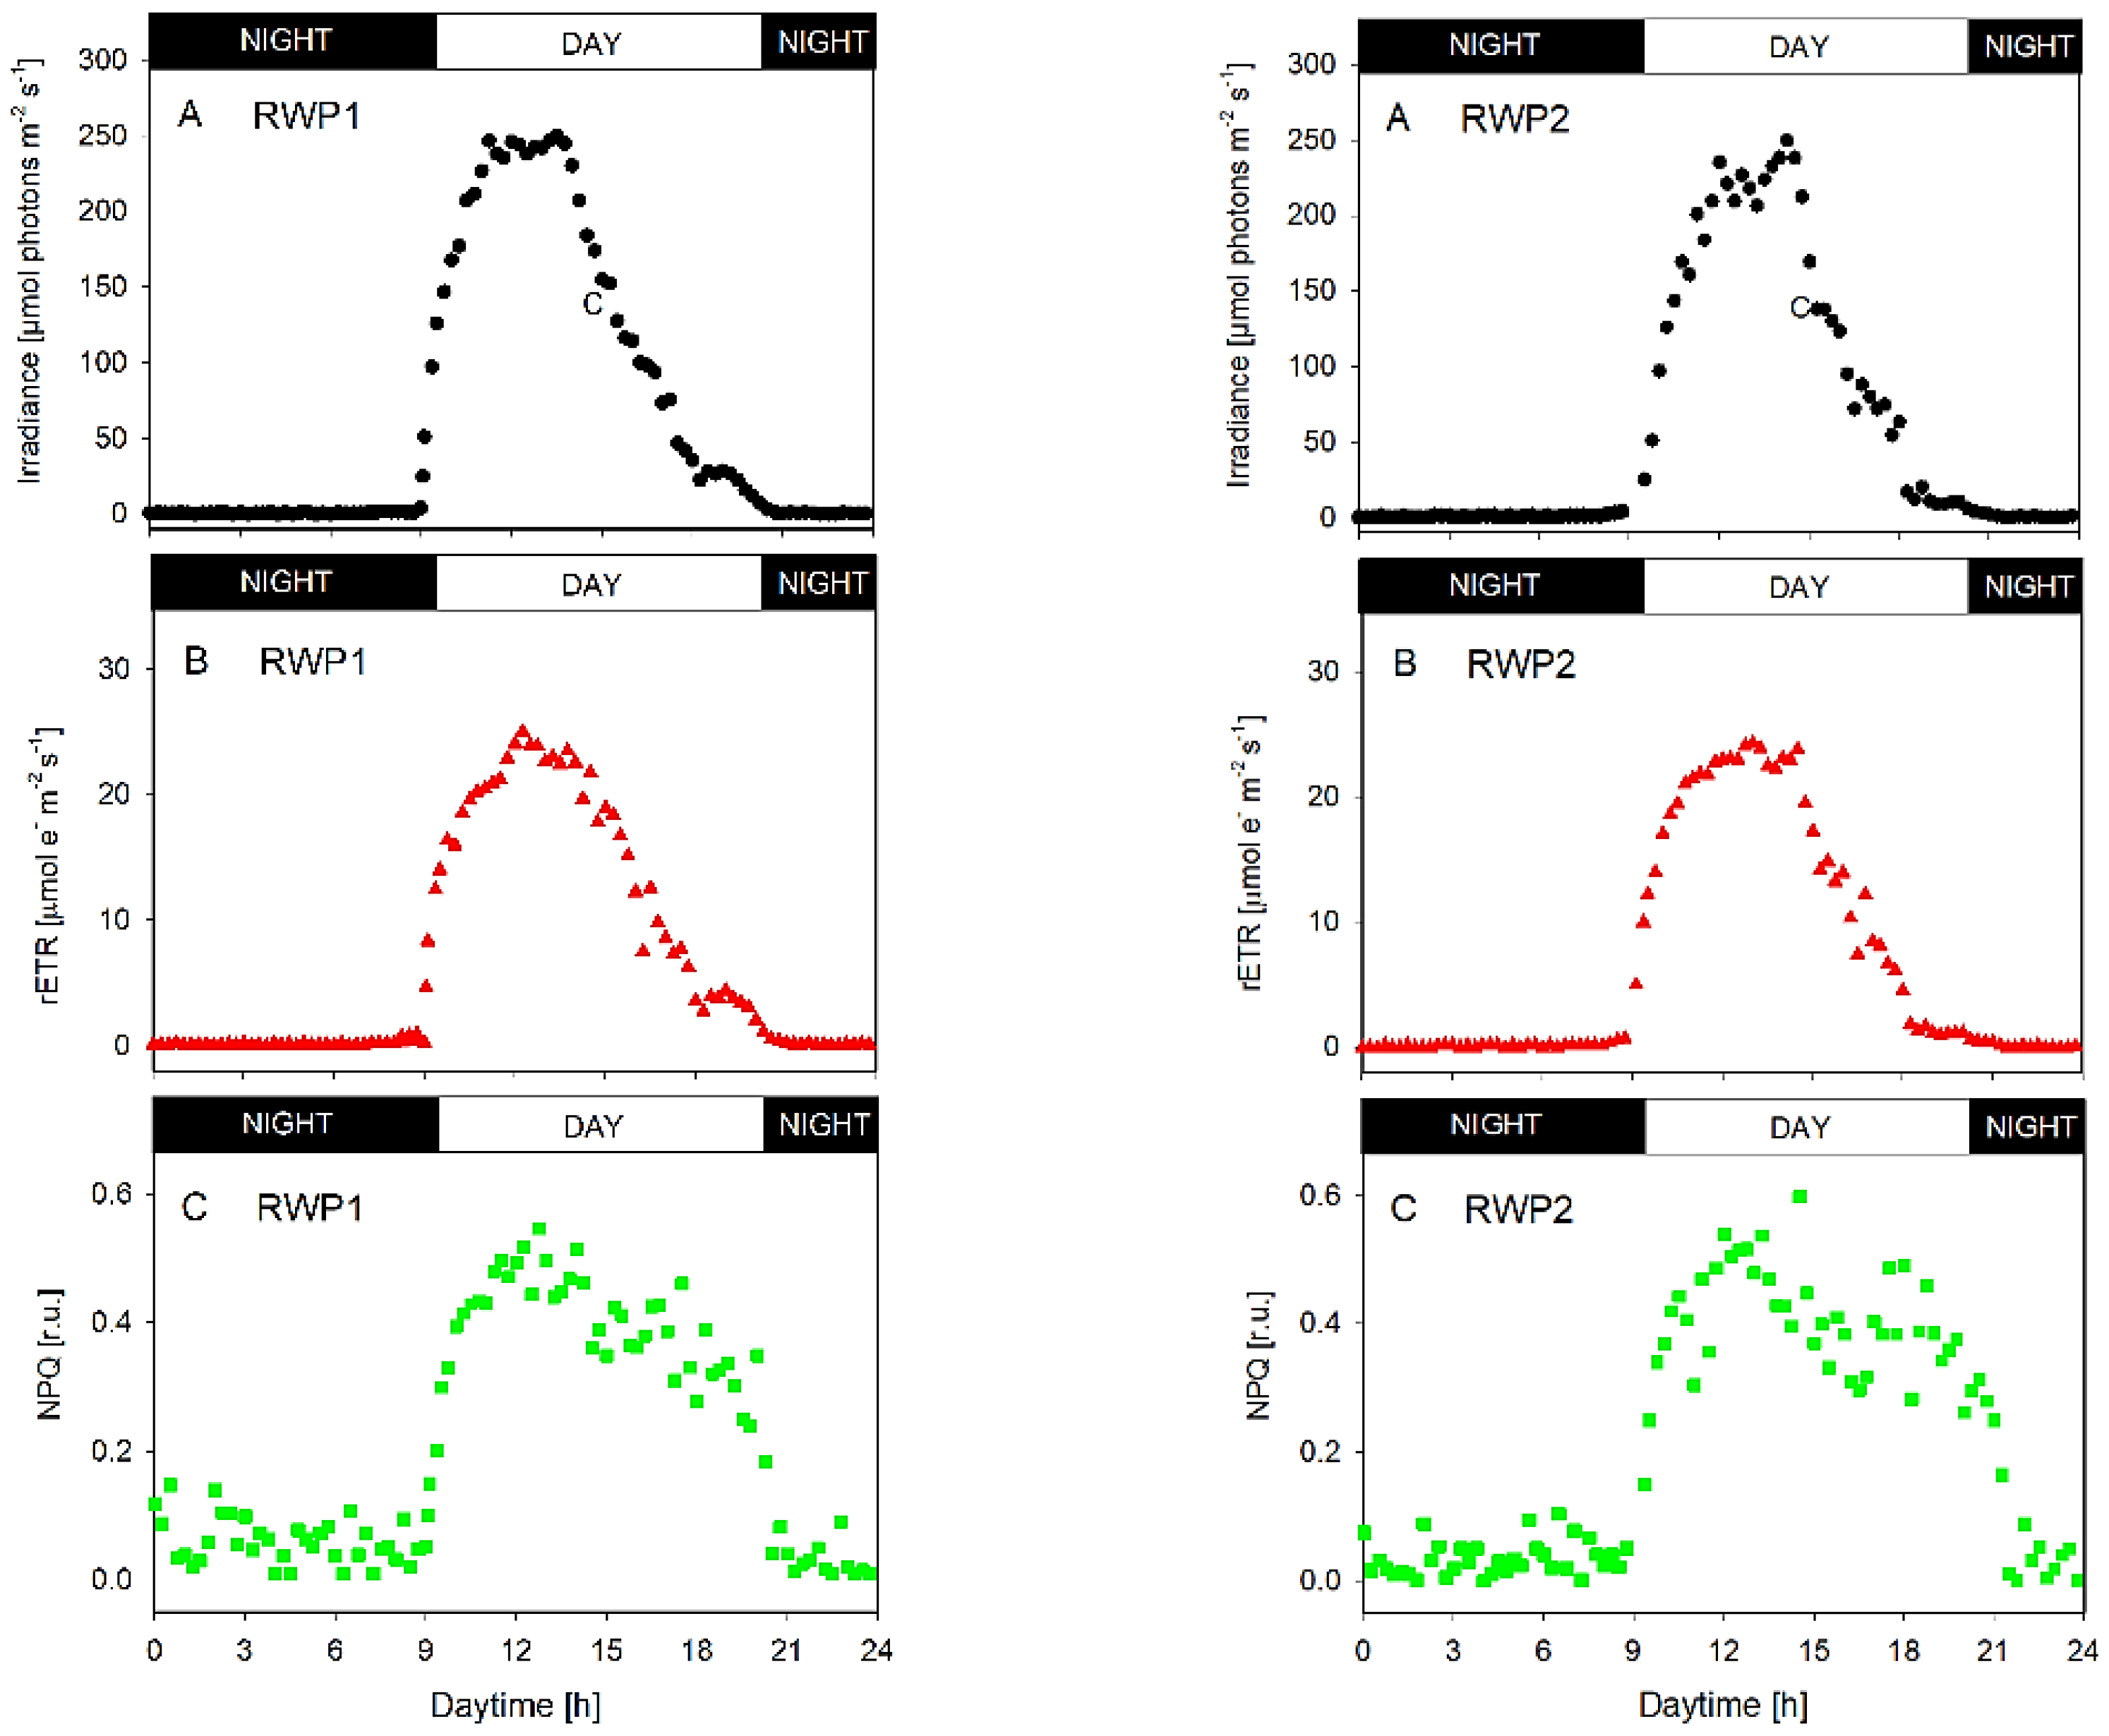
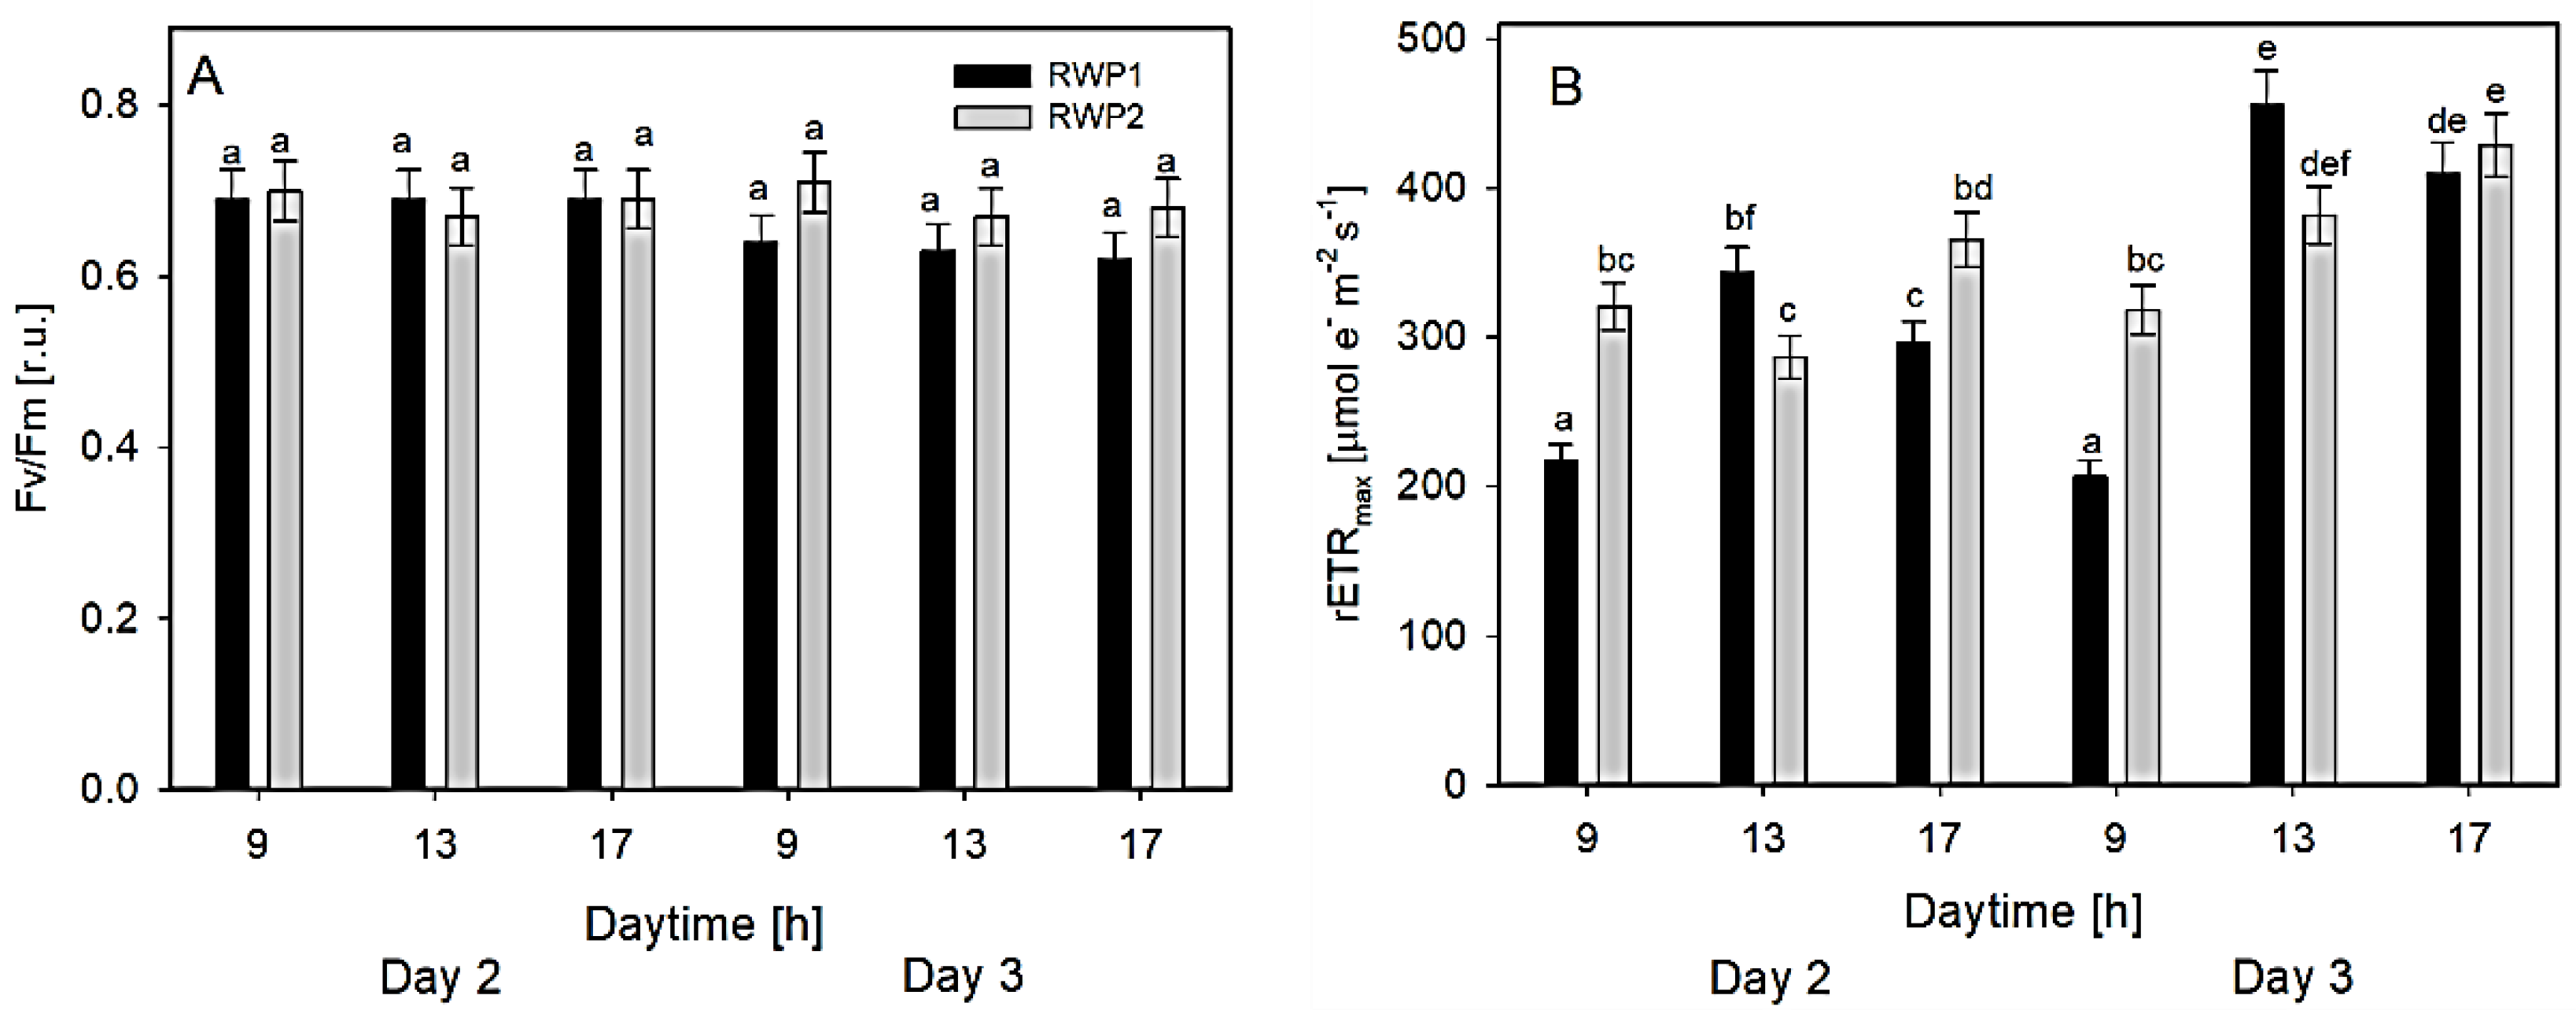
3.2. Photosynthesis Measurements
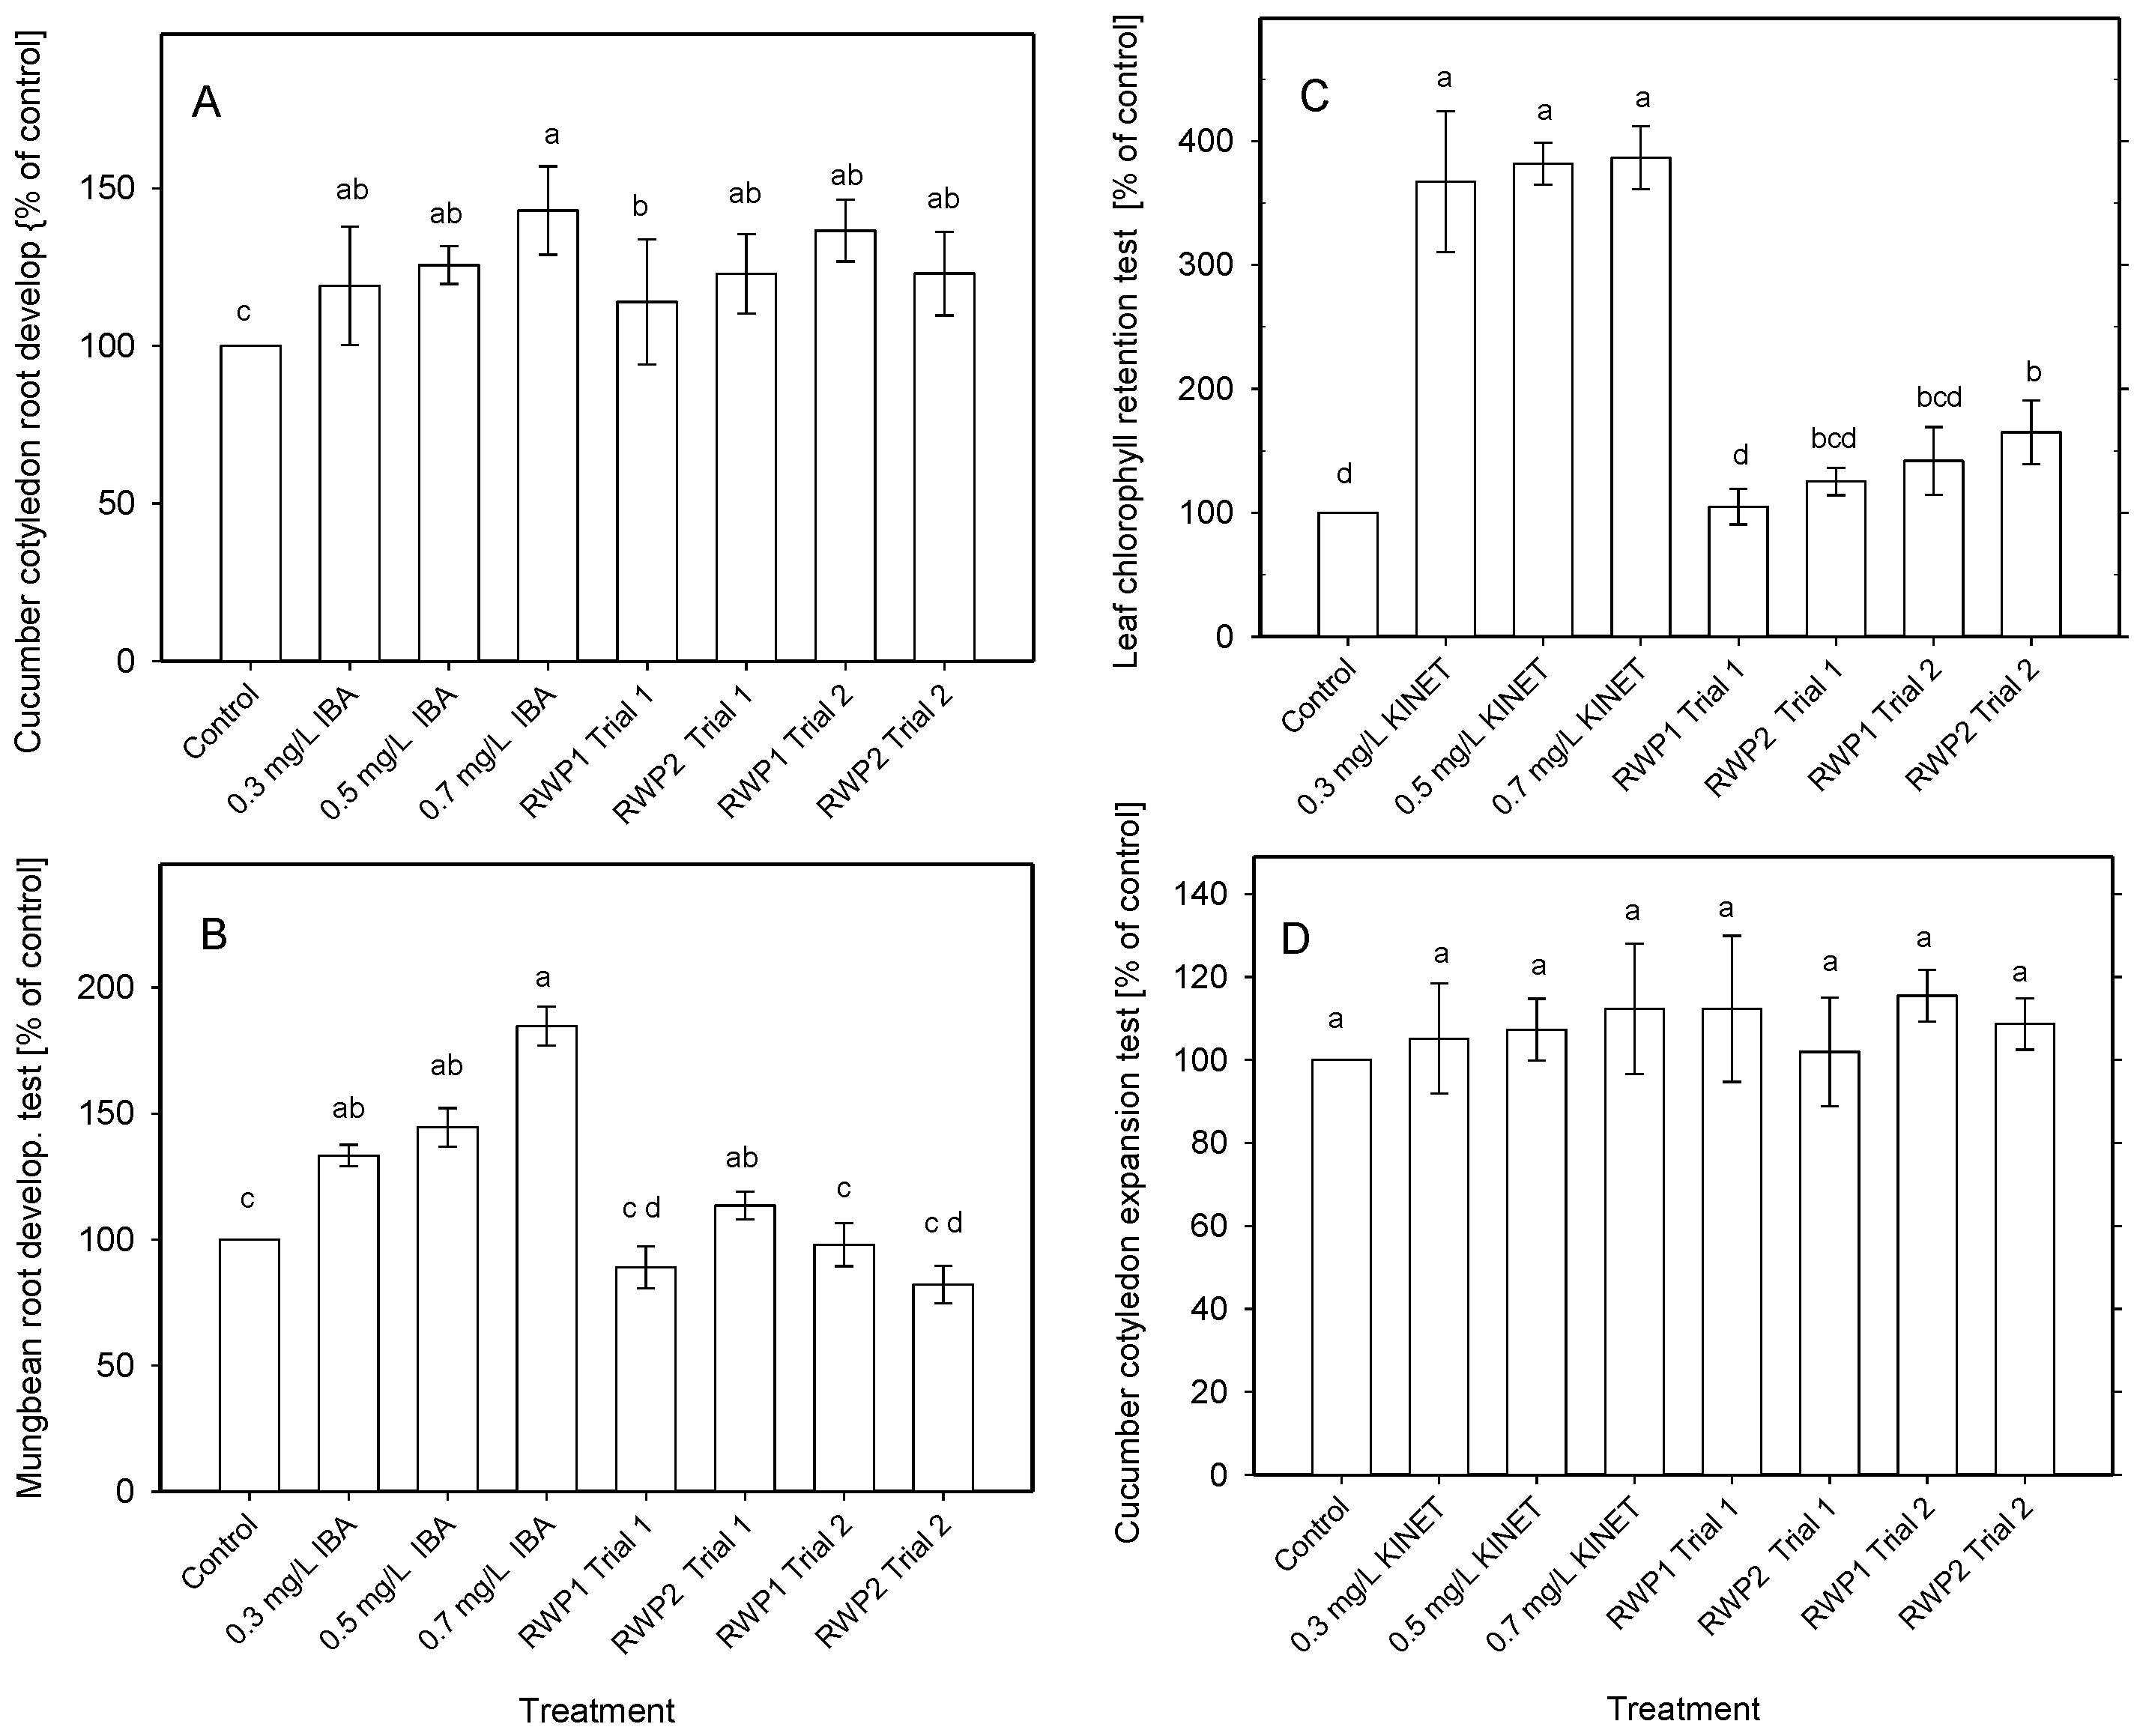
3.3. Bioactivity Measurements
4. Discussion
5. Conclusions
Author Contributions
Funding
Institutional Review Board Statement
Informed Consent Statement
Data Availability Statement
Acknowledgments
Conflicts of Interest
References
- Oswald, W.J.; Gotaas, H.B.; Ludwig, H.F.; Lynch, V. Algae Symbiosis in Oxidation Ponds: III. Photosynthetic Oxygenation. Sewage Ind. Waste. 1953, 25, 692–705. [Google Scholar]
- Sawayama, S.; Minowa, T.; Dote, Y.; Yokoyama, S. Growth of the Hydrocarbon-Rich Microalga Botryococcus Braunii in Secondarily Treated Sewage. Appl. Microbiol. Biotechnol. 1992, 38, 135–138. [Google Scholar] [CrossRef]
- Zhang, T.-Y.; Wu, Y.-H.; Zhu, S.; Li, F.-M.; Hu, H.-Y. Isolation and Heterotrophic Cultivation of Mixotrophic Microalgae Strains for Domestic Wastewater Treatment and Lipid Production under Dark Conditions. Bioresour. Technol. Reports 2013, 149, 586–589. [Google Scholar] [CrossRef] [PubMed]
- Morales-Amaral, M.M.; Gómez-Serrano, C.; Acién, F.G.; Fernández-Sevilla, J.M.; Molina-Grima, E. Outdoor Production of Scenedesmus Sp. in Thin-Layer and Raceway Reactors Using Centrate from Anaerobic Digestion as the Sole Nutrient Source. Algal Res. 2015, 12, 99–108. [Google Scholar] [CrossRef]
- Plöhn, M.; Spain, O.; Sirin, S.; Silva, M.; Escudero-Oñate, C.; Ferrando-Climent, L.; Allahverdiyeva, Y.; Funk, C. Wastewater Treatment by Microalgae. Physiol. Plant. 2021, 173, 568–578. [Google Scholar] [CrossRef] [PubMed]
- Ferro, L.; Gentili, F.G.; Funk, C. Isolation and Characterization of Microalgal Strains for Biomass Production and Wastewater Reclamation in Northern Sweden. Algal Res. 2018, 32, 44–53. [Google Scholar] [CrossRef]
- Chaudry, S. Integrating Microalgae Cultivation with Wastewater Treatment: A Peek into Economics. Appl. Biochem. Biotechnol. 2021, 193, 3395–3406. [Google Scholar] [CrossRef]
- Posadas, E.; del Mar Morales, M.; Gomez, C.; Acién, F.G.; Muñoz, R. Influence of PH and CO2 Source on the Performance of Microalgae-Based Secondary Domestic Wastewater Treatment in Outdoors Pilot Raceways. Chem. Eng. J. 2015, 265, 239–248. [Google Scholar] [CrossRef]
- Lian, J.; Wijffels, R.H.; Smidt, H.; Sipkema, D. The Effect of the Algal Microbiome on Industrial Production of Microalgae. Microb. Biotechnol. 2018, 11, 806–818. [Google Scholar] [CrossRef]
- Muñoz, R.; Guieysse, B. Algal–Bacterial Processes for the Treatment of Hazardous Contaminants: A Review. Water Res. 2006, 40, 2799–2815. [Google Scholar] [CrossRef]
- Craggs, R.; Sutherland, D.; Campbell, H. Hectare-Scale Demonstration of High Rate Algal Ponds for Enhanced Wastewater Treatment and Biofuel Production. J. Appl. Phycol. 2012, 24, 329–337. [Google Scholar] [CrossRef]
- Gouveia, L.; Oliveira, A.C. Microalgae as a Raw Material for Biofuels Production. J. Ind. Microbiol. Biot. 2009, 36, 269–274. [Google Scholar] [CrossRef]
- Bošnjaković, M.; Sinaga, N. The Perspective of Large-Scale Production of Algae Biodiesel. Appl. Sci. 2020, 10, 8181. [Google Scholar] [CrossRef]
- Ördög, V.; Stirk, W.A.; Lenobel, R.; Bancírová, M.; Strnad, M.; van Staden, J.; Szigeti, J.; Németh, L. Screening Microalgae for Some Potentially Useful Agricultural and Pharmaceutical Secondary Metabolites. J. App. Phycol. 2004, 16, 309–314. [Google Scholar] [CrossRef]
- Garcia-Gonzalez, J.; Sommerfeld, M. Biofertilizer and Biostimulant Properties of the Microalga Acutodesmus dimorphus. J. Appl. Phycol. 2016, 28, 1051–1061. [Google Scholar] [CrossRef]
- Ronga, D.; Biazzi, E.; Parati, K.; Carminati, D.; Carminati, E.; Tava, A. Microalgal Biostimulants and Biofertilisers in Crop Productions. Agronomy 2019, 9, 192. [Google Scholar] [CrossRef]
- Stirk, W.A.; van Staden, J. Potential of Phytohormones as a Strategy to Improve Microalgae Productivity for Biotechnological Applications. Biotechnol. Adv. 2020, 44, 107612. [Google Scholar] [CrossRef]
- Acién, F.G.; Molina, E.; Reis, A.; Torzillo, G.; Zittelli, G.C.; Sepúlveda, C.; Masojídek, J. Photobioreactors for the Production of Microalgae. In Microalgae-Based Biofuels and Bioproducts; Woodhead Publishing: Sawston, UK, 2017; pp. 1–44. [Google Scholar] [CrossRef]
- Borowitzka, M.A.; Moheimani, N.R. Sustainable Biofuels from Algae. Mitig. Adapt. Strateg. Glob. Chang. 2013, 18, 13–25. [Google Scholar] [CrossRef]
- Quijano, G.; Arcila, J.S.; Buitrón, G. Microalgal-Bacterial Aggregates: Applications and Perspectives for Wastewater Treatment. Biotechnol. Adv. 2017, 35, 772–781. [Google Scholar] [CrossRef]
- Sánchez Zurano, A.; Garrido Cárdenas, J.A.; Gómez Serrano, C.; Morales Amaral, M.; Acién-Fernández, F.G.; Fernández Sevilla, J.M.; Molina Grima, E. Year-Long Assessment of a Pilot-Scale Thin-Layer Reactor for Microalgae Wastewater Treatment. Variation in the Microalgae-Bacteria Consortium and the Impact of Environmental Conditions. Algal Res. 2020, 50, 101983. [Google Scholar] [CrossRef]
- Acién, F.G.G.; Fernández, J.M.M.; Magán, J.J.J.; Molina, E. Production Cost of a Real Microalgae Production Plant and Strategies to Reduce It. Biotechnol. Adv. 2012, 30, 1344–1353. [Google Scholar] [CrossRef] [PubMed]
- De Godos, I.; Arbib, Z.; Lara, E.; Rogalla, F. Evaluation of High Rate Algae Ponds for Treatment of Anaerobically Digested Wastewater: Effect of CO2 Addition and Modification of Dilution Rate. Bioresour. Technol. 2016, 220, 253–261. [Google Scholar] [CrossRef] [PubMed]
- Gómez, C.; Escudero, R.; Morales, M.M.; Figueroa, F.L.; Fernández-Sevilla, J.M.; Acién, F.G. Use of Secondary-Treated Wastewater for the Production of Muriellopsis sp. Appl. Microbiol. Biotechnol. 2013, 97, 2239–2249. [Google Scholar] [CrossRef] [PubMed]
- Del Campo, J. Carotenoid Content of Chlorophycean Microalgae: Factors Determining Lutein Accumulation in Muriellopsis Sp. (Chlorophyta). J. Biotechnol. 2000, 76, 51–59. [Google Scholar] [CrossRef]
- Andersen, R.A.; Berges, J.A.; Harrison, P.J.; Watanabe, M.M. Appendix A—Recipes for Freshwater and Seawater Media. In Algal Culturing Techniques; Andersen, R.A., Ed.; Elsevier: Amsterdam, The Netherlands, 2005; pp. 429–538. [Google Scholar]
- Malapascua, J.R.F.; Jerez, C.G.; Sergejevová, M.; Figueroa, F.L.; Masojídek, J. Photosynthesis Monitoring to Optimize Growth of Microalgal Mass Cultures: Application of Chlorophyll Fluorescence Techniques. Aquat. Biol. 2014, 22, 123–140. [Google Scholar] [CrossRef]
- Jerez, C.G.; Malapascua, J.R.; Sergejevová, M.; Figueroa, F.L.; Masojídek, J. Effect of Nutrient Starvation under High Irradiance on Lipid and Starch Accumulation in Chlorella Fusca (Chlorophyta). Mar. Biotechnol. 2016, 18, 24–36. [Google Scholar] [CrossRef]
- Schreiber, U.; Endo, T.; Mi, H.; Asada, K. Quenching Analysis of Chlorophyll Fluorescence by the Saturation Pulse Method: Particular Aspects Relating to the Study of Eukaryotic Algae and Cyanobacteria. Plant. Cell Physiol. 1995, 36, 873–882. [Google Scholar] [CrossRef]
- Masojídek, J.; Ranglová, K.; Rearte, T.A.; Celis Plá, P.S.M.; Torzillo, G.; Benavides, A.M.S.; Neori, A.; Gómez, C.; Álvarez-Gómez, F.; Lukeš, M.; et al. Changes in Photosynthesis, Growth and Biomass Composition in Outdoor Chlorella G120 Culture during the Metabolic Shift from Heterotrophic to Phototrophic Cultivation Regime. Algal Res. 2021, 56, 102303. [Google Scholar] [CrossRef]
- Schreiber, U.; Schliwa, U.; Bilger, W. Continuous Recording of Photochemical and Non-Photochemical Chlorophyll Fluorescence Quenching with a New Type of Modulation Fluorometer. Photosynth. Res. 1986, 10, 51–62. [Google Scholar] [CrossRef]
- Narayan, A.; Misra, M.; Singh, R. Chlorophyll Fluorescence in Plant Biology. Biophysics 2012, 7, 171–192. [Google Scholar] [CrossRef] [Green Version]
- Ralph, P.J.; Gademann, R. Rapid Light Curves: A Powerful Tool to Assess Photosynthetic Activity. Aquat. Bot. 2005, 82, 222–237. [Google Scholar] [CrossRef]
- White, S.; Anandraj, A.; Bux, F. PAM Fluorometry as a Tool to Assess Microalgal Nutrient Stress and Monitor Cellular Neutral Lipids. Bioresour. Technol. 2011, 102, 1675–1682. [Google Scholar] [CrossRef]
- Klughammer, C.; Schreiber, U. Complementary PS II Quantum Yields Calculated from Simple Fluorescence Parameters Measured by PAM Fluorometry and the Saturation Pulse Method. PAM Appl. Notes 2008, 1, 27–35. [Google Scholar]
- Strasser, R.J.; Tsimilli-Michael, M.; Srivastava, A. Analysis of the Chlorophyll a Fluorescence Transient. In Chlorophyll a Fluorescence: A Signature of Photosynthesis; Papageorgiou, G.C., Govindjee, Eds.; Springer Netherlands: Dordrecht, The Netherlands, 2004; pp. 321–362. ISBN 978-1-4020-3218-9. [Google Scholar]
- Ranglová, K.; Lakatos, G.E.; Câmara Manoel, J.A.; Grivalský, T.; Suárez Estrella, F.; Acién Fernández, F.G.; Molnár, Z.; Ördög, V.; Masojídek, J. Growth, Biostimulant and Biopesticide Activity of the MACC-1 Chlorella Strain Cultivated Outdoors in Inorganic Medium and Wastewater. Algal Res. 2020, 53, 102136. [Google Scholar] [CrossRef]
- Wellburn, A.R. The Spectral Determination of Chlorophylls a and b, as Well as Total Carotenoids, using Various Solvents with Spectrophotometers of Different Resolution. J. Plant. Physiol. 1994, 144, 307–313. [Google Scholar] [CrossRef]
- Zhao, Z.R.; Wu, Z.L.; Huang, G.Q.; Li, G.R. An Improved Disk Bioassay for Determining Activities of Plant Growth Regulators. J. Plant. Growth Regul. 1992, 11, 209–213. [Google Scholar] [CrossRef]
- Kuhnle, J.A.; Fuller, G.; Corse, J.; Mackey, B.E. Antisenescent Activity of Natural Cytokinins. Physiol. Plant. 1977, 41, 14–21. [Google Scholar] [CrossRef]
- Hess, C.E.C. Mung Bean Bioassay for the Detection of Root Promoting Substances. Plant. Physiol. 1961, 36, 21. [Google Scholar]
- Posadas, E.; Alcántara, C.; García-Encina, P.A.; Gouveia, L.; Guieysse, B.; Norvill, Z.; Acién, F.G.; Markou, G.; Congestri, R.; Koreiviene, J.; et al. Microalgae Cultivation in Wastewater. In Microalgae-Based Biofuels and Bioproducts; Elsevier: Amsterdam, The Netherlands, 2017; pp. 67–91. [Google Scholar]
- Masojídek, J.; Ranglová, K.; Lakatos, G.E.; Silva Benavides, A.M.; Torzillo, G. Variables Governing Photosynthesis and Growth in Microalgae Mass Cultures. Processes 2021, 9, 820. [Google Scholar] [CrossRef]
- Torzillo, G.; Vonshak, A. Environmental Stress Physiology with Reference to Mass Cultures. In Handbook of Microalgal Culture: Applied Phycology and Biotechnology; Richmond, A., Hu, Q., Eds.; Wiley-Blackwell: Oxford, UK, 2013; pp. 90–113. [Google Scholar]
- Masojídek, J.; Kopecký, J.; Giannelli, L.; Torzillo, G. Productivity Correlated to Photobiochemical Performance of Chlorella Mass Cultures Grown Outdoors in Thin-Layer Cascades. J. Ind. Microbiol. Biotechnol. 2011, 38, 307–317. [Google Scholar] [CrossRef]
- Lívanský, K. Dependence of the Apparent CO2 Mass Transfer Coefficient KLa on the Nutrient Solution PH in Outdoor Algal Culture Units. Arch. Hydrobiol. Suppl. Algol. Stud. 1993, 71, 111–119. [Google Scholar]
- Lívanský, K.; Doucha, J. CO2 and O2 Gas Exchange in Outdoor Thin-Layer High Density Microalgal Cultures. J. Appl. Phycol. 1996, 8, 353–358. [Google Scholar] [CrossRef]
- Arbib, Z.; Ruiz, J.; Álvarez-Díaz, P.; Garrido-Pérez, C.; Barragan, J.; Perales, J.A. Effect of PH Control by Means of Flue Gas Addition on Three Different Photo-Bioreactors Treating Urban Wastewater in Long-Term Operation. Ecol. Eng. 2013, 57, 226–235. [Google Scholar] [CrossRef]
- Rearte, T.A.; Celis-Plá, P.S.M.; Neori, A.; Masojídek, J.; Torzillo, G.; Gómez-Serrano, C.; Silva Benavides, A.M.; Álvarez-Gómez, F.; Abdala-Díaz, R.T.; Ranglová, K.; et al. Photosynthetic Performance of Chlorella Vulgaris R117 Mass Culture Is Moderated by Diurnal Oxygen Gradients in an Outdoor Thin Layer Cascade. Algal Res. 2021, 54, 102176. [Google Scholar] [CrossRef]
- Posadas, E.; Bochon, S.; Coca, M.; García-González, M.C.; García-Encina, P.A.; Muñoz, R. Microalgae-Based Agro-Industrial Wastewater Treatment: A Preliminary Screening of Biodegradability. J. Appl. Phycol. 2014, 26, 2335–2345. [Google Scholar] [CrossRef]
- Beardall, J.; Quigg, A.; Raven, J. Oxygen Consumption: Photorespiration and Chlororespiration. In Photosynthesis in Algae; Larkum, A., Douglas, S., Raven, J., Eds.; Kluwer Academic Publishers: Norwell, MA, USA, 2003; pp. 157–181. [Google Scholar]
- Masojídek, J.; Kopecký, J.; Koblížek, M.; Torzillo, G. The Xanthophyll Cycle in Green Algae (Chlorophyta): Its Role in the Photosynthetic Apparatus. Plant. Biol. 2004, 6, 342–349. [Google Scholar] [CrossRef]
- Delgadillo-Mirquez, L.; Lopes, F.; Taidi, B.; Pareau, D. Nitrogen and Phosphate Removal from Wastewater with a Mixed Microalgae and Bacteria Culture. Biotechnol. Reports 2016, 11, 18–26. [Google Scholar] [CrossRef]
- Wang, Y.; Guo, W.; Yen, H.-W.; Ho, S.-H.; Lo, Y.-C.; Cheng, C.-L.; Ren, N.; Chang, J.-S. Cultivation of Chlorella Vulgaris JSC-6 with Swine Wastewater for Simultaneous Nutrient/COD Removal and Carbohydrate Production. Bioresour. Technol. 2015, 198, 619–625. [Google Scholar] [CrossRef]
- Santini, G.; Biondi, N.; Rodolfi, L.; Tredici, M.R. Plant Biostimulants from Cyanobacteria: An Emerging Strategy to Improve Yields and Sustainability in Agriculture. Plants 2021, 10, 643. [Google Scholar] [CrossRef]
- Kopittke, P.M.; Menzies, N.W.; Wang, P.; McKenna, B.A.; Lombi, E. Soil and the Intensification of Agriculture for Global Food Security. Environ. Int. 2019, 132, 105078. [Google Scholar] [CrossRef]
- Du Jardin, P. Plant Biostimulants: Definition, Concept, Main Categories and Regulation. Sci. Hortic. 2015, 196, 3–14. [Google Scholar] [CrossRef]
- Plaza, B.M.; Gómez-Serrano, C.; Acién-Fernández, F.G.; Jimenez-Becker, S. Effect of Microalgae Hydrolysate Foliar Application (Arthrospira Platensis and Scenedesmus Sp.) on Petunia x Hybrida Growth. J. Appl. Phycol. 2018, 30, 2359–2365. [Google Scholar] [CrossRef]
- Takács, G.; Stirk, W.A.; Gergely, I.; Molnár, Z.; van Staden, J.; Ördög, V. Biostimulating Effects of the Cyanobacterium Nostoc Piscinale on Winter Wheat in Field Experiments. South. African J. Bot. 2019, 126, 99–106. [Google Scholar] [CrossRef]
- Toribio, A.; Suárez-Estrella, F.; Jurado, M.; López, M.; López-González, J.; Moreno, J. Prospection of Cyanobacteria Producing Bioactive Substances and Their Application as Potential Phytostimulating Agents. Biotechnol. Rep. 2020, 26, e00449. [Google Scholar] [CrossRef]
- Stirk, W.A.; Bálint, P.; Maróti, G.; Varga, Z.; Lantos, Z.; van Staden, J.; Ördög, V. Comparison of Monocultures and a Mixed Culture of Three Chlorellaceae Strains to Optimize Biomass Production and Biochemical Content in Microalgae Grown in a Greenhouse. J. Appl. Phycol. 2021, 33, 2755–2766. [Google Scholar] [CrossRef]
- Mutum, L.; Janda, T.; Ördög, V.; Molnár, Z. Biologia Futura: Potential of Different Forms of Microalgae for Soil Improvement. Biol. Futur. 2022, 73, 1–8. [Google Scholar] [CrossRef]
- Navarro-López, E.; Ruíz-Nieto, A.; Ferreira, A.; Acién, F.G.; Gouveia, L. Biostimulant Potential of Scenedesmus Obliquus Grown in Brewery Wastewater. Molecules 2020, 25, 664. [Google Scholar] [CrossRef]
- Carneiro, M.; Ranglová, K.; Lakatos, G.E.; Câmara Manoel, J.A.; Grivalský, T.; Kozhan, D.M.; Toribio, A.; Moreno, J.; Otero, A.; Varela, J.; et al. Growth and Bioactivity of Two Chlorophyte (Chlorella and Scenedesmus) Strains Co-Cultured Outdoors in Two Different Thin-Layer Units Using Municipal Wastewater as a Nutrient Source. Algal Res. 2021, 56, 102299. [Google Scholar] [CrossRef]


| COD (mg DW L−1) | Nitrogen (mg DW L−1) | Phosphorous (mg DW L−1) | ||||
|---|---|---|---|---|---|---|
| RWP1 | RWP 2 | RWP1 | RWP 2 | RWP1 | RWP 2 | |
| Inlet WW | 550 | 550 | 58 | 58 | 10.7 | 10.7 |
| Outlet culture | 82 | 73 | 16 | 12 | 6.8 | 3.8 |
| Removal (%) | 85 | 85 | 72 | 79 | 36 | 65 |
| Day | Daytime | Temperature (°C) | pH | DO Concentration (% of Saturation) | |||
|---|---|---|---|---|---|---|---|
| RWP1 | RWP2 | RWP1 | RWP2 | RWP1 | RWP2 | ||
| Day 2 | 9:00 | 24.4 | 23.8 | 8.0 | 8.7 | 12 | 14 |
| 13:00 | 27.6 | 27.7 | 8.7 | 9.2 | 198 | 204 | |
| 17:00 | 31.9 | 32.2 | 9.0 | 9.6 | 288 | 319 | |
| Day 3 | 9:00 | 25.2 | 24.3 | 7.9 | 8.3 | 16 | 19 |
| 13:00 | 28.9 | 28.9 | 8.8 | 9.0 | 221 | 197 | |
| 17:00 | 33.3 | 33.8 | 9.1 | 9.6 | 325 | 278 | |
Publisher’s Note: MDPI stays neutral with regard to jurisdictional claims in published maps and institutional affiliations. |
© 2022 by the authors. Licensee MDPI, Basel, Switzerland. This article is an open access article distributed under the terms and conditions of the Creative Commons Attribution (CC BY) license (https://creativecommons.org/licenses/by/4.0/).
Share and Cite
Masojídek, J.; Gómez-Serrano, C.; Ranglová, K.; Cicchi, B.; Encinas Bogeat, Á.; Câmara Manoel, J.A.; Sanches Zurano, A.; Silva Benavides, A.M.; Barceló-Villalobos, M.; Robles Carnero, V.A.; et al. Photosynthesis Monitoring in Microalgae Cultures Grown on Municipal Wastewater as a Nutrient Source in Large-Scale Outdoor Bioreactors. Biology 2022, 11, 1380. https://doi.org/10.3390/biology11101380
Masojídek J, Gómez-Serrano C, Ranglová K, Cicchi B, Encinas Bogeat Á, Câmara Manoel JA, Sanches Zurano A, Silva Benavides AM, Barceló-Villalobos M, Robles Carnero VA, et al. Photosynthesis Monitoring in Microalgae Cultures Grown on Municipal Wastewater as a Nutrient Source in Large-Scale Outdoor Bioreactors. Biology. 2022; 11(10):1380. https://doi.org/10.3390/biology11101380
Chicago/Turabian StyleMasojídek, Jiří, Cintia Gómez-Serrano, Karolína Ranglová, Bernardo Cicchi, Ángel Encinas Bogeat, João A. Câmara Manoel, Ana Sanches Zurano, Ana Margarita Silva Benavides, Marta Barceló-Villalobos, Victor A. Robles Carnero, and et al. 2022. "Photosynthesis Monitoring in Microalgae Cultures Grown on Municipal Wastewater as a Nutrient Source in Large-Scale Outdoor Bioreactors" Biology 11, no. 10: 1380. https://doi.org/10.3390/biology11101380