
Composite Films of HDPE with SiO2 and ZrO2 Nanoparticles: The Structure and Interfacial Effects

 , , , , , , , , and
Abstract
:
1. Introduction
2. Materials and Methods
2.1. Materials
2.2. Nanocomposite Films Preparation
2.3. Small-Angle X-ray Scattering and Wide-Angle X-ray Scattering
2.4. Small-Angle Neutron Scattering
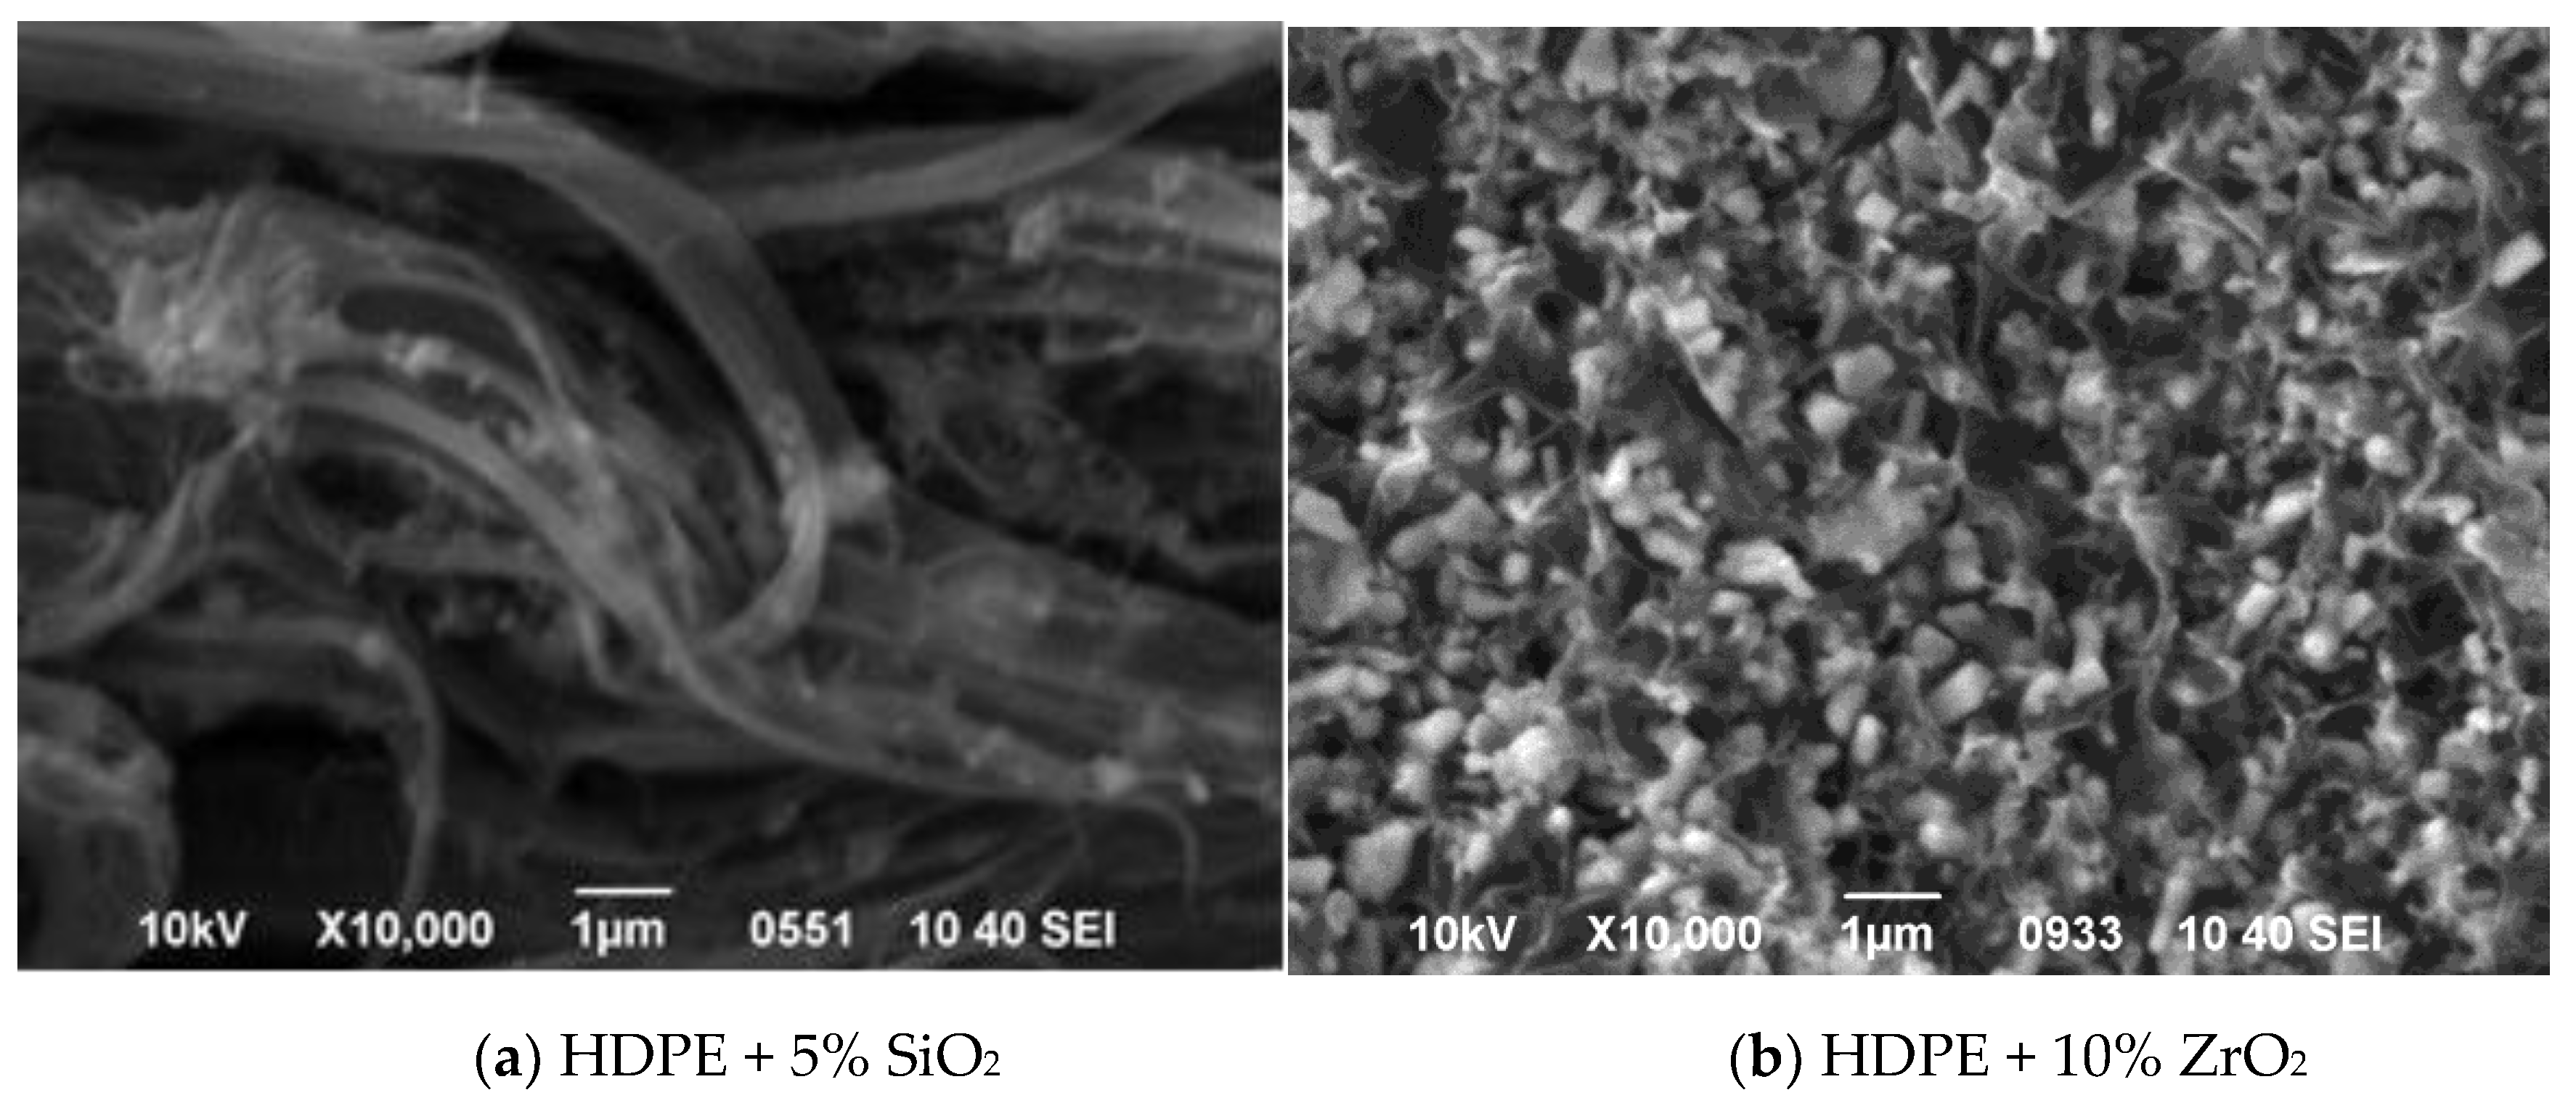
2.5. Transmission Electron Microscopy and Scanning Electron Microscopy
2.6. Differential Scanning Calorimetry and Thermogravimetric Analysis
2.7. Vibrational Spectroscopy
3. Results and Discussion
3.1. Characterization of the SiO2 and ZrO2 Nanoparticle Powders
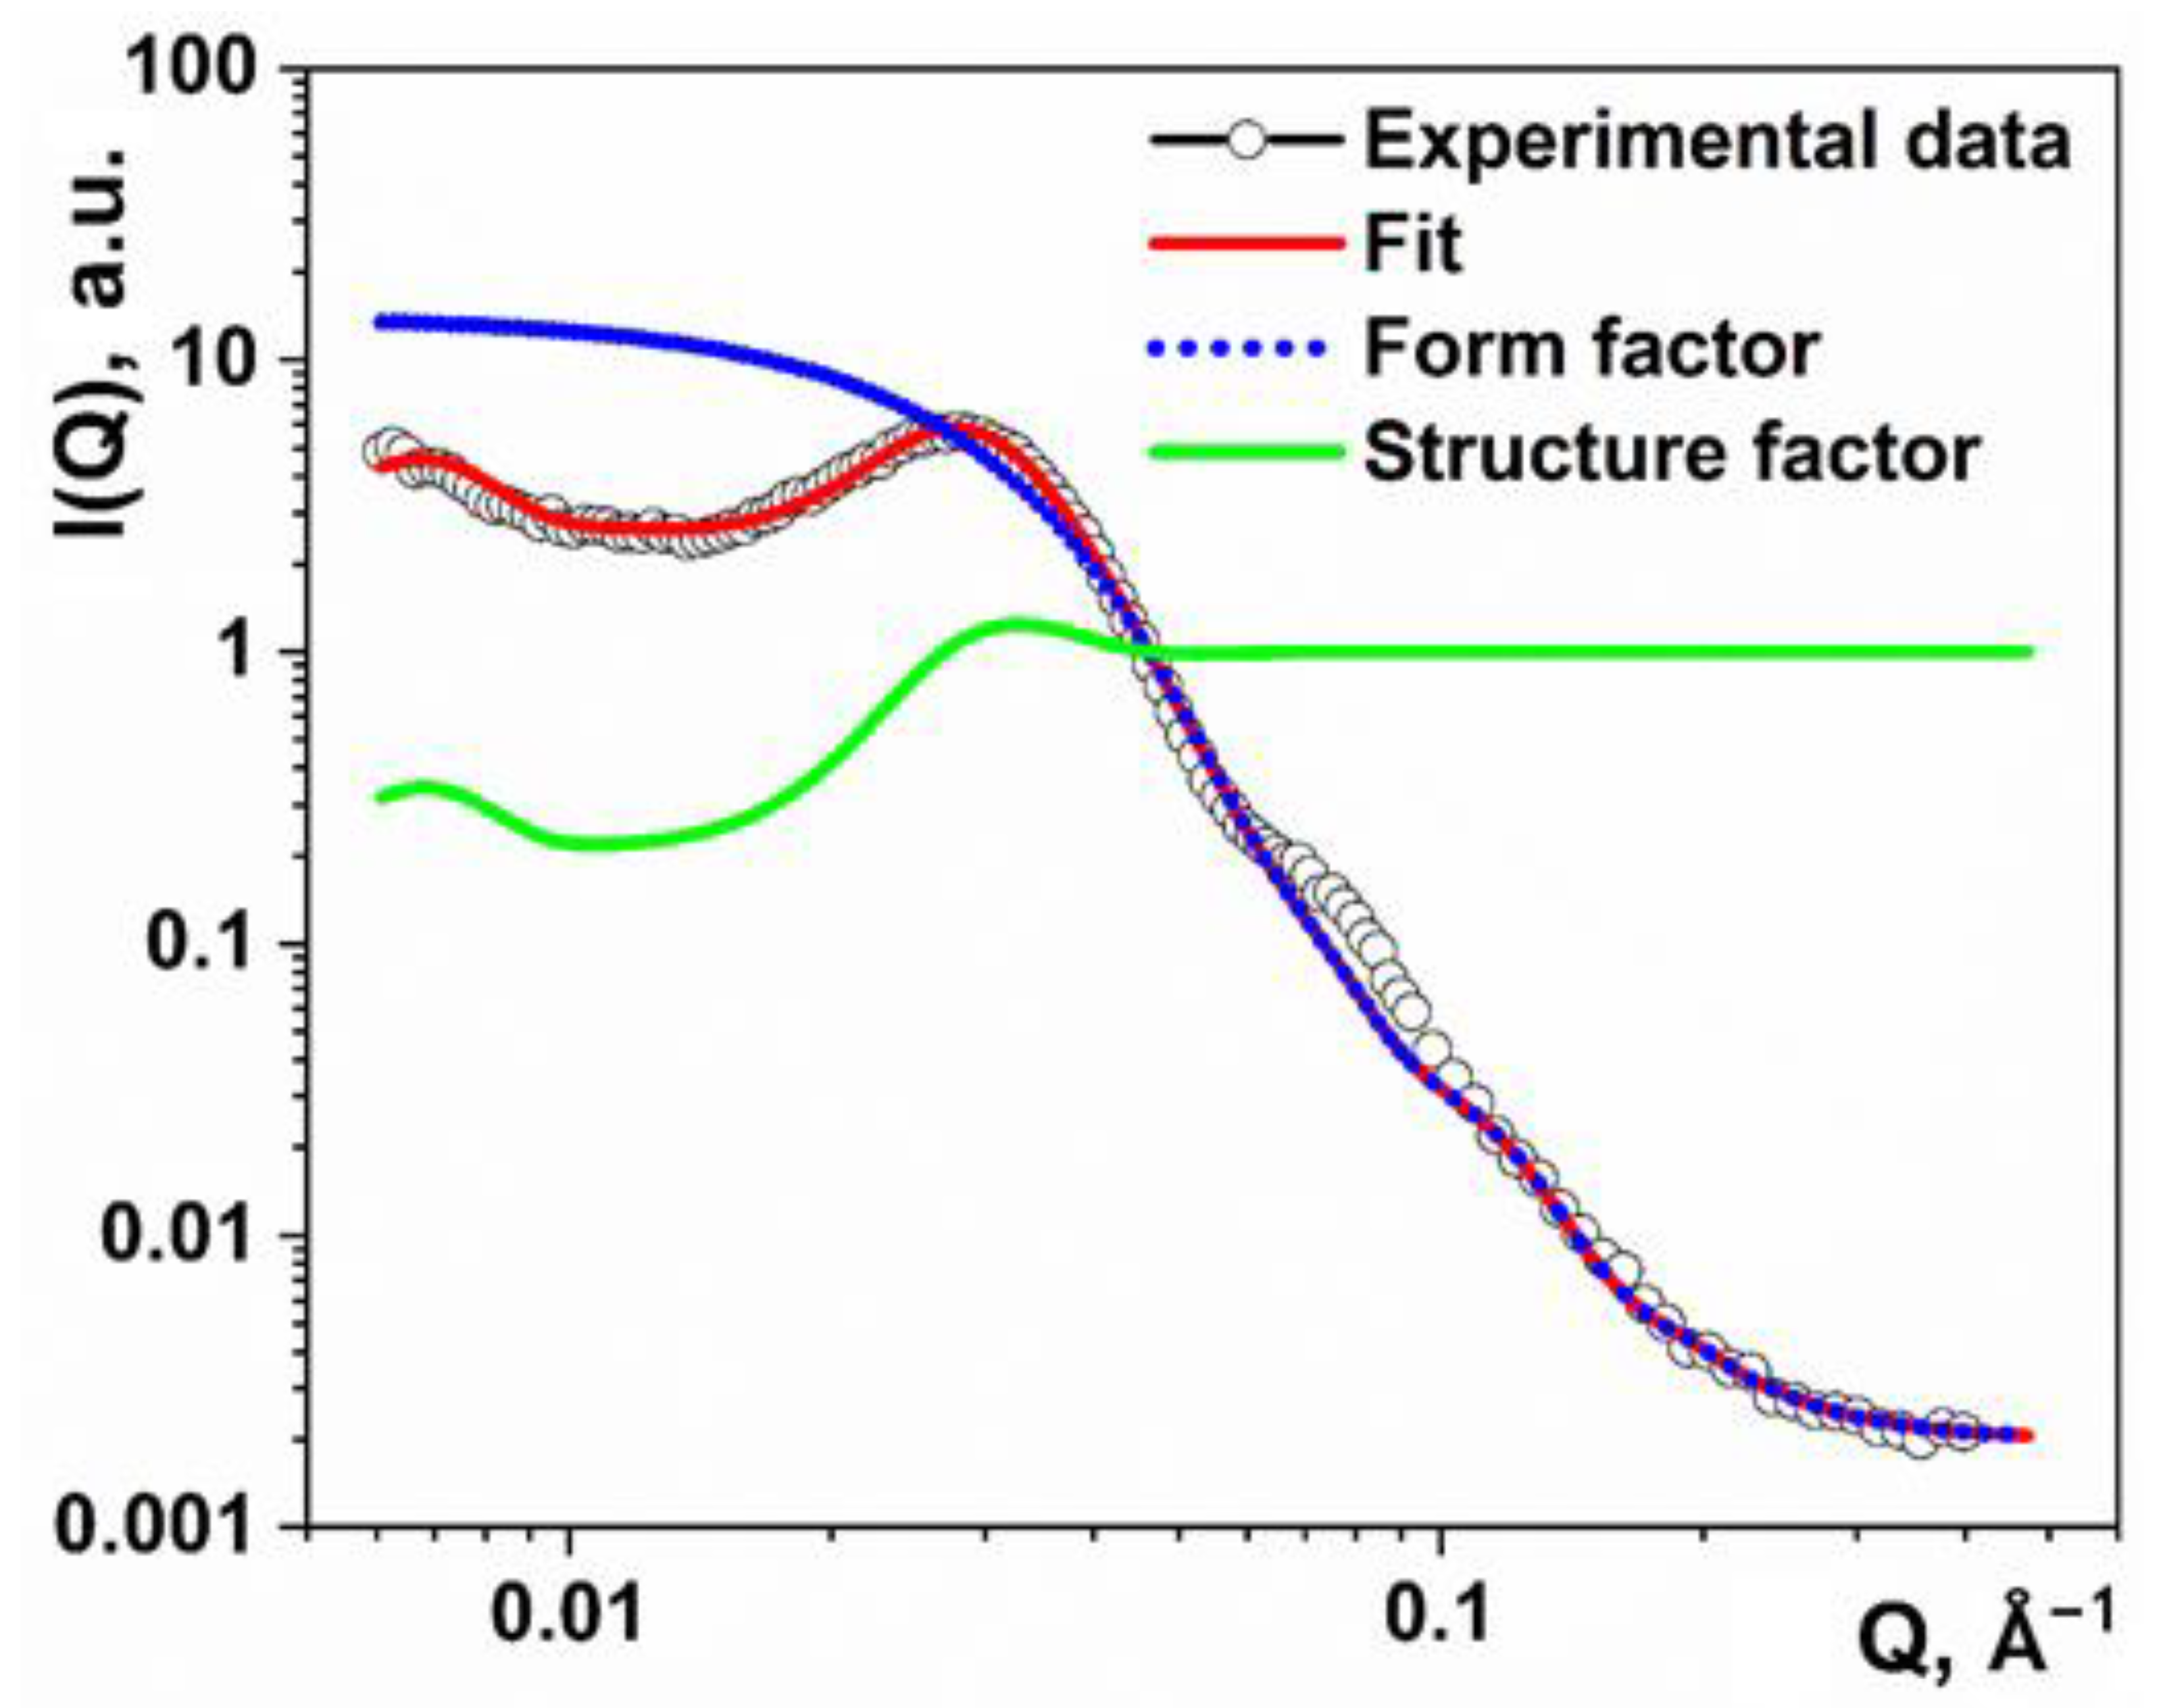
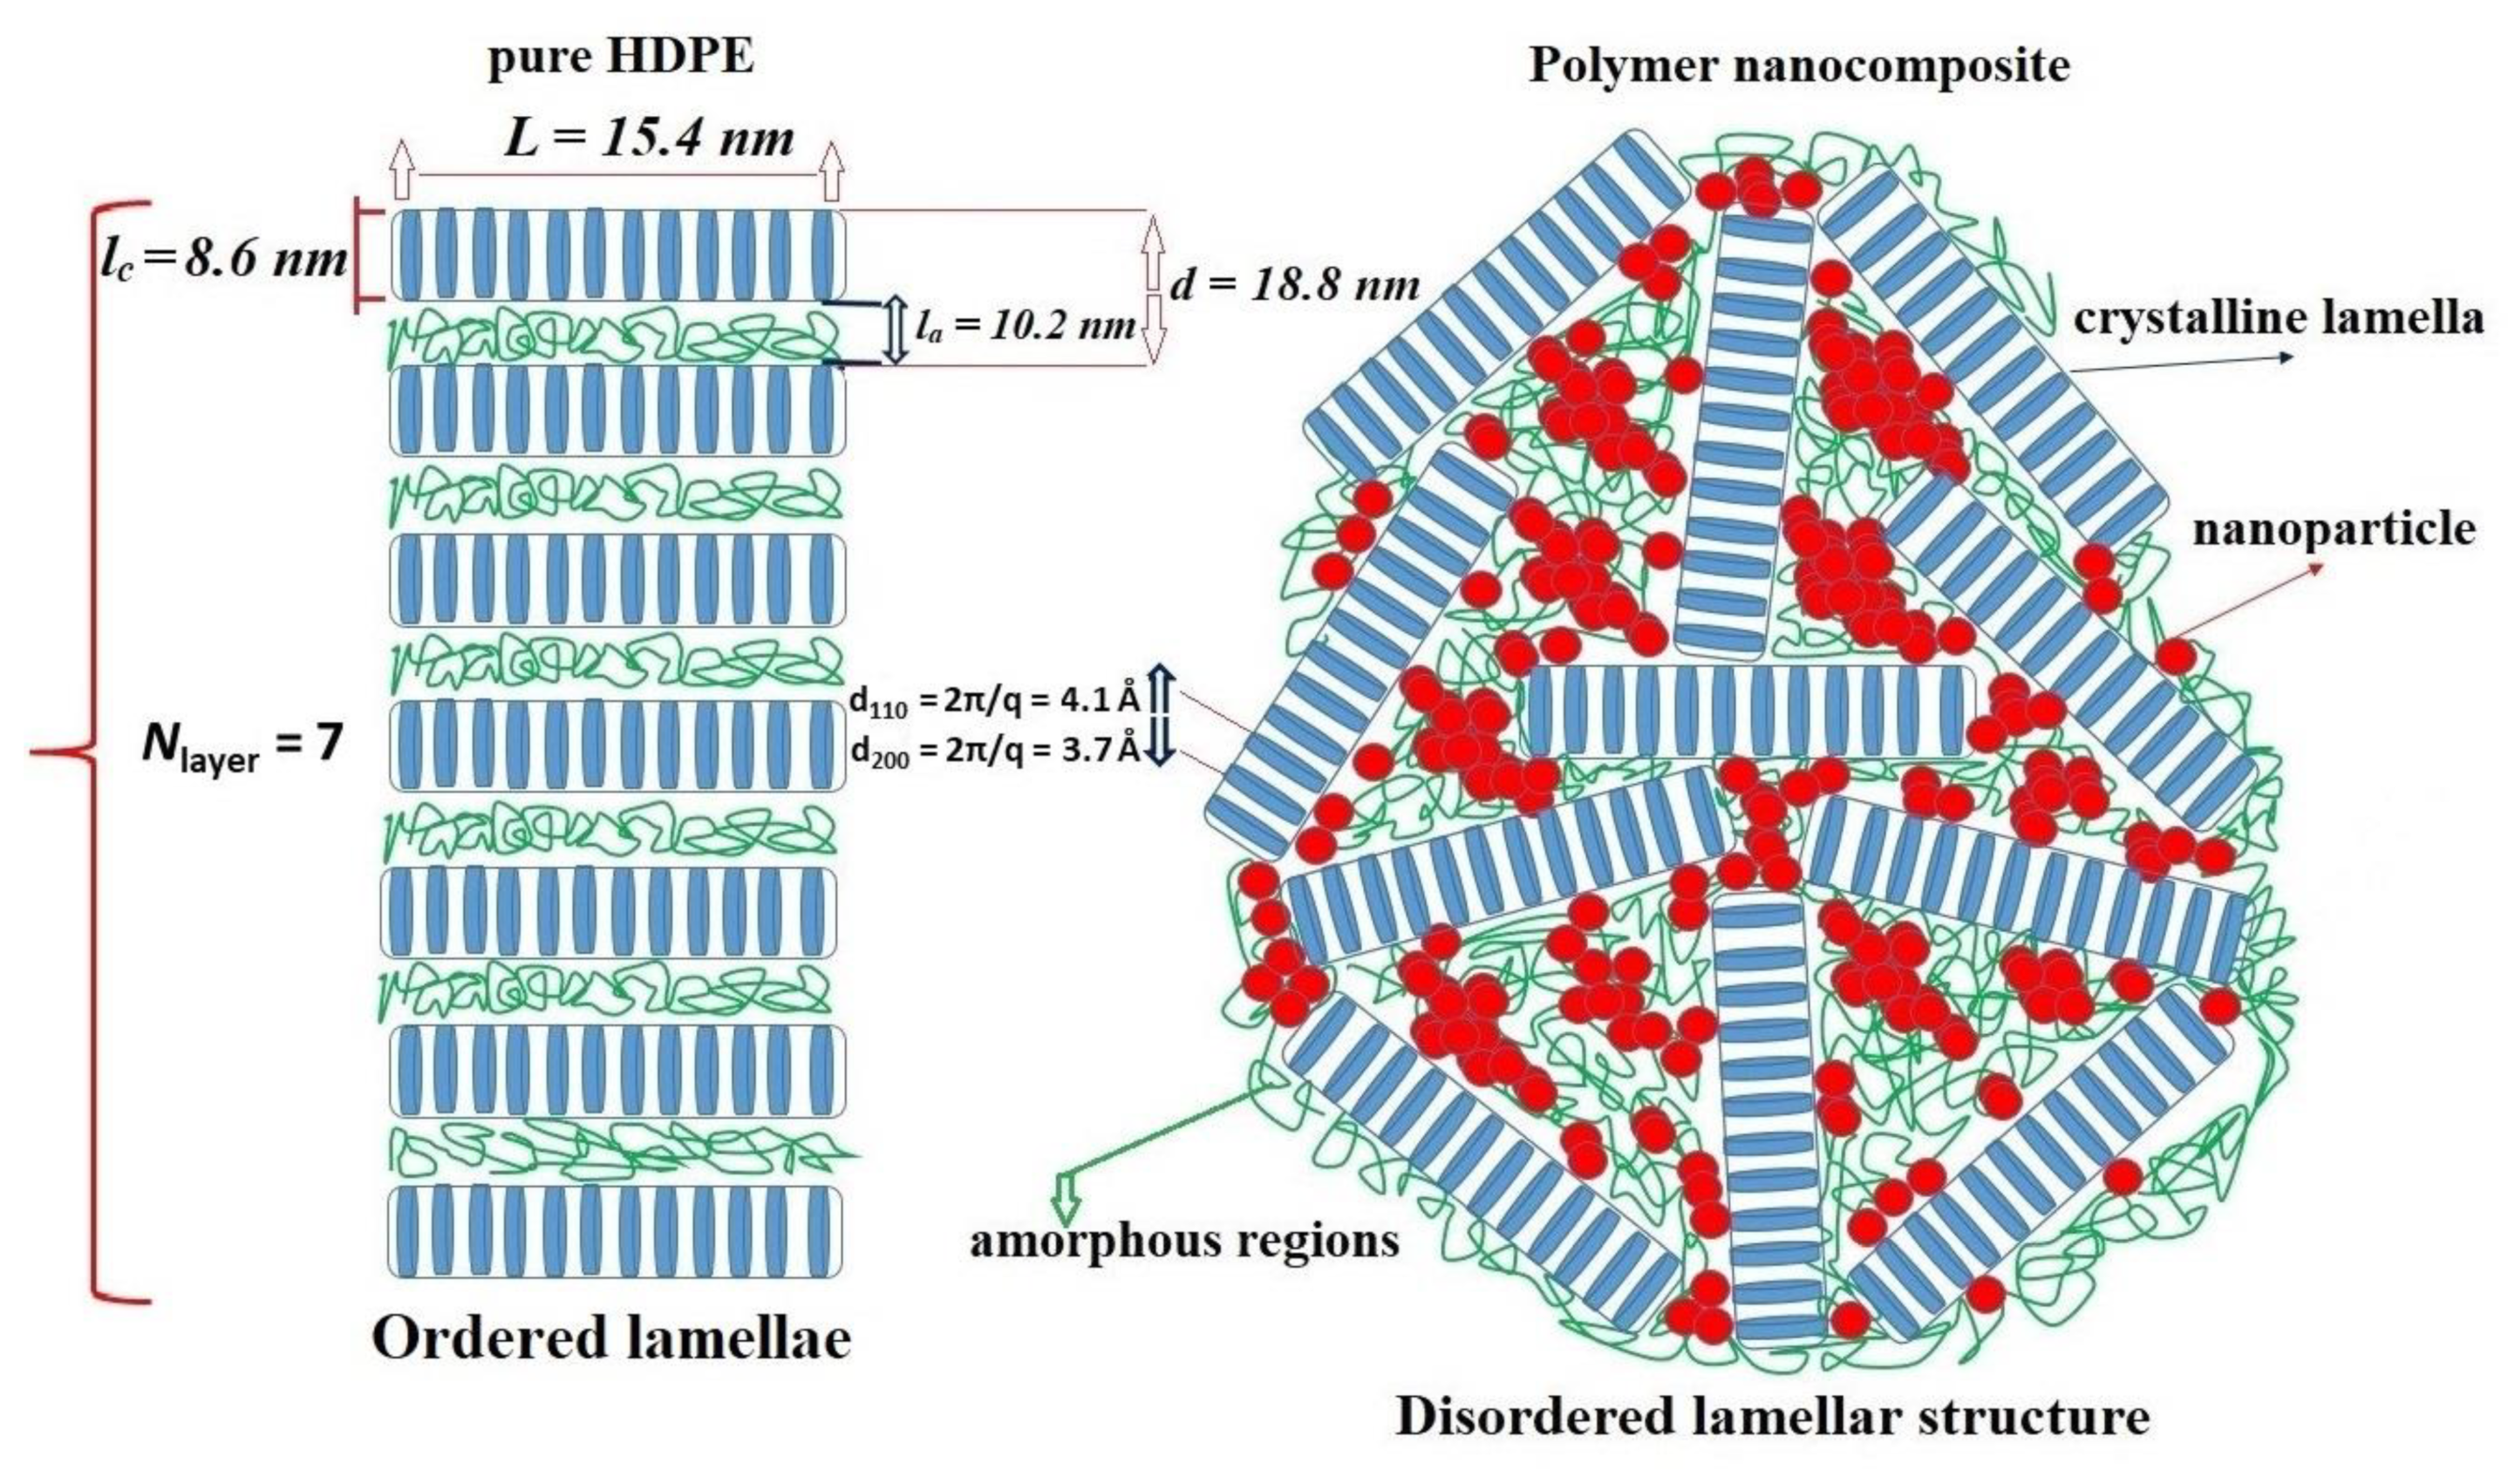
3.2. Small-Angle X-ray Scattering of Pure HDPE
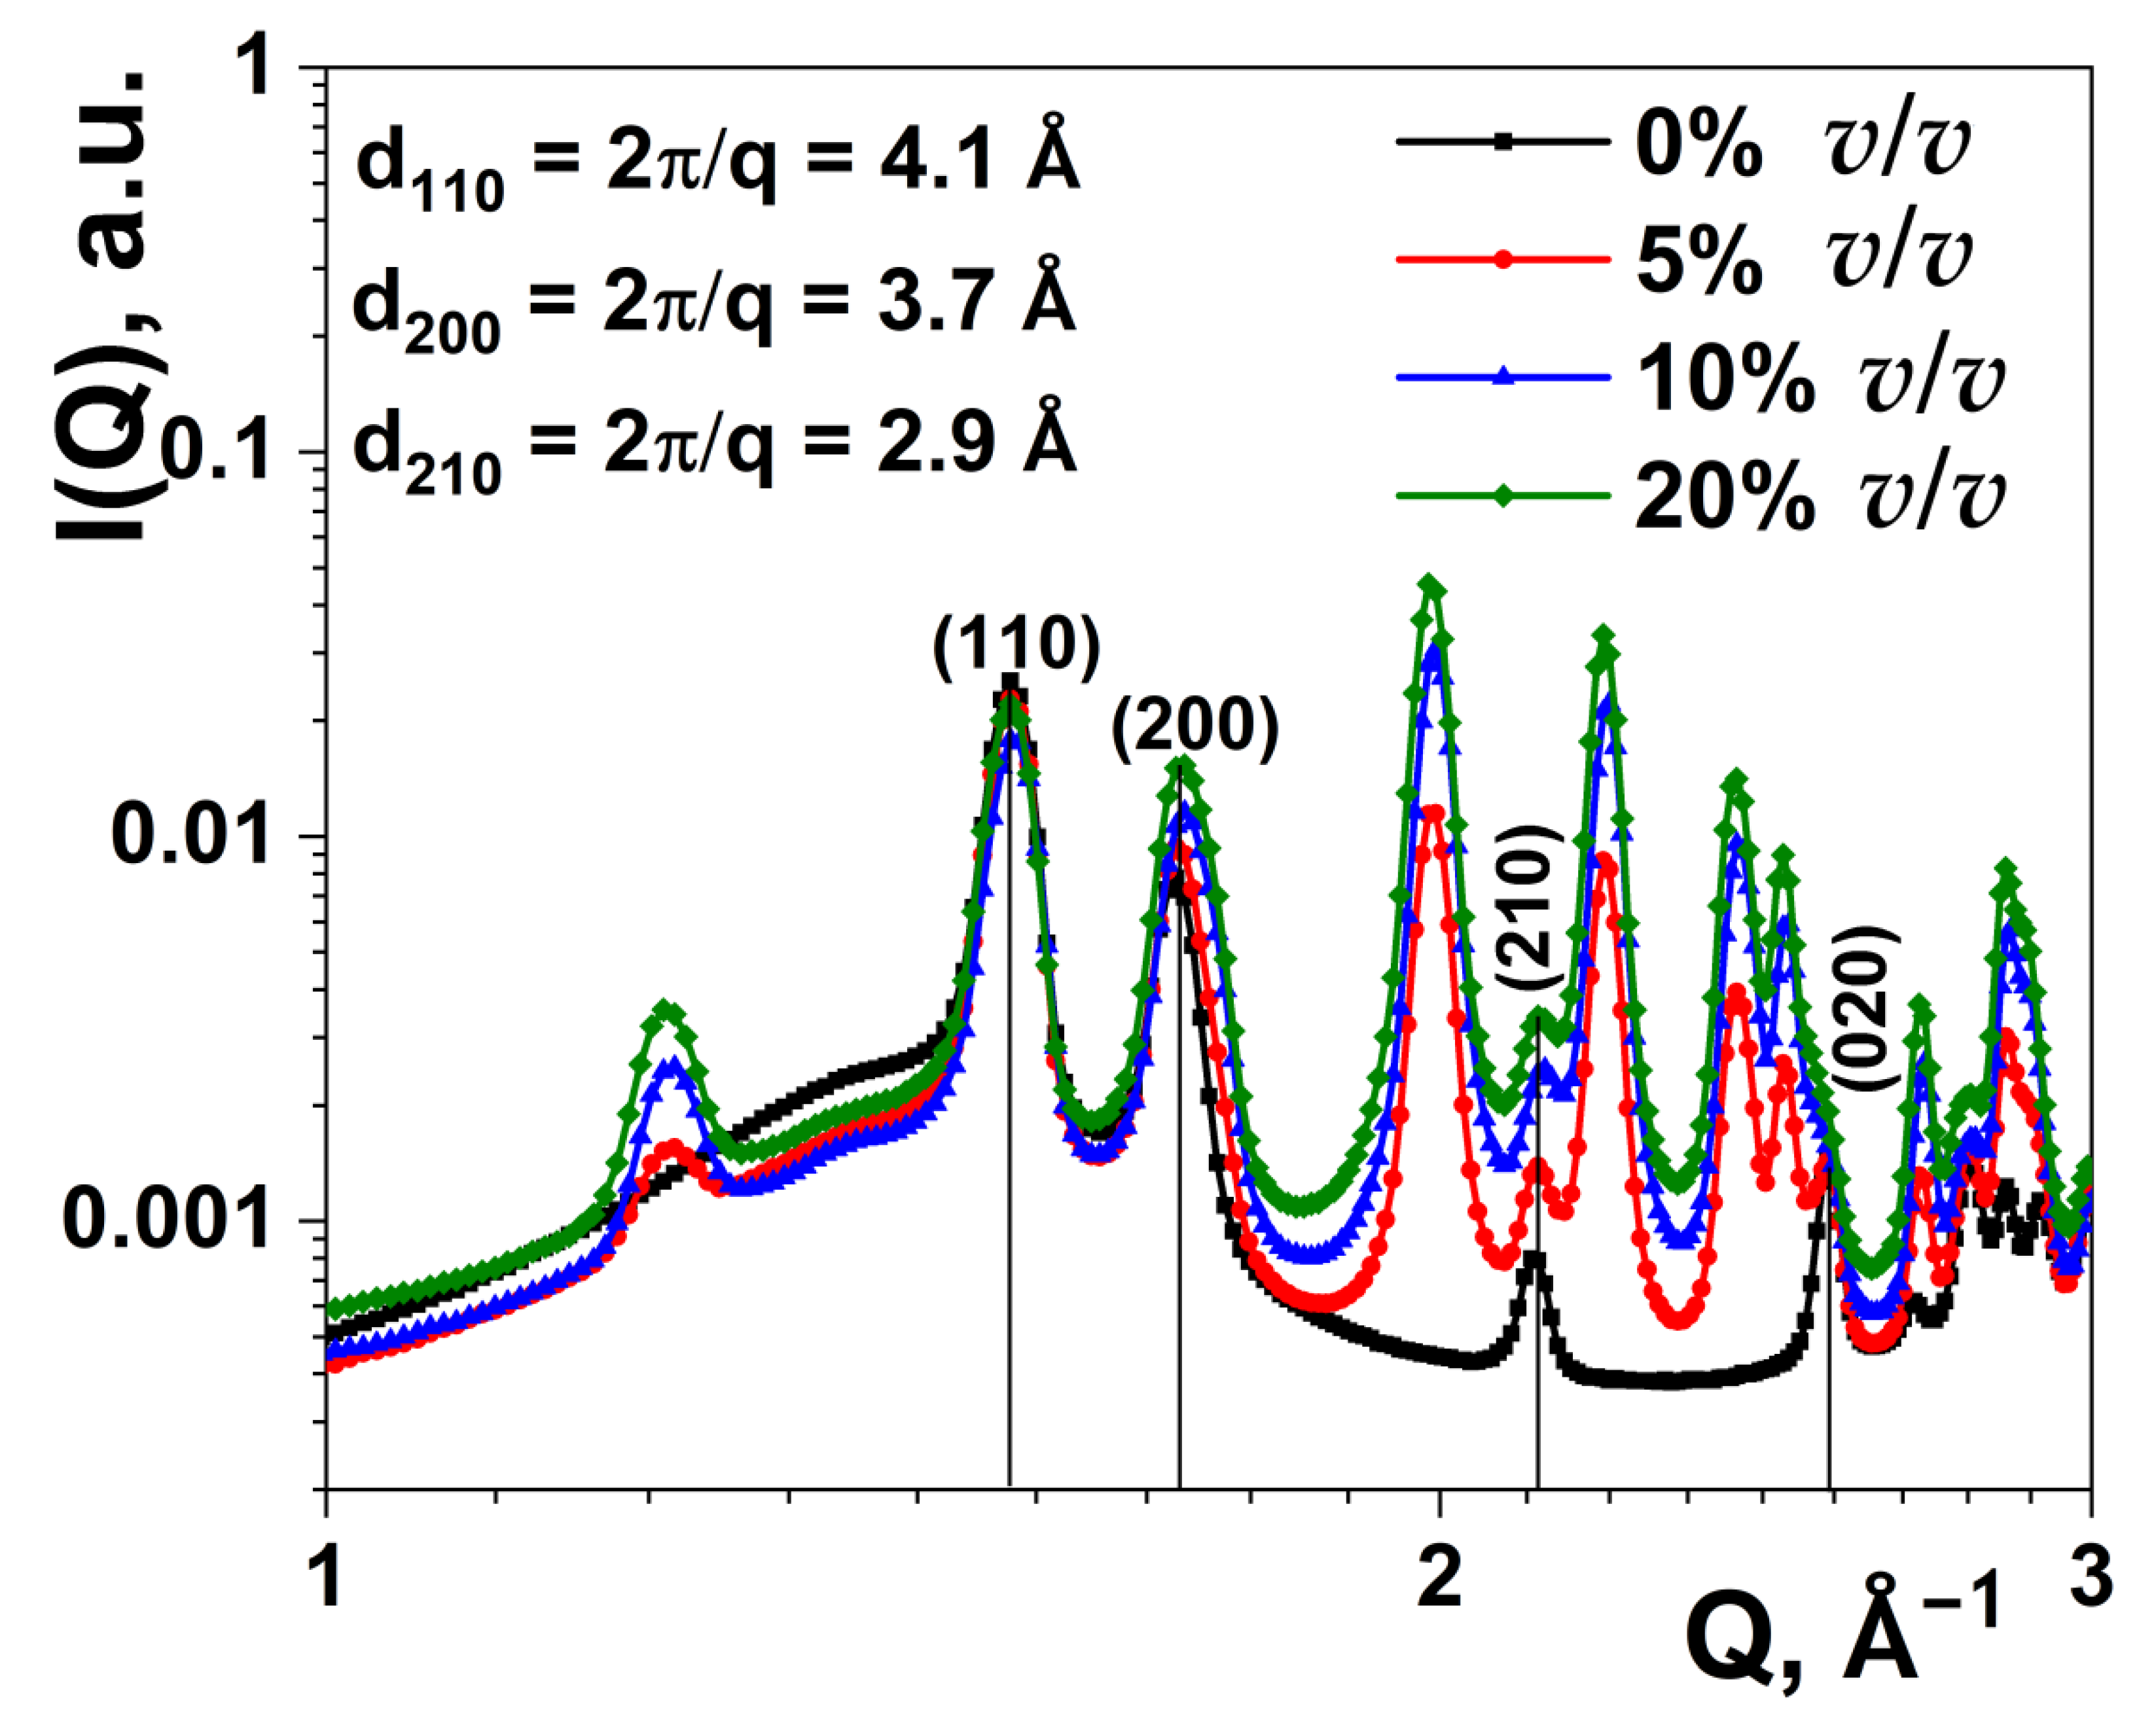
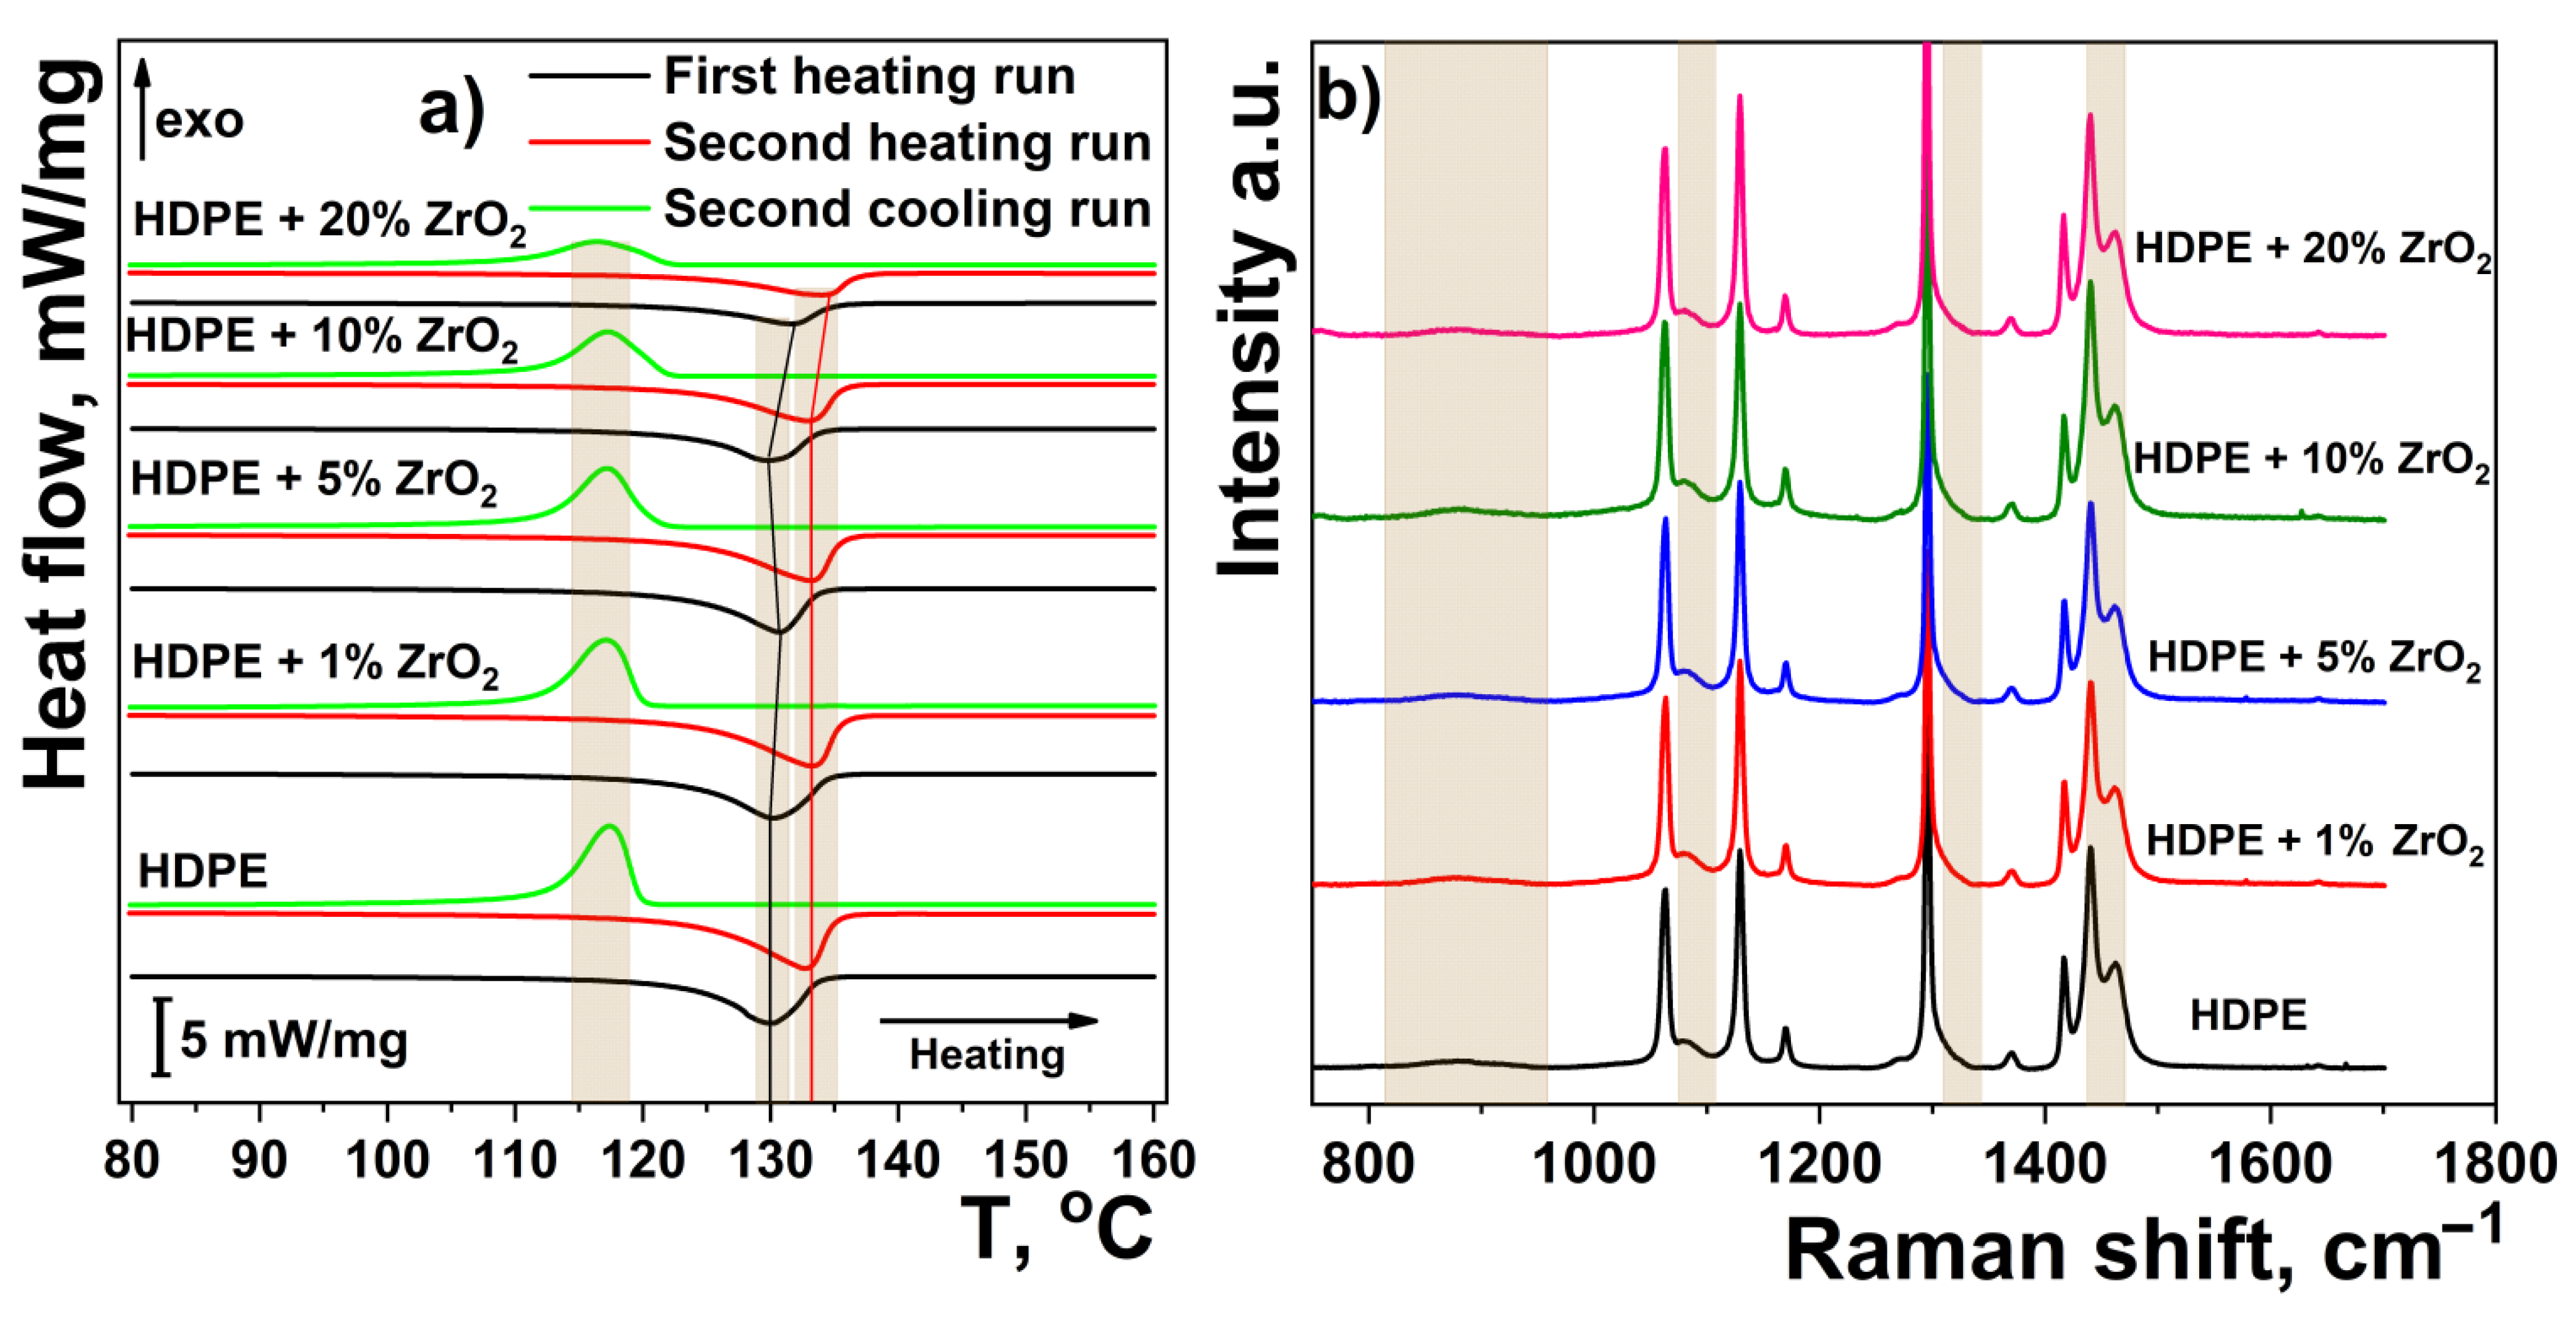
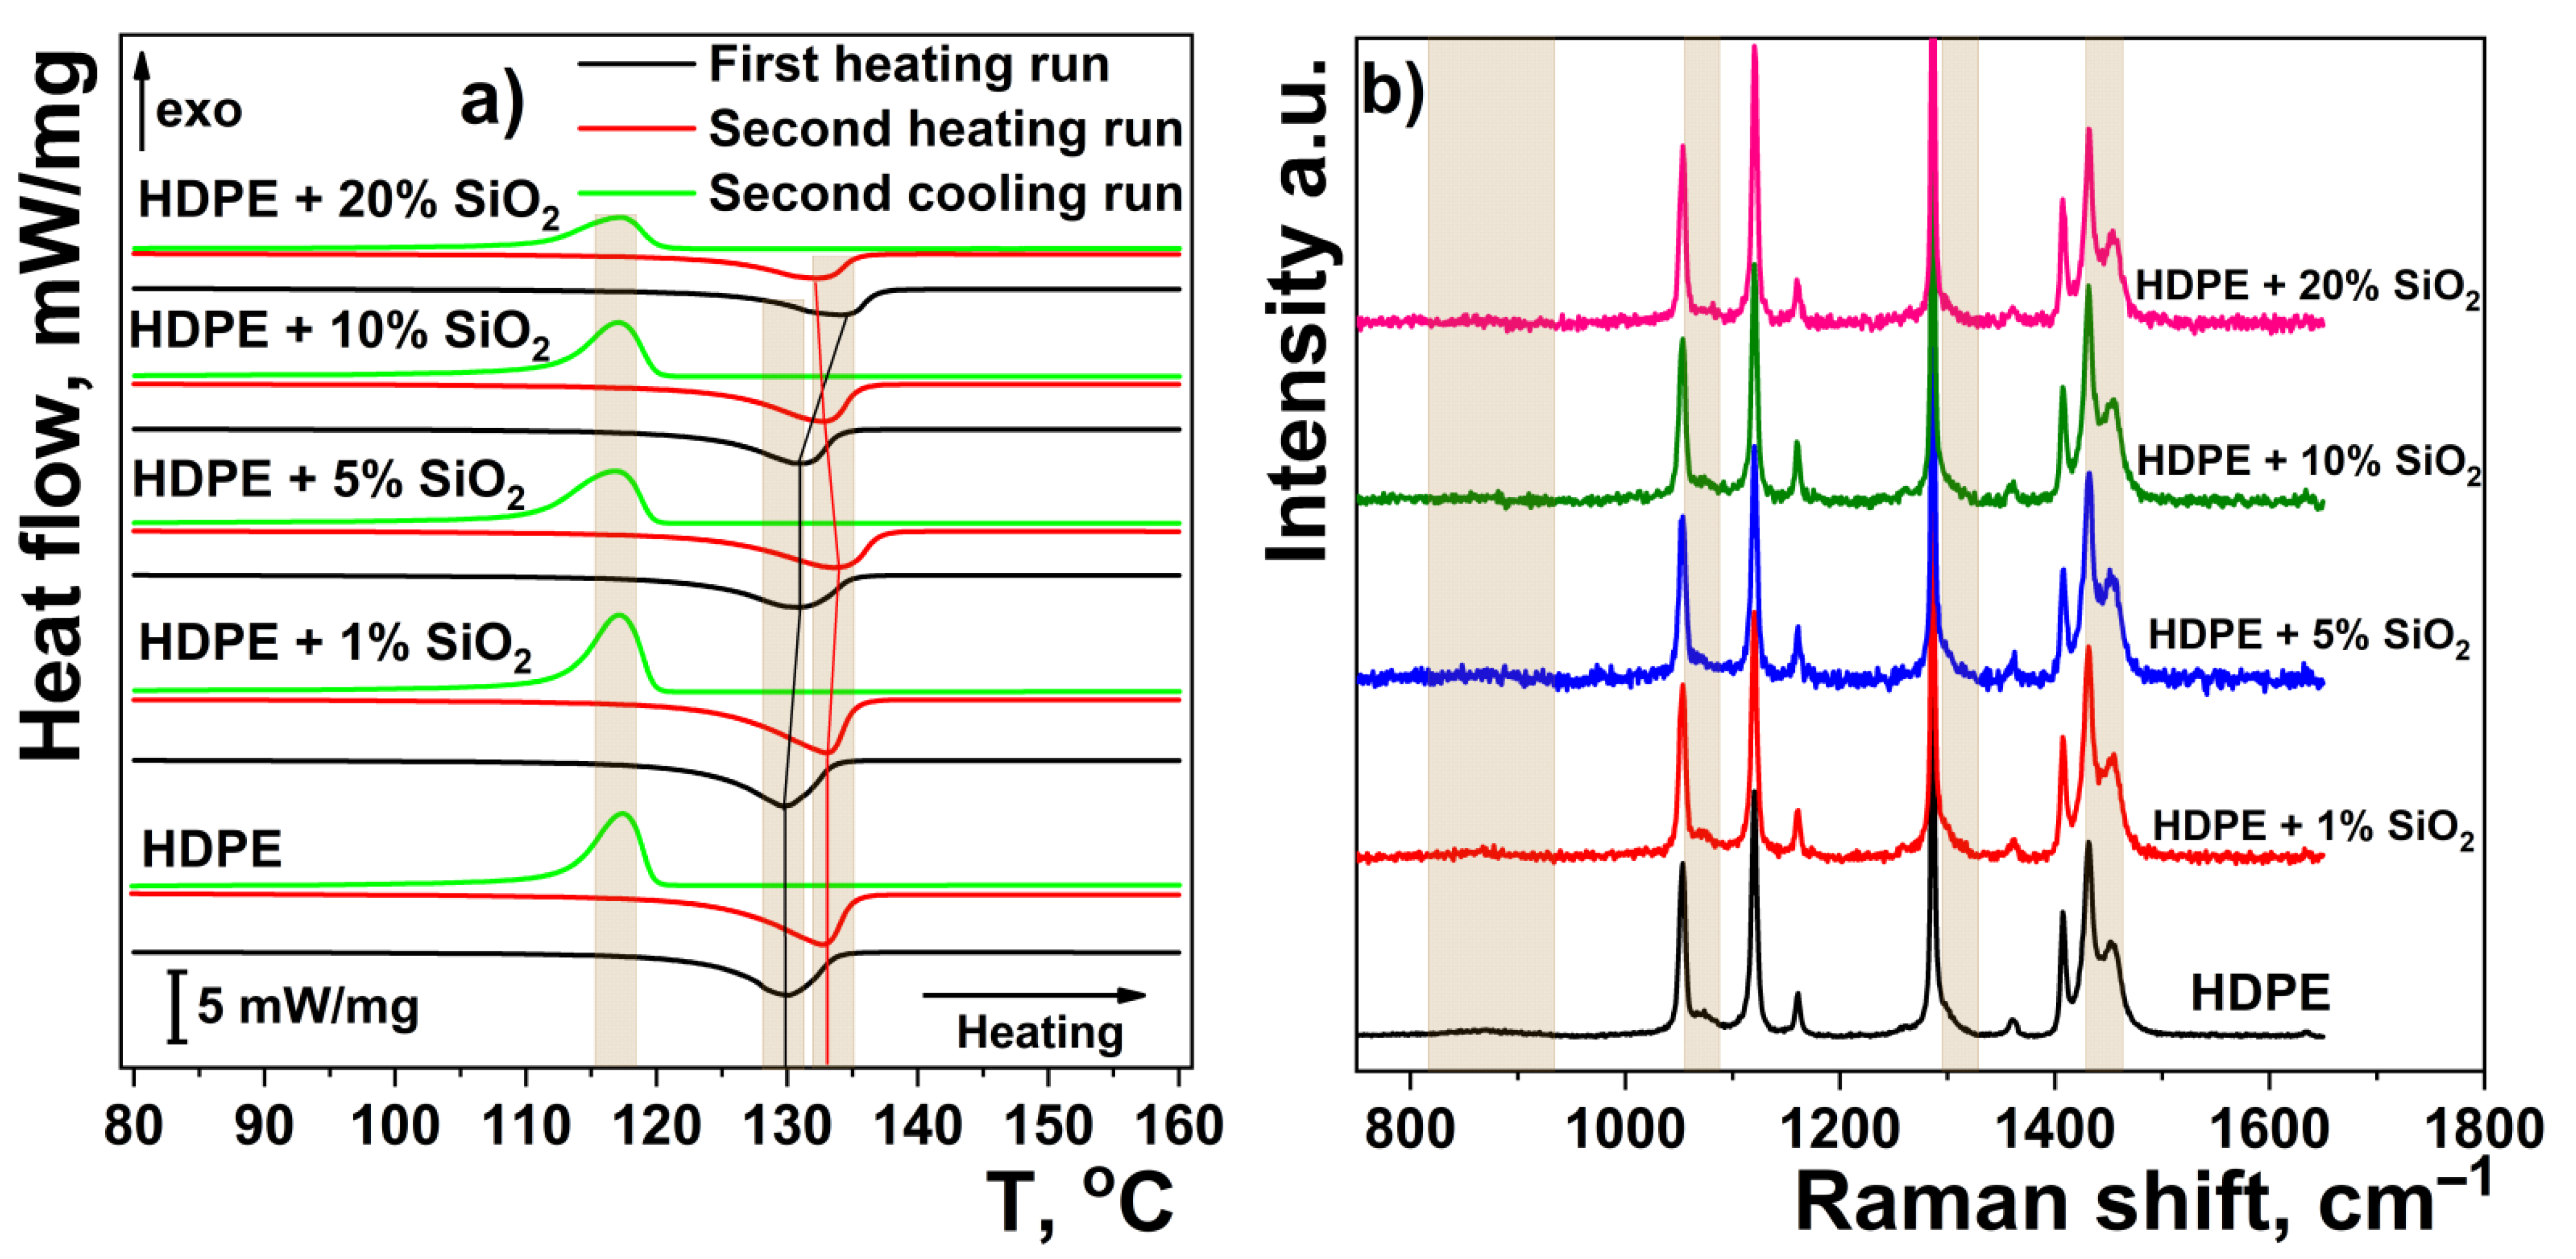
3.3. Effect of Filler Type and Concentration on the Crystallinity of the HDPE Matrix
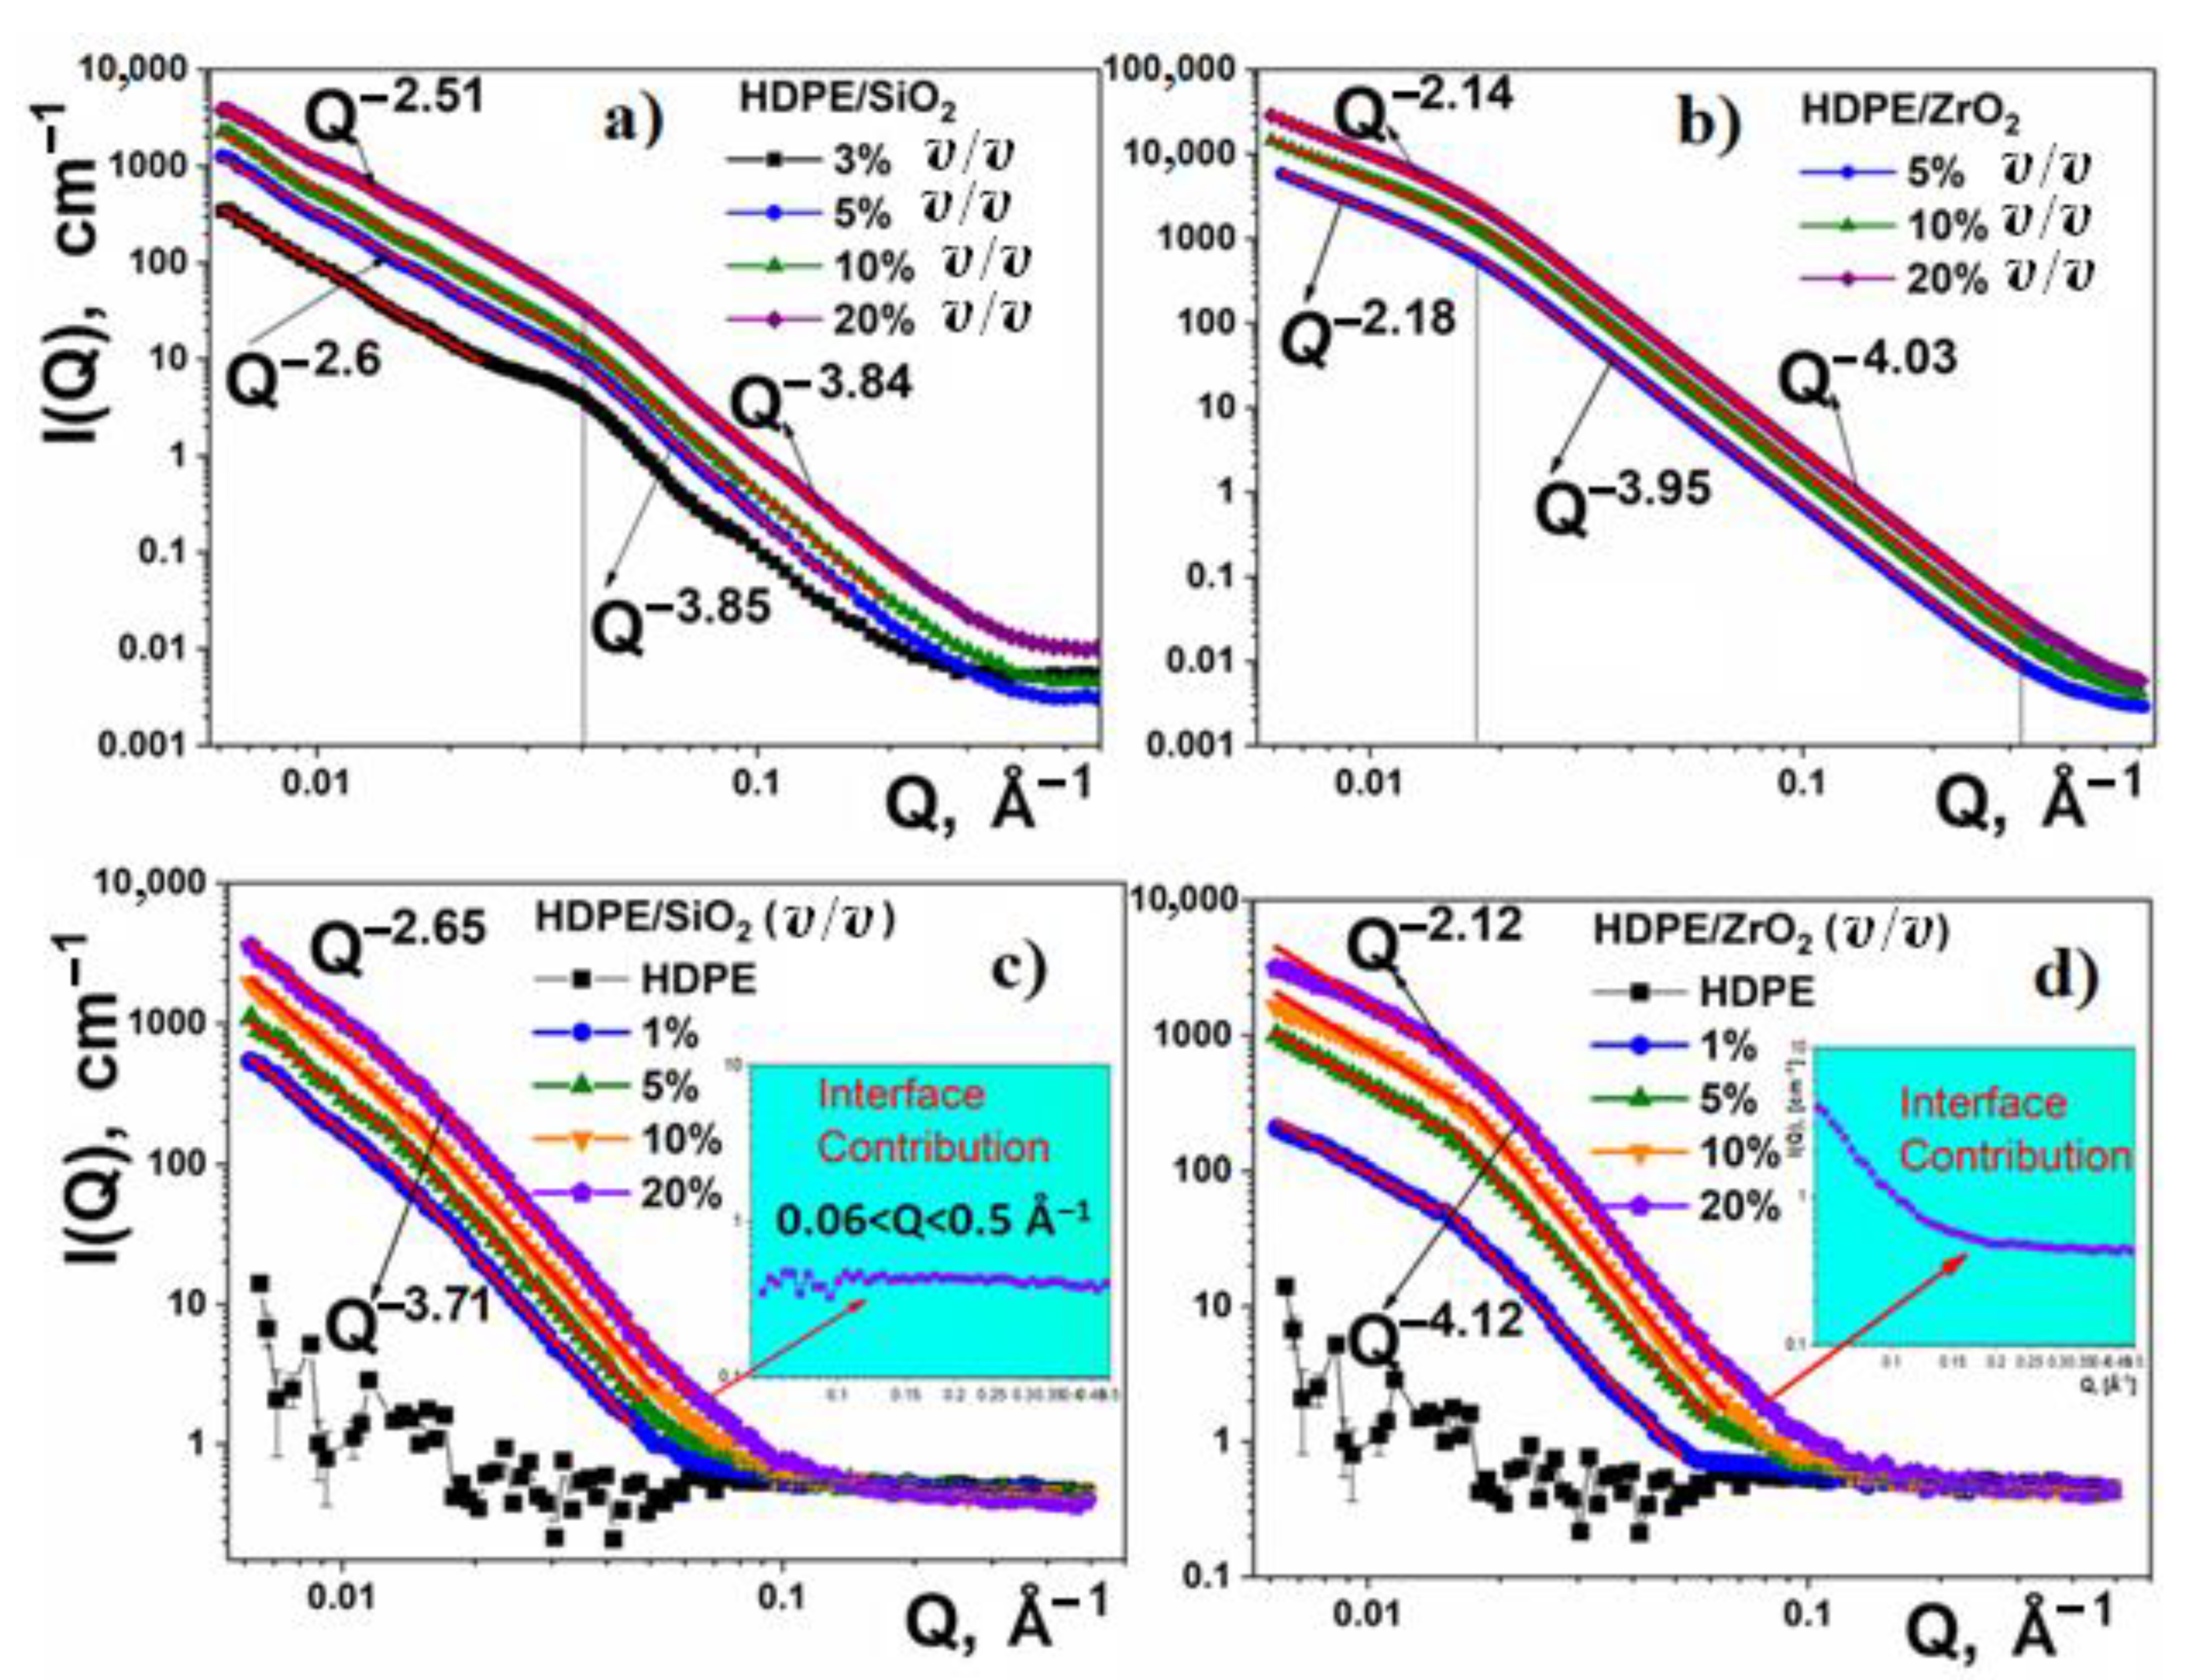
3.4. Small-Angle Neutron and X-ray Scattering of Polymer Nanocomposite Films
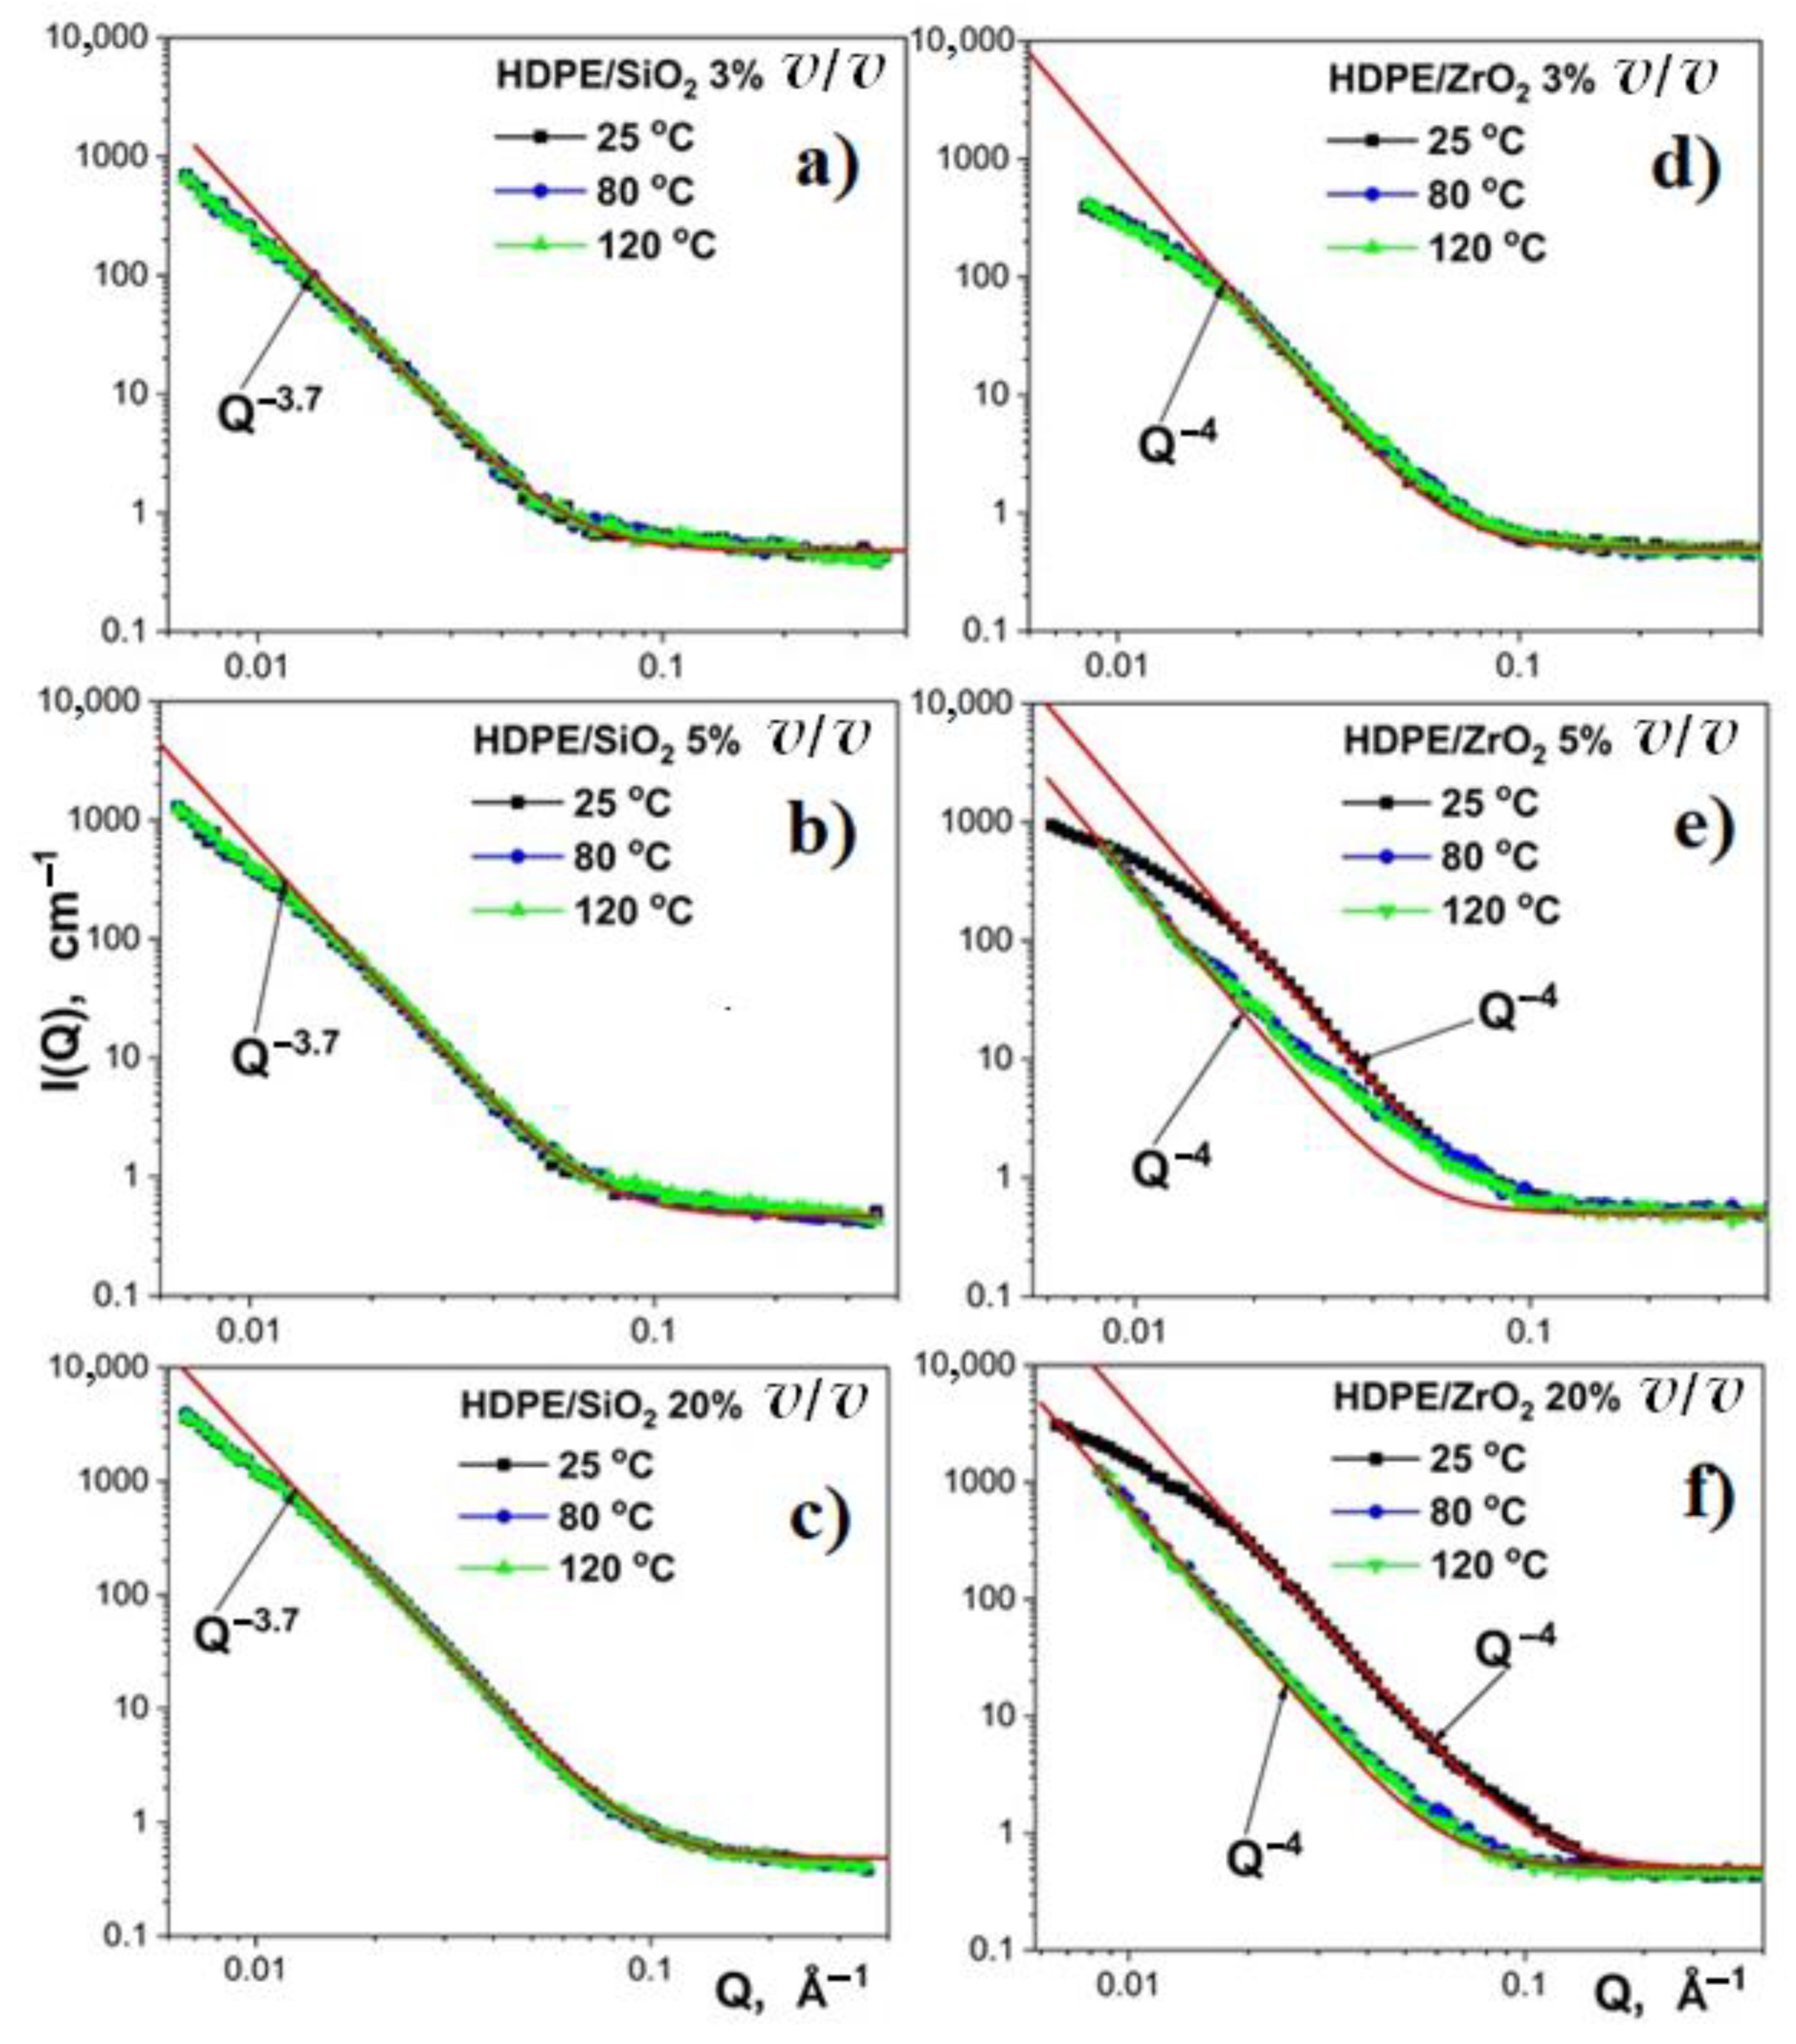
3.5. Thermal Stability of the Polymer Nanocomposite Structure
4. Conclusions
Author Contributions
Funding
Institutional Review Board Statement
Informed Consent Statement
Data Availability Statement
Conflicts of Interest
References
- Jancar, J.; Douglas, J.; Starr, F.; Kumar, S.; Cassagnau, P.; Lesser, A.; Sternstein, S.; Buehler, M. Current issues in research on structure–property relationships in polymer nanocomposites. Polymer 2010, 51, 3321–3343. [Google Scholar] [CrossRef]
- Hussain, F.; Hojjati, M.; Okamoto, M.; Gorga, R.E. Review article: Polymer-matrix Nanocomposites, Processing, Manufacturing, and Application: An Overview. J. Compos. Mater. 2006, 40, 1511–1575. [Google Scholar] [CrossRef]
- Hsissou, R.; Seghiri, R.; Benzekri, Z.; Hilali, M.; Rafik, M.; Elharfi, A. Polymer composite mate-rials: A comprehensive review. Compos. Struct. 2021, 262, 113640. [Google Scholar] [CrossRef]
- Bailey, E.J.; Winey, K.I. Dynamics of polymer segments, polymer chains, and nanoparticles in polymer nanocomposite melts: A review. Prog. Polym. Sci. 2020, 105, 101242. [Google Scholar] [CrossRef]
- Maghami, S.; Shahrooz, M.; Mehrabani-Zeinabad, A.; Zornoza, B.; Sadeghi, M. Characterization of the polymer/particle interphase in composite materials by molecular probing. Polymer 2020, 205, 122792. [Google Scholar] [CrossRef]
- Gao, X.; Xie, B.; Su, Y.; Fu, D.; Wang, D. Nanoparticle Enlarged Interfacial Effect on Phase Tran-sition of 1-Octadecanol/Silica Composites. J. Phys. Chem. B 2015, 119, 2074–2080. [Google Scholar] [CrossRef]
- Mallakpour, S.; Naghdi, M. Polymer/SiO2 nanocomposites: Production and applications. Prog. Mater. Sci. 2018, 97, 409–447. [Google Scholar] [CrossRef]
- Yao, G.; Duan, T.; An, M.; Xu, H.; Tian, F.; Wang, Z. The influence of epitaxial crystallization on the mechanical properties of a high density polyethylene/reduced graphene oxide nanocomposite injection bar. RSC Adv. 2017, 7, 21918–21925. [Google Scholar] [CrossRef] [Green Version]
- Behera, K.; Yadav, M.; Chiu, F.-C.; Rhee, K.Y. Graphene Nanoplatelet-Reinforced Poly (vinylidene fluoride)/High Density Polyethylene Blend-Based Nanocomposites with Enhanced Thermal and Electrical Properties. Nanomaterials 2019, 9, 361. [Google Scholar] [CrossRef] [PubMed] [Green Version]
- Jafarzadeh, Y.; Yegani, R.; Tantekin-Ersolmaz, S.B. Effect of TiO2 nanoparticles on structure and properties of high density polyethylene membranes prepared by thermally induced phase separation method. Polym. Adv. Technol. 2015, 26, 392–398. [Google Scholar] [CrossRef]
- Kanagaraj, S.; Varanda, F.R.; Zhil’tsova, T.V.; Oliveira, M.S.A.; Simoes, J.A.O. Mechanical properties of high density polyeth-ylene/carbon nanotube composites. Compos. Sci. Technol. 2007, 67, 3071–3077. [Google Scholar] [CrossRef]
- Beesetty, P.; Kale, A.; Patil, B.; Doddamani, M. Mechanical behavior of additively manufactured nanoclay/HDPE nanocomposites. Compos. Struct. 2020, 247, 112442. [Google Scholar] [CrossRef]
- Fu, S.; Sun, Z.; Huang, P.; Li, Y.; Hu, N. Some basic aspects of polymer nanocomposites: A critical review. Nano Mater. Sci. 2019, 1, 2–30. [Google Scholar] [CrossRef]
- Alghamdi, M.N. Effect of Filler Particle Size on the Recyclability of Fly Ash Filled HDPE Composites. Polymers 2021, 13, 2836. [Google Scholar] [CrossRef]
- Shahrajabian, H.; Sadeghian, F. The investigation of alumina nanoparticles’ effects on the mechanical and thermal properties of HDPE/rPET/MAPE blends. Int. Nano Lett. 2019, 9, 213–219. [Google Scholar] [CrossRef] [Green Version]
- Kaczmarek, H.; Królikowski, B.; Chylińska, M.; Klimiec, E.; Bajer, D. Piezoelectric Films Based on Polyethylene Modified by Aluminosilicate Filler. Polymers 2019, 11, 1345. [Google Scholar] [CrossRef] [PubMed] [Green Version]
- Bozeya, A.; Makableh, Y.; Abu-Zurayk, R.; Khalaf, A.; Al Bawab, A. Thermal and Structural Properties of High Density Polyethylene/Carbon Nanotube Nanocomposites: A Comparison Study. Chemosensors 2021, 9, 136. [Google Scholar] [CrossRef]
- Olesik, P.; Godzierz, M.; Kozioł, M.; Jała, J.; Szeluga, U.; Myalski, J. Structure and Mechanical Properties of High-Density Polyethylene Composites Reinforced with Glassy Carbon. Materials 2021, 14, 4024. [Google Scholar] [CrossRef] [PubMed]
- Rybak, A.; Malinowski, L.; Adamus-Wlodarczyk, A.; Ulanski, P. Thermally Conductive Shape Memory Polymer Composites Filled with Boron Nitride for Heat Management in Electrical Insulation. Polymers 2021, 13, 2191. [Google Scholar] [CrossRef] [PubMed]
- Perchacz, M.; Rozanski, A.; Kargarzadeh, H.; Galeski, A. Cavitation in high density polyethylene/Al2O3 nanocomposites. Compos. Sci. Technol. 2020, 199, 108323. [Google Scholar] [CrossRef]
- Wang, Y.; Wang, C.; Zhang, Z.; Xiao, K. Effect of Nanoparticles on the Morphology, Thermal, and Electrical Properties of Low-Density Polyethylene after Thermal Aging. Nanomaterials 2017, 7, 320. [Google Scholar] [CrossRef]
- Grigoriadou, I.; Paraskevopoulos, K.; Karavasili, M.; Karagiannis, G.; Vasileiou, A.; Bikiaris, D. HDPE/Cu-nanofiber nanocomposites with enhanced mechanical and UV stability properties. Compos. Part B Eng. 2013, 55, 407–420. [Google Scholar] [CrossRef]
- Chiu, F.-C.; Yen, H.-Z.; Lee, C.-E. Characterization of PP/HDPE blend-based nanocomposites using different maleated polyolefins as compatibilizers. Polym. Test. 2010, 29, 397–406. [Google Scholar] [CrossRef]
- Darshan, T.G.; Veluri, S.; Kartik, B.; Yen-Hsiang, C.; Fang-Chyouab, C. Poly (butylene succinate)/high density polyethylene blend-based nanocomposites with enhanced physical properties–Selectively localized carbon nanotube in pseudo-double percolated structure. Polym. Degrad. Stab. 2019, 163, 185–194. [Google Scholar] [CrossRef]
- Guillet, A.; Dargent, E.; Delbreilh, L.; Pareige, P.; Saiter, J.-M. Fabrication and characterization of multi-filament copper ma-trix–polyethylene fibres composite wire. Compos. Sci. Technol. 2009, 69, 1218–1224. [Google Scholar] [CrossRef]
- Lee, D.W.; Yoo, B.R. Advanced silica/polymer composites: Materials and applications. J. Ind. Eng. Chem. 2016, 38, 1–12. [Google Scholar] [CrossRef]
- Grabowski, C.A.; Fillery, S.P.; Westing, N.M.; Chi, C.; Meth, J.S.; Durstock, M.F.; Vaia, R.A. Dielectric Breakdown in Silica–Amorphous Polymer Nanocomposite Films: The Role of the Polymer Matrix. ACS Appl. Mater. Interfaces 2013, 5, 5486–5492. [Google Scholar] [CrossRef]
- Huang, J.; Zhang, G.; Dong, B.; Liu, J. Synthesis and Properties of Polyimide Silica Nanocomposite Film with High Transparent and Radiation Resistance. Nanomaterials 2021, 11, 562. [Google Scholar] [CrossRef]
- Nguyen, T.V.; Nguyen, T.A.; Nguyen, T.H. The Synergistic Effects of SiO2 Nanoparticles and Organic Photostabilizers for Enhanced Weathering Resistance of Acrylic Polyurethane Coating. J. Compos. Sci. 2020, 4, 23. [Google Scholar] [CrossRef] [Green Version]
- Zou, H.; Wu, S.; Shen, J. Polymer/Silica Nanocomposites: Preparation, Characterization, Properties, and Applications. Chem. Rev. 2008, 108, 3893–3957. [Google Scholar] [CrossRef]
- Nabiyev, A.; Linnik, D.S.; Gorshkova, Y.E.; Maharramov, A.M.; Balasoiu, M.; Olejniczak, A.; Ivankov, A.I.; Kovalev, Y.S.; Kuklin, A.I. Influence of Gamma Irradiation on The Morphological Properties of HDPE+%ZrO2 Polymer Nanocomposites. Rom. J. Phys. 2019, 64, 603. [Google Scholar]
- Reyes-Acosta, M.; Torres, A.; Dominguez-Crespo, M.A.; Flores-Vela, A.; Dorantes-Rosales, H.J.; Ramirez-Meneses, E. Influence of ZrO2 nanoparticles and thermal treatment on the properties of PMMA/ZrO2 hybrid coatings. J. Alloy. Compd. 2015, 643, S150–S158. [Google Scholar] [CrossRef]
- Wang, P.; Ma, Q.; Li, B.; Li, Y. Microstructure and Thermal-protective Property of CPED Coating with ZrO2 Nanoparticles Addition on Al-12Si Alloy. J. Wuhan Univ. Technol. Mater. Sci. Ed. 2019, 34, 1187–1192. [Google Scholar] [CrossRef]
- Genix, A.N.; Tatou, M.; Imaz, A.; Forcada, J.; Schweins, R.; Grillo, I.; Oberdisse, J. Modeling of intermediate structures and chain conformation in silica-latex nanocomposites observed by SANS during an-nealing. Macromolecules 2012, 45, 1663–1675. [Google Scholar] [CrossRef] [Green Version]
- Fouad, H.; Elleithy, R.; Alothman, O.Y. Thermo-mechanical, Wear and Fracture Behavior of High-density Polyeth-ylene/Hydroxyapatite Nano Composite for Biomedical Applications: Effect of Accelerated Ageing. J. Mater. Sci. Technol. 2013, 29, 573–581. [Google Scholar] [CrossRef]
- Kango, S.; Kalia, S.; Celli, A.; Njuguna, J.; Habibi, Y.; Kumar, R. Surface modification of inor-ganic nanoparticles for development of organic–inorganic nanocomposites–A review. Prog. Polym. Sci. 2013, 38, 1232–1261. [Google Scholar] [CrossRef]
- Nabiyev, A. Influence of nanoparticle weight fraction on morphology and thermal properties of HDPE/SiO2 composite films. Eurasian J. Phys. Funct. Mater. 2020, 4, 38–49. [Google Scholar] [CrossRef]
- Available online: www.ssnano.com (accessed on 10 August 2021).
- Yang, F.; Nelson, G.L. Polymer/silica nanocomposites prepared via extrusion. Polym. Adv. Technol. 2006, 17, 320–326. [Google Scholar] [CrossRef]
- Tanahashi, M.; Hirose, M.; Watanabe, Y.; Lee, J.C.; Takeda, K. Silica/perfluoropolymer nanocomposites fabricated by direct melt-com-pounding: A novel method without surface modification on nano-silica. J. Nanosci. Nanotechnol. 2007, 7, 2433–2442. [Google Scholar] [CrossRef]
- Craus, M.-L.; Islamov, A.K.; Anitas, E.M.; Cornei, N.; Luca, D. Microstructural, magnetic and transport properties of La0.5Pr0.2Pb0.3-xSrxMnO3 manganites. J. Alloys Compd. 2014, 592, 121–126. [Google Scholar] [CrossRef]
- Horodecka, S.; Strachota, A.; Mossety-Leszczak, B.; Šlouf, M.; Zhigunov, A.; Vyroubalová, M.; Kaňková, D.; Netopilík, M. Meltable copolymeric elastomers based on polydimethylsiloxane with multiplets of pendant liquid-crystalline groups as physical crosslinker: A self-healing structural material with a potential for smart applications. Eur. Polym. J. 2020, 137, 109962. [Google Scholar] [CrossRef]
- Skelnar, I.; Bal, Ü.; Zhigunov, A.; Kaprálková, L.; Fortelný, I.; Krejčíková, S.; Kredatusová, J. Complex effect of graphite nano-platelets on performance of HDPE/PA66 microfibrillar composites. Compos. Part B Eng. 2018, 144, 220–228. [Google Scholar] [CrossRef]
- Donato, K.Z.; Donato, R.K.; Zhigunov, A.; Mauler, R.S.; Schrekker, H.S. Tuning the interphase adhesion in high-density polyethylene-silica nanocomposites with ionic liquids. J. Appl. Polym. Sci. 2018, 136, 47366. [Google Scholar] [CrossRef]
- Ostanevich, Y.M. Time-of-flight small-angle scattering spectrometers on pulsed neutron sources. Makromol. Chemie. Macromol. Symp. 1988, 15, 91–103. [Google Scholar] [CrossRef]
- Kuklin, A.I.; Islamov, A.K.; Gordeliy, V.I. Scientific Reviews: Two-Detector System for Small-Angle Neutron Scattering Instrument. Neutron News 2005, 16, 16–18. [Google Scholar] [CrossRef]
- Kuklin, A.; Soloviov, D.; Rogachev, A.V.; Utrobin, P.K.; Kovalev, Y.S.; Balasoiu, M.; I Ivankov, O.; Sirotin, A.P.; Murugova, T.N.; Petukhova, T.B.; et al. New opportunities provided by modernized small-angle neutron scattering two-detector system instrument (YuMO). J. Phys. Conf. Ser. 2011, 291, 012013. [Google Scholar] [CrossRef]
- Soloviev, A.G.; Solovieva, T.M.; Stadnik, A.V.; Islamov, A.K.; Kuklin, A.I. The Package for Small Angle Neutron Scattering Data Treatment. Version 2.4. Long Write-Up and User’s Guide; Report Number: JINR-R--10-2003-86; Joint Institute for Nuclear Research (JINR): Dubna, Russia, 2003. [Google Scholar]
- Furushima, Y.; Nakada, M.; Murakami, M.; Yamane, T.; Toda, A.; Schick, C. Method for Calculation of the Lamellar Thickness Distribution of Not-Reorganized Linear Polyethylene Using Fast Scanning Calorimetry in Heating. Macromolecules 2015, 48, 8831–8837. [Google Scholar] [CrossRef]
- Höhne, G. Another approach to the Gibbs–Thomson equation and the melting point of polymers and oligomers. Polymer 2002, 43, 4689–4698. [Google Scholar] [CrossRef]
- Teixeira, J. Small-angle scattering by fractal systems. J. Appl. Crystallogr. 1988, 21, 781–785. [Google Scholar] [CrossRef] [Green Version]
- Teixeira, J. Introduction to Small Angle Neutron Scattering Applied to Colloidal Science. In Structure and Dynamics of Strongly Interacting Colloids and Supramolecular Aggregates in Solution; Chen, S.H., Huang, J.S., Tartaglia, P., Eds.; NATO ASI Series (Series C: Mathematical and Physical Sciences); Springer: Dordrecht, The Netherlands, 1992; Volume 369, pp. 635–658. [Google Scholar]
- Svergun, D. Determination of the regularization parameter in indirect-transform methods using perceptual criteria. J. Appl. Crystallogr. 1992, 25, 495–503. [Google Scholar] [CrossRef]
- Franke, D.; Petoukhov, M.V.; Konarev, P.V.; Panjkovich, A.; Tuukkanen, A.; Mertens, H.D.T.; Kikhney, A.G.; Hajizadeh, N.R.; Franklin, J.M.; Jeffries, C.M.; et al. ATSAS 2.8: A comprehensive data analysis suite for small-angle scattering from macro-molecular solutions. J. Appl. Crystallogr. 2017, 50, 1212–1225. [Google Scholar] [CrossRef] [Green Version]
- Yang, F.; Yang, W.; Zhu, L.; Chen, Y.; Ye, Z. Preparation and investigation of waterborne fluorinated polyacry-late/silica nanocomposite coatings. Prog. Org. Coat. 2016, 95, 1–7. [Google Scholar] [CrossRef]
- Zhuravlev, L.T. The surface chemistry of amorphous silica. Zhuravlev model. Colloids Surf. A Physicochem. Eng. Asp. 2000, 173, 1–38. [Google Scholar] [CrossRef] [Green Version]
- Guinier, A. X-Ray Diffraction in Crystals, Imperfect Crystals, and Amorphous Bodies; W. H. Freeman and Company: San Francisco, CA, USA, 1963; pp. 300–304. [Google Scholar]
- Zhang, R.; Tristram-Nagle, S.; Sun, W.; Headrick, R.; Irving, T.; Suter, R.; Nagle, J. Small-angle x-ray scattering from lipid bilayers is well described by modified Caillé theory but not by paracrystalline theory. Biophys. J. 1996, 70, 349–357. [Google Scholar] [CrossRef] [Green Version]
- Ryan, A.J.; Bras, W.; Mant, G.R.; Derbyshire, G.E. A direct method to determine the degree of crystallinity and lamellar thickness of polymers: Application to polyethylene. Polymer 1994, 35, 4537–4544. [Google Scholar] [CrossRef]
- Nabiyev, A.A.; Olejniczak, A.; Pawlukojc, A.; Balasoiu, M.; Bunoiu, M.; Maharramov, A.M.; Nuriyev, M.A.; Ismayilova, R.S.; Azhibekov, A.K.; Kabyshev, A.M.; et al. Nano-ZrO2 filled high-density polyethylene composites: Structure, thermal properties, and the influence γ-irradiation. Polym. Degrad. Stab. 2020, 171, 1–12. [Google Scholar] [CrossRef]
- Chung, S.C.; Hahm, W.G.; Im, S.S.; Oh, S.G. Poly (ethylene terephthalate) (PET) nanocomposites filled with fumed silicas by melt compounding. Macromol. Res. 2002, 10, 221–229. [Google Scholar] [CrossRef]
- Wu, C.L.; Zhang, M.Q.; Rong, M.Z.; Friedrich, K. Silica nanoparticles filled polypropylene: Effects of particle surface treatment, matrix ductility and particle species on mechanical performance of the composites. Compos. Sci. Technol. 2005, 65, 635–645. [Google Scholar] [CrossRef]
- Ebengou, R.H. Adsorption as a mechanism for nucleating activity: A thermodynamic explanation. J. Polym. Sci. Part B Polym. Phys. 1997, 35, 1333–1338. [Google Scholar] [CrossRef]
- Jiasheng, Q.; Pingsheng, H. Non-isothermal crystallization of HDPE/nano-SiO2 composite. J. Mater. Sci. 2003, 38, 2299–2304. [Google Scholar] [CrossRef]
- Oakey, J.; Marr, D.W.M.; Schwartz, K.B.; Wartenberg, M. An Integrated AFM and SANS Approach toward Understanding Void Formation in Conductive Composite Materials. Macromolecules 2000, 33, 5198–5203. [Google Scholar] [CrossRef]
- Nabiyev, A.A.; Islamov, A.K.; Maharramov, A.M.; Nuriyev, M.A.; Ismayilova, R.S.; Doroshkevic, A.S.; Pawlukojc, A.; Turchenko, V.A.; Olejniczak, A.; Rulev, M.I.; et al. Structural Studies of dielectric HDPE/ZrO2 polymer nano-composites: Filler concentration dependences. J. Phys. Conf. Ser. 2018, 994, 012011. [Google Scholar] [CrossRef] [Green Version]
- Hu, W.-G.; Schmidt-Rohr, K. Polymer ultradrawability: The crucial role of α-relaxation chain mobility in the crystallites. Acta Polym. 1999, 50, 271–285. [Google Scholar] [CrossRef]
- Hu, W.-G.; Boeffel, C.; Schmidt-Rohr, K. Chain Flips in Polyethylene Crystallites and Fibers Characterized by Dipolar13C NMR§. Macromolecules 1999, 32, 1611–1619. [Google Scholar] [CrossRef]
- Stamboliev, G.; Suljovrujic, E. A dielectric study of molecular relaxations in irradiated high density polyethylene. Polym. Degrad. Stab. 2010, 95, 593–599. [Google Scholar] [CrossRef]
- Suljovrujic, E. Dielectric study of post-irradiation effects in gamma-irradiated polyethylenes. Radiat. Phys. Chem. 2010, 79, 751–757. [Google Scholar] [CrossRef]
- Panaitescu, D.; Ciuprina, F.; Iorga, M.; Frone, A.; Radovici, C.; Ghiurea, M.; Sever, S.; Plesa, I. Effects of SiO2 and Al2O3 nanofillers on polyethylene properties. J. Appl. Polym. Sci. 2011, 122, 1921–1935. [Google Scholar] [CrossRef]


| Sample | Density (g/cm3) | SLD (Neutron) (cm−2) | X-ray (cm−2) |
|---|---|---|---|
| ZrO2 | 5.68 | 5.21 × 10¹⁰ | 43.1 × 10¹⁰ |
| SiO2 | 2.65 | 4.19 × 10¹⁰ | 22.6 × 10¹⁰ |
| Polyethylene (semi-crystalline) | 0.95 | −0.340 × 10¹⁰ | 9.21 × 10¹⁰ |
| Polyethylene (crystalline) | 1.01 | −0.361 × 10¹⁰ | 9.79 × 10¹⁰ |
| Polyethylene (amorphous) | 0.85 | −0.304 × 10¹⁰ | 8.24 × 10¹⁰ |
| H2O | 1.0 | −0.561 × 10¹⁰ | 9.44 × 10¹⁰ |
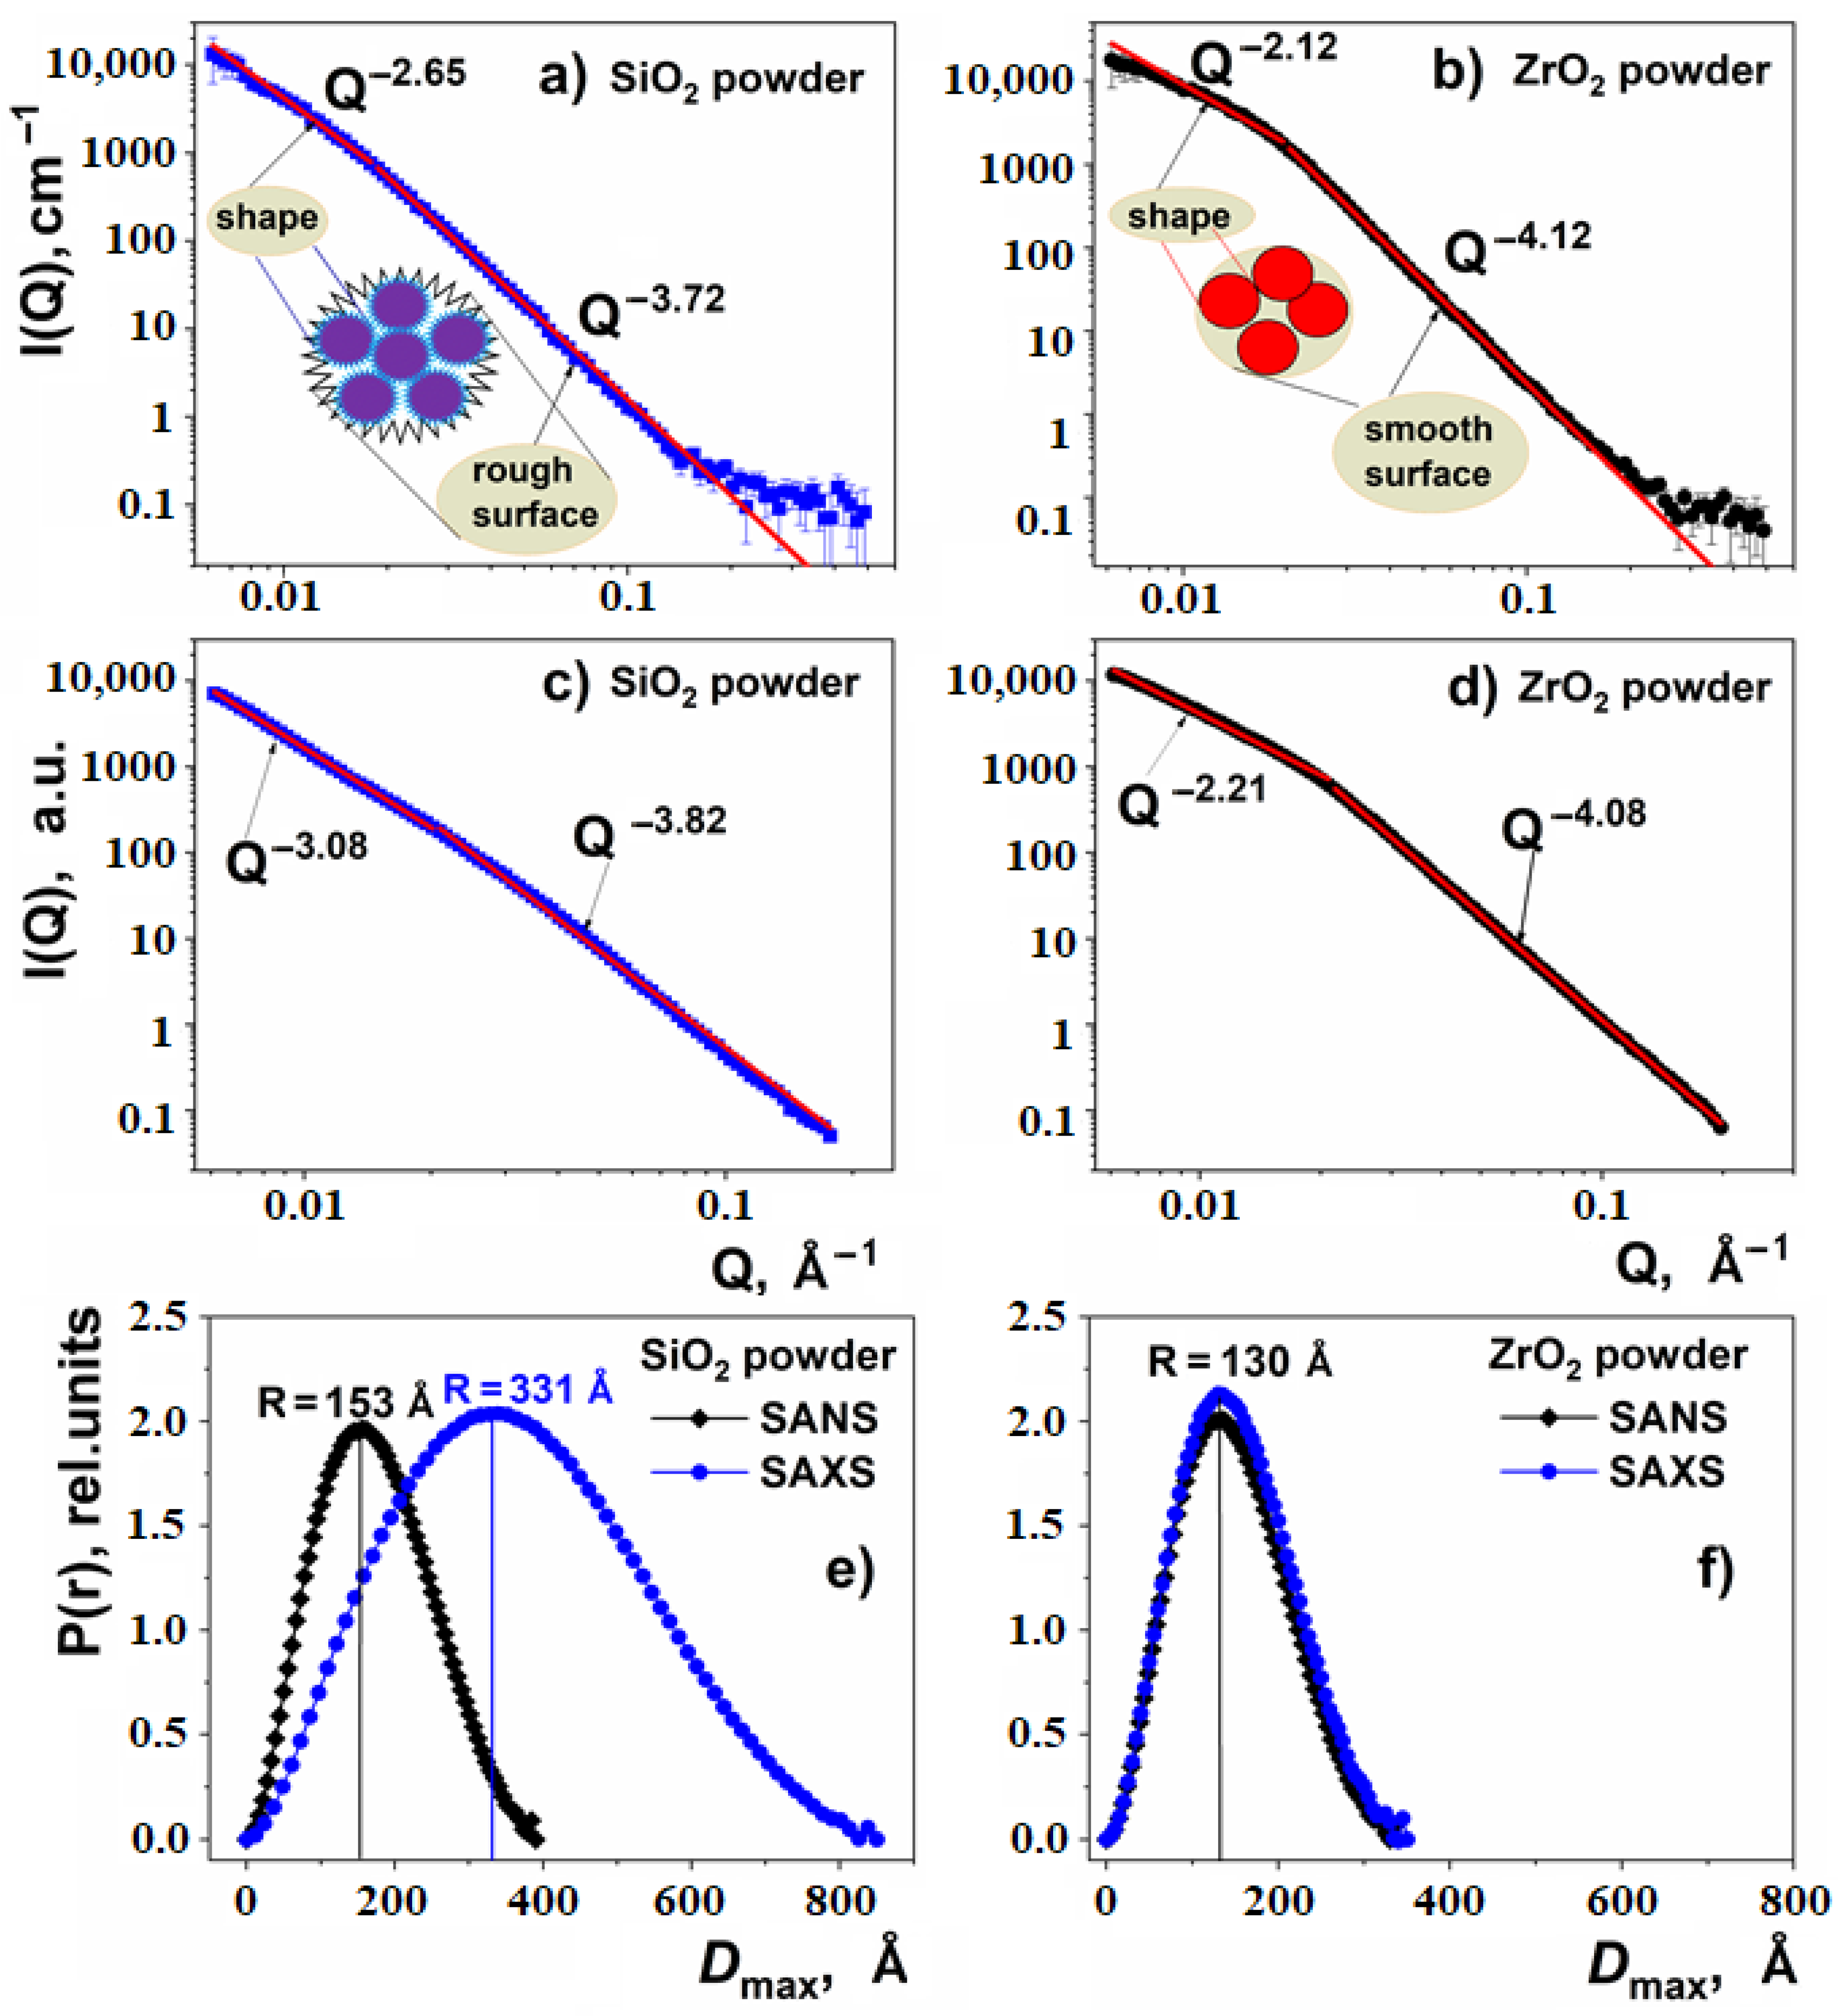
| Nanoparticle | SAXS | SANS | ||
|---|---|---|---|---|
| Q < 0.02 Å−1 | Q > 0.02Å−1 | Q < 0.02Å−1 | Q > 0.02Å−1 | |
| SiO2 | 3.08 | 3.82 | 2.65 | 3.72 |
| ZrO2 | 2.21 | 4.08 | 2.12 | 4.12 |
| ω, vol. % | ω mass.% | Tm * °C | Tm ** °C | Tc * °C | Tc ** °C | ΔHm * J·g−1 | ΔHm ** J·g−1 | lc * nm | lc ** nm | ΔHc * J·g−1 | ΔHc ** J·g−1 | ΔT * °C | ΔT ** °C |
|---|---|---|---|---|---|---|---|---|---|---|---|---|---|
| HDPE + %SiO2 | |||||||||||||
| 0 | 0.0 | 129.8 | 132.8 | 117.4 | 117.3 | −170.5 | −203.2 | 5.9 | 7.3 | 187.9 | 184.3 | 12.5 | 15.5 |
| 1 | 2.7 | 129.8 | 133.0 | 117.2 | 117.2 | −170.0 | −204.8 | 5.9 | 7.5 | 196.3 | 197.6 | 12.6 | 15.8 |
| 5 | 12.7 | 130.7 | 133.6 | 116.8 | 116.8 | −142.4 | −171.6 | 6.4 | 7.9 | 169.4 | 171.0 | 13.9 | 16.8 |
| 10 | 23.5 | 131.1 | 132.8 | 117.1 | 117.1 | −132.1 | −150.0 | 6.4 | 7.4 | 153.7 | 154.1 | 14.0 | 15.7 |
| 20 | 40.8 | 134.2 | 132.4 | 117.2 | 117.3 | −115.9 | −107.7 | 8.2 | 7.1 | 106.2 | 106.2 | 16.9 | 15.2 |
| HDPE + %ZrO2 | |||||||||||||
| 0 | 0.0 | 129.8 | 132.7 | 117.4 | 117.3 | −170.5 | −203.2 | 5.9 | 7.3 | 187.9 | 184.3 | 12.4 | 15.4 |
| 1 | 5.7 | 130.2 | 133.2 | 117.2 | 117.1 | −165.6 | −187.4 | 6.1 | 7.7 | 176.6 | 167.2 | 13.0 | 16.2 |
| 5 | 23.8 | 130.7 | 133.2 | 117.2 | 117.2 | −151.5 | −174.0 | 6.3 | 7.6 | 161.2 | 157.6 | 13.5 | 16.0 |
| 10 | 39.7 | 130.1 | 133.0 | 117.2 | 117.3 | −119.6 | −146.2 | 5.9 | 7.5 | 132.4 | 131.8 | 12.9 | 15.7 |
| 20 | 59.7 | 131.7 | 134.1 | 116.3 | 116.5 | −82.4 | −96.3 | 6.7 | 8.1 | 91.78 | 90.3 | 15.4 | 17.5 |
Publisher’s Note: MDPI stays neutral with regard to jurisdictional claims in published maps and institutional affiliations. |
© 2021 by the authors. Licensee MDPI, Basel, Switzerland. This article is an open access article distributed under the terms and conditions of the Creative Commons Attribution (CC BY) license (https://creativecommons.org/licenses/by/4.0/).
Share and Cite
Nabiyev, A.A.; Olejniczak, A.; Islamov, A.K.; Pawlukojc, A.; Ivankov, O.I.; Balasoiu, M.; Zhigunov, A.; Nuriyev, M.A.; Guliyev, F.M.; Soloviov, D.V.; et al. Composite Films of HDPE with SiO2 and ZrO2 Nanoparticles: The Structure and Interfacial Effects. Nanomaterials 2021, 11, 2673. https://doi.org/10.3390/nano11102673
Nabiyev AA, Olejniczak A, Islamov AK, Pawlukojc A, Ivankov OI, Balasoiu M, Zhigunov A, Nuriyev MA, Guliyev FM, Soloviov DV, et al. Composite Films of HDPE with SiO2 and ZrO2 Nanoparticles: The Structure and Interfacial Effects. Nanomaterials. 2021; 11(10):2673. https://doi.org/10.3390/nano11102673
Chicago/Turabian StyleNabiyev, Asif A., Andrzej Olejniczak, Akhmed Kh. Islamov, Andrzej Pawlukojc, Oleksandr I. Ivankov, Maria Balasoiu, Alexander Zhigunov, Musa A. Nuriyev, Fovzi M. Guliyev, Dmytro V. Soloviov, and et al. 2021. "Composite Films of HDPE with SiO2 and ZrO2 Nanoparticles: The Structure and Interfacial Effects" Nanomaterials 11, no. 10: 2673. https://doi.org/10.3390/nano11102673