
Determining Factors Affecting the Soil Water Content and Yield of Selected Crops in a Field Experiment with a Rainout Shelter and a Control Plot in the Czech Republic

 , , and
Abstract
:1. Introduction
2. Materials and Methods
2.1. Experimental Location
2.2. Experimental Design
2.3. Data Collection and Monitoring
2.4. Statistical Data Analysis
3. Results
3.1. Precipitation
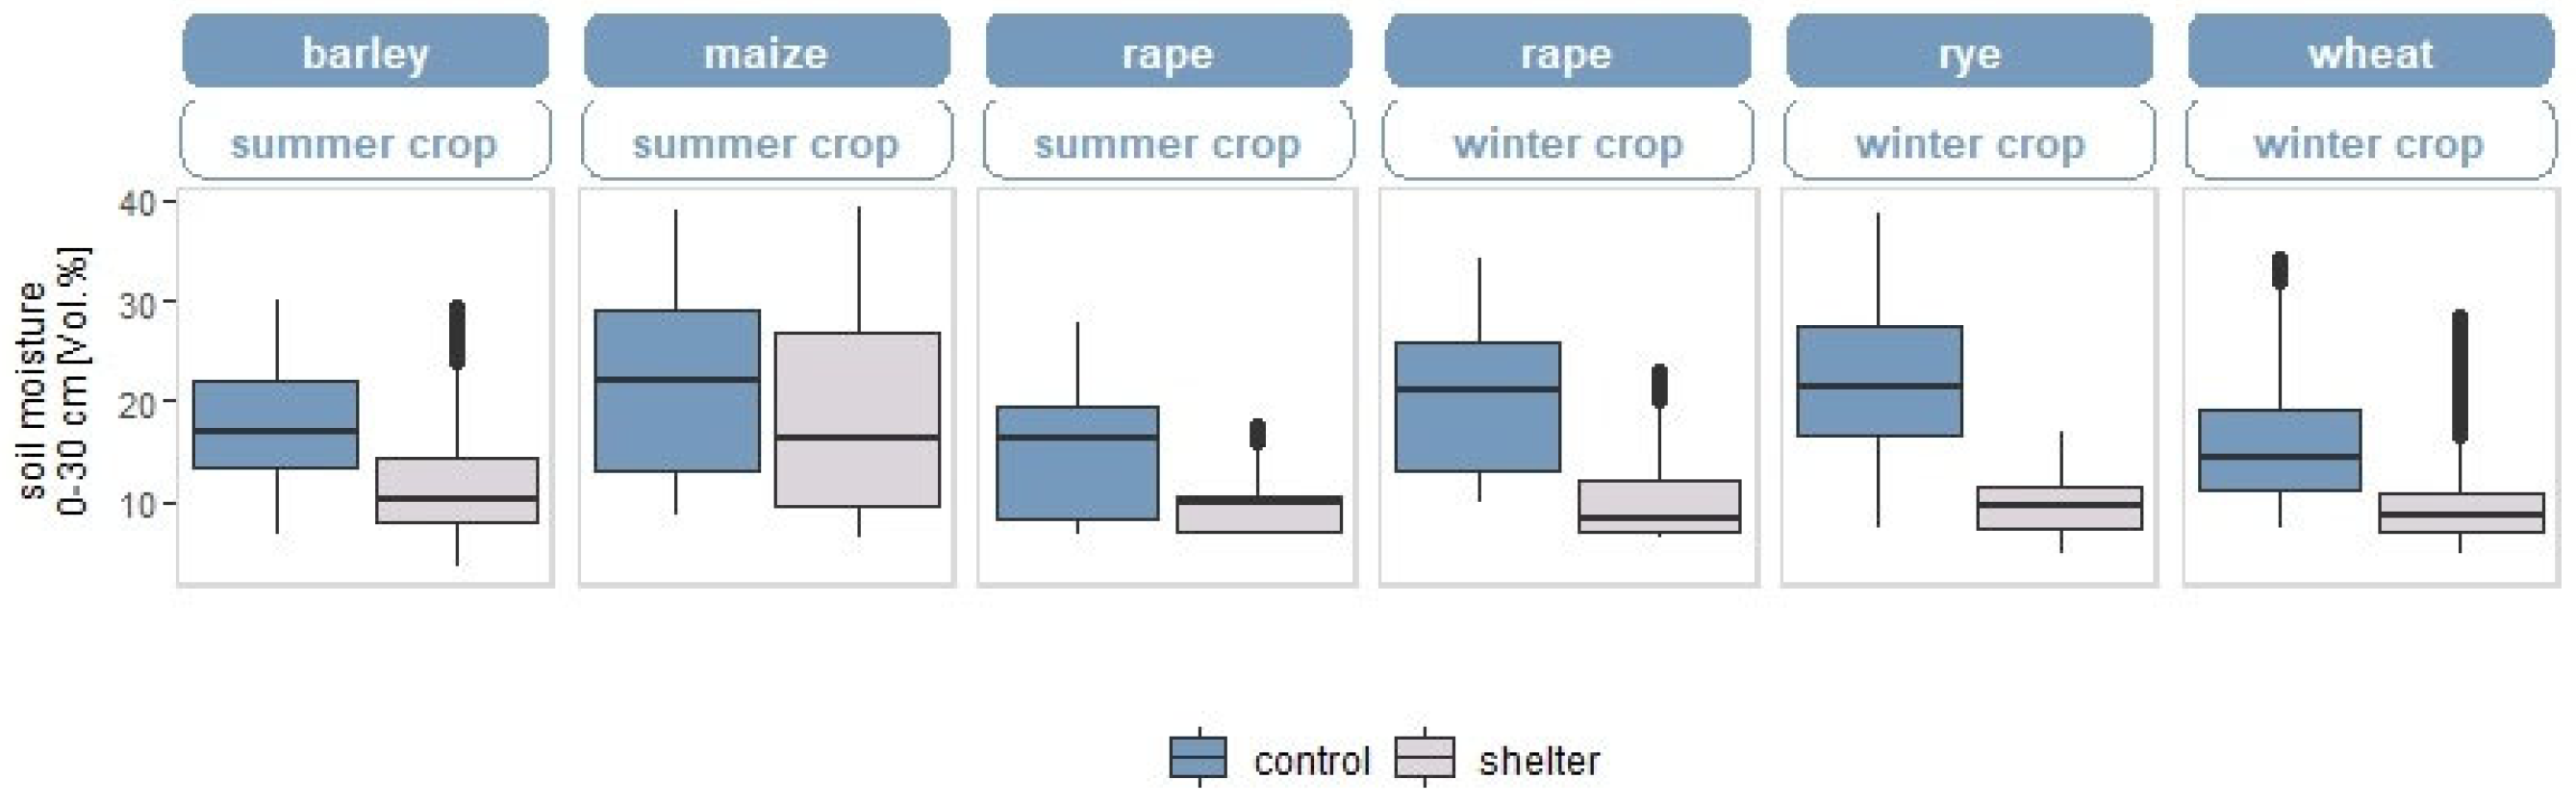
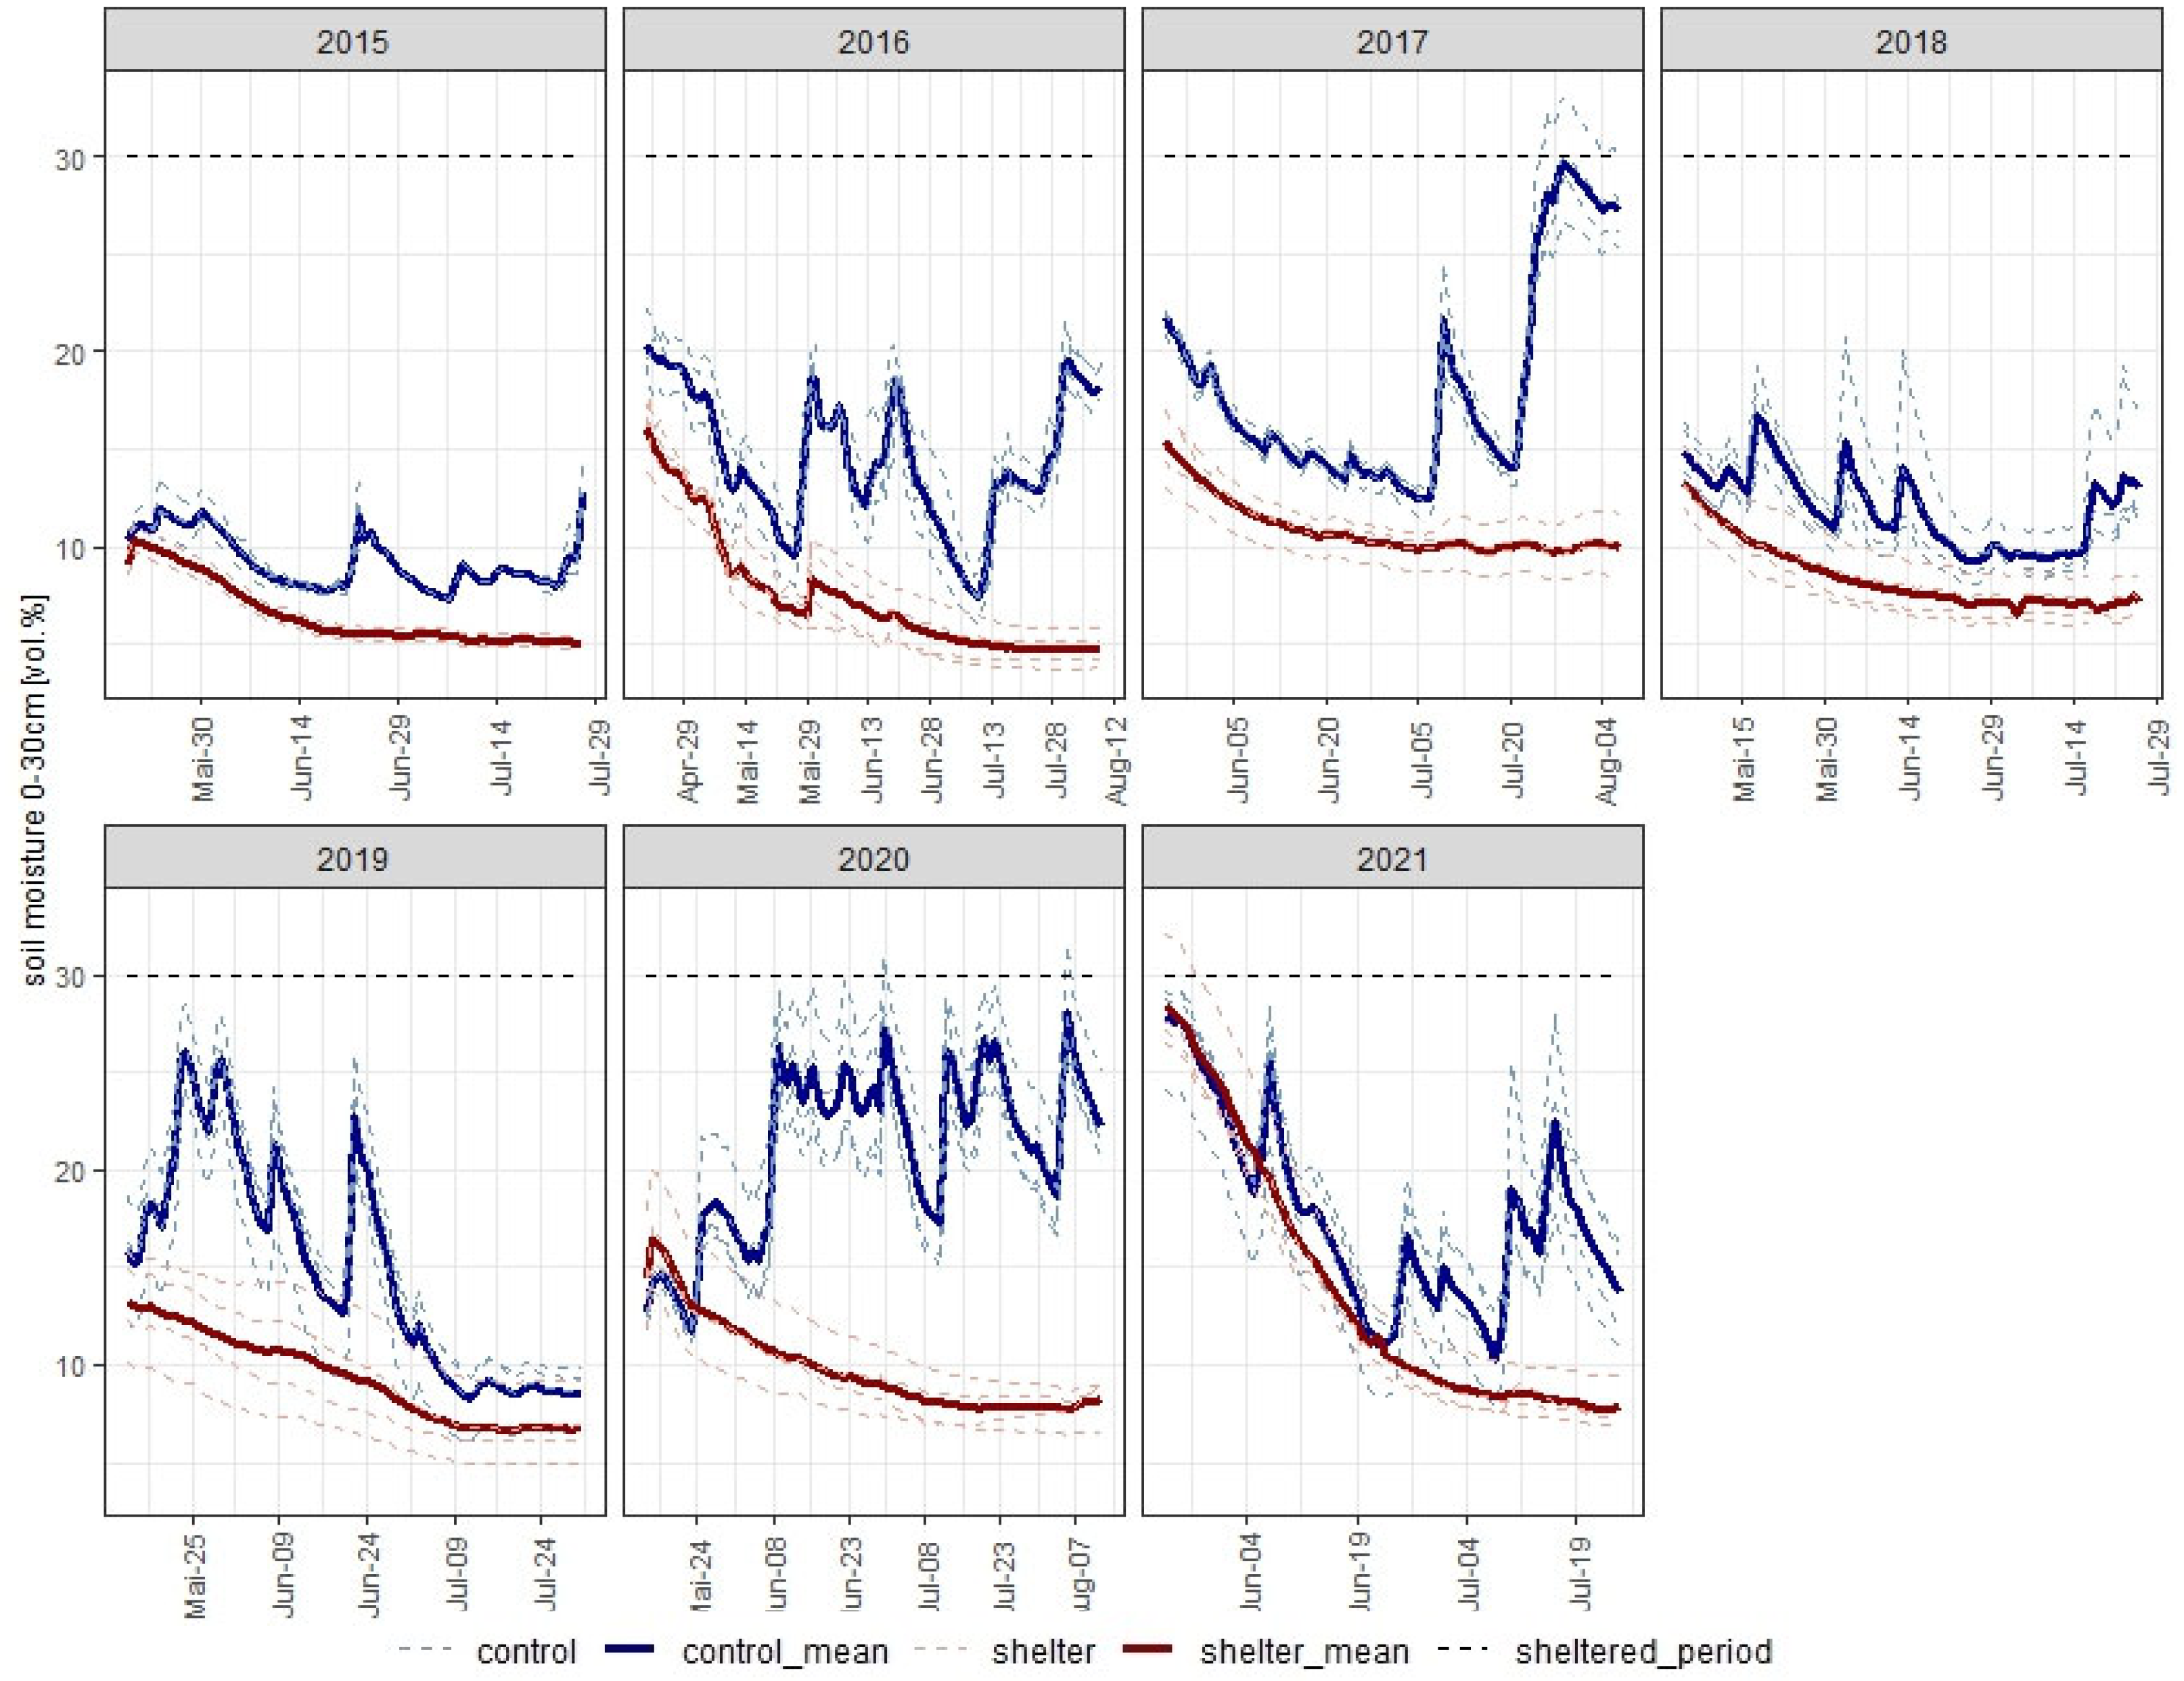
3.2. Soil Moisture
3.2.1. Soil Moisture: Spring Barley
3.2.2. Soil Moisture: Silage Maize
3.2.3. Soil Moisture: Oilseed Rape
3.2.4. Soil Moisture: Winter Rye
3.2.5. Soil Moisture: Winter Wheat
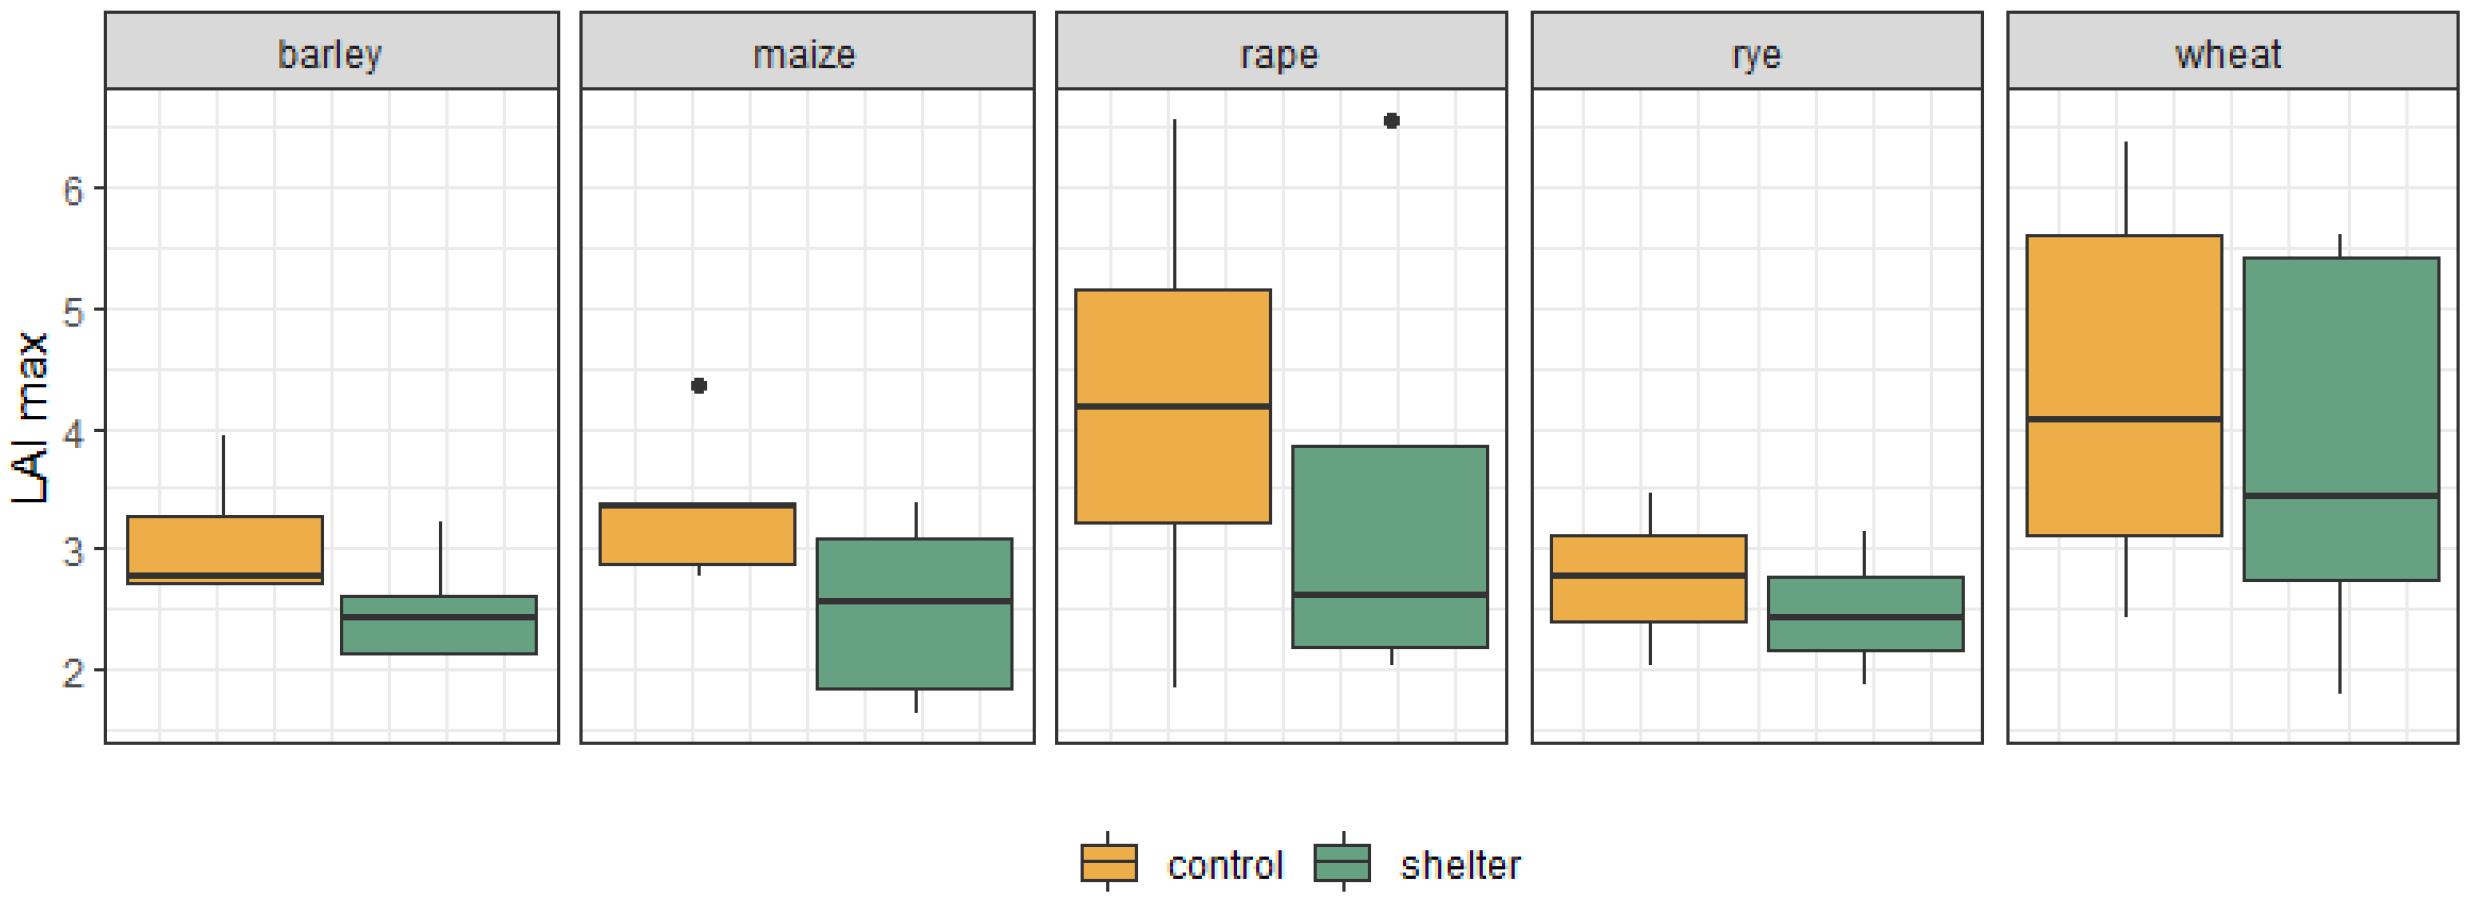
3.3. Leaf Area Index
3.4. Crop Yield
3.5. Comparison of the Different Measured Values
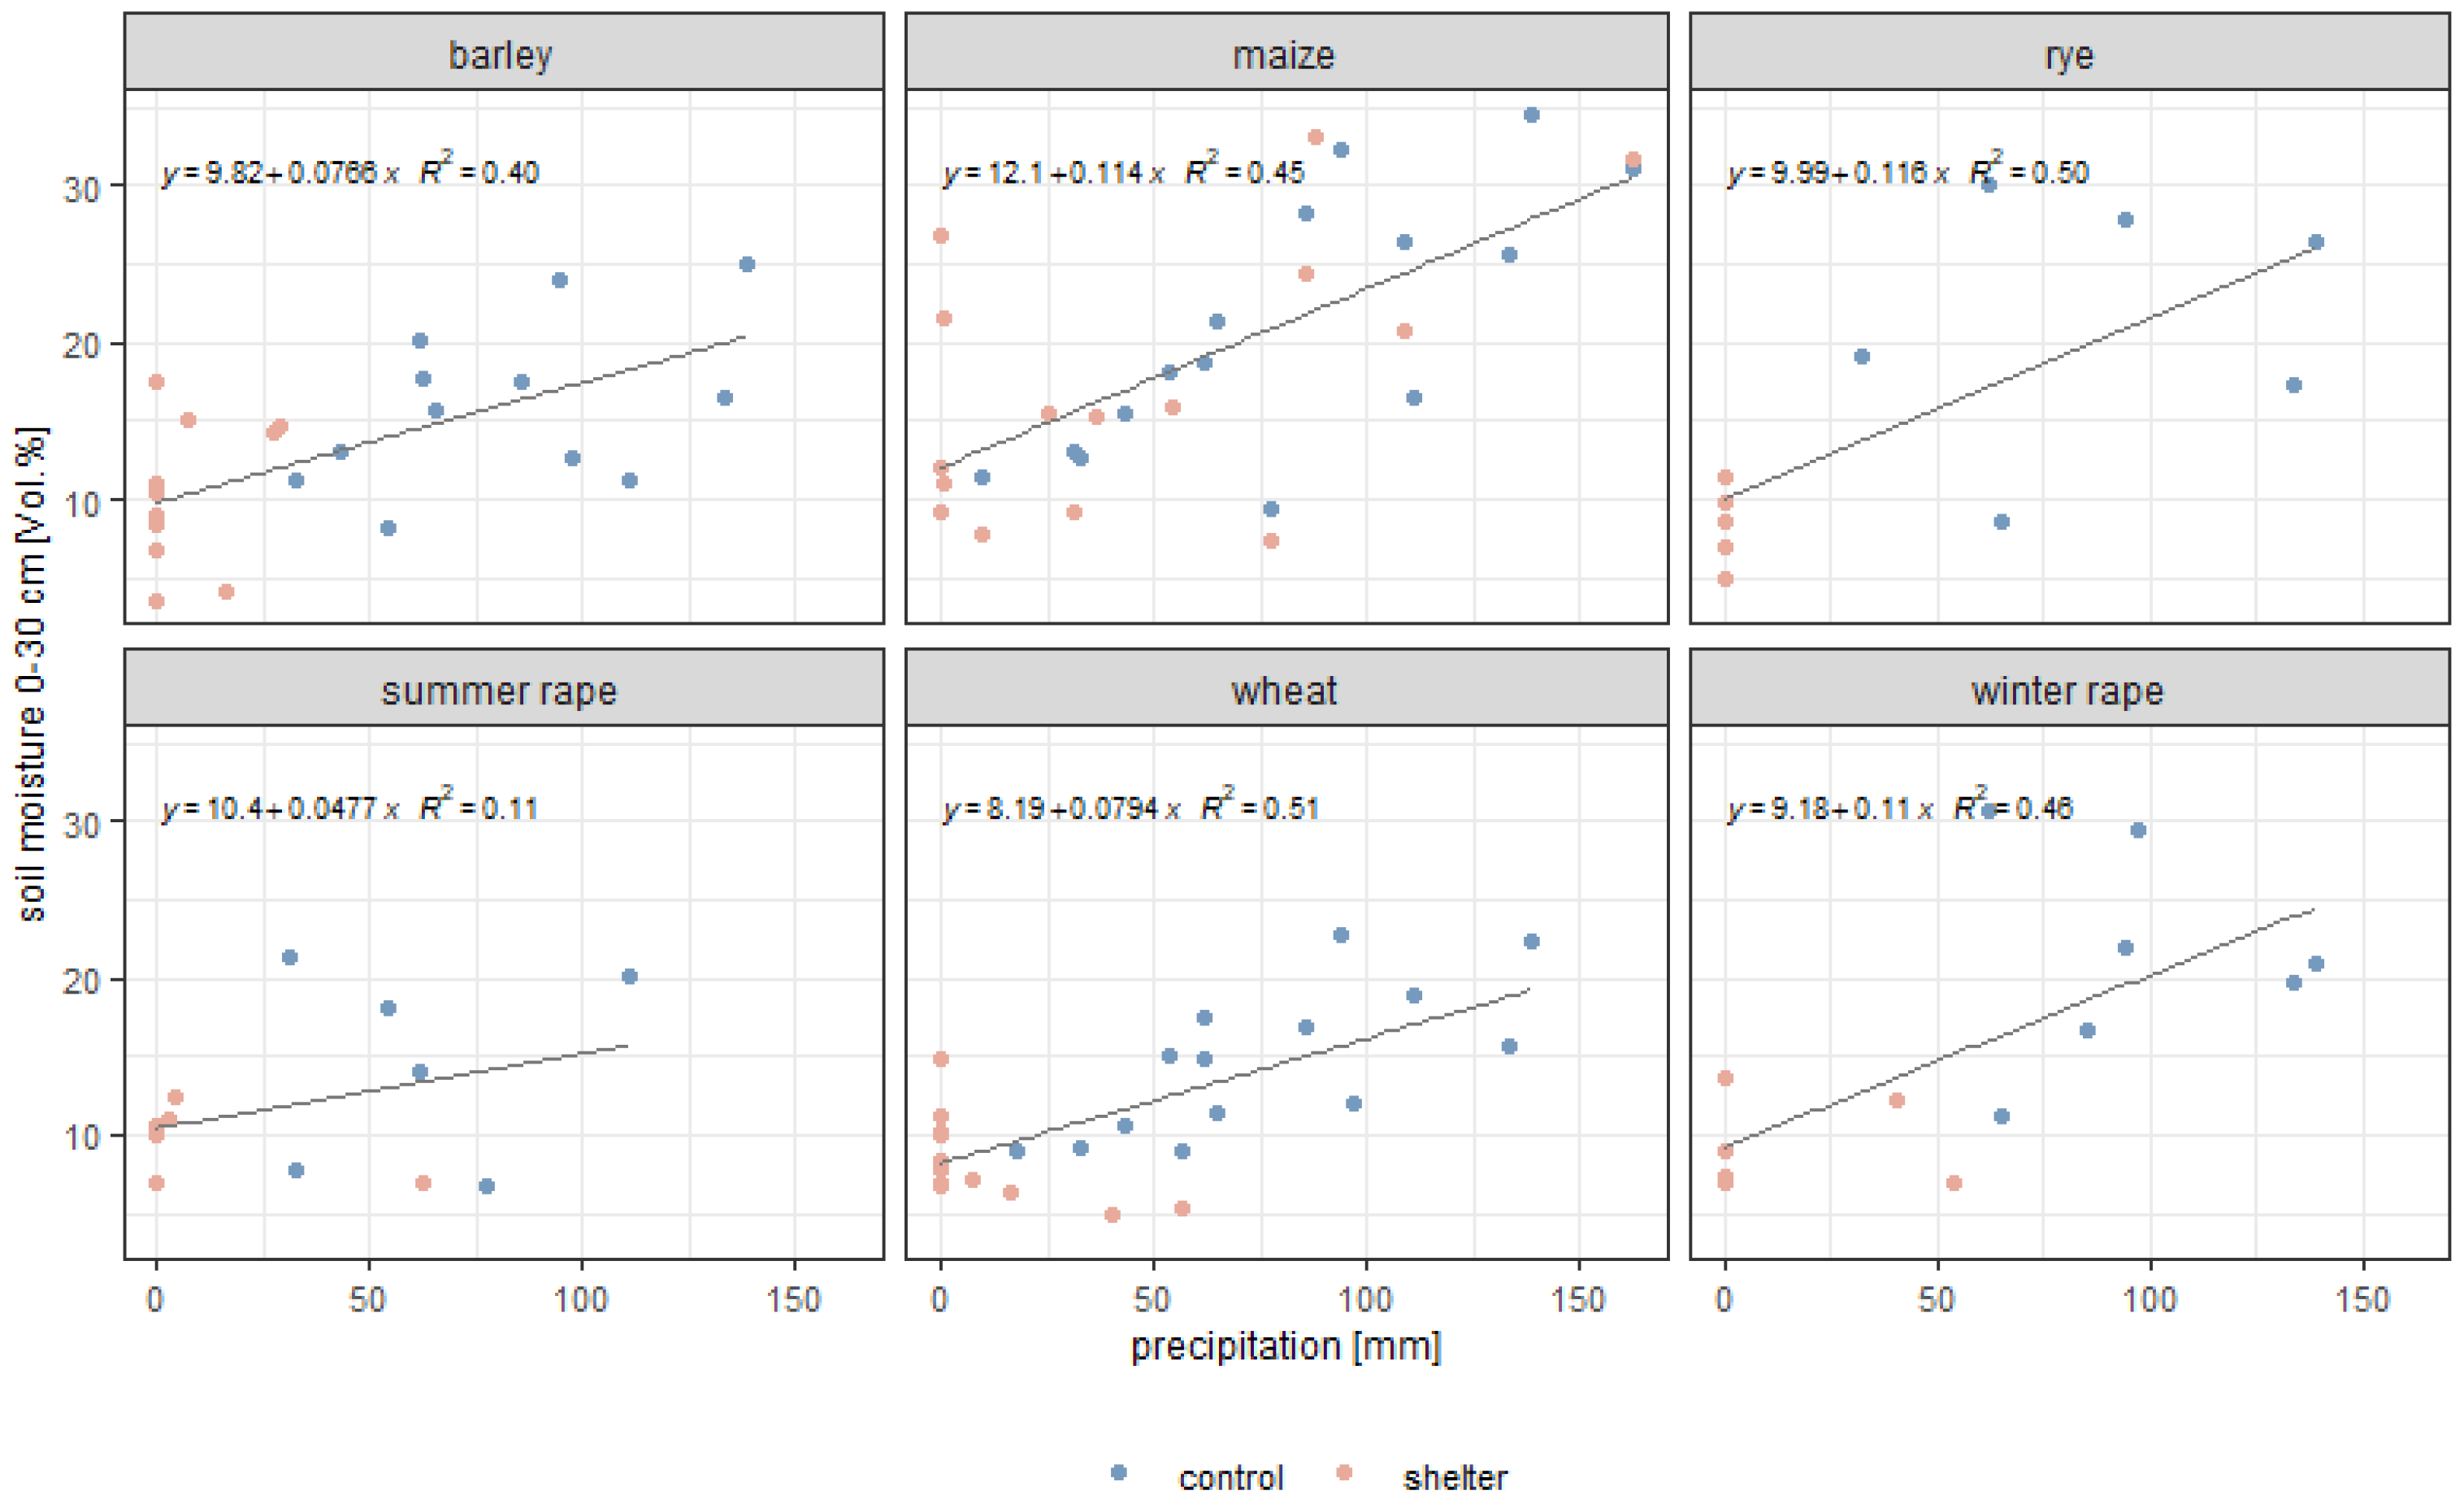
3.5.1. Precipitation and Soil Moisture
3.5.2. Leaf Area Index and Soil Moisture
3.5.3. Ratio between Control and Shelter of Leaf Area Index, Biomass and Yield
3.5.4. Parameters Affecting the Yield
4. Discussion
5. Conclusions
Author Contributions
Funding
Institutional Review Board Statement
Data Availability Statement
Acknowledgments
Conflicts of Interest
Appendix A

| Plot | Season | Crop | Cultivar | Precrop | Tillage | Pre-Sowing Soil Preparation | Sowing | Harvest | Fertilization Date | Fertilization Dose (t/ha) | Fertilization Date | Fertilization Dose (t/ha) | Fertilization Date | Fertilization Dose (t/ha) | Treatment with Herbicides, Pesticides and Insecticides |
|---|---|---|---|---|---|---|---|---|---|---|---|---|---|---|---|
| A | 2014/2015 | rape | Rohan | oat | 30/06/2014 pre-crop crushing, 01/07/2014 Plowing | 25/08/2014 Kompaktomat | 25/08/2014 | 31/07/2015 | 27/08/2014 | 30 kgN/ha NPK (15-15-15) | 04/03/2015 | 90 kgN/ha (50 kg DASA + 40 kg LAV) | 31/03/2015 | 70 kgN/ha (LAV) | 27/08/2014 Butisan star 2 l/ha, 09/09/2014 Nurelle D 0.6 l/ha, 30/09/2014 Nurelle D 0.6 ů/ha, Garlant Forte 1.5 l/ha, 20/04/2015 Biscaya 0.3 l/ha, 09/05/2015 Biscaya 0.3 l/ha, 11/05/2015 Pictor 0.5 l/ha |
| 2015/2016 | wheat | Bohemia | rape | 25/09/2015 | 26/07/2016 | 14/03/2016 | 31 kg N (DASA) | 29/03/2016 | 39 kgN (LAV) | 26/04/2016 | 60 kgN (LAV) | 04/11/2015 pesticide Cougar Forte 0.35 l/ha, 05/05/2016 fungicide Delaro 325 SC 1 l/ha | |||
| 2016/2017 | barley | Bojos | wheat | 03/04/2017 Kompaktomat | 11/04/2017 | 24/08/2017 | 11/04/2017 | 30 kg N (NPK) | 06/06/2017 | 30 kg N/ha (LAV 27) | 01/06/2017 herbicide Mustang Forte 0.8 l/ha, 02/06/2017 fungicide Delaro 0.75 l/ha, 22/06/2017 fungicide Prosaro 075 l/ha | ||||
| 2017/2018 | rye | Gonello | barley | 30/08/2017 Disc harrow, 18/09/2017 Plowing | 02/10/2017 Kompaktomat | 02/10/2017 | 26/07/2018 | 20/03/2018 | 50 kgN/ha (LAD 27) | 24/04/2018 | 30 kg N/ha (LAD 27) | 26/10/2017 herbicide Bizon 1l/ha, 04/05/2018 fungicide Delaro 1l/ha, 06/08/2018 straw mulching, 08/08/2018 Disc harrow, 15/08/2018 sowing of intercrops Phacelia tanacetifolia Stala | |||
| 2018/2019 | maize | DKC 3301 | rye | 08/08/2018 Dics harrow, 15/08/2018 sowing of intercrops Phacelia tanacetifolia Stala, 26/10/2018 Plowing, 09/11/2018 liming 500 kg/ha (Kalkgran) | 17/04/2019 Kompaktomat | 02/05/2019 | 01/10/2019 | 26/10/2018 | manure spreading (45t/ha) | 09/11/2018 | liming 500 kg/ha (Kalkgran) | 07/05/2019 herbicide Stomp Aqua 3.5 l/ha, 05/06/2019 Adengo 0.44 l/ha | |||
| 2019/2020 | legume | peas + oats (180 + 80 kg/ha) | maize | 20/11/2019 Plowing | 06/04/2020 Kompaktomat | 08/04/2020 | |||||||||
| 2020/2021 | rape | Keltor | legume | 08/13/2020 Plowing | 25/08/2020 Kompaktomat | 25/08/2020 | 09/08/2021 | 19/10/2020 | 100 kg/ha (LV) | 06/03/2021 | 240 kg/ha (DASA 26 13) | 30/03/2021 | 259 kg/ha (LAV27) | 03/09/2020 preemergent Rapsan plus, 09/09/2020 insecticide Proteus 0.75 l/ha, 14/09/2020 insecticide Rapid 0.8 l/ha, 21/09/2020 insecticide Karate 0.125 l/ha, 02/10/2020 herbicide Gallant super 0.5 l/ha, 01/04/2021 insecticide Karate 0.125 l/ha, 02/06/2021 insecticide Rapid 0.08 l/ha, herbicide Pictor 0.5 l/ha | |
| B | 2014/2015 | wheat | Bohemia | oat | 30/06/2014 pre-crop crushing, 27/08/2014 Plowing | 30/09/2014 | 06/08/2015 | 09/03/2015 | 35 kg N (DASA) | 19/03/2015 | 25 kgN (LAV) | 30.4.2015 | 60 kgN (LAV) | 14/04/2015 Lontrel 300 0.3 l/ha, Dicopur D 1 l/ha, Starane 250 EC 0.5 l/ha, 22/05/2015 Delaro 325 SC 1 l/ha | |
| 2015/2016 | barley | Bojos | wheat | 30/03/2016 Kompaktomat | 05/04/2016 | 15/08/2016 | 30/03/2016 | 30 kgN/ha (NPK 15-15-15) | 26/04/2016 | 30 kgN/ha (LAV) | 18/05/2016 herbicide Mustang Forte 0.88 l/ha, 01/06/2016 insecticide Nurelle D 0.6 l/ha, 06/06/2021 fungicide Delaro 0.75 l/ha, 11/06/2016 herbicide Lontrel 0.3 l/ha, Starane 0.5 l/ha, Dicopur 1 l/ha, 21/06/2016 fungicide Prosaro 0.75 l/ha | ||||
| 2016/2017 | wheat | Bohemia | barley | 23/09/2016 soil dragging, Plowing | 29/09/2016 Kompaktomat | 30/09/2016 | 17/08/2017 | 08/03/2017 | 31 kg N/ha (LAD 27) | 17/03/2017 | LAD 30 kg N/ha | 11/05/2017 | LAV 27 (30 kg N/ha) | 31/10/2016 herbicide Bizon 1 l/ha, 05/06/2017 fungicide Prosaro 250 EC 0.75 l/ha | |
| 2017/2018 | maize | Dekalb DKC 3301 | wheat | 30/08/2017 Disc harrow, 11/09/2017 rotator for loosening the soil and sowing of intercrops Phacelia tanacetifolia Stala, 10/11/2017 Plowing | 08/04/2018 soil dragging, 03/05/2018 Kompaktomat | 03/05/2018 | 05/09/2018 | 09/11/2017 | manure spreading (45t/ha) | 02/05/2018 | 120 kg N, P2O5, K2O/ ha (NPK 15-15-15) | 10/05/2018 herbicide Adengo 0,44l/ha, 09/11/2018 liming 500 kg/ha (Kalkgran) | |||
| 2018/2019 | legume | peas + oats (180 + 80 kg/ha) | maize | 26/10/2018 Plowing, 09/11/2018 liming 500 kg/ha (Kalkgran) | 17/04/2019 Kompaktomat | 17/04/2019 | 07/30/2019 mulching | ||||||||
| 2019/2020 | rape | Rohan | legume | 10/08/2019 Plowing, 13/08/2019 soil dragging | 20/08/2019 Kompaktomat, 22/08/2019 Kompaktomat | 23/08/2019 | 30/07/2020 | 20/08/2019 | 100 kg/ha (NPK8-24-24) | 05/03/2020 | 40 kg/ha (LAV27) + 50 kg/ha (DASA26N13) | 25/03/2020 | 70 kg/ha (LAV27) | 26/08/2019 insecticide Nurelle D 0.6 l/ha, 13/09/2019 insecticide Rapid 80 ml/ha, herbicide Belkar 0.25 l/ha, 18/09/2019 insecticide Rapid 0.8 ml/ha, 10/04/2020 insecticide Biscaya 0.3 l/ha, 24/04/2020 insecticide Nurelle D 0.6 l/ha, 13/05/2020 insecticide Pictor 0.5 l/ha and insecticide Karate 0.125l/ha | |
| 2020/2021 | wheat | Tobak | rape | 15/09/2020 Plowing | 23/09/2020 Kompaktomat | 06/10/2020 | 13/08/2021 | 06/03/2021 | 185 kg/ha (LAV27) | 30/03/2021 | 111 kh/ha (LAV27) | 17/05/2021 | 154 kh/ha (DAS 26N 1S) | 03/11/2020 herbicide Bizon 1 l/ha, 01/06/2021 fungicide Delaro 1 l/ha | |
| C | 2014/2015 | barley | Bojos | oat | 30/06/2014 pre-crop crushing | 26/03/2015 | 06/08/2015 | 23/03/2015 | 30 kgN/ha NPK | 30/04/2015 | 30 kgN/ha LAV | 18/05/2015 Lontrel 300 0.3 l/ha, 01/06/2015 Delaro 0.75 l/ha, 09/06/2015 Nurelle D 0.6 l/ha, 18/06/2015 Prosaro 0.75 l/ha | |||
| 2015/2016 | wheat | Bohemia | barley | 25/09/2015 | 13/08/2016 | 14/03/2016 | 31 kg N (DASA) | 29/03/2016 | 39 kgN (LAV) | 26/04/2016 | 60 kgN (LAV) | 04/11/2015 pesticide Cougar Forte 0.35 l/ha, 05/05/2016 fungicide Delaro 325 SC 1 l/ha | |||
| 2016/2017 | maize | DKC 3301 | wheat | 10/05/2017 | 09/10/2017 | ||||||||||
| 2017/2018 | legume | pea variety "Eso" 200 kg/ha, oat variety "Poseidon" 70kg/ha | maize | 10/11/2017 Plowing | 08/04/2018 soil dragging, 14/05/2018 Kompaktomat | 15/05/2018 | 07/17/2018 mulching and Disc harrow | 14/08/2018 Plowing, Kompaktomat, 18/09/2018 Kompaktomat, repeated sowing of winter rape Rohan, 21/09/2018 herbicide Command 36 CS 0.25l/ha, 19/10/2018 fertilization 100 kg/ha LV15, 23/10/2018 insecticide Fury 0.1l/ha, 11/09/2018 liming 500 kg/ha (Kalkgran), winter rape did not grow | |||||||
| 2018/2019 | rape | Sázava | legume | 09/04/2019 Plowing | 11/04/2019 Kompaktomat | 11/04/2019 | 07/08/2019 | 06/06/2019 | 40 kg/ha (LAD 27) | 27/04/2019 herbicide Galera 0.35 l/ha, 07/05/2019 insekticide Nurelle D 0.6 l/ha, 24/05/2019 insecticide Nurelle D 0.6 l/ha, 11/06/2019 insekticide Biscaya 240 OD 0.3 l/ha, nutrition Borosan forte 3l/ha, 14/06/2019 insekticide Proteus 110 OD 0.5 l/ha, 25/06/2019 insekticide Calypso 480 SC 0.1 l/ha, fungicide Pictor 0.5 l/ha | |||||
| 2019/2020 | wheat | Tobak | rape | 13/09/2019 Plowing, Soil dragging | 04/10/2019 Kompaktomat | 04/10/2019 | 13/08/2020 | 05/03/2020 | 50 kg N/ha (LAV27) | 25/03/2020 | 30 kg N/ha (LAV27) | 15/04/2020 herbicide Mustang forte 1 l/ha, 19/05/2020 fungicide Delaro 1 l/ha | |||
| 2020/2021 | barley | Bojos | wheat | 09/04/2020 sowing of intercrops Phacelia tanacetifolia Stala, 13/11/2020 Plowing | 12/04/2021 Kompaktomat | 12/04/2021 | 18/08/2021 | 12/04/2021 | 200 kg/ha (NPK 15-15-15) | 02/06/2021 | 111 kg/ha (LAV27) | 20/05/2021 herbicide Biplay 1 l/ha, insecticide Fury 0.075 l/ha, 14/06/2021 fungicide Delaro 0.75 l/ha, insecticide Fury 0.075 l/ha | |||
| D | 2014/2015 | wheat | Bohemia | oat | 30/06/2014 pre-crop crushing, 27/08/2014 Plowing | 30/09/2014 | 06/08/2015 | 09/03/2015 | 35 kg N (DASA) | 19/03/2015 | 25 kgN (LAV) | 30.4.2015 | 60 kgN (LAV) | 14/04/2015 Lontrel 300 0.3 l/ha, Dicopur D 1 l/ha, Starane 250 EC 0.5 l/ha, 22/05/2015 Delaro 325 SC 1 l/ha | |
| 2015/2016 | maize | DKC 3301 | wheat | 09/05/2016 Kompaktomat | 11/05/2016 | 29/09/2016 | 27/10/2015 | 40 t manure | 09/05/2016 | 120 kgN/ha (NPK 15-15-15) | 26/08/2015 herbicide Adengo 0.44 l/ha | ||||
| 2016/2017 | legume | maize | |||||||||||||
| 2017/2018 | rape | Rohan | legume | 04/03/2017 soil dragging, 15/05/2017 Kompaktomat and sowing legume, 20/07/2017 mulching and plowing legume | 22/08/2017 Kompaktomat | 22/08/2017 | 17/07/2018 | 22/08/2017 | 10 kg N, 30 kg P2O5, 30 kg K2O/ha (NPK 8-24-24) | 19/03/2018 | 50 kg N/ha (DASA 26), 40 kg N/ha (LAD 27) | 05/04/2018 | 70 kg N/ha (LAD 27) | 25/08/2017 herbicide Rapus Ultra 3l/ha, 23/04/2018 insecticide Calypso 480 SC 0.2l/ha | |
| 2018/2019 | wheat | Tobak | rape | 08/08/2018 Disc harrow, 11/09/2018 Plowing | 01/10/2018 Kompaktomat | 01/10/2018 | 02/08/2019 | 19/03/2019 | 40 kg/ha (saltpeter LAD 27) | 02/04/2019 | 60 kg/ha (ledek LAD 27) | 16/10/2018 insecticide Proteus 110 OD 0.5l/ha, 31/10/2018 herbicide Bizon 1l/ha, 09/11/2018 liming 500 kg/ha (Kalkgran), 27/05/2019 fungicide Delaro 1 l/ha, 11/06/2019 fungicide Prosaro 250 EC 0.75 l/ha | |||
| 2019/2020 | barley | Bojos | wheat | 09/08/2019 sowing of intercrops Phacelia tanacetifolia Stala, 20/11/2019 Plowing | 06/04/2020 Kompaktomat | 08/04/2020 | 20/08/2020 | 06/04/2020 | 30 kg N/ha (NPK-15-15) | 25/05/2020 | 30 kg N/ha (LAV27) | 18/05/2020 herbicide Mustang forte 0.8 l/ha, 02/06/2020 fungicide Delaro 0.75 l/ha | |||
| 2020/2021 | rye | Gonello | barley | 15/09/2020 Plowing | 23/09/2020 Kompaktomat | 24/09/2020 | 13/08/2021 | 06/03/2021 | 111 kg/ha (LAV27) | 29/04/2021 | 185 kg/ha (LAV27) | 20/10/2020 herbicide Bizon 1l/ha, 01/06/2021 fungicide Prosaro 0.75 l/ha | |||
| E | 2014/2015 | maize | DKC 3301 | oat | 30/06/2014 pre-crop crushing | 05/05/2015 | 30/09/2015 | 24/10/2014 | 40 t manure/ha (cca 100 kg N/ha) | 03/05/2015 | 140 kgN/ha (SA), 80 kgP/ha (SF), 120 kgK/ha (DS) | 07/05/2015 herbicide Akris 2 l/ha, 10/06/2015 herbicide MaisTer 0.15 kg/ha, July 2015 manual weeding | |||
| 2015/2016 | legume | maize | |||||||||||||
| 2016/2017 | rape | Sázava | legume | 10/04/2017 Kompaktomat | 11/04/2017 | 24/08/2017 | 11/04/2017 | 100 kg N/ha (NPK 15-15-15) | 26/04/2017 herbicide Butisan 400 SC 2 l/ha, Command 0.25 l/ha, 05/05/2017 insecticide Calypdo, 12/05/2017 iinsecticide Nurelle D, 15/06/2017 Karete Zeon, 21/06/2017 Calypso 480 0.2 l/ha, 21/06/2017 Pictor 0.5 l/ha | ||||||
| 2017/2018 | wheat | Tobak | rape | 30/08/2017 Disc harrow, 18/09/2017 Plowing | 07/10/2017 Kompaktomat | 07/10/2017 | 26/07/2018 | 19/03/2018 | 31 kg N/ha (DASA 26) | 05/04/2018 | 39 kg N/ha (LAD 27) | 24/04/2018 | 60 kg N/ha (LAD 27) | 26/10/2017 herbicide Bizon 1l/ha, 04/05/2018 fungicide Delaro 1l/ha, 29/05/2018 insecticide Nurelle D 0.6 l/ha, fungicide Prosaro 250 EC 0.75 l/ha | |
| 2018/2019 | barley | Bojos | wheat | 06/08/2018 mulching, 08/08/2018 Disc harrow, 11/09/2018 Plowing, 09/11/2018 liming 500 kg/ha (Kalkgran) | 04/04/2019 Kompaktomat | 05/04/2019 | 12/08/2019 | 04/04/2019 | 30 kg/ha (NPK-15-15-15) | 26/05/2019 | 111 kg/ha (LAV 27) | 24/05/2019 fungicide Delaro 0.75 l/ha, 18/06/2019 fungicide Prosaro 250 EC 0.75 l/ha, insecticide Proteu 0.5 l/ha | |||
| 2019/2020 | rye | Gonello | barley | 13/09/2019 Plowing | 18/09/2019 Kompaktomat | 18/09/2019 | 21/08/2020 | 05/03/2020 | 30 kh n/ha (LAV27) | 16/04/2020 | 50 kg N/ha (LAV27) | 24/10/2019 herbicide Bizon 1 l/ha, 19/05/2020 fungicide Prosaro 0.75 l/ha | |||
| 2020/2021 | maize | DKC 3142 H | rye | 04/09/2020 sowing of intercrops Phacelia tanacetifolia Stala, 13/11/2020 Plowing | 29/04/2021 Kompaktomat | 30/04/2021 | 11/11/2020 | manure spreading (45 t/ha) | 29/04/2021 | 700 kg/ha (ammonium sulfate) | 03/05/2021 preemergent Adengo 0.44 l/ha | ||||
| F | 2014/2015 | legume | oat | 30/06/2014 pre-crop crushing | |||||||||||
| 2015/2016 | rape | Rohan | legume | 26/08/2015 | 26/07/2016 | 27/08/2015 | 20 kgN/ha | 07/03/2016 | 50 kgN+25 kgS (DASA), 40 kgN (LAV) | 29/03/2016 | 40 kgN (LAV) | 26/08/2015 herbicide Butisan Star 2 l/ha, 11/09/2015 insecticide Nurelle D 0.6 l/ha, 12/10/2015 herbicide Garlant Forte 1.2 l/ha, Nurelle D 0.6 l/ha, 15/04/2016 insecticide Nurelle D 0.6 l/ha, 21/05/2016 insecticide Mospilan 20 SP 0.15 kg/ha, Pictor 1 l/ha, 30/09/2016 insecticide Decis Mega 0.1 l/ha, Biscaya 0.15 l/ha | |||
| 2016/2017 | wheat | Tobak | rape | 23/09/2016 soil dragging, Plowing | 29/09/2016 Kompaktomat | 30/09/2016 | 17/08/2017 | 08/03/2017 | 31 kg N/ha (LAD 27) | 17/03/2017 | LAD 30 kg N/ha | 11/05/2017 | LAV 27 (30 kg N/ha) | 31/10/2016 herbicide Bizon 1 l/ha, 05/06/2017 fungicide Prosaro 250 EC 0.75 l/ha | |
| 2017/2018 | barley | Bojos | wheat | 30/07/2017 Disc harrow, 11/09/2017 Kompaktomat and sowing of intercrops Phacelia tanacetifolia Stala, 10/11/2017 Plowing | 08/04/2018 soil dragging, 12/04/2018 Kompaktomat | 12/04/2018 | 02/08/2018 | 12/04/2018 | 30 kg N, P2O5, K2O/ ha (NPK 15-15-15) | 11/05/2018 | 30 kg N/ha (LAD 27) | 02/05/2018 insekticide Mospilan 20 SP 0.12 kg/ha, 14/05/2018 herbicide Mustang forte 0.6 l/ha, 29/05/2018 insekticide Nerelle D 0.6 l/ha and fungicide Delaro 0.75 l/ha | |||
| 2018/2019 | rye | Gonello | barley | 06/08/2018 mulching, 08/08/2018 Disc harrow, 11/09/2018 Plowing | 27/09/2018 Kompaktomat | 27/09/2018 | 02/08/2019 | 19/03/2019 | 40 kg/ha (ledek LAV 27) | 16/10/2018 insekticide Proteus 111 OD 1l/ha, 31/10/2018 herbicide Bizon 1 l/ha, 09/11/2018 liming 500 kg/ha (Kalkgran), 27/05/2019 fungicide Prosaro 250 EC 0.75 l/ha | |||||
| 2019/2020 | maize | DKC 3142 | rye | 09/08/2019 sowing of intercrops Phacelia tanacetifolia Stala, 06/11/2019 Plowing | 24/04/2020 Kompaktomat | 27/04/2020 | 06/10/2020 | 05/11/2019 | manure spreading (45 t/ha) | 24/04/2020 | 120 kg N/ha (ammonium sulfate) | 28/04/2020 herbicide preemergent Adengo 0.44 l/ha | |||
| 2020/2021 | legume | maize |
References
- Wreford, A.; Adger, W.N. Adaptation in agriculture: Historic effects of heat waves and droughts on UK agriculture. Int. J. Agric. Sustain. 2010, 8, 278–289. [Google Scholar] [CrossRef]
- Oikonomou, P.D.; Karavitis, C.A.; Tsesmelis, D.E.; Kolokytha, E.; Maia, R. Drought Characteristics Assessment in Europe over the Past 50 Years. Water Resour. Manag. 2020, 34, 4757–4772. [Google Scholar] [CrossRef]
- Trnka, M.; Vizina, A.; Hanel, M.; Balek, J.; Fischer, M.; Hlavinka, P.; Semerádová, D.; Štěpánek, P.; Zahradníček, P.; Skalák, P.; et al. Increasing available water capacity as a factor for increasing drought resilience or potential conflict over water resources under present and future climate conditions. Agric. Water Manag. 2022, 264, 107460. [Google Scholar] [CrossRef]
- Rey, D.; Holman, I.P.; Knox, J.W. Developing drought resilience in irrigated agriculture in the face of increasing water scarcity. Reg. Environ. Chang. 2017, 17, 1527–1540. [Google Scholar] [CrossRef] [PubMed] [Green Version]
- Farooq, M.; Wahid, A.; Kobayashi, N.; Fujita, D.; Basra, S.M.A. Plant drought stress: Effects, mechanisms and management. Agron. Sustain. Dev. 2009, 29, 185–212. [Google Scholar] [CrossRef] [Green Version]
- Jaleel, C.A.; Gopi, R.; Sankar, B.; Gomathinayagam, M.; Panneerselvam, R. Differential responses in water use efficiency in two varieties of Catharanthus roseus under drought stress. C. R. Biol. 2008, 331, 42–47. [Google Scholar] [CrossRef]
- Li, C.; Jiang, D.; Wollenweber, B.; Li, Y.; Dai, T.; Cao, W. Waterlogging pretreatment during vegetative growth improves tolerance to waterlogging after anthesis in wheat. Plant Sci. 2011, 180, 672–678. [Google Scholar] [CrossRef]
- Hussain, H.A.; Hussain, S.; Khaliq, A.; Ashraf, U.; Anjum, S.A.; Men, S.; Wang, L. Chilling and Drought Stresses in Crop Plants: Implications, Cross Talk, and Potential Management Opportunities. Front. Plant Sci. 2018, 9, 393. [Google Scholar] [CrossRef]
- Mariotte, P.; Mehrabi, Z.; Bezemer, T.M.; De Deyn, G.B.; Kulmatiski, A.; Drigo, B.; Veen, G.F.C.; van der Heijden, M.G.A.; Kardol, P. Plant-Soil Feedback: Bridging Natural and Agricultural Sciences. Trends Ecol. Evol. 2018, 33, 129–142. [Google Scholar] [CrossRef] [Green Version]
- Schimel, J.P. Life in Dry Soils: Effects of Drought on Soil Microbial Communities and Processes. Annu. Rev. Ecol. Evol. Syst. 2018, 49, 409–432. [Google Scholar] [CrossRef]
- Swemmer, A.M.; Knapp, A.K.; Snyman, H.A. Intra-seasonal precipitation patterns and above-ground productivity in three perennial grasslands. J. Ecol. 2007, 95, 780–788. [Google Scholar] [CrossRef]
- Navarro-Cerrillo, R.M.; Rodriguez-Vallejo, C.; Silveiro, E.; Hortal, A.; Palacios-Rodríguez, G.; Duque-Lazo, J.; Camarero, J.J. Cumulative Drought Stress Leads to a Loss of Growth Resilience and Explains Higher Mortality in Planted than in Naturally Regenerated Pinus pinaster Stands. Forests 2018, 9, 358. [Google Scholar] [CrossRef] [Green Version]
- Hofer, D.; Suter, M.; Haughey, E.; Finn, J.A.; Hoekstra, N.J.; Buchmann, N.; Lüscher, A. Yield of temperate forage grassland species is either largely resistant or resilient to experimental summer drought. J. Appl. Ecol. 2016, 53, 1023–1034. [Google Scholar] [CrossRef] [Green Version]
- Komainda, M.; Küchenmeister, K.; Küchenmeister, F.; Breitsameter, L.; Wrage-Mönnig, N.; Kayser, M.; Isselstein, J. Forage legumes for future dry climates: Lower relative biomass losses of minor forage legumes compared to Trifolium repens under conditions of periodic drought stress. J. Agron. Crop Sci. 2019, 205, 460–469. [Google Scholar] [CrossRef]
- Vignjevic, M.; Wang, X.; Olesen, J.E.; Wollenweber, B. Traits in Spring Wheat Cultivars Associated with Yield Loss Caused by a Heat Stress Episode after Anthesis. J. Agron. Crop Sci. 2015, 201, 32–48. [Google Scholar] [CrossRef]
- Sears, R.R.; Shah, A.N.; Lehmann, L.M.; Ghaley, B.B. Comparison of resilience of different plant teams to drought and temperature extremes in Denmark in sole and intercropping systems. Acta Agric. Scand. Sect. B Soil Plant Sci. 2021, 71, 645–655. [Google Scholar] [CrossRef]
- Reynolds, M.; Dreccer, F.; Trethowan, R. Drought-adaptive traits derived from wheat wild relatives and landraces. J. Exp. Bot. 2006, 58, 177–186. [Google Scholar] [CrossRef] [Green Version]
- Ehdaie, B.; Alloush, G.A.; Waines, J.G. Genotypic variation in linear rate of grain growth and contribution of stem reserves to grain yield in wheat. Field Crops Res. 2008, 106, 34–43. [Google Scholar] [CrossRef]
- Ehdaie, B.; Layne, A.P.; Waines, J.G. Root system plasticity to drought influences grain yield in bread wheat. Euphytica 2012, 186, 219–232. [Google Scholar] [CrossRef]
- Daryanto, S.; Wang, L.; Jacinthe, P.-A. Global synthesis of drought effects on cereal, legume, tuber and root crops production: A review. Agric. Water Manag. 2017, 179, 18–33. [Google Scholar] [CrossRef] [Green Version]
- Grime, J.P.; Fridley, J.D.; Askew, A.P.; Thompson, K.; Hodgson, J.G.; Bennett, C.R. Long-term resistance to simulated climate change in an infertile grassland. Proc. Natl. Acad. Sci. USA 2008, 105, 10028–10032. [Google Scholar] [CrossRef] [PubMed] [Green Version]
- Plaut, J.A.; Yepez, E.A.; Hill, J.; Pangle, R.; Sperry, J.S.; Pockman, W.T.; McDowell, N.G. Hydraulic limits preceding mortality in a pinon-juniper woodland under experimental drought. Plant Cell Environ. 2012, 35, 1601–1617. [Google Scholar] [CrossRef] [PubMed]
- Reichmann, L.G.; Sala, O.E.; Peters, D.P. Precipitation legacies in desert grassland primary production occur through previous-year tiller density. Ecology 2013, 94, 435–443. [Google Scholar] [CrossRef] [PubMed]
- Dugas, W.A., Jr.; Upchurch, D.R. Microclimate of a Rainfall Shelter1. Agron. J. 1984, 76, 867–871. [Google Scholar] [CrossRef]
- Svejcar, T.; Angell, R.; Miller, R. Fixed location rain shelters for studying precipitation effects on rangelands. J. Arid Environ. 1999, 42, 187–193. [Google Scholar] [CrossRef]
- Yahdjian, L.; Sala, O.E. A rainout shelter design for intercepting different amounts of rainfall. Oecologia 2002, 133, 95–101. [Google Scholar] [CrossRef]
- Kundel, D.; Meyer, S.; Birkhofer, H.; Fliessbach, A.; Mäder, P.; Scheu, S.; van Kleunen, M.; Birkhofer, K. Design and Manual to Construct Rainout-Shelters for Climate Change Experiments in Agroecosystems. Front. Environ. Sci. 2018, 6, 14. [Google Scholar] [CrossRef] [Green Version]
- Hoover, D.L.; Wilcox, K.R.; Young, K.E. Experimental droughts with rainout shelters: A methodological review. Ecosphere 2018, 9, e02088. [Google Scholar] [CrossRef] [Green Version]
- Berzsenyi, Z.; Győrffy, B.; Lap, D. Effect of crop rotation and fertilisation on maize and wheat yields and yield stability in a long-term experiment. Eur. J. Agron. 2000, 13, 225–244. [Google Scholar] [CrossRef]
- Lopez-Bellido, L.; Lopez-Bellido, R.J.; Castillo, J.E.; Lopez-Bellido, F.J. Effects of tillage, crop rotation, and nitrogen fertilization on wheat under rainfed Mediterranean conditions. Agron. J. 2000, 92, 1054–1063. [Google Scholar] [CrossRef]
- Malhi, S.S.; Lemke, R. Tillage, crop residue and N fertilizer effects on crop yield, nutrient uptake, soil quality and nitrous oxide gas emissions in a second 4-yr rotation cycle. Soil Tillage Res. 2007, 96, 269–283. [Google Scholar] [CrossRef]
- Behnke, G.D.; Villamil, M.B. Cover crop rotations affect greenhouse gas emissions and crop production in Illinois, USA. Field Crops Res. 2019, 241, 107580. [Google Scholar] [CrossRef]
- Olesen, J.E.; Trnka, M.; Kersebaum, K.C.; Skjelvåg, A.O.; Seguin, B.; Peltonen-Sainio, P.; Rossi, F.; Kozyra, J.; Micale, F. Impacts and adaptation of European crop production systems to climate change. Eur. J. Agron. 2011, 34, 96–112. [Google Scholar] [CrossRef]
- Pohanková, E.; Hlavinka, P.; Kersebaum, K.-C.; Rodríguez, A.; Jan, B.; Bednařík, M.; Dubrovský, M.; Gobin, A.; Hoogenboom, G.; Moriondo, M.; et al. Expected effects of climate change on the production and water use of crop rotation management reproduced by crop model ensemble for Czech Republic sites. Eur. J. Agron. 2022, 134, 126446. [Google Scholar] [CrossRef]
- Wimmerová, M.; Hlavinka, P.; Pohanková, E.; Kersebaum, K.; Trnka, M.; Klem, K.; Žalud, Z. Is crop growth model able to reproduce drought stress caused by rain-out shelters above winter wheat? Acta Univ. Agric. Silvic. Mendel. Brun. 2018, 66, 225–233. [Google Scholar] [CrossRef] [Green Version]
- Wimmerová, M.; Pohanková, E.; Christian, K.; Kersebaum; Trnka, M.; Žalud, Z.; Hlavinka, P. Assessing the impact of drought stress on winter wheat canopy by Hermes crop growth model. In Proceedings of the MendelNet 2016, Brno, Czech Republic, 9–10 November 2016. [Google Scholar]
- Zaveri, E.; Russ, J.; Damania, R. Rainfall anomalies are a significant driver of cropland expansion. Proc. Natl. Acad. Sci. USA 2020, 117, 10225–10233. [Google Scholar] [CrossRef]
- Fang, H.; Liang, S. Leaf Area Index Models. In Reference Module in Earth Systems and Environmental Sciences; Elsevier: Amsterdam, The Netherlands, 2014. [Google Scholar]
- Wajhat Un, N.; Sandhu, S.; Ranjan, R.; Sharda, R. Root plasticity: An effective selection technique for identification of drought tolerant maize (Zea mays L.) inbred lines. Sci. Rep. 2023, 13, 5501. [Google Scholar] [CrossRef]
- Spinoni, J.; Vogt, J.V.; Naumann, G.; Barbosa, P.; Dosio, A. Will drought events become more frequent and severe in Europe? Int. J. Climatol. 2018, 38, 1718–1736. [Google Scholar] [CrossRef] [Green Version]
- Webber, H.; Ewert, F.; Olesen, J.E.; Muller, C.; Fronzek, S.; Ruane, A.C.; Bourgault, M.; Martre, P.; Ababaei, B.; Bindi, M.; et al. Diverging importance of drought stress for maize and winter wheat in Europe. Nat. Commun. 2018, 9, 4249. [Google Scholar] [CrossRef] [Green Version]
- Kant, S.; Thoday-Kennedy, E.; Joshi, S.; Vakani, J.; H, J.T.; Maphosa, L.; Sadler, A.; Menidis, M.; Slater, A.; Spangenberg, G. Automated Rainout Shelter’s Design for Well-Defined Water Stress Field Phenotyping of Crop Plants. Crop Sci. 2017, 57, 327–331. [Google Scholar] [CrossRef] [Green Version]


| Month | Temperature [°C] | Precipitation [mm] |
|---|---|---|
| Jan | −2.6 | 44.2 |
| Feb | −1.3 | 35.5 |
| Mär | 2.4 | 45.6 |
| Apr | 7.6 | 34.5 |
| Mai | 12.1 | 67.3 |
| Jun | 15.5 | 74.1 |
| Jul | 17.5 | 81.3 |
| Aug | 17.4 | 71.6 |
| Sep | 12.7 | 57.0 |
| Okt | 7.6 | 42.9 |
| Nov | 2.7 | 41.6 |
| Dez | −1.7 | 42.4 |
| Year | 7.5 | 638.1 |
| Soil | Depth | pH/H2O | pH/KCl | Cox (%) | hum (%) | bd (kg/m3) | p (%) | wp (%) | fc (%) | swc (%) | st Class |
|---|---|---|---|---|---|---|---|---|---|---|---|
| soil 1 | 5 cm | 5.25 | 3.90 | 1.17 | 2.01 | 1520 | 44.12 | 11.4 | 26.1 | 39.5 | loam |
| 15 cm | 4.98 | 3.78 | 1.07 | 1.85 | 1559 | 42.67 | 11.3 | 25.5 | 38.2 | loam | |
| 25 cm | 5.02 | 3.83 | 1.01 | 1.75 | 1539 | 43.84 | 11 | 24.9 | 38.9 | loam | |
| 35 cm | 5.19 | 3.92 | 0.75 | 1.29 | 1654 | 39.64 | 9.8 | 23.9 | 35.2 | loam | |
| 45 cm | 4.84 | 3.56 | 0.41 | 0.71 | 1589 | 42.44 | 11.6 | 23.1 | 37.6 | sandy loam | |
| 55 cm | 4.75 | 3.60 | 0.29 | 0.50 | 1500 | 11.8 | 21.8 | 41 | sandy loam | ||
| 65 cm | 4.63 | 3.58 | 0.18 | 0.31 | 1440 | 12.6 | 25 | 43.2 | loam | ||
| 75 cm | 4.60 | 3.59 | 0.17 | 0.29 | 1500 | 11.6 | 22.1 | 41.1 | sandy loam | ||
| 85 cm | 4.58 | 3.55 | 0.09 | 0.16 | 1570 | 9.3 | 17.4 | 38.6 | sandy loam | ||
| soil 2 | 5 cm | 5.52 | 4.36 | 1.15 | 1.99 | 1472 | 45.89 | 11.4 | 25.1 | 39.5 | loam |
| 15 cm | 5.58 | 4.31 | 1.05 | 1.80 | 1572 | 42.22 | 11.3 | 24.6 | 38.2 | loam | |
| 25 cm | 5.77 | 4.56 | 0.80 | 1.37 | 1523 | 44.01 | 11 | 22.6 | 38.9 | loam | |
| 35 cm | 5.90 | 4.53 | 0.42 | 0.73 | 1424 | 47.85 | 9.8 | 24.7 | 35.2 | loam | |
| 45 cm | 5.88 | 4.56 | 0.37 | 0.64 | 1422 | 48.66 | 11.6 | 26.2 | 37.6 | silt loam | |
| 55 cm | 5.75 | 4.41 | 0.30 | 0.52 | 1320 | 10.8 | 25.5 | 47.5 | silt loam | ||
| soil 3 | 5 cm | 6.17 | 5.07 | 1.01 | 1.75 | 1566 | 43.27 | 12.6 | 30.2 | 37.8 | silt loam |
| 15 cm | 6.26 | 5.20 | 1.06 | 1.83 | 1572 | 43.04 | 12.7 | 30.5 | 37.8 | silt loam | |
| 25 cm | 6.49 | 5.29 | 0.29 | 0.50 | 1669 | 39.52 | 11.7 | 28.6 | 34.9 | silt loam | |
| 35 cm | 6.56 | 5.26 | 0.15 | 0.27 | 1731 | 38.16 | 12.9 | 29.1 | 32.8 | silt loam | |
| 45 cm | 6.58 | 5.10 | 0.11 | 0.19 | 1742 | 37.34 | 13.7 | 29.9 | 32.5 | silt loam | |
| 55 cm | 6.14 | 4.56 | 0.08 | 0.14 | 1340 | 12.9 | 27.5 | 46.9 | silt loam | ||
| 65 cm | 5.66 | 4.27 | 0.06 | 0.11 | 1550 | 12.1 | 21.5 | 39.4 | sandy loam | ||
| 75 cm | 5.57 | 4.13 | 0.10 | 0.17 | 1500 | 14.8 | 25.9 | 41.1 | loam |
| Crop | Plot A | Plot B | Plot C | Plot D | Plot E | Plot F |
|---|---|---|---|---|---|---|
| Spring barley | 11/04/2017–24/08/2017 135d | 05/04/2016–15/08/2016 132d | 26/03/2015–06/08/2015 133d 12/04/2021–18/08/2021 128d | 08/04/2020–20/08/2020 134d | 05/04/2019–12/08/2019 129d | 12/04/2018–02/08/2018 112d |
| Silage maize | 02/05/2019–01/10/2019 152d | 03/05/2018–05/09/2018 125d | 10/05/2017–09/10/2017 152d | 11/05/2016–29/09/2016 141d | 05/05/2015–30/09/2015 148d 30/04/2021–12/10/2021 165 | 27/04/2020–06/10/2020 162d |
| Winter rape | 25/08/2014–31/07/2015 340d 25/08/2020–09/08/2021 349d | 23/08/2019–30/07/2020 342d | 22/08/2017–17/07/2018 329d | 26/08/2015–26/07/2016 335d | ||
| Summer rape | 11/04/2019–07/08/2019 118d | 11/04/2017–24/08/2017 135d | ||||
| Winter rye | 02/10/2017–26/07/2018 297d | 24/09/2020–13/08/2021 323d | 18/09/2019–21/08/2020 338d | 27/09/2018–02/08/2019 309d | ||
| Winter wheat | 25/09/2015–26/07/2016 305d | 30/09/2014–06/08/2015 310d 30/09/2016–17/08/2017 321d 06/10/2020–13/08/2021 311d | 25/09/2015–13/08/2016 323d 04/10/2019–13/08/2020 314d | 30/09/2014–06/08/2015 310d 01/10/2018–02/08/2019 305d | 07/10/2017–26/07/2018 292d | 30/09/2016–17/08/2017 321d |
| Crop | Plot A | Plot B | Plot C | Plot D | Plot E | Plot F |
|---|---|---|---|---|---|---|
| Spring barley | 15/06–24/08/2017 70d | 23/05–15/08/2016 84d | 11/06–18/08/2021 68d | 03/06–20/08/2020 78d | 30/05–12/08/2019 74d | 11/06–02/08/2018 52d |
| Silage maize | 20/06–30/07/2019 40d | 27/06–27/07/2018 30d | 21/06–01/08/2017 41d | 23/05–03/08/2016 72d | 30/06–29/07/2021 29d | 23/06–28/07/2020 35d |
| Winter rape | 12/05–09/08/2021 89d | 24/04–30/07/2020 97d | 03/05–12/07/2018 70d | 21/04–26/07/2016 96d | ||
| Summer rape | 06/06–07/08/2019 62d | 10/06–24/08/2017 75d | ||||
| Winter rye | 15/05–26/07/2018 72d | 12/05–13/08/2021 93d | 24/04–21/08/2020 119d | 30/04–02/08/2019 94d | ||
| Winter wheat | 15/04–26/07/2016 102d | 15/05–06/08/2015 83 15/05–17/08/2017 94d 24/05–13/08/2021 81d | 14/05–13/08/2016 91d 14/05–13/08/2020 91d | 07/05–02/08/2019 87d | 25/05–26/07/2018 62d | 12/05–17/08/2017 97d |
| Crop | Cond | Mean | Sd | Var | Max | Min | Perc 10 | Perc 25 | Perc 75 | Perc 90 |
|---|---|---|---|---|---|---|---|---|---|---|
| spring barley | control | 2.5 | 0.5 | 0.3 | 3.9 | 1.3 | 2.0 | 2.2 | 2.8 | 3.1 |
| shelter | 2.1 | 0.5 | 0.2 | 3.2 | 1.0 | 1.7 | 1.8 | 2.3 | 2.6 | |
| sillage maize | control | 2.1 | 0.7 | 0.5 | 3.4 | 0.8 | 1.1 | 1.6 | 2.5 | 3.0 |
| shelter | 2.0 | 0.8 | 0.6 | 3.4 | 0.9 | 1.2 | 1.5 | 2.5 | 2.9 | |
| summer rape | control | 2.6 | 0.9 | 0.8 | 4.5 | 1.4 | 1.7 | 2.1 | 3.2 | 3.4 |
| shelter | 2.5 | 0.8 | 0.7 | 4.1 | 0.9 | 1.7 | 2.0 | 2.9 | 3.3 | |
| winter rape | control | 3.4 | 1.3 | 1.8 | 6.6 | 0.7 | 2.0 | 2.6 | 4.0 | 5.3 |
| shelter | 2.8 | 1.5 | 2.2 | 6.6 | 0.8 | 1.7 | 1.8 | 3.4 | 5.3 | |
| winter rye | control | 2.4 | 0.5 | 0.2 | 3.5 | 1.3 | 1.9 | 2.1 | 2.7 | 2.9 |
| shelter | 2.2 | 0.5 | 0.2 | 3.1 | 1.0 | 1.7 | 1.8 | 2.4 | 2.8 | |
| winter wheat | control | 3.2 | 1.2 | 1.4 | 6.0 | 0.8 | 1.9 | 2.3 | 3.9 | 4.9 |
| shelter | 2.8 | 1.2 | 1.5 | 5.6 | 1.0 | 1.6 | 2.0 | 3.6 | 4.9 | |
| all crops | control | 2.8 | 1.0 | 1.1 | 6.6 | 0.7 | 1.7 | 2.1 | 3.3 | 4.0 |
| shelter | 2.4 | 1.0 | 1.0 | 6.6 | 0.8 | 1.5 | 1.8 | 2.8 | 3.6 |
| Crop | Soil Moisture vs. | Pearson’s r |
|---|---|---|
| spring barley | precipitation | 0.63 * |
| temperature | −0.19 | |
| silage maize | precipitation | 0.67 * |
| temperature | −0.6 * | |
| summer rape | precipitation | 0.34 |
| temperature | 0 | |
| winter rape | precipitation | 0.67 * |
| temperature | 0.05 | |
| winter rye | precipitation | 0.71 * |
| temperature | 0.09 | |
| winter wheat | precipitation | 0.71 * |
| temperature | −0.17 |
| Crop | June | July | August | Summer + |
|---|---|---|---|---|
| spring barley | 0.24 | 0.15 | 0.50 * | |
| silage maize | −0.06 | −0.01 | −0.01 | −0.47 |
| summer rape | 0.2 | 0.11 | 0.26 | 0.49 |
| winter rape | 0.18 | 0.21 | 0.61 * | |
| winter rye | 0.11 | 0.09 | 0.53 | |
| winter wheat | 0.15 | 0.04 | 0.23 |
| Crop | LAImax | Biomass | Yield |
|---|---|---|---|
| Spring barley | 1.2 | 1.1 | 1.4 |
| Silage maize | 1.3 | 1.2 | 1.2 |
| Winter rape | 1.2 | 1.3 | 1.6 |
| Winter rye | 1.1 | 1.1 | 1.3 |
| Winter wheat | 1.1 | 1.4 | 1.4 |
| Yield | Spring Barley | Silage Maize | Winter Rape | Winter Rye | Winter Wheat |
|---|---|---|---|---|---|
| Precipitation vegetation period | 0.69 * | 0.37 | 0.41 | 0.79 | 0.38 |
| Precipitation June | 0.60 | 0.25 | 0.74 * | 0.72 | 0.55 |
| Precipitation July | 0.37 | 0.47 | 0.84 ** | 0.68 | 0.32 |
| Precipitation August | 0.33 | ||||
| Precipitation summer month | 0.51 | 0.46 | 0.85 * | 0.71 | 0.48 |
| Soil moisture June | 0.87 ** | 0.85 ** | 0.82 * | 0.65 | 0.63 * |
| Soil moisture July | 0.67 * | 0.85 ** | 0.88 * | 0.72 | 0.51 |
| Soil moisture August | 0.62 | - | - | - | 0.57 |
| Soil moisture summer month | 0.81 ** | 0.83 * | 0.85 * | 0.72 | 0.59 * |
| LAI June | 0.65 | −0.74 | 0.78 | 0.97 * | 0.26 |
| LAI July | 0.79 ** | 0.01 | 0.76 * | 0.9 * | 0.41 |
| LAI August | −0.15 | - | |||
| LAI summer month | 0.74 * | 0.12 | 0.61 | 0.88 * | 0.41 |
Disclaimer/Publisher’s Note: The statements, opinions and data contained in all publications are solely those of the individual author(s) and contributor(s) and not of MDPI and/or the editor(s). MDPI and/or the editor(s) disclaim responsibility for any injury to people or property resulting from any ideas, methods, instructions or products referred to in the content. |
© 2023 by the authors. Licensee MDPI, Basel, Switzerland. This article is an open access article distributed under the terms and conditions of the Creative Commons Attribution (CC BY) license (https://creativecommons.org/licenses/by/4.0/).
Share and Cite
Thaler, S.; Pohankova, E.; Eitzinger, J.; Hlavinka, P.; Orság, M.; Lukas, V.; Brtnický, M.; Růžek, P.; Šimečková, J.; Ghisi, T.; et al. Determining Factors Affecting the Soil Water Content and Yield of Selected Crops in a Field Experiment with a Rainout Shelter and a Control Plot in the Czech Republic. Agriculture 2023, 13, 1315. https://doi.org/10.3390/agriculture13071315
Thaler S, Pohankova E, Eitzinger J, Hlavinka P, Orság M, Lukas V, Brtnický M, Růžek P, Šimečková J, Ghisi T, et al. Determining Factors Affecting the Soil Water Content and Yield of Selected Crops in a Field Experiment with a Rainout Shelter and a Control Plot in the Czech Republic. Agriculture. 2023; 13(7):1315. https://doi.org/10.3390/agriculture13071315
Chicago/Turabian StyleThaler, Sabina, Eva Pohankova, Josef Eitzinger, Petr Hlavinka, Matěj Orság, Vojtěch Lukas, Martin Brtnický, Pavel Růžek, Jana Šimečková, Tomáš Ghisi, and et al. 2023. "Determining Factors Affecting the Soil Water Content and Yield of Selected Crops in a Field Experiment with a Rainout Shelter and a Control Plot in the Czech Republic" Agriculture 13, no. 7: 1315. https://doi.org/10.3390/agriculture13071315