Article

Water Consumption by Livestock Systems from 2002–2020 and Predictions for 2030–2050 under Climate Changes in the Czech Republic

1
Department of Agroecology and Crop Production (Meteorological Section), Czech University of Life Sciences Prague, 165 00 Praha-Suchdol, Czech Republic
2
Global Change Research Institute, Czech Academy of Sciences, 603 00 Brno, Czech Republic
3
International Institute for Applied Systems Analysis (IIASA), 2361 Laxenburg, Austria
*
Author to whom correspondence should be addressed.
Agriculture 2023, 13(7), 1291; https://doi.org/10.3390/agriculture13071291
Submission received: 18 May 2023 / Revised: 20 June 2023 / Accepted: 21 June 2023 / Published: 24 June 2023
(This article belongs to the Section Agricultural Systems and Management)

Abstract

:
The livestock system in Europe relies on a complex holistic equilibrium that is the outcome of an interplay of demand, market, crop production, livestock production, land use, water availability, and other factors. When modeling future scenarios of water consumption by livestock systems, the most suitable tools result from the interconnectivity of growth models, economic models, and climate models. We integrated the Environmental Policy Integrated Climate growth model (EPIC), animal-level model (RUMINANT), economic model (Global Biosphere Management Model, GLOBIOM), EURO-CORDEX climate models, and regression models. This study developed novel livestock production scenarios for individual regions of the Czech Republic with estimations of the categories of livestock that have been bred during the last 20 years and will be bred in the future and what their water consumption will be, both throughout the year and in particular seasons. First, the numbers of farm animals, namely, cattle, pigs, sheep, horses, goats, and poultry in 2002–2020 were evaluated, and their numbers were predicted for the following years until 2050. Second, livestock water consumption per region was determined based on the number of livestock individuals. Third, changes in the amount of water consumed by livestock per year in individual regions in 2050 compared to 2005 were estimated.

1. Introduction

Livestock (cattle, pigs, sheep, horses, goats, and poultry, namely, hens, ducks, turkeys, and geese) is a source of 33% of the protein in human diets [1] as well as an important source of commodities consumed by people and provides many other services, such as traction, manure, risk management, and regular income [2]. Multiple extreme climate events (CEs) comprise a compound event and often result from a combination of climatic factors [3]. The direct and indirect effects of global warming, combined with the increasing frequency of weather extremes, are severe issues for livestock production, even in temperate climates such as central Europe [4,5,6,7]. The dual concept of feed losses and compound CEs has been suggested as an approach to understanding the extreme impacts of and reducing farmers’ exposure to weather-related financial risks [8]. Sustainable fodder production for increasing livestock trends is exposed to an ensemble of CEs whose impacts are complex and difficult to assess [9]. CEs can contribute to increased vulnerability of water resources, which will affect the optimum water demand for fodder production to support the livestock sector. In that case, vulnerability assessment of optimum water resources for livestock, estimation of the meteorological aspects of climate change, and adaptation strategies can be analyzed using a business-as-usual production model and a comprehensive economic model (Global Biosphere Management Model—GLOBIOM) [10,11], and such an assessment should be focused in-terms of multiple explicit scales from the local to the global level.
Continued population and economic growth will double the total demand for calories of animal origin by 2050 [1]. It has been found that an increase in temperature can lead to a reduction in net livestock yield, while increased total precipitation has a positive effect on livestock production [12]. The effect of raising the air temperature on livestock is not significant unless the annual average temperature increases by more than 0.4 °C. However, if the increase in temperature is greater, then the effect of high temperature on the animals is strongly negative [13]. In the context of future climate change, adaptation measures for livestock will need to be established, mainly due to the burden caused by rising spring and summer temperatures, as well as an increasing number of consecutive tropical days. These conditions cause thermal stress on animals. For example, they cause a lower milk yield and weight gain in cows [14]. High-yielding cows are particularly sensitive to heat stress [15]. Stress conditions will occur both in stables and pastures, and animal yields are likely to be reduced [14]. In addition to rising temperatures, regional and local impacts on livestock farming are amplified by changes in the humidity regime and airflow [15]. In the future, adaptation measures will need to be taken, for example, in the form of mobility, integration of livestock and crop production, feed supply, herd size reduction, livestock diversification, and forage cropping [16], as well as changes in production systems, animal husbandry strategy and management [3]. Additionally, the growing human population and the demand for animal products are expected to increase the water demand [17,18]. However, livestock consumes significant amounts of water. Annually, 4387 km3 of water is required to produce feed crops, forages, and grazed biomass for the global livestock sector, equaling about 22% of the total evapotranspiration from global agricultural land and 41% of total agricultural water use [19]. Globally, meat bovines are the largest water user with 32.7% of total livestock consumptive water use, followed by dairy bovines with 18.1% and industrial pigs with 14.3%; the smallest quantities are appropriated by layer hens, 4.1%; smallholder dual-purpose poultry, 3.4%; and smallholder pigs, 2.1% [19]. In 2015, the total water use in the Czech Republic was 1.6 billion m3. Agriculture in 2014 consumed approximately 3.44% of the total water use (calculated according to the data provided by Ansorge and Dlabal, 2017) [20]. It is assumed that climate change may significantly increase demands on water resources in some sectors of human activity, e.g., more water will be needed for crop irrigation and cooling systems [21]. However, the actual need for water for irrigation will depend on the shift in agroclimatic areas and changes in the crop structure in individual regions of the Czech Republic [22]. The amount of water consumed in agriculture will likely gradually increase, but at the same time, there will be a reduction in the number of farm animals [23]. For the conditions in the Czech Republic during 2030–2050, the estimated amount of water consumed in animal production is between 32 and 45 million m3 per year [20], depending on the climate change scenario used. In contrast, 7 million m3 of water was consumed in livestock production in 2001 and 12.5 million m3 in 2015, clearly showing an increasing trend. Thus, through extrapolation, [20] estimated 2.5 to 3.6 times higher water consumption in animal production by 2050.
We hypothesize that there will be insufficient fodder supply (feed grains) to the livestock sector due to water stress during the production season under climate change conditions. The main aim of the study was to develop dynamic livestock production scenarios for individual regions of the Czech Republic (CZ) with an estimation of what categories of livestock have been bred during the last 20 years and will be bred in the future (2030, 2035, 2040, 2045, 2050) and what their water consumption will be, both throughout the year and in particular seasons (spring, summer, autumn, winter). For the first time, our study calibrated the Global Biosphere Management Model (GLOBIOM) at the country level to know future water-use consumption patterns by livestock systems and better management of the water needed in agriculture. The analysis comprised two main steps: (i) assessment of the influence of meteorological factors, purchase prices of animal commodities, and subsidies on the number of kept animals using regression models, and (ii) application of the business-as-usual production GLOBIOM model to estimate the economic risk to attain sustainable fodder production.

2. Data and Methods

2.1. Climate Data in Livestock Production Regions

In the Czech Republic, cattle are mainly kept in naturally ventilated buildings that are most susceptible to climate change. The values of the meteorological factors matched the number of livestock kept. Based on the daily maximum and minimum air temperature, relative humidity, new snow cover, and precipitation homogenization data of more than 200 stations from 2002 to 2020, the 17 meteorological factors defined by ETCCDI (Expert Team on Climate Change Detection and Indices; [24] were calculated. For each station in each region, the effective temperature (sum of daily average temperatures for all values > 5 °C), as well as the number of icing days (TMA ≤ −0.1 °C), frost days (TMI ≤ −0.1 °C), summer days (TMA ≥ 25 °C), tropical days (TMA ≥ 30 °C), days with a tropical night (TMI ≥ 20 °C), and days with a THI value were calculated. The average number of days with characteristic temperatures (summer days, tropical days, days with a tropical night, icing days, and frost days) was calculated for each region (Table 1). The average annual temperature ranged from 6.7 °C in the Karlovy Vary Region to 10.6 °C in the South Moravian Region. The whole republic’s average temperature was 8.6 °C. Higher average temperatures were measured in the Liberec Region, Moravian–Silesian Region, Pardubice Region, Central Bohemian Region, Ústí Region, and Zlín Region. The average number of summer days in one year ranged from 29.3 in the Karlovy Vary Region to 79.4 in the South Moravian Region. A higher number of summer days was also observed in the Olomouc Region, Central Bohemian Region, and Zlín Region. The average number of tropical days was the highest in the South Moravian Region (27.2 days) and the lowest in the Karlovy Vary Region (4.4 days). A higher number of these days occurred in the Central Bohemian Region and Zlín Region. The average number of days with a tropical night was the highest in the South Moravian Region (2.8 days) and the lowest in the Karlovy Vary Region (0.0 days). A higher number of these days was found in the Liberec Region, Moravian-Silesian Region, and Ústí Region. The South Moravian region was the warmest region according to the results.

2.2. Livestock Statistical Dataset

First, information about the number of farm animals in the historical period 2002–2020 for all regions of the Czech Republic was obtained from the Czech Statistical Office (CSO, 2021). The datasets contained information about the number of cattle, pigs, sheep, goats, horses, and poultry (Table 2). Due to the recorded numbers of cows, sows, and hens (females with higher water consumption), it was necessary to subtract the number of cows, sows, and hens from the number of cattle, pigs, and poultry so that the resulting number included only the number of cattle without cows, pigs without sows and poultry without hens.
In the second step, it was necessary to determine the water consumption for livestock using standards for agricultural and food production [25]. In the overall table, water consumption is divided between young individuals, lactating females, and fattening animals. The minimum and maximum water consumption in liters per individual per day, as well as the maximum consumption in cubic meters per individual per year, were given. The minimum water consumption per day refers to the winter months, and the maximum water consumption per day refers to the summer months. The average of this minimum and the maximum value was determined as the water consumption per day during the spring and autumn months (Table 3). The average water consumption per individual for 1 day (in units of liters per day) for all seasons was determined for bred animal species. The average water consumption per individual during the seasons (in units of liters/individual/period), the average water consumption per individual during the year (in units of liters/individual/year and m3/individual/year), and the maximum water consumption per animal (in units m3/individual/year) were calculated (Table 3).
Since poultry includes not only hens but also ducks, turkeys, and geese, it was necessary to determine the approximate percentage of individual species of poultry in the Czech Republic. The Situation and Outlook Report Poultry and Eggs [26] was used for this purpose (Table 4). In the third step, water consumption by one livestock species was determined by multiplying the number of individuals of each livestock species and the average water consumption per individual. Finally, the total livestock water consumption per year was determined. It was calculated for each year from 2002 to 2018 for each region separately.
The number of individuals of livestock species and their water consumption was predicted for 2021–2050 using the linear extrapolation model to calculate the average estimate and its lower and upper limits for each region separately. To calculate the water consumption of livestock during the seasons of the year, the average percentage of water consumption in these periods compared to the whole year was determined. To ensure comprehensible and well-arranged results, the livestock species were divided into four groups: cattle (cows + other cattle), pigs (sows + other pigs), sheep + goats + horses (in the tables under the abbreviation SGH), and poultry (hens, broilers, ducks, geese, turkeys).

2.3. Implementation of a Comprehensive Economic Model–GLOBIOM

Vulnerability assessment of livestock, estimation of the meteorological aspects of climate change using a business-as-usual production model, Global Biosphere Management Model (GLOBIOM), and adaptation strategies based on estimates of irrigation demands are needed to attain sustainable fodder production. This model provides a detailed description of production possibilities at a high spatial resolution, considering the availability of grazing areas and fodder as well as various crop feed mixes across systems and regions [1]. The GLOBIOM model was developed and used by the International Institute for Applied Systems Analysis (IIASA) in the late 2000s. It is a global partial equilibrium economic model adapted to the Czech agricultural context that integrates land-use-based sectors, including agriculture, livestock, and forestry, using a bottom-up approach for the supply side based on detailed spatial unit information, including land cover, land use, management system, and other biophysical and technical cost information. It is grounded on the market equilibrium, which maximizes the producer and consumer surplus conditioned to resources, technological, demand, and policy constraints. The demand for final products and international trade is represented by 57 aggregated economic regions, 28 of which correspond to EU member states and the UK, and 29 are for regions outside Europe. The Czech Republic is characterized by its demand and trade flows. It can trade with other countries in the EU and with regions outside the EU through a common EU hub market. Explicit representation of production technologies and geographic allocation of land cover and land use and their related carbon stocks and greenhouse emissions flows are needed to model every sector with their supply production functions, markets and demand side. GLOBIOM is a linear programming model coded in GAMS that allows for the analysis of large-scale problems. The three primary segments of modeling regional change are (1) atmosphere–climate development and its modeling; (2) ecosystems, the carbon cycle, and the impacts of global change on managed ecosystems, including the design of mitigation and adaptation measures; and (3) socioeconomic systems, namely, impacts on the development and behavior of society. The biophysical process-based Environmental Policy Integrated Climate model (EPIC) computes productivity, fertilizer, and irrigation demand. The EPIC model can also determine grassland productivity. The European crop sector is represented by crop rotations of 18 crops derived from crop shares calculated from EUROSTAT statistics based on crop areas at the NUTS2 level using the CropRota crop rotation model. The RUMINANT animal-level model is incorporated in GLOBIOM, which simulates the effects of nutrition (feed quality and availability) on the growth and production of beef, lamb, and poultry meat, bovine and small ruminant milk, and eggs. The model consists of a dynamic section that estimates the intake and supply of nutrients to the animal from knowledge of the fermentation kinetics and passage of feed constituents (carbohydrate and protein) through their gastrointestinal tract and subsequent excretion.

2.4. Calibration of GLOBIOM-CZ Models

Here, we focused on inventorying the number of animals kept over the last 20 years at the country level and used these data to calibrate the models (Figure 1). This procedure allowed us to determine the extent to which the model output matches the actual observed data and evaluate the ability of the model to represent the integration of forage and livestock production in the Czech Republic. Quantitative analyses of the impacts of climate change on animal welfare and linked economic and environmental factors are rare. Thus, a total of 11 GLOBIOM-CZ models were calculated by combining 5 RCM models and 3 RCP scenarios (Table 5) related to the whole Czech Republic for the 2000–2050 period for chosen crops and livestock products: production, cultivated area, rainfed cultivated area, land cover for cropland, grassland, and other natural lands, crop yield, rainfed crop yield, feed use, animal number (in livestock-only systems temperate (LGT), mixed rainfed temperate (MRT), in urban areas, in other areas), ruminant bovine number, nonruminant number, ruminant meat, ruminant milk, biofuel, emissions, calories, calorie target, and net trade, as well as the human population.
Linear regression models describing the development of values for each quantity for each crop/livestock product from 2000 to 2050 were also calculated, and the minimum and maximum values of the regression coefficient and coefficient of determination for each group of models simulating one quantity for one crop/livestock product were calculated. The average values for quantities for each crop/livestock product from all GLOBIOM-CZ models were determined for 2020 and 2050. Thus, two main periods were compared based on the animal number and water consumption: 2005–2020 (related to observed data) and 2021–2050 (related to the statistical prediction and GLOBIOM models). Regions were classified according to the intensity of animal production (determined by water consumption by livestock) into five groups: the most developed animal production regions, strongly developed animal production regions, moderately developed animal production regions, less developed animal production regions, and the least developed animal production regions (Figure 2).

2.4.1. Livestock Population m3

The number of animals was analyzed by species, production system, and production type in each spatial unit (Table 6 and Table 7). The species aggregates were cattle and buffaloes (bovines), sheep and goats (small ruminants), pigs, and poultry. The production systems for ruminants are grazing systems in arid (LGA), humid (LGH), and temperate/highland areas (LGT); mixed systems in arid (MXA), humid (MXH), and temperate/highland areas (MXT); urban systems (URB); and other systems (OTH). The production types for dairy and meat herds were modeled separately for ruminants: (i) the dairy herd includes adult females and replacement heifers, whose diets are distinguished. (ii) Poultry in smallholder systems was considered a mixed producer of meat and eggs. (iii) Poultry in industrial systems was split into laying hens and broilers with differentiated diet regimes.

2.4.2. Livestock Products

Product yield, feed requirements, and a set of direct GHG emission coefficients were determined (Table 6 and Table 7). (i) Products include bovine meat and milk, small ruminant meat and milk, pig meat, poultry meat, and eggs. (ii) Primary commodities equivalents for each product were considered as differentiated goods with a specific market except for bovine and small ruminant milk, which were merged in a single milk market.

2.4.3. Livestock Feed

(i) The feed requirements for ruminants are computed simultaneously with the yields. (ii) Specific diets were defined for adult dairy females and for other animals. (iii) Feed diet aggregates comprised grains (concentrates), stover, grass, and others. (iv) GRAINS in the feed rations were adjusted so that total feed requirements at the country level match the total feed quantity in FAOSTAT. (v) GRAINS was disaggregated into 11 feed groups: barley, corn, pulses, rice, sorghum and millet, soybeans, wheat, cereal other, oilseed other, crops other, animal products, and grazing forage availability (Table 6 and Table 7). The demand and supply of grass need to match the level of spatial units in GLOBIOM, and the EPIC model was the best fit for much of Europe, where most forage production is derived from intensively managed grasslands.

2.4.4. Livestock Dynamics

The number of animals of a given species and product type in a particular production system and the spatial unit will decrease or increase in relation to changes in demand and the relative profitability concerning competing activities (Table 6 and Table 7). The herd dynamics constraints include: (i) Dairy herds are composed of adult females and followers, and therefore expansion occurs in predefined proportions in the two groups. (ii) For regions where the specialized meat herds are insignificant (no suckler cows), the expansion of meat animals (surplus heifers and males) is also assumed to be proportional in size to the dairy herd. (iii) The ruminants in urban systems were not allowed to expand because this category needs to be well known and as it is fairly constrained by available space in growing cities. (iv) Finally, it was not considered possible to decrease the animals per system and production type by more than 15% per 10-year period or increase by more than 100% in the same period. At the level of individual systems, the decrease can be as deep as 50% per system in a single period. (v) Monogastrics were not treated in a spatially explicit way since no reliable maps are currently available and because monogastrics are not linked to specific spatial features in the model, such as grasslands. It was assumed that all additional supply will come from industrial systems, and hence, the number of animals in other systems was kept constant. Demand includes the consumption of commodities for food, feed, and biofuels. The supply integrated the production of crops, livestock, subproducts (oilseeds), management system (rain-fed, irrigation), and land allocation (crop rotations). Trade links the total traded amount and bilateral trade flows.

2.5. Thermal-Humidity Stress

The temperature-humidity index (THI), which indicates the heat stress for cattle, was also calculated for the daily data using the Formula [27]:
THI = (1.8 × AT + 32) − [(0.55 − 0.0055 × RH) × (1.8 × AT − 26)],
where AT is the air temperature (°C) and RH is the relative humidity (%). The THI thresholds for heat stress in cattle were as follows: comfort (THI < 68), mild discomfort (68 < THI < 72), discomfort (72 < THI < 75), alert (75 < THI < 79), danger (79 < THI < 84) and emergency (THI > 84).
To determine the impact of thermal-humidity conditions on the number of livestock (cattle, cows, pigs, sows, sheep, goats, horses, chickens, broilers, ducks and geese and turkeys), we detrended the time series of livestock and THI indicators separately for each region. A total of 2574 linear regression models were calculated. The performance of each model was measured by the mean absolute error, the determination coefficient, and the minimum and maximum values of the regression coefficient. Models where the p-value was less than 0.05, indicating the statistical significance of the model, were flagged. For these models, the relationship trend was also indicated, i.e., whether the number of cattle increases (+) or decreases (−) with the increasing value of the meteorological factor.

2.6. Influence of Purchase Prices of Animal Commodities and Subsidies on the Number of Bred Animals

The average purchase prices of animal commodities (milk, eggs, meat of cows, pigs, chickens, and hens) in the 2010–2020 period were obtained from the database of the Czech Statistical Office (CSO) [28]. The relationship between these values and the number of bred animals was investigated using linear regression models.
The volumes of subsidies to agriculture, as well as to animal production only, were obtained for each region in the Czech Republic for each year in the 2002–2020 period from the register of subsidy recipients [29]. Then, the subsidy amounts and number of animals in four groups (cattle, pigs, sheep + goats + horses, poultry) were drawn into one graph, and the potential connection between subsidies and the number of animals was evaluated.

3. Results

3.1. Changes in Livestock Individuals in Particular Regions of the Czech Republic

Figure 3 summarizes the percentage of changes in the number of livestock individuals (cattle, pigs, sheep + horses + goats, poultry) in individual regions in 2050 compared to 2005. The number of cattle will increase in some regions by 2050 (Karlovy Vary Region, Liberec Region, Pilsen Region, South Bohemian Region, Zlín Region, Moravian–Silesian Region) and will decrease in other regions (Central Bohemian Region, Hradec Králové Region, South Moravian Region, Olomouc Region). The highest increase is expected in the Karlovy Vary Region (+99% compared to 2005), and the most substantial decrease is expected in the South Moravian Region (−34%). A constant number of cattle is expected in the Vysočina Region and the Ústí Region. Pig farming will be substantially reduced in almost all regions by 2050, and it is expected to disappear entirely in nine regions. An increase in the number of pigs is expected only in the Ústí Region (56% compared to 2005). Based on the model prediction, the number of sheep, goats, and horses will increase substantially by 2050. A decrease in the number of animals is expected only in the Pilsen Region. The number of poultry will be substantially limited in some regions. Nevertheless, it will increase substantially in other regions (Pilsen Region, Hradec Králové Region, Pardubice Region). The most substantial increase is expected in the Pardubice Region.

3.2. Water Consumption by Livestock in Individual Regions

Animals need the most water in the summer period because of the high air temperature. Lactating females need much more water than males or young animals. Their water consumption is ca. 2.6× higher for cows and ca. 3× higher for pigs. High-weight animals (cows, pigs, horses) need more water than low-weight animals (sheep, goats, poultry). Ducks, geese, and turkeys need ca. 2× more water than hens and broilers. Figure 3 shows the average water consumption by livestock in individual regions. In contrast, Figure 4 shows a percentage change in the amount of water consumed per year in individual regions in 2050 compared to 2005. The trend of water consumption by livestock was predicted for each region separately. Constant water consumption by livestock is predicted for the South Moravian Region, Ústí Region, Zlín Region, and Vysočina Region, a slight increase is expected in the South Bohemian Region and Pilsen Region, and a substantial increase in water consumption is predicted for the Karlovy Vary Region, Liberec Region, and Moravian–Silesian Region. A future decrease in water consumption by livestock is expected in the Hradec Králové Region, Olomouc Region, Pardubice Region, and Central Bohemian Region.

3.3. Observed and Predicted the Number of Livestock Individuals and Average Water Consumption per Year for Individual Regions

Table 8 and Table 9 show the number of individuals and average water consumption (m3/year) for groups of animals per region. The regression prediction values are always valid for the year 2050 compared to 2005. Percentages (%) were calculated as an increase/decrease in the number of individuals or the average water consumption from 2005 to 2050. For example, a value of +5.22% means that the number of animals is expected to increase by 5.22% in 2050 compared to 2005, and a value of −33.53% means that the number of animals is expected to decrease by 33.53% in 2050 compared to 2005. If the increase/decrease was less than 5%, the number of animals was determined to be constant; if the increase/decrease was between 5 and 10%, it was determined to be a slight increase/decrease; if the increase/decrease was between 10 and 60%, it was determined as an increase/decrease; and if the increase/decrease was higher than 70%, the number of animals was determined to be a substantial increase/decrease.
The South Bohemian Region, together with the Vysočina Region, belongs to the regions with the most developed animal production. A slight increase (+5%) in the number of animals is expected for cattle, a substantial increase (+158%) in the number of animals is expected for sheep, goats, and horses, and gradual disappearance (−100%) of breeding is expected for pigs and poultry. In this region, a constant amount of water consumed by livestock is expected in the future (Table 9). The South Moravian Region, together with the Zlín Region, is one of the regions with less developed animal production. A decrease (−34%) in the number of animals is expected for cattle, a substantial increase (+359%) in the number of animals is expected for sheep, goats, and horses, and a substantial decrease in the number of animals is expected for pigs (−100%) and most poultry species (−72%). In this region, a decrease (−38%) in the amount of water consumed by livestock is expected in the future (Table 8).
The Karlovy Vary Region, together with the Liberec Region and Ústí Region, is one of the regions with the least developed animal production. A substantial increase (+99%) in the number of animals is expected for cattle, and an increase (+36%) in the number of animals is expected for sheep, goats, and horses. A substantial reduction (−100%) in the breeding of pigs is expected, and a decrease (−19%) in the number of animals is expected for poultry. In this region, a substantial increase (+90%) in the amount of water consumed by livestock is expected (Table 8). The Vysočina Region, together with the South Bohemian Region, is one of the regions with the most developed animal production. A constant number of animals is expected for cattle, a substantial increase (+380%) in the number of animals is expected for sheep, goats, and horses, and a substantial decrease in the number of animals is expected for pigs (−84%) and poultry (−100%). In this region, a slight decline (−8%) in the water consumed by livestock is expected (Table 8).
The Hradec Králové Region, together with the Moravian–Silesian Region, Olomouc Region, and Pardubice Region, is a region with moderately developed animal production. A decrease (−27%) in the number of animals is expected for cattle, a substantial increase in the number of animals is expected for sheep, goats, horses (+270%), and poultry (+201%), and a substantial decrease (−100%) in the number of animals is expected for pigs. In this region, a decrease (−24%) in the amount of water consumed by livestock is expected in the future (Table 9). The Liberec Region, together with the Karlovy Vary Region and Ústí Region, is one of the regions with the least developed animal production. An increase in the number of animals is expected for cattle (+61%), sheep, goats, and horses (+386%), and a substantial decrease in the number of animals is expected for pigs (−100%) and poultry (−77%). In this region, an increase (+38%) in the amount of water consumed by livestock is expected in the future (Table 8). The Moravian–Silesian Region, together with the Hradec Králové Region, Olomouc Region, and Pardubice Region, is a region with moderately developed animal production. An increase in the number of animals is expected for cattle (+59%), sheep, goats, and horses (+174%), and a substantial reduction (−100%) is expected for pigs and poultry. In this region, an increase (+25%) in the amount of water consumed by livestock is expected.
The Olomouc Region, together with the Hradec Králové Region, Moravian–Silesian Region, and Pardubice Region, has moderately developed animal production. A decrease (−20%) in the number of animals is expected for cattle, a substantial increase (+234%) in the number of animals is expected for sheep, goats, and horses, and a substantial decrease in the number of animals is expected for pigs (−100%) and poultry (−91%). In this region, a decrease (−26%) in the amount of water consumed by livestock is expected in the future (Table 9). The Pardubice Region, together with the Hradec Králové Region, Moravian-Silesian Region, and Olomouc Region, is one of the regions with moderately developed animal production. A decrease in the number of animals is expected for cattle (−20%) and pigs (−33%), an increase in the number of animals is expected for sheep, goats, and horses (+170%), and a substantial increase (+414%) in the number of animals is expected for poultry. In this region, a decrease (−13%) in the amount of water consumed by livestock is expected in the future (Table 9).
The Pilsen Region, together with the Central Bohemian Region, has strongly developed animal production. A slight increase (+8%) in the number of animals is expected in cattle, a substantial decrease in the number of animals is expected for pigs (−100%) and sheep (−98%), an increase in the number of animals is expected for goats (+148%) and horses (+239%), and a slight decrease (−9%) in the number of animals is expected for most poultry, but the number of hens should increase (+583%). In this region, a slight increase (+9%) in the amount of water consumed by livestock is expected (Table 9).
The Central Bohemian Region, including the City of Prague, together with the Pilsen Region, has strongly developed animal production. A decrease (−24%) in the number of animals is expected for cattle, a substantial increase (+439%) in the number of animals is expected for sheep, goats, and horses, a gradual substantial decrease in the number of animals is expected for pigs (−97%), and a decrease in the number of animals is expected for most poultry (−33%), but the number of hens should increase (+159%). In this region, a decrease (−25%) in the amount of water consumed by livestock is expected in the future (Table 9).
The Ústí Region, together with the Karlovy Vary Region and Liberec Region, is one of the regions with developed animal production. An endless number of animals is expected for cattle, an increase in the number of animals is expected for pigs (+56%), sheep, goats, and horses (+188%), and a gradual reduction (−100%) is expected for poultry. In this region, a slight increase (+7%) in the amount of water consumed by livestock is expected (Table 9). The Zlín Region, together with the South Moravian Region, has less developed animal production. A slight increase (+8%) in the number of animals is expected in cattle, an increase (+184%) in the number of animals is expected for sheep, goats, and horses, and a reduction in breeding (−100%) is expected for pigs and poultry. In this region, a constant amount of water consumed by livestock is expected in the future (Table 9).

3.4. Heat-Humidity Stress Assessment

The average percentage of THI in each category (<68, 68–72, 72–75, 75–79) was calculated for each region. In May, almost all days belonged to the category with no heat stress, which means comfortable conditions for animals. There were 4.6–5.7% days in the category with low heat stress (mild discomfort). These days occurred in the warmest areas in the South Moravian Region, Praha, and Zlín Region. In June, a total of 5.7–22.7% of days belonged to the category of heat stress (discomfort conditions). In July, there was a higher number of days related to mild discomfort (THI 68–72; 18–32%), discomfort (THI 72–75; 8–12%), and alert conditions (75 < THI < 79; 2.9–6.6%). Most days in these categories occurred in the South Moravian Region, Praha, and Zlín Region. The percentage of days in August with mild discomfort conditions and discomfort conditions was slightly lower than in July. In September, almost all days belonged to the category with no heat stress. A few days categorized as mild discomfort (THI 68–72; 1.6–4.8%) and discomfort (THI 72–75; 0.3–0.5%) occurred in the South Moravian Region, Moravian-Silesian Region, Liberec Region, Ústí Region, Praha, and Zlín Region.
The South Moravian Region, Praha, and the Zlín Region are highly affected by heat stress, especially in high-yielding dairy cows, which endogenously produce more heat and, therefore, are more sensitive to high environmental temperatures. The effect of heat stress on cows in warmer regions can lead to decreases in milk yield and quality (protein, fat, lactose) and an alteration of reproductive efficiency. Thus, heat stress reduces milk synthesis and it is critical to develop novel approaches (i.e., genetic, managerial, and nutritional) to maintain production or minimize reductions during stressful summer months. Figure 5 shows the average percentage of the temperature-humidity index (THI) in 4 categories (<68, 68–72, 72–75, 75–79) over 5 months for each region. The blue scale describes a measure of the percentage of THI in the 68–72 category in comparison with the other regions. The red scale describes a measure of the percentage of THI in the 72–75 category in comparison with the other regions. The regions with the warmest climate are written in bold.
The detrended number of pigs, sows, hens, broilers, ducks + geese, and turkeys responded most negatively (−0.42 < r < −0.69; R2 > 30%) to the increasing Tmax and Tmin (Table 10). The R2 indicates that the impact of the average relative air humidity on crows explains 70.25% of the variability in the detrended number of cows. The correlation coefficient (r = −0.84) indicates a moderately strong relationship between the variables at the 95.0% confidence level. The data indicate that there is a negative correlation between the price of heating bills and outdoor THI. This strong negative correlation signifies that as the THI decreases outside, the price of heating bills increases (and vice versa). The number of days with a THI range of 68–72 affected the number of pigs, sows, horses, broilers, ducks + geese, and turkeys. The number of dry days (days with precipitation < 0.1 mm) had adverse effects (−0.29 < r < −0.45; R2 > 29%) for cattle, cows, sheep, and horses.

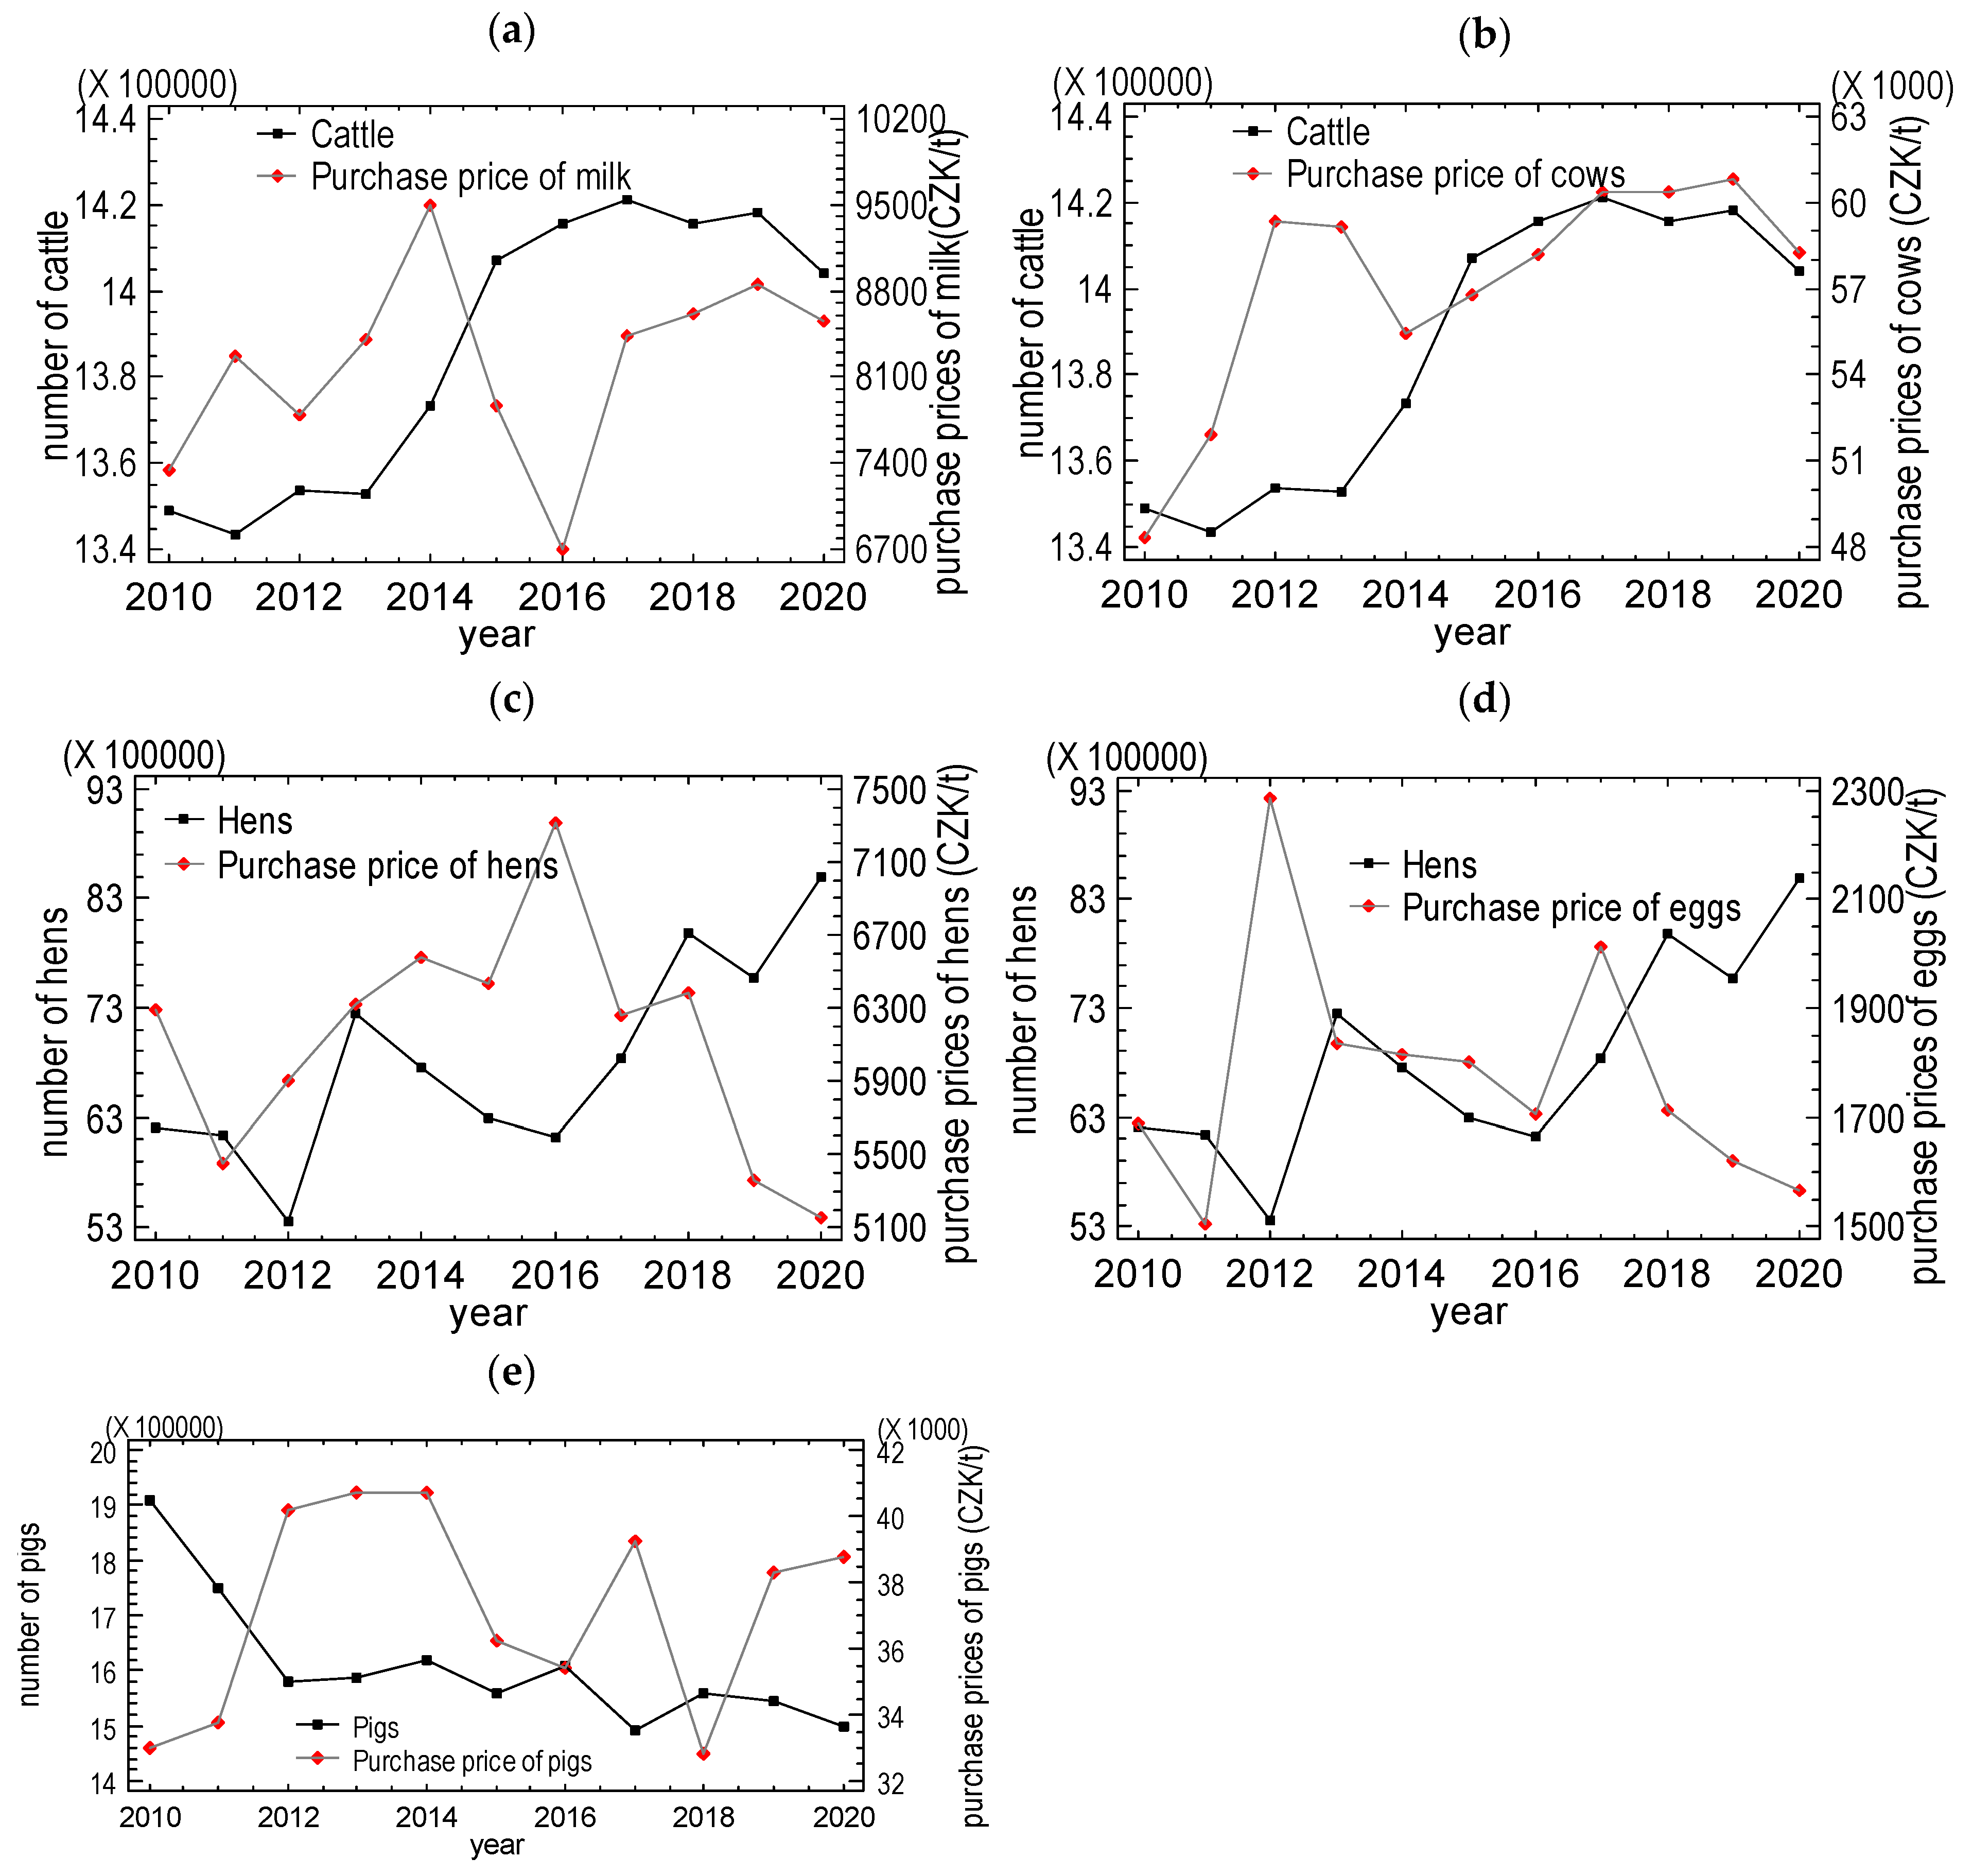
3.5. The Effect of the Purchase Price of Commodities on the Number of Farmed Animals

The trend in the number of animals (cattle, hens, and pigs) with the purchase prices of commodities (milk, eggs, and pigs) at the country level is shown in Figure 6a–e. The high purchase price of milk was related to a lower number of cows, which grew quickly in 2013–2015, although the purchase price of milk decreased (Figure 6a,b). The number of cows can be explained by the increase in the purchase price of cows from 37%, and the dependence of the number of cows on the purchase price of cows was positive (higher price, more cows). There was a significant decrease in the number of kept poultry in 2010–2012, but it increased in the following years. The purchase price of hens increased in 2015–2016 but decreased in the following years, so its time course was opposite to the number of bred poultry. The number of hens can be influenced by the purchase price of hens and/or the purchase price of eggs. There was a strong decrease in the number of kept hens in the period 2016–2020, although the purchase prices of both commodities increased in this period. There is a negative relationship between the number of kept hens and purchase prices. The purchase price of hens can explain 14% of the number of hens and 23.5% of the purchase price of eggs. The low purchase price of pigs is related to the higher number of bred pigs. When the price decreased, the number of pigs increased, so there was a negative relationship between these two variables. Thirty-two percent of the number of pigs can be explained by the purchase price of pigs.

3.6. The Effect of the Subsidy Price of Commodities on the Number of Farmed Animals

Insurance subsidies are risk management support to protect farmers against the health deterioration and death of animals. The livestock sector continues to be a major beneficiary of direct payments, particularly in the grazing livestock sector, where direct payments represent approximately 55% of income for EU farmers [30]. The results of the effect of the subsidy price of commodities on the number of farmed animals across the CZ indicate that subsidies might either increase or decrease productivity and, thus, the net effect may be positive or negative. However, it seems that the subsidies do not have a direct influence on many animals in many regions except for cattle. The number of pigs rapidly decreased continuously during the studied period with no apparent relation to subsidies. In most regions, the number of poultry alternately increased and decreased during the whole study period; the most rapid decrease occurred between 2008 and 2011, with no evident relation to subsidies.
In the South Bohemian region, the number of cattle relatively matched the trends of total subsidies to agriculture as well as the subsidies to animal production (Figure 7). The number of poultry decreased even though the subsidies increased in the studied period. In the South Moravian region, the number of poultry decreased from 2002–2015, then started to increase, matching the trend of subsidies from 2015. In the Karlovy Vary Region, the subsidies to agriculture decreased rapidly between 2003 and 2004 and then increased slightly in 2014. The number of cattle increased in the studied period, and the number of pigs decreased until 2012 when it started to grow. In the Vysočina Region, the increase in cattle could be related to increased subsidies to agriculture in 2014–2016. The number of sheep, goats, and horses increased continuously during the studied period, which can be connected to subsidies for animal production. In the Hradec Králové Region, the total subsidies to agriculture started to grow in 2013, and there was a significant increase in 2020. The number of cattle generally decreased in the studied period, except for 2012–2015 and 2019, when the number of cattle increased. This situation can potentially be related to an increase in subsidies to agriculture.
In the Liberec Region and Moravian–Silesian Region, there was a radical decrease in subsidies for agriculture and animal production between 2002 and 2004. The number of cattle decreased in the 2002–2004 period and then started to increase significantly, with a maximal value in 2019. This increase in cattle can be related to the increase in subsidies. In the Olomouc Region and Pardubice Region, the total subsidies to agriculture started to grow significantly in 2015, and the subsidies to animal production started to grow in 2011. The number of pigs decreased from 2002–2010 and then started to increase, probably in connection to subsidies to agriculture. The increase in the number of poultry in the 2011–2013 and 2014–2018 periods can be related to subsidies to agriculture.
In the Pilsen Region, the number of cattle decreased in the 2002–2006 period and then started to increase, except in 2008–2010, probably in connection to subsidies to animal products; however, there has been an evident decrease in the number of cattle since 2015. In the Ústí Region, subsidies for animal production started to grow in 2012. The number of cattle decreased from 2002–2013 and then increased. The number of pigs decreased from 2002–2010 and then started to increase, probably in connection with subsidies for animal production. In the Zlín region, the number of cattle decreased in the 2002–2009 period and then started to increase, except in 2012–2013, probably in connection to subsidies for animal production.

3.7. Output Analysis of the GLOBIOM Models

The human population in the Czech Republic is expected to increase in the following years, with a nearly linear trend (R2 = 0.98), at a rate of 0.29 million people per year. All thirteen models predicted identical values for 2030, 2040, and 2050. The total number of people in the Czech Republic could be 11.6 million in 2050 (compared to 10.9 million in 2020). The increased number of people will lead to increased demands for food and water.
The production of selected crops/livestock products was studied. A summary of the results is presented in Table 11. Almost all products (milk, barley, bovine meat, corn, corn silage, pig meat, poultry eggs, poultry meat, rapeseed oil, and wheat) decreased from 2000 to 2050. Oats, rye, sheep, and goat meat showed an increasing trend from 2000 to 2050. The cultivated area showed a decreasing trend for barley, corn, corn silage, sheep and goat meat, and wheat and an increasing trend for milk, bovine meat, oats, and rye (Table S1 in Supplement). The rainfed cultivated area showed a decreasing trend for barley, corn, corn silage, and wheat and an increasing trend for oats and rye (Table S1).
Land cover was divided into three groups: cropland, grassland, and other natural lands. The cropland decreased from 2000 to 2050, and the grassland and other natural land increased from 2000 to 2050 (Table S2). Crop yields showed a decreasing trend for milk, bovine meat, corn silage, and wheat and an increasing trend for barley, corn, oats, rye, and sheep and goat meat (Table S3). Rainfed crop yields showed a decreasing trend for corn silage and wheat and an increasing trend for barley, corn, oats, and rye (Table S4). Crops used for feeding showed a decreasing trend for all crop types (barley, corn, corn silage, oats, rape, rapeseed oil, rye, and wheat).
The animal number was determined for different production systems–LGT, MRT, urban areas, and other areas. There were decreasing trends in animal numbers for the MRT systems and urban areas and increasing trends for the LGT systems and other areas (Table 12). The ruminant bovine number showed a decreasing trend in the LGT and MRT systems and an increasing trend in urban and other areas (Table 12). The nonruminant number was studied only in urban areas with a decreasing trend and in other areas with similar values in 2050, according to 2020 (Table 12).
Ruminant meat showed an increasing trend in LGT production systems, urban areas, and others and a decreasing trend in MRT production systems (Table S5). Ruminant milk showed a decreasing trend in LGT and MRT production systems and an increasing trend in urban and other areas. The production of biofuel will increase for rape oil as well as for fuel made from wheat (Table S6).
The development of emissions (in Mt CO2 eq/year) will differ depending on the type of crop and livestock. A decreasing trend was simulated for total crops, total livestock, milk, barley, corn, corn silage, pig meat, poultry eggs, poultry meat, sheep and goat meat, and wheat. An increasing trend was simulated for bovine meat, oats, and rye (Table S7).
Net trade showed a decreasing trend for milk, barley, bovine meat, corn, pig meat, poultry eggs, poultry meat, rapeseed oil, and wheat and an increasing trend for oats, rye, and sheep and goat meat (Table S8). Calories for each crop/livestock product will probably decrease for milk, barley, oats, pig meat, poultry eggs, poultry meat, rye, sheep and goat meat, and wheat and likely increase for bovine meat and rapeseed oil (Table S9 in Supplement). The calorie target will probably decrease for milk, oats, pig meat, poultry eggs, poultry meat, rye, and sheep and goat meat and likely increase for barley, bovine meat, rapeseed oil, and wheat.

4. Discussion

Despite the numerous studies carried out on climate change and livestock production systems, there remain several research gaps. Many studies mainly focus on cattle/cows, with less coverage of other species, such as pigs, cows, sheep, goats, horses, hens, and poultry. Little is known about the water consumption by livestock systems under climate changes for individual regions. There are considerable difficulties involved in assessing water use in the livestock sector. GLOBIOM is a helpful model for estimating subsystem behavior and feedback between demand, market, crop production, livestock production, land use, and irrigation. We focused on obtaining data and inventorying the number of farmed animals over the last 20 years and used these data to calibrate the model. This procedure allowed us to determine the extent that the outputs of the model correspond to the real data and, therefore, the ability of the model to represent the integration of forage cultivation and animal production. Therefore, one question arises: whether there will be enough water available in the future and what effect the (in)availability of water will have on the possibilities of livestock breeding. However, all available studies concerning the impact of climate change on agriculture in the Czech Republic have been devoted to cultivated crops e.g., refs. [3,8,9,30], while few studies have been devoted to the livestock sector [20,21,31]. Very few impact models have been developed for mixed crop–livestock systems. Thus, future studies will develop appropriate modeling methods to predict how the crop–livestock production system has changed over time. Our results highlight the need for a considerable expansion of effort in this area.
Regression models demonstrated that climate change can affect livestock production directly through increased heat stress, while GLOBIOM simulations show the impacts of climate change on the quantity and quality of forage and crop-based feeds, as well as land and water availability. Over the past decade in the Czech Republic, the livestock population decreased for most categories. The declines were part of a general European trend. The European Union (EU) has a sizeable livestock population, there were 134 million pigs, 75 million bovine animals, 59 million sheep, and 11 million goats [32]. All the EU members with more than three million pigs reported decreases, with two exceptions: Italy and Sweden [32]. Almost half of the EU’s livestock population in 2020 was cattle, about 30% was pigs, and about 15% was poultry [32]. European livestock products represent 44% of Europe’s total value of agricultural production and more than 60% of the EU agricultural area is used for feeding animals [33]. Despite the decline in dairy cows in recent years, the milk yield continues to increase. According to the statistical survey of the Ministry of Agriculture of the Czech Republic [28], milk production per cow has more than doubled in the last 40 years. The average daily milk yield of all cows in the Czech Republic is around 20.5 L, while for Holstein cows (who produce very high quantities of milk) it is about 26 L. A recent study [31] in the Czech Republic has also revealed that the water demand associated with the livestock sector represents approximately 36.18 to 39.37 million cubic meters (Mm3). Over 80% of this amount is attributed to cattle and nearly 50% is required for dairy cows alone. Another significant amount of 7–12% is required for breeding pigs and around 4% for poultry breeding [34]. A recent study [34] based on the global milk supply demonstrated that 628 L of water is required to produce one liter of cow milk. According to [35], the total water intake for ruminants (drinking water, water contained in feeds, and a small amount of metabolic water produced by nutrient metabolism) is generally between 3.5 and 5.5 L/kg of dry matter intake in temperate countries.
The effect of farm gate prices of animal products on the number of animals kept was also studied. Nevertheless, other factors also play important roles, such as the economic situation, the availability of workers and their willingness to work in agriculture production, and the profitability of that branch of agriculture [36,37,38,39,40,41,42,43,44].
Economic factors include the price and availability of feed [36,37], water fertilizers, fuel [37], technical resources [38], technology and equipment [37], or veterinary services [37], as well as the price of energy (electricity, gas) [39] and interest rates [40] and interest rates [40]. Purchase prices [38] and the ratio of expenditure to income (net profit of the farmer) [41,42] are also important. Social factors include the general shortage of agricultural workers and the general reluctance of the population to work in agriculture [43], which creates demands for at least partial automation of operations, leading to additional costs [44]. The influence of these parameters is hard to study due to their interconnection, and it is impossible to quantify an accurate effect rate for each variable. These facts substantiate the addition of the GLOBIOM model. Subsidies can also play a key role in the number of bred animals; unfortunately, it was not possible to obtain a comprehensive list of approved subsidies. We project the demand for monogastric meat and eggs to increase the most, by 63% between 2000 and 2030, and that ruminant meat and milk demand will increase by 44% and 55%, respectively; these projections outstrip the expected population growth (34%) because of dietary shifts in developing countries [1].
The feedback in subsystems behavior of GLOBIOM (demand, market, crop production, livestock production, land use, and irrigation) showed that business factors may include the subsidy policy of the state and neighboring countries [35,45,46], the attitude of buyers towards farmers [47,48,49], the distortion of supply–consumption chains [50], purchasing power at a given place and time [51] or the purchase of farmland by foreign entities (products are grown/produced in the country but are exported abroad) [22], which could significantly impact animal farmers. Livestock production is likely to be increasingly affected by the legislation of carbon constraints and environmental [52], as well as future regulations related to the Green Deal initiative, which aims to make the European Union carbon neutral by 2050 [53,54].
Since water consumption depends on the number of bred animals, the influence of meteorological factors on the number of animals kept was investigated. Some meteorological factors showed a significant influence on the number of bred animals in some regions. The influence of meteorological factors on the number of bred animals was often significant from a statistical point of view. Our study demonstrated that meteorological factors (Figure 5 and Table 10) affect crop–livestock systems rather than having a significant effect on the number of animals kept, which can potentially be affected by a wide range of factors (Table 11, Table 12 and Tables S1–S9). However, there is no certainty that there is a direct relationship between the trends in meteorological factors and bred animals. In central European conditions, the most critical periods for housing animals are the prolonged touches of frost in winter [55] and hot periods in summer, especially in windless conditions in closed buildings or buildings with a high concentration of animals [56]. In spring and autumn conditions in the Czech Republic, there are generally no problems with the indoor microclimate [57]. In the cold season of the year, it is necessary to save the heat produced by the animals as much as possible, as it is practically the only source of heat in some types of buildings [58]. On the other hand, in the warm season, operating costs are increased due to the higher consumption of feed and water by the animals, as they need more energy to cool their bodies [59]. The South Moravian Region and the Zlín Region lack rainfall [30], which is why these regions are vulnerable in terms of heat stress and water scarcity [30]. The capital Praha is influenced by the urban heat island phenomenon [60], so the occurrence of heat stress can be amplified there. Thermal humidity conditions can contribute to increased water stress on fodder production, which will not meet the optimum demand for the livestock sector.

5. Conclusions

The outputs of the EPIC, RUMINANT, GLOBIOM, and regression models confirmed the hypothesis of this study that in the coming decades, there will be insufficient fodder supply (feed grains) to the livestock sector due to high water stress during the production season, which finally can lead to lower milk, meat, and eggs production. By 2050, demand and competition for water in mixed crop–livestock systems in many regions will see increasing. Our findings suggested a strong concurrence in most regions between the water use of livestock and the water use of feeds. Obviously, this quantity can vary based on the livestock feed sourcing strategies, such as feed from food feed crops (e.g., concentrates; multiple uses of water) or from fully irrigated fodders and pasture from grazing lands. By synthesizing the results, we point out the main conclusions as follows.
(i) By 2050, a gradual substantial decrease in the number of animals is expected for pigs in all regions of the Czech Republic except for the Ústí Region (+56%). The declines were part of a general European trend. Conversely, a substantial increase in the number of sheep, horses, and goats is expected in most regions of the Czech Republic. This is probably related to subsidies for the breeding of these animals;
(ii) A slight increase in the number of animals is expected for cattle in three regions (Zlín Region, South Bohemian Region, and Pilsen Region), and a substantial increase in the number of cattle is expected for three regions (Moravian–Silesian Region, Liberec Region, and Karlovy Vary Region);
(iii) A decrease in the number of animals is expected for most poultry in 10 regions (South Bohemia Region, Vysočina Region, South Moravian Region, Zlín Region, Karlovy Vary Region, Liberec Region, Moravian–Silesian Region, Olomouc Region, Ústí Region, and Zlín Region), but the number of hens should increase in two regions (Central Bohemian Region and Pilsen Region). A substantial increase in the amount of poultry is expected for only three regions (Pardubice, Hradec Králové, and Pilsen);
(iv) Substantially higher livestock water consumption is expected in the Karlovy Vary Region, Liberec Region, and Moravian–Silesian Region. A substantial decrease in the amount of water consumed by livestock is expected in areas vulnerable to water scarcity, such as South Moravia and the Central Bohemian Region. By 2050, a critical situation with an increase in the amount of water consumed will occur in regions as follows:
  • Strongly developed animal production: a significant increase in the amount of water consumed by farm animals and a strong increase in the moisture requirement of fodder (Central Bohemian Region);
  • The most developed animal production: steady state of the amount of water consumed by farm animals and a slight increase in the moisture requirement of fodder (South Bohemian Region and the Vysočina Region);
  • Moderately developed livestock production: steady state of the amount of water consumed by farm animals and a strong increase in the moisture needs of crops with the highest water demands (Královéhradecký, Moravian-Silesian, Olomouc and Pardubice Regions);
  • Less developed animal production: decrease in the amount of water consumed by farm animals and a significant increase in the moisture requirement of fodder (Zlín and South Moravian Regions).
Finally, policies addressing the allocation and efficiency of water use for crop and livestock production will increasingly be needed in the Czech Republic. Through better crop and livestock management, for farm animals (cattle, pigs, sheep, horses, goats, and poultry), it would be useful to identify large opportunities to increase livestock water productivity (protein produced per m3 of water) by increasing both feed water productivity (feed produced per m3 of water) and feed use efficiency (protein produced per kg of feed).

Supplementary Materials

The following supporting information can be downloaded at: https://www.mdpi.com/article/10.3390/agriculture13071291/s1, Table S1: Results of GLOBIOM models for crop/livestock products produced in cultivated areas and rainfed cultivated areas. Average values for the years 2020 and 2050 are presented for mutual comparison, and results of linear models of development of values from 2000 to 2050 are chosen as the minimum and maximum values from all GLOBIOM models for regression coefficient (a) and coefficient of determination (R2), Table S2: Results of GLOBIOM models for land cover types. Average values for the years 2020 and 2050 are presented for mutual comparison, and results of linear models of development of values from 2000 to 2050 are chosen as the minimum and maximum values from all GLOBIOM models for regression coefficient (a) and coefficient of determination (R2). Table S3: Results of GLOBIOM models for crop yields and rainfed crop yields. Average values for the years 2020 and 2050 are presented for mutual comparison, and results of linear models of development of values from 2000 to 2050 are chosen as the minimum and maximum values from all GLOBIOM models for regression coefficient (a) and coefficient of determination (R2), Table S4: Results of GLOBIOM models for crops used as feed for livestock. Average values for the years 2020 and 2050 are presented for mutual comparison, and results of linear models of development of values from 2000 to 2050 are chosen as the minimum and maximum values from all GLOBIOM models for regression coefficient (a) and coefficient of determination (R2), Table S5: Results of GLOBIOM models for ruminant meat and ruminant milk for different production systems. Average values for the years 2020 and 2050 are presented for mutual comparison, and results of linear models of development of values from 2000 to 2050 are chosen as the minimum and maximum values from all GLOBIOM models for regression coefficient (a) and coefficient of determination (R2), Table S6: Results of GLOBIOM models for ruminant meat and ruminant milk for different production systems. Average values for the years 2020 and 2050 are presented for mutual comparison, and results of linear models of development of values from 2000 to 2050 are chosen as the minimum and maximum values from all GLOBIOM models for regression coefficient (a) and coefficient of determination (R2), Table S7: Results of GLOBIOM models for emissions from crop/livestock production. Average values for the years 2020 and 2050 are presented for mutual comparison, and results of linear models of development of values from 2000 to 2050 are chosen as the minimum and maximum values from all GLOBIOM models for regression coefficient (a) and coefficient of determination (R2), Table S8: Results of GLOBIOM models for net trade of the crop/livestock products. Average values for the years 2020 and 2050 are presented for mutual comparison, and results of linear models of development of values from 2000 to 2050 are chosen as the minimum and maximum values from all GLOBIOM models for regression coefficient (a) and coefficient of determination (R2), Table S9: Results of GLOBIOM models for calories and calories target of the crop/livestock products. Average values for the years 2020 and 2050 are presented for mutual comparison, and results of linear models of development of values from 2000 to 2050 are chosen as the minimum and maximum values from all GLOBIOM models for regression coefficient (a) and coefficient of determination (R2).

Author Contributions

Conceptualization: V.P. and M.T.; writing—original draft preparation: V.P.; methodology: V.P.; database and statistical analysis: M.M.; GLOBIOM software for modeling: J.A.G. and P.H.; validation: J.A.G. and E.B.; GIS mapping: T.T.; database: N.M. and M.R.A.C. All authors have read and agreed to the published version of the manuscript.

Funding

This work was supported by research projects: (1) SustES—“Adaptation strategies for sustainable ecosystem services and food security under adverse environmental conditions”. (2) Water systems and water management in the Czech Republic in conditions of climate change. TAČR. SS02030027. (3) HORIZON-CL6-2022-CLIMATE-01-04 (Land, ocean and water for climate action). ECO-READY—GAP-101084201 “Achieving Ecological Resilient Dynamism for the European food system through consumer-driven policies, socio-ecological challenges, biodiversity, data-driven policy, sustainable futures”.

Institutional Review Board Statement

Not applicable.

Data Availability Statement

Additional supporting information may be found online in the Supporting Information section at the end of this article.

Conflicts of Interest

The authors declare no conflict of interest.

References

  1. Havlík, P.; Valin, H.; Herrero, M.; Obersteiner, M.; Schmid, E.; Rufino, M.C.; Mosnier, A.; Thornton, P.K.; Böttcher, H.; Conant, R.T.; et al. Climate change mitigation through livestock system transitions. Proc. Natl. Acad. Sci. USA 2014, 111, 3709–3714. [Google Scholar] [CrossRef] [PubMed] [Green Version]
  2. Vandamme, M.; D’Haese, M.; Speelman, S.; D’Haese, L. The Role of Livestock in Developing Communities: Enhancing Multifunctionality; Swanepoel, F., Stroebel, A., Moyo, S., Eds.; Technical Centre for Agricultural and Rural Cooperation: Wageningen, The Netherlands, 2010; p. 236. [Google Scholar]
  3. Potopová, V.; Trnka, M.; Hamouz, P.; Soukup, J.; Castravet, T. Statistical modelling of drought-related yield losses using soil moisture-vegetation remote sensing and multiscalar indices in the south-eastern Europe. Agric. Water Manag. 2020, 236, 106168. [Google Scholar] [CrossRef]
  4. Herbut, P.; Angrecka, S.; Walczak, J. Environmental parameters to assessing of heat stress in dairy cattle–a review. Int. J. Biometeorol. 2018, 62, 2089–2097. [Google Scholar] [CrossRef] [PubMed] [Green Version]
  5. Mikovits, C.; Zollitsch, W.; Hörtenhuber, S.J.; Baumgartner, J.; Niebuhr, K.; Piringer, M.; Anders, I.; Andre, K.; Hennig-Pauka, I.; Schönhart, M.; et al. Impacts of global warming on confined livestock systems for growing-fattening pigs: Simulation of heat stress for 1981 to 2017 in Central Europe. Int. J. Biometeorol. 2019, 63, 221–230. [Google Scholar] [CrossRef] [PubMed] [Green Version]
  6. Gauly, M.; Ammer. Challenges for dairy cow production systems arising from climate changes. Animals 2020, 14, 196–203. [Google Scholar] [CrossRef] [Green Version]
  7. Broucek, J.; Ryba, S.; Dianova, M.; Uhrincat, M.; Soch, M.; Sistkova, M.; Mala, G.; Novak, P. Effect of evaporative cooling and altitude on dairy cows milk efficiency in lowlands. Int. J. Biometeorol. 2020, 64, 433–444. [Google Scholar] [CrossRef]
  8. Potopová, V.; Lhotka, O.; Možný, M.; Musiolková, M. Vulnerability of hop-yields due to compound drought and heat events over European key-hop regions. Int. J. Climatol. 2021, 41, 2136–2158. [Google Scholar] [CrossRef]
  9. Potopová, V.; Trnka, M.; Vizina, A.; Semerádová, D.; Balek, J.; Chawdhery, M.R.A.; Musiolková, M.; Pavlík, P.; Možný, M.; Štěpánek, P.; et al. Projection of 21st century irrigation water requirements for sensitive agricultural crop commodities across the Czech Republic. Agric. Water Manag. 2022, 262, 107337l. [Google Scholar] [CrossRef]
  10. Calzadilla, A.; Rehdanz, K.; Betts, R.; Falloon, P.; Wiltshire, A.; Tol, R.S.J. Climate change impacts on global agriculture. Clim. Chang. 2013, 120, 357–374. [Google Scholar] [CrossRef]
  11. Chaturvedi, V.; Hejazi, M.; Edmonds, J.; Clarke, L.; Kyle, P.; Davies, E.; Wise, M. Climate mitigation policy implications for global irrigation water demand. Mitig. Adapt. Strateg. Glob. Chang. 2013, 20, 389–407. [Google Scholar] [CrossRef]
  12. Feng, X.; Qiu, H.; Pan, J.; Tang, J. The impact of climate change on livestock production in pastoral areas of China. Sci. Total Environ. 2021, 770, 144838. [Google Scholar] [CrossRef] [PubMed]
  13. Batsuuri, T.; Wang, J. The impacts of climate change on Nomadic livestock husbandry in Mongolia. Clim. Chang. Econ. 2017, 8, 1740003. [Google Scholar] [CrossRef]
  14. Ekotoxa. Comprehensive Study of Impacts, Vulnerabilities and Sources of Risks Related to Climate Change in the Czech Republic; Ministry of the Environment of the Czech Republic: Praha, Czech Republic, 2015. Available online: http://www.mzp.cz/cz/studie_dopadu_zmena_klimatu (accessed on 14 March 2021).
  15. Hempel, S.; Menz, C.; Pinto, S.; Galán, E.; Janke, D.; Estellés, F.; Müschner-Siemens, T.; Wang, X.; Helnicke, J.; Zhang, G.; et al. Heat stress risk in European dairy cattle husbandry under different climate change scenarios–uncertainties and potential impacts. Earth Syst. Dyn. 2019, 10, 859–884. [Google Scholar] [CrossRef] [Green Version]
  16. Idrissou, Y.; Assani, A.S.; Baco, M.N.; Yabi, A.J.; Traoré, I.A. Adaptation strategies of cattle farmers in the dry and sub-humid tropical zones of Benin in the context of climate change. Heliyon 2020, 6, 04373. [Google Scholar] [CrossRef] [PubMed]
  17. Doreau, M.; Corson, M.S.; Wiedemann, S.G. Water use by livestock: A global perspective for a regional issue? Anim. Front. 2012, 2, 9–16. [Google Scholar] [CrossRef] [Green Version]
  18. Ripple, W.J.; Smith, P.; Haberl, H.; Montzka, S.A.; McAlpine, C.; Boucher, D.H. Ruminants, climate change and climate policy. Nat. Clim. Chang. 2014, 4, 2–5. [Google Scholar] [CrossRef]
  19. Heinke, J.; Lannerstad, M.; Gerten, D.; Havlík, P.; Herrero, M.; Notenbaert, A.M.O.; Hoff, H.; Müller, C. Water use in global livestock production—Opportunities and constraints for increasing water productivity. Water Resour. Res. 2020, 56, e2019WR026995. [Google Scholar] [CrossRef]
  20. Ansorge, L.; Dlabal. Estimation of water withdrawals in the Czech Republic. Vodohospodářské Tech. Ekon. Inf. 2017, 59, 17–22. [Google Scholar] [CrossRef]
  21. Beran, A.; Hanel, M. Identification of regions vulnerable to deficits in water resources in the Czech Republic. Vodohospodářské Tech. Ekon. Inf. 2015, 57, 23–26. [Google Scholar] [CrossRef]
  22. Fairbairn, M. Foreignization, financialization and land grab regulation. J. Agrar. Change 2015, 15, 581–591. [Google Scholar] [CrossRef]
  23. Ma, X.; Ma, Y. The spatiotemporal variation analysis of virtual water for agriculture and livestock husbandry: A study for Jilin Province in China. Sci. Total Environ. 2017, 586, 1150–1161. [Google Scholar] [CrossRef] [PubMed]
  24. Hong, Y.; Ying, S. Characteristics of extreme temperature and precipitation in China in 2017 based on ETCCDI indices. Adv. Clim. Chang. Res. 2018, 9, 218–226. [Google Scholar]
  25. Kavka, M. Standards for Agricultural and Food Production: Technological, Technical and Economic Normative Indicators; Institute of Agricultural and Food Information: Prague, Czech Republic, 2006; ISBN 80-7271-163-6. [Google Scholar]
  26. Ministry of Agriculture of the Czech Republic. Situation and Outlook Report Poultry and Eggs; Ministry of Agriculture of the Czech Republic: Prague, Czech Republic, 2018; ISBN 978-80-7434-506-7. Available online: http://eagri.cz/public/web/file/624527/Drubez_2018_Web.pdf. (accessed on 13 January 2021).
  27. Habeeb, A.A.; Gad, A.E.; Atta, M.A. Temperature-humidity indices as indicators to heat stress of climatic conditions with relation to production and reproduction of farm animals. Int. J. Biotechnol. Recent Adv. 2018, 1, 35–50. [Google Scholar] [CrossRef] [Green Version]
  28. Czech Statistical Office (CSO). Agricultural Producer Price Indices, Average Prices of Agricultural Products. 2022. Available online: https://vdb.czso.cz/vdbvo2/faces/cs/index.jsf?page=statistiky#katalog=31785 (accessed on 24 May 2022).
  29. Ministry of Agriculture of the Czech Republic. Register of Subsidy Recipients. 2022. Available online: https://eagri.cz/public/app/SZR/SubsidyReports/Report/GrantByProgram (accessed on 24 May 2022).
  30. Brázdil, R.; Trnka, M.; Mikšovský, J.; Řezníčková, L.; Dobrovolný, P. Spring-summer droughts in the Czech Land in 1805–2012 and their forcings. Int. J. Climatol. 2014, 35, 1405–1421. [Google Scholar] [CrossRef]
  31. Ansorge, L.; Dlabal, J.; Dostálová, A. How truthful are water accounting data? J. Urban Environ. Eng. 2016, 10, 25–34. [Google Scholar] [CrossRef]
  32. Eurostat. Agricultural Production—Livestock and Meat 2022. Available online: https://ec.europa.eu/eurostat/web/products-eurostat-news/w/ddn-202303221#:~:text=The%20EU%20has%20a%20sizeable,population%2C%20published%20today%20by%20Eurostat (accessed on 17 June 2023).
  33. FAOSTAT. Land Use Indicators 2018. Available online: https://www.fao.org/faostat/en/#data/RL (accessed on 16 June 2023).
  34. Poore, J.; Nemecek, T. Reducing food’s environmental impacts through producers and consumers. Science 2018, 360, 987–992. [Google Scholar] [CrossRef] [Green Version]
  35. Ding, W.; Jimoh, S.O.; Hou, X.; Shu, X.; Dong, H.; Bolormaa, D.; Wang, D. Grassland ecological subsidy policy and livestock reduction behavior: A case study of herdsmen in northern China. Rangel. Ecol. Manag. 2022, 81, 78–85. [Google Scholar] [CrossRef]
  36. Duguma, B.; Tegegn, A.; Hegde, B. Smallholder livestock production system in Dandi district, Oromia Regional State, central Ethiopia. Read Write 2012, 20, 25–26. [Google Scholar]
  37. Ogunkoya, F.T. Socio-Economic Factors That Affect Livestock Numbers: A Case Study of Smallholder Cattle and Sheep Farmers in the Free State Province of South Africa. Ph.D. Thesis, University of South Africa, Pretoria, South Africa, 2014. [Google Scholar]
  38. Bondin, I. Effect of availability of technical resources on effectiveness of agricultural production. Mezhdunarodnyĭ Sel’skokhozyaĭstvennyĭ Zhurnal 2014, 1/2, 39–41. [Google Scholar]
  39. Miranowski, J.A. Effects of energy price rises, energy constraints, and energy minimization on crop and livestock production activities. North Cent. J. Agric. Econ. 1979, 105, 5–14. Available online: https://core.ac.uk/download/pdf/38917615.pdf (accessed on 16 June 2023). [CrossRef] [Green Version]
  40. Smith, C. The effect of inflation and form of investment on the estimated value of genetic improvement in farm livestock. Anim. Sci. 1978, 26, 101–110. [Google Scholar] [CrossRef] [Green Version]
  41. Azadi, H.; Hosseininia, G.; Zarafshani, K.; Heydari, A.; Witlox, F. Factors influencing the success of animal husbandry cooperatives: A case study in Southwest Iran. J. Agric. Rural. Dev. Trop. Subtrop. 2010, 111, 89–99. [Google Scholar]
  42. Deressa, T.T.; Ringler, C.; Hassan, R.M. Factors Affecting the Choices of Coping Strategies for Climate Extremes. The Case of Farmers in the Nile Basin of Ethiopia IFPRI Discussion Paper 2010, 1032. Available online: https://ideas.repec.org/p/fpr/ifprid/1032.html (accessed on 16 June 2023).
  43. Herrero, M.; Grace, D.; Njuki, J.; Johnson, N.; Enahoro, D.; Silvestri, S.; Rufino, M.C. The roles of livestock in developing countries. Animals 2013, 7, 3–18. [Google Scholar] [CrossRef] [PubMed] [Green Version]
  44. Skvortsov, E.; Bykova, O.; Mymrin, V.; Skvortsova, E.; Neverova, O.; Nabokov, V.; Kosilov, V. Determination of the applicability of robotics in animal husbandry. Turk. Online J. Des. Art Commun. 2018, 8, 291–299. [Google Scholar] [CrossRef] [PubMed]
  45. Hu, Y.; Huang, J.; Hou, L. Impacts of the grassland ecological compensation policy on household livestock production in China: An empirical study in Inner Mongolia. Ecol. Econ. 2019, 161, 248–256. [Google Scholar] [CrossRef]
  46. Stehfest, E.; van den Berg, M.; Woltjer, G.; Msangi, S.; Westhoek, H. Options to reduce the environmental effects of livestock production–comparison of two economic models. Agric. Syst. 2013, 114, 38–53. [Google Scholar] [CrossRef]
  47. Trobe, H.L. Farmers’ markets: Consuming local rural produce. Int. J. Consum. Stud. 2001, 25, 181–192. [Google Scholar] [CrossRef]
  48. Sepúlveda, W.; Maza, M.T.; Mantecón, A.R. Factors that affect and motivate the purchase of quality-labelled beef in Spain. Meat Sci. 2008, 80, 1282–1289. [Google Scholar] [CrossRef] [Green Version]
  49. Jia, X.; Huang, J. Contractual arrangements between farmer cooperatives and buyers in China. Food Policy 2011, 36, 656–666. [Google Scholar] [CrossRef]
  50. Hashem, N.M.; González-Bulnes, A.; Rodriguez-Morales, A.J. Animal welfare and livestock supply chain sustainability under the COVID-19 outbreak: An overview. Front. Vet. Sci. 2020, 7, 582528. [Google Scholar] [CrossRef]
  51. Janssen, M.; Roediger, M.; Hamm, U. Labels for animal husbandry systems meet consumer preferences: Results from a meta-analysis of consumer studies. J. Agric. Environ. Ethics 2016, 29, 1071–1100. [Google Scholar] [CrossRef]
  52. Thornton, P.K. Livestock production: Recent trends, future prospects. Philos. Trans. R. Soc. B Biol. Sci. 2010, 365, 2853–2867. [Google Scholar] [CrossRef] [PubMed] [Green Version]
  53. Gargano, G.; Licciardo, F.; Verrascina, M.; Zanetti, B. The agroecological approach as a model for multifunctional agriculture and farming towards the European Green Deal 2030–some evidence from the Italian experience. Sustainability 2021, 13, 2215. [Google Scholar] [CrossRef]
  54. Vincenza Chiriacò, M.; Valentini, R. A land-based approach for climate change mitigation in the livestock sector. In Proceedings of the EGU General Assembly Conference Abstracts, virtually, 19–30 April 2021; p. EGU21-7959. [Google Scholar]
  55. Angrecka, S.; Herbut, P. Conditions for cold stress development in dairy cattle kept in free stall barn during severe frosts. Czech J. Anim. Sci. 2015, 60, 81–87. [Google Scholar] [CrossRef] [Green Version]
  56. Das, R.; Sailo, L.; Verma, N.; Bharti, P.; Saikia, J.; Kumar, R. Impact of heat stress on health and performance of dairy animals: A review. Vet. World 2016, 9, 260–268. [Google Scholar] [CrossRef] [PubMed] [Green Version]
  57. Budzinska, K.; Szejniuk, B.; Jurek, A.; Michalska, M.; Traczykowski, A.; Berlec, K. Evaluation of selected physical and microbiological parameters of air in a box-stall stable. Acta Scientiarum Polonorum. Zootechnica 2016, 15, 3–18. [Google Scholar]
  58. Herbut, P. Temperature, humidity and air movement variations inside a free-stall barn during heavy frost. Ann. Anim. Sci. 2013, 13, 587–596. [Google Scholar] [CrossRef] [Green Version]
  59. Renaudeau, D.; Collin, A.; Yahav, S.; De Basilio, V.; Gourdine, J.L.; Collier, R.J. Adaptation to hot climate and strategies to alleviate heat stress in livestock production. Animals 2012, 6, 707–728. [Google Scholar] [CrossRef] [Green Version]
  60. Brázdil, R.; Buďíková, M. An urban bias in air temperature fluctuations at the Klementinum, Prague, The Czech Republic. Atmos. Environ. 1999, 33, 4211–4217. [Google Scholar] [CrossRef]
Figure 1. GLOBIOM-CZ overview of spatial and temporal scales.
Agriculture 13 01291 g001
Figure 2. Determination of animal production level in each region of the Czech Republic. Regions are classified according to water consumption.
Agriculture 13 01291 g002
Figure 3. Percentage change in the number of livestock individuals (cattle, pigs, sheep + horses + goats, poultry) in individual regions in 2050 compared to that in 2005.
Agriculture 13 01291 g003
Figure 4. Percentage change in the amount of water consumed by livestock per year in individual regions of the Czech Republic in 2050 compared to 2005.
Agriculture 13 01291 g004
Figure 5. The average percentage of the temperature-humidity index (THI) in 4 categories (<68, 68–72, 72–75, 75–79) over 5 months for each region. The blue scale describes a measure of the percentage of THI in the 68–72 category in comparison with the other regions. The red scale describes a measure of the percentage of THI in the 72–75 category in comparison with the other regions. The regions with the warmest climate are written in bold.
Agriculture 13 01291 g005
Figure 6. (ae) Development of the number of animals (cattle, hens, and pigs) with the purchase prices of commodities (milk, eggs, and pigs) at the country level.
Agriculture 13 01291 g006
Figure 7. Development of the number of cattle and subsidies to animal production in the South Bohemian Region.
Agriculture 13 01291 g007
Table 1. Average annual temperature, average number of summer days, tropical days, days with a tropical night, icing days, and frost days for each region in the Czech Republic. The red color highlights the highest numbers, and the orange color highlights the high numbers for annual temperature, summer days, tropical days, and days with a tropical night. The blue color highlights the highest numbers, and the green color highlights the high numbers for icing days and frost days.
RegionAverage Annual Temperature (°C)Average Number of Summer DaysAverage Number of Tropical DaysAverage Number of Days with a Tropical NightAverage Number of Icing DaysAverage Number of Frost Days
1. South Bohemian Region7.447.910.90.0141.023.9
2. South Moravian Region10.679.427.22.883.920.9
3. Karlovy Vary Region6.729.34.40.0128.841.4
4. Vysočina Region8.539.46.90.1100.833.6
5. Hradec Králové Region8.245.39.00.1111.234.6
6. Liberec Region8.946.48.91.294.428.2
7. Moravian-Silesian Region8.744.48.40.7106.531.0
8. Olomouc Region8.553.711.20.0111.728.9
9. Pardubice Region8.849.210.90.5102.430.9
10. Pilsen Region7.742.98.20.0125.131.0
11. Central Bohemian Region9.467.321.60.299.919.4
12. Ústí Region9.243.88.51.984.629.6
13. Zlín Region9.157.113.10.496.629.2
Table 2. List of farm animal species (according to CSO tables).
Name in Table Total Number of Animals at the Country Level (2002 Up to 1 April 2022)Definition
Cattle1,421,254Farm animals of the species Bos taurus (without cows)
Cows587,859Cattle females that have already calved
Pigs1,432,824Farm animals of the subspecies Sus scrofa domestica (without sows)
Sows80,756Pigs’ females that have already farrowed
Sheep174,196Farm animals of the species Ovis aries
Goats24,607Farm animals of the subspecies Capra aegagrus hircus
Horses37,087Farm animals of the species Equus caballus
Poultry23,026,197Farm birds of the species Gallus gallus, Meleagris spp., Anas spp., Cairina moschata, and the subspecies Anser anser domesticus
Hens7,624,998Chicken females of the meat type as well as the laying type that have reached laying maturity
Table 3. Water consumption of individual species of farm animals (according to the standards).
CattleCowsPigsSowsSheep + GoatsHorsesHens (ths. pcs)Broilers (ths. pcs)Ducks + Geese (ths. pcs)Turkeys (ths. pcs)
Average water consumption per individual (L/day)spring49.00126.254.7514.673.0038.75230110500550
summer60.00170.006.0017.334.2547.50280120450575
autumn49.00126.254.7514.673.0038.75230110500550
winter38.0082.503.5012.001.7530.00180100550600
Average water consumption per individual (L/period)spring455711,7414421364279360421,39010,23046,50051,150
summer558015,8105581612395441826,04011,16041,85053,475
autumn441011,3634281320270348820,700990045,00049,500
winter338273433121068156267016,020890048,95053,400
Average water consumption per individual (L/year)17,92946,25617395364110014,17984,15040,190182,300207,525
Average water consumption per individual (m3/year)17.9346.261.745.361.1014.1884.1540.19182.30207.53
Maximum water consumption per individual (m3/year)21.9062.052.196.331.5517.34102.2043.8020.75219.00
Table 4. Percentage of individual species of poultry in the 2010–2018 period.
BroilersHensDucks + GeeseTurkeys
201071,76925,02616951514
201167,95328,88014451718
201271,29725,88112761547
201365,72131,13312551891
201464,76031,47619151845
201567,46927,97727061848
201667,11628,69524301755
201763,97631,80426431582
201861,25233,89533981459
Average66,81229,41820851684
Table 5. Climate scenarios used by GLOBIOM models.
EURO-CORDEX with EPIC
RCMRCP 2.6RCP 4.5RCP 8.5
IPSL-WRF33-CM5A x
RCA4-EC-EARTHxxx
REMO2009-MPI-ESM-LRxxx
RCA4-HadGEM2-ES xx
RACMO22E-EC-EARTH xx
Note: this mark x means that the model was used.
Table 6. List of abbreviations, meanings, and units of GLOBIOM indicators.
GLOBIOM Indicators
POPTTotal Population [Mln pers]POPT
FUELTotal fuel consumption[PJ]FUEL
AREAArea cultivated [1000 ha]AREA
ARRFArea cultivated—rainfed[1000 ha]ARRF
ARIRArea cultivated—irrigated [1000 ha]ARIR
LANDLand cover [Mha]LAND
YILDCrop yield [t/ha]YILD
YIRFCrop yield—rainfed [t/ha]YIRF
YIIRCrop yield—irrigated[t/ha]YIIR
FEEDFeed use [1000 t]FEED
ANIMAnimal number [1000 TLU]ANIM
RUMDRuminant bovine number [1000 TLU]RUMD
NRMNNon ruminant number [1000 TLU]NRMN
YRMMRuminant meat [1000 t]YRMM
YDRYRuminant milk[1000 t]YDRY
FRUMFeed use other ruminant [1000 t]FRUM
FDRYFeed use dairy [1000 t]FDRY
FNRMFeed use monogastrics [1000 t]FNRM
BIOUBiofuel use [1000 t]BIOU
WATRWater for irrigation [km3]WATR
CALOp.c. calory availability [kcal/cap/d]CALO
CALTp.c. calory diet target [kcal/cap/d]CALT
EMISEmissions from agriculture[MtCO2 eq]EMIS
PRODProduction [1000 t, PJ]PROD
NTMSNet trade share in market volume[%]NTMS
QVSTProduction volume—fixed prices [Mio USD]QVST
VADSValue-added due to exogenous yield change—fixed prices and area [Mn USD]VADS
CVOLConsumption value—fixed prices [Mn USD]CVOL
WELFProducer and consumer surplus [Bn USD]WELF
Table 7. List of abbreviations, meanings, and units of GLOBIOM indicators for livestock, crops and land cover type.
Livestock
GLOBIOMProduct
BVMEATBovine meat
SGMEATSheep and goat meat
PGMEATPig meat
PTMEATPoultry meat
PTEGGSPoultry eegs
ALMILKAll milk
Species
PIGSPigs all
BOVDBovines dairy
BOVOBovines Other
BOVFBovines dairy Followers
SGTOSheep and goat other
SGTDSheep and goat dairy
SGTFSheep and goat dairy followers
PTRBPoultry broilers
PTRHPoultry laying hens
PTRXPoultry mixed
Crops
BarlBarley
CornMaize
WheatWheat
OatsOats
RyeRye
CsilCorn Silage
RapORapeseed oil
Landcover
Land Cover type
CrpLndCropland
GrsLndGrassland
NatLndOther natural land
Table 8. The number of individuals and average water consumption (m3/year) for groups of animals per region. SGH is an abbreviation for sheep, goats, and horses. Percentages (%) were calculated as an increase/decrease in the number of individuals or the average water consumption from 2005 to 2050. For example, a value of +5% means that the number of animals is expected to increase by 5% in 2050 compared to 2005.
Livestock CategoriesNumber of IndividualsAverage Water Consumption m3/Year
2005202020352050%2005202020352050%
South Bohemian Region
Cattle211,413219,914221,264222,448+56,294,9776,518,4376,585,2136,649,032+2
Pigs348,20985,09100−100709,413172,38300−100
SGH25,86136,72151,97266,772+15866,349105,865148,887189,112+79
Poultry (ths.)4647186900−100243,93699,81700−100
Total-----7,314,6776,896,5026,734,1006,838,144−1
South Moravia Region
Cattle75,51164,37457,34850,188−342,195,5811,900,1601,909,4001,912,454−13
Pigs433,761126,59400−100888,974241,95000−100
SGH584212,84519,73126,788+35924,10936,62546,74758,072+141
Poultry (ths.)4303403722511189−72220,335214,769131,94486,009−61
Total-----3,328,9992,393,5042,088,0912,056,536−38
Karlovy Vary Region
Cattle34,68943,02156,24269,167+991,054,9211,343,1661,790,1202,199,331+108
Pigs42,34916,43500−10085,90228,72500−100
SGH15,98715,37318,67121,704+3632,53534,38442,29848,239+48
Poultry (ths.)249249179202−1916,12318,43915,09617,027+6
Total-----1,189,4811,424,7131,847,5142,264,597+90
Vysočina Region
Cattle218,625218,641217,181216,175−16,366,1826,402,9836,421,9846,461,977+2
Pigs391,482319,055158,10763,395−84790,335620,526274,909110,227−86
SGH934418,31233,20944,828+38019,65644,86277,835107,202+445
Poultry (ths.)123139100−10061,86620,30900−100
Total-----7,238,0397,088,6806,774,7286,679,407−8
Hradec Králové Region
Cattle109,527101,23390,67680,119−273,236,9342,990,9272,690,5932,390,258−26
Pigs209,73756,48900−100424,888110,02000−100
SGH11,38020,99131,57042,137+27031,95360,66587,347113,942+257
Poultry (ths.)1520274935544572+20195,048185,492269,748362,159+281
Total-----3,788,8243,347,1053,047,6882,866,359−24
Liberec Region
Cattle38,05148,72955,13461,289+611,187,3201,456,7221,567,5751,669,691+41
Pigs43,16619,0054260−10086,05037,88522830−100
SGH10,11719,63734,39049,144+38629,42655,42296,778138,138+369
Poultry (ths.)112754925−776272358922301164−81
Total-----1,309,0671,553,6181,668,8661,808,994+38
Moravian–Silesian Region
Cattle80,66186,747107,606127,994+592,464,8192,664,9503,093,3123,511,096+43
Pigs149,14237,90500−100303,01973,91900−100
SGH14,23321,12630,08938,949+17439,98359,45482,495104,580+162
Poultry (ths.)16459451590−10096,38460,67213,3820−100
Total-----2,904,2052,858,9953,189,1893,615,676+25
Table 9. The number of individuals and average water consumption (m3/year) for groups of animals per region. SGH is an abbreviation for sheep, goats, and horses. Percentages (%) were calculated as an increase/decrease in the number of individuals or the average water consumption from 2005 to 2050. For example, a value of −20% means that the number of animals is expected to decrease by 20% in 2050 compared to 2005.
Livestock CategoriesNumber of IndividualsAverage Water Consumption m3/Year
2005202020352050%2005202020352050%
Olomouc Region
Cattle96,85193,14985,03277,477−202,860,4392,786,0492,585,6762,411,287−16
Pigs215,18568,37000−100435,891134,48900−100
SGH724312,16918,22824,232+23422,83837,64753,53268,662+201
Poultry (ths.)61342517656−9136,31724,41281062567−93
Total-----3,355,4842,982,5962,647,3132,482,516−26
Pardubice Region
Cattle121,379113,308105,29997,289−203,574,5793,310,8993,044,6932,778,487−22
Pigs193,783163,130145,235130,498−33391,870318,677264,300226,904−42
SGH10,74115,41722,19229,029+17034,70352,27168,54585,715+147
Poultry (ths.)1560424062338018+41494,885263,251366,548460,276+385
Total-----4,096,0373,945,0983,744,0863,551,382−13
Pilsen Region
Cattle155,285161,706164,925168,042+84,566,0304,856,7815,077,7155,296,814+16
Pigs212,974112,18932000−100433,511218,69417,1650−100
SGH16,98520,33514,3897585−5536,81155,53663,44569,851+90
Poultry (ths.)1869283729893374+8196,683177,010192,358228,571+136
Total-----5,133,0355,308,0225,350,6835,595,237+9
City of Prague + Central Bohemia Region
Cattle154,934148,749133,779117,284−244,479,4864,364,0633,978,8623,523,076−21
Pigs415,646315,113155,11813,142−97843,429613,222269,71222,850−97
SGH15,78036,06260,52485,069+43954,096153,035245,156338,955+527
Poultry (ths.)4907526453595475+12269,672313,540339,718366,047+36
Total-----5,646,6835,443,8604,833,4474,250,928−25
Ústí Region
Cattle39,65241,48440,00638,340−31,176,5071,241,4201,227,5771,210,375+3
Pigs116,604108,400145,812182,292+56236,946212,951260,230316,960+34
SGH13,03317,34728,85037,470+18827,46749,96183,890111,244+305
Poultry (ths.)153148900−10094,65322,93100−100
Total-----1,535,5741,527,2631,571,6971,638,580+7
Zlín Region
Cattle60,73063,06264,21565,434+81,846,5821,934,7081,956,9302,003,772+9
Pigs104,79671,53128,0530−100214,733141,44948,7770−100
SGH16,83524,28335,96347,728+18439,70650,08366,53483,078+109
Poultry (ths.)118467700−10061,03635,05500−100
Total-----2,162,0572,161,2952,072,2412,086,850−3
Table 10. Output results of the fitting of regression models to describe the relationship between the detrended number of bred animals and meteorological factors. Pink is a significant negative impact, green has a significant positive impact and an insignificant correlation is noted with white.
CattleCowsPigsSowsSheepGoatsHorsesHensBroilersDucks + GeeseTurkeys
Average Minimal Temperaturer0.160.11−0.68 −0.660.720.640.74−0.53−0.69−0.66−0.67
R210.119.0257.8256.3560.2341.2954.8128.3044.5144.5745.31
Average Maximal Temperaturer0.340.45−0.48−0.420.440.360.46−0.63−0.51−0.51−0.52
R211.6120.3122.6718.4020.0312.6221.4540.2525.8025.5626.07
Diurnal Temperature Ranger0.25 0.460.210.25 0.21 0.25−0.30 −0.32−0.30 −0.17 0.16
R2 9.0120.33 4.58 6.174.58 6.16 8.86 10.53 10.00 4.002.25
Average Relative Air Humidityr−0.56−0.84*0.04−0.110.100.040.050.420.040.060.05
R231.5270.250.181.001.201.001.0017.380.100.010.01
Annual Sum of New Snowr−0.45−0.220.410.38−0.37−0.35−0.490.420.460.460.48
R219.855.1116.1314.5013.4312.0623.6417.0621.0321.1221.81
Annual Sum of Precipitationr0.10−0.050.380.420.380.41−0.37−0.360.360.350.35
R21.120.2415.0017.1514.2417.0014.0013.1512.7012.49 12.37
Sum of Effective Temperaturesr0.260.36−0.68−0.610.620.580.63−0.69−0.65−0.64−0.65
R27.0113.0043.2036.8038.6933.5739.7447.6141.7141.1041.84
Number of Icing Daysr−0.18−0.330.430.41−0.44−0.32−0.440.510.420.430.43
R24.0010.6718.9316.3619.5310.5119.5326.0818.3018.4118.56
Number of Summer Daysr0.45 0.46−0.24−0.210.190.210.25−0.54−0.36−0.35−0.35
R220.27 21.115.804.233.474.625.8028.6212.5412.0912.38
Number of Tropical Daysr0.270.20−0.13−0.140.120.170.17−0.28−0.14−0.16−0.14
R28.124.452.502.601.452.773.208.072.023.102.02
Number of Frost Daysr0.11 0.100.520.50−0.58−0.48−0.520.310.450.460.47
R21.001.0026.5825.1140.0023.2926.9420.021.1421.2721.41
Number of Tropical Nightsr00000000000
R200000000000
Average THIr0.340.42−0.63−0.570.610.530.63−0.68−0.62−0.63−0.65
R211.4917.0139.4233.1636.7828.3140.8046.5439.1339.1639.59
Number of Days with THI 68–72r−0.03−0.01−0.44−0.460.490.570.47−0.42−0.38−0.38−0.37
R20.100.0120.1120.9324.0032.4021.7917.6114.0914.0714.00
Number of Days with THI 72–75r0.29−0.040.210.22−0.29−0.25−0.100.200.030.030.03
R28.460.134.604.828.896.069.1210.110.010.010.01
Number of Days with THI 75–79r00000000000
R200000000000
Number of Days with Precipitation < 0.1 mmr−0.36−0.450.320.33−0.44−0.39−0.290.370.380.380.39
R225.6131.0010.0411.0829.9120.0615.0113.8314.5414.5415.5
* The highest negative correlation.
Table 11. Results of GLOBIOM models for the production of individual crop/livestock products. Average values for 2020 and 2050 are presented for mutual comparison, and the results of linear models of the development of values from 2000 to 2050 were chosen as the minimum and maximum values from all GLOBIOM models for the regression coefficient (a) and coefficient of determination (R2).
ProductionUnitValues for Individual YearsRegression Characteristics
20202050a (min)a (max)R2 (min)R2 (max)
Milk (all)1000 t2200.331627.10−23.82−17.350.91590.9915
Barley1000 t2268.801322.85−20.12−7.630.35530.8388
Bovine meat1000 t100.3898.20−0.65−0.400.43830.8570
Corn1000 t314.77194.32−5.40−2.720.29420.5678
Corn Silage1000 t3841.073423.85−73.55−29.870.78880.9533
Oats1000 t218.31312.822.672.850.98210.9899
Pig meat1000 t345.71201.53−6.140.9910
Poultry eggs1000 t143.80119.93−1.75−1.710.95600.9716
Poultry meat1000 t150.3097.97−2.240.9908
Rapeseed oil1000 t445.41221.28−0.170.160.00000.0012
Rye1000 t109.05229.302.890.9822
Sheep and goat meat1000 t2.762.78−0.020.010.01250.8606
Wheat1000 t4940.423322.49−16.394.900.02860.1938
Table 12. Results of GLOBIOM models for the animal number, ruminant bovine number, and nonruminant number in different production systems. Average values for 2020 and 2050 are presented for mutual comparison, and the results of linear models of the development of values from 2000 to 2050 were chosen as the minimum and maximum values from all GLOBIOM models for the regression coefficient (a) and coefficient of determination (R2).
Animal NumberUnitValues for Individual YearsRegression Characteristics
20202050a (min)a (max)R2 (min)R2 (max)
LGT Livestock only systems Temperate1000 TLU52.26278.164.476.890.85990.9573
MRT Mixed rainfed Temperate1000 TLU285.60148.61−7.17−6.170.91420.9654
Other areas1000 TLU543.72544.880.000.010.00010.0449
Urban areas1000 TLU800.36502.46−12.00−11.980.98400.9846
Ruminant bovine number
LGT Livestock only systems Temperate1000 TLU0.050.020.000.000.93960.9616
MRT Mixed rainfed Temperate1000 TLU90.9147.61−2.18−1.710.87270.9722
Other areas1000 TLU123.13123.390.000.000.00440.0494
Urban areas1000 TLU41.5041.600.000.000.00890.0544
Non-ruminant number
Other areas1000 TLU162.06162.062.2 ×10−312.2 ×10−311.001.00
Urban areas1000 TLU671.61373.27−12.00−11.980.98420.9848
Disclaimer/Publisher’s Note: The statements, opinions and data contained in all publications are solely those of the individual author(s) and contributor(s) and not of MDPI and/or the editor(s). MDPI and/or the editor(s) disclaim responsibility for any injury to people or property resulting from any ideas, methods, instructions or products referred to in the content.

