1. Introduction
The efficiency of gearboxes is affected by several factors resulting from the design of the individual components of the power transmission assembly, the current operating parameters, and several factors given by the overall operating conditions of the gearbox and its installation. Many authors deal with the estimates calculation and predictions of the effects associated with losses in the transmission system. In the article [
1], Xu, Kahraman, Anderson, and Maddock discuss a gear load distribution model and a friction model, and they define mechanical efficiency based on typical operating conditions. Their work builds on other authors (Yada [
2], Li and Seireg [
3]) who have addressed this topic before and are developing the issue of friction between gears in relation to the efficiency of gearboxes.
In general, when examining the efficiency of gearboxes, the authors focus largely on the analysis of gear engagement and the effect of lubricant on the resulting efficiency, e.g., Taylor et al. [
4]. Other authors are Petry-Johnson et al. [
5], who supported their research by experimentally measuring the efficiency of gearboxes in relation to the influence of tooth side roughness, different modules, and different possibilities of gear lubrication conditions. The authors Yenti, Phongsupasamit, and Ratanasumawong approach the issue of losses and efficiency of gearboxes on a similar principle, examining analytically and experimentally the effect of pressure angle and gear modulus on sliding losses [
6]. The authors Seetharaman and Kahraman have developed a mathematical model based on the theory of fluid mechanics, which again deals with the effect of lubricant on transmission losses and efficiency, but it should be noted that this model includes losses due to lubricant compression between teeth of pinion and gear as well as losses related to the centrifugal effect that occurs during gear wading in the lubricant [
7].
Therefore, the calculation estimates can quite reliably capture the factors given by the design solution and operating parameters, as proven by mentioned publications. Other factors show variability to such an extent that it is very difficult and often impossible to estimate their influence responsibly. Therefore, it is important to determine the efficiency of gearboxes in their operational installation in a wide range of operating conditions. This is also identified by Stockman and Dereyne et al. Following the finding of a lack of clearly defined test procedures for determining the efficiency of gearboxes [
8].
The information obtained from a wide range of operating conditions is subsequently beneficial for both the user and the manufacturer. In addition to the mentioned losses in the lubricant, the efficiency is also mainly affected by losses caused by shaft torsional vibrations, repeated deformation of other transmission components during power transmission, losses in bearings and shaft seals, and ventilation losses. These aspects are mentioned in these publications; however, they individually developed findings, not a comprehensive view of the complex issues of transmission efficiency and losses (Nelias [
9], Egorov et al. [
10] and Michaelis et al. [
11]).
Some of these effects can often be relatively effectively suppressed by a suitable technical solution, e.g., labyrinth packing instead of shaft seals. Others are difficult to remove, because they are properties of basic components that cannot in principle be replaced or omitted, such as bearings or gears. As already mentioned, the influence of the current operating parameters also contributes to the efficiency, which means mainly revolutions and torques, i.e., the actual transmitted power. The torque causes the deformation of the individual components of the gearbox and thus essentially defines the quality of cooperation of the co-engaging teeth on the gears and the conditions for rolling the elements in the bearings. From this point of view, revolutions define the speed of load repetition on the mentioned components. It is therefore quite expected that the efficiency of the transmission will be strongly dependent on these parameters.
The overall operating parameters and installation of the gearbox bring additional effects generated by surroundings of the gearbox. A significant influence resulting from the installation of the gearbox is, e.g., the additional bending load of the input and output shafts. The ambition of experimental determination of gearbox efficiency is not to identify the above-mentioned phenomena. The purpose is to identify their overall impact. The authors Derammelaere et al. approach the issue in a similar way [
12]. Nevertheless, awareness of individual phenomena that affect efficiency is important in the processing of recorded data.
The current state of the art of experimental efficiency determination shows that, in most cases, gearboxes in the automotive industry are being tested. An example of such research is an article [
13] by the authors Irimescu, Mihon, and Padure, where a measurement methodology using a chassis dynamometer is developed. Other examples of work where attention is focused on automotive transmissions include Ref. [
14] by Schaffner et al. and [
11] Michaelis et al. In the other cases already mentioned, it is mainly a simulation activity, which, rather than an experiment, develops theoretical and model examples of the operating conditions of transmission systems. In principle, this is a very simple problem when the efficiency of gearboxes is being experimentally determined in wide range of operating conditions: to detect the torque on the input and output shafts as accurately as possible. That is the requirement for the highest possible detection accuracy that makes this simple task a comprehensive task. Commonly used calibrated sensors, dynamometers, and torque sensors can negatively affect the parameters of the measured system and for many gearboxes they are unsuitable in the current assembly due to their technical solution. For this reason, the direct application of strain gauges is an interesting and competitive alternative; however, it requires virtual calibration using FEM analysis.
The important part of documentation for gearboxes is their efficiency map, showing the efficiency of the gearbox, which most often depends on the revolutions and torque of the input shaft in the set operating conditions. Operating conditions are defined by other variables, e.g., operating temperature. The determination of the efficiency map is indicated in the contribution [
12].
It is obvious that the efficiency of the vast majority of gearboxes shows nonlinearity due to the generally non-linear disposition of the resistance effects in the bearings and the deformation effect of the applied load on the individual components of the gearbox. With knowledge of the efficiency map, it is possible to ensure optimal conditions for its starting and coast down during shutdowns. The compilation of a complete efficiency map for the set operating conditions is practically only possible in a laboratory in which both loads and revolutions are under standardized conditions.
However, even laboratory measurements can hide pitfalls that need to be addressed. In principle, assemblies with closed and open force flow can be created in a laboratory. Assemblies with closed force flow are created by combining mechanical gearboxes with the same parameters. The load is created by torsional preload of the gearbox shafts and the power of the drive motor thus only serves to compensate losses in the gearboxes. In contrast, in an open force flow assembly, the motor must be sized to cover the entire load power. The load of the tested gearbox is derived by the interference of the input power by the generator, which must therefore also be dimensioned for the total transmitted power. This is a strong disadvantage of this arrangement compared to a closed flow assembly. On the contrary, its advantage is very good and simple control over the applied load.
Virtual calibration can also be effectively used to identify the ideal location of strain gauges on the measured shafts. To increase the sensitivity, it is often appropriate to use structural and technological notches in which there is a local concentration of stress and strain.
Most authors do not pay attention to this approach; on the contrary, structural notches are commonly viewed from the point of view of mechanics as negative stress concentrators. Mentions of FEM analysis and its accuracy in connection with technological notches are found in publications Ref. [
15] by Blödorn et al., Ref. [
16] by Colussi et al., and [
17] by Campagnolo.
The scientific novelty and practical relevance of this article stems from the proposed methodology for measuring the efficiency of gearboxes, which is described in the following chapters. This method is unique for the direct application of strain gauges to the shafts, which are used to measure input and output torque, from which the final efficiency of the gearbox is determined. The proposed virtual calibration procedure is an absolutely crucial step in this method, as it ensures a significant refinement of the measured data, due to a detailed FEM analysis of the actual shaft geometry at the place where the strain gauges are applied. Within this new method, an evaluation mathematical apparatus is also designed, which serves to evaluate the measured data and determine the standard deviations of the measurements. Using this comprehensive method, it is possible to determine the resulting efficiency of gearboxes with an accuracy of better than low units of tenths. This method has a significant benefit, as it is a method of measurement that can be operated without a test rig, directly on the gearbox located in a particular functional assembly of a machine, with current operating conditions, which is very advantageous in terms of the relevance of the measured data.
2. Materials and Methods
The process of our measurement is a sequence of steps that can sometimes seem completely trivial and automatic, without the need for further description. Nevertheless, it is necessary to pay attention to these steps, because the overall success of the measurement depends on the successful performance of each step. This method will be further described using examples from performed measurements. In principle, all measurements include the following steps:
Analysis of documentation
FEM analysis
Preparation of installation foils
Installation of strain gauges and apparatus
Measurement
Data processing
Results interpretation
Mentioned sub-steps will be explained below.
In the following paragraphs, the sub-steps are described as typical examples of measurements. The reason for using various example diagrams and figures of gearboxes is direct cooperation with the industry, as it is not possible to present the company’s specific know-how.
2.1. Analysis of Documentation
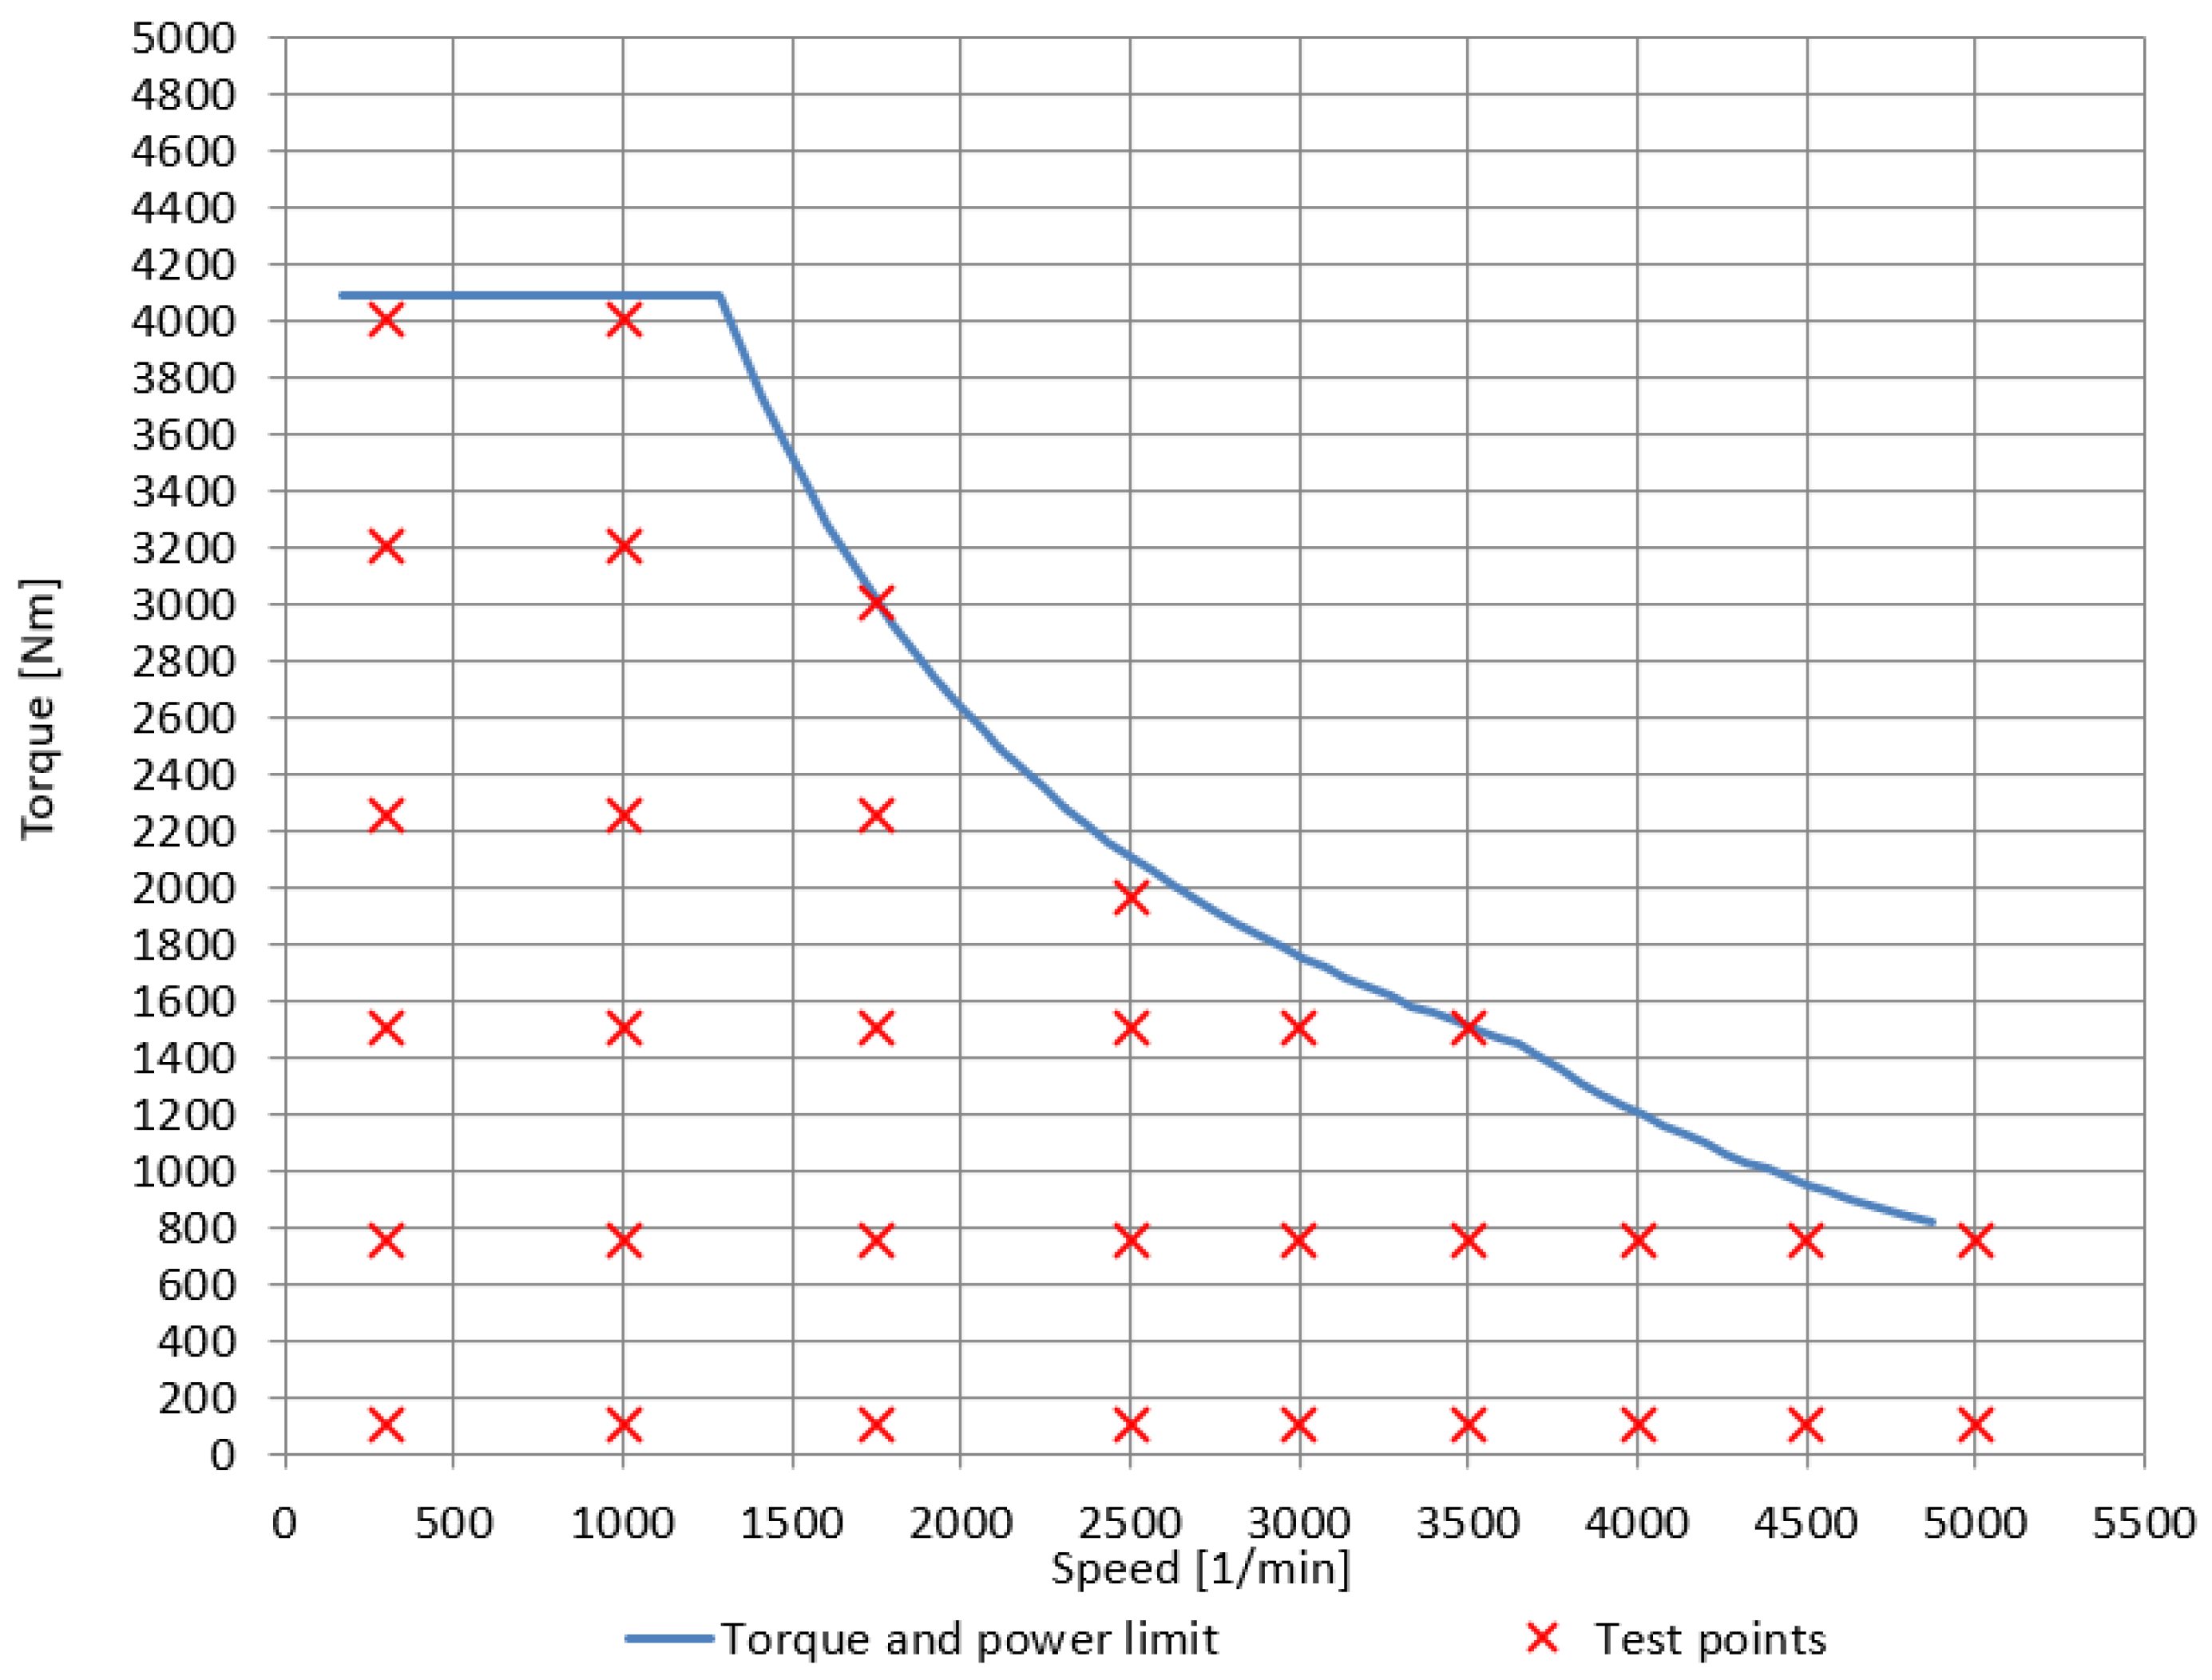
This initial step provides important information for the design of the measuring apparatus. It usually consists of two parts. In the first part, the specification of the gearbox load is analyzed in order to determine the speed (revolution) range and the range of loads that the gearbox should be able to transmit. The output of this part is the proposal of test modes. An example of a test modes map can be seen in
Figure 1.
In the second part of this phase, the drawing documentation (
Figure 2) is analyzed in connection with the mechanical stress generated by the minimum and maximum torque on the input and output shafts to identify correctly and safely accessible places with the highest possible stress values.
Strain gauges are then installed in the test places. Various construction and technological notches are often used to further increase the overall sensitivity of the apparatus.
2.2. FEM Analysis
The finite element analysis (FEA) is typically used for identification of points /areas suitable for torque measurement. The sufficient sensitivity for strain gauge measurement is evaluated for components with more complex shape, where analytical stress analysis is difficult or not possible. The more important task of FEA here is its utilisation as a tool for virtual calibration, due to the impossibility of standard calibration. In this case, the precision of obtained results is crucial in context of the total method error. In the case of FE calibration, discretization error can be considered, which is the largest one from the set of errors during numerical solution. A discretization error can be determined according the theory of a posteriori error estimation in finite element analysis [
18]. According to this theory, the error can be estimated without knowledge of the exact solution. The virtual calibration of relevant components is carried out in Abaqus/CAE 6.14-5 software [
19]. There, the error estimation of Mises stress (
MISESERI variable) can be determined. This error estimation depends on the geometry, boundary conditions, loading, and especially the mesh. The relative error
can be calculated as
where
is Element Mises equivalent stress error indicator, and
represents Element average Mises equivalent stress.
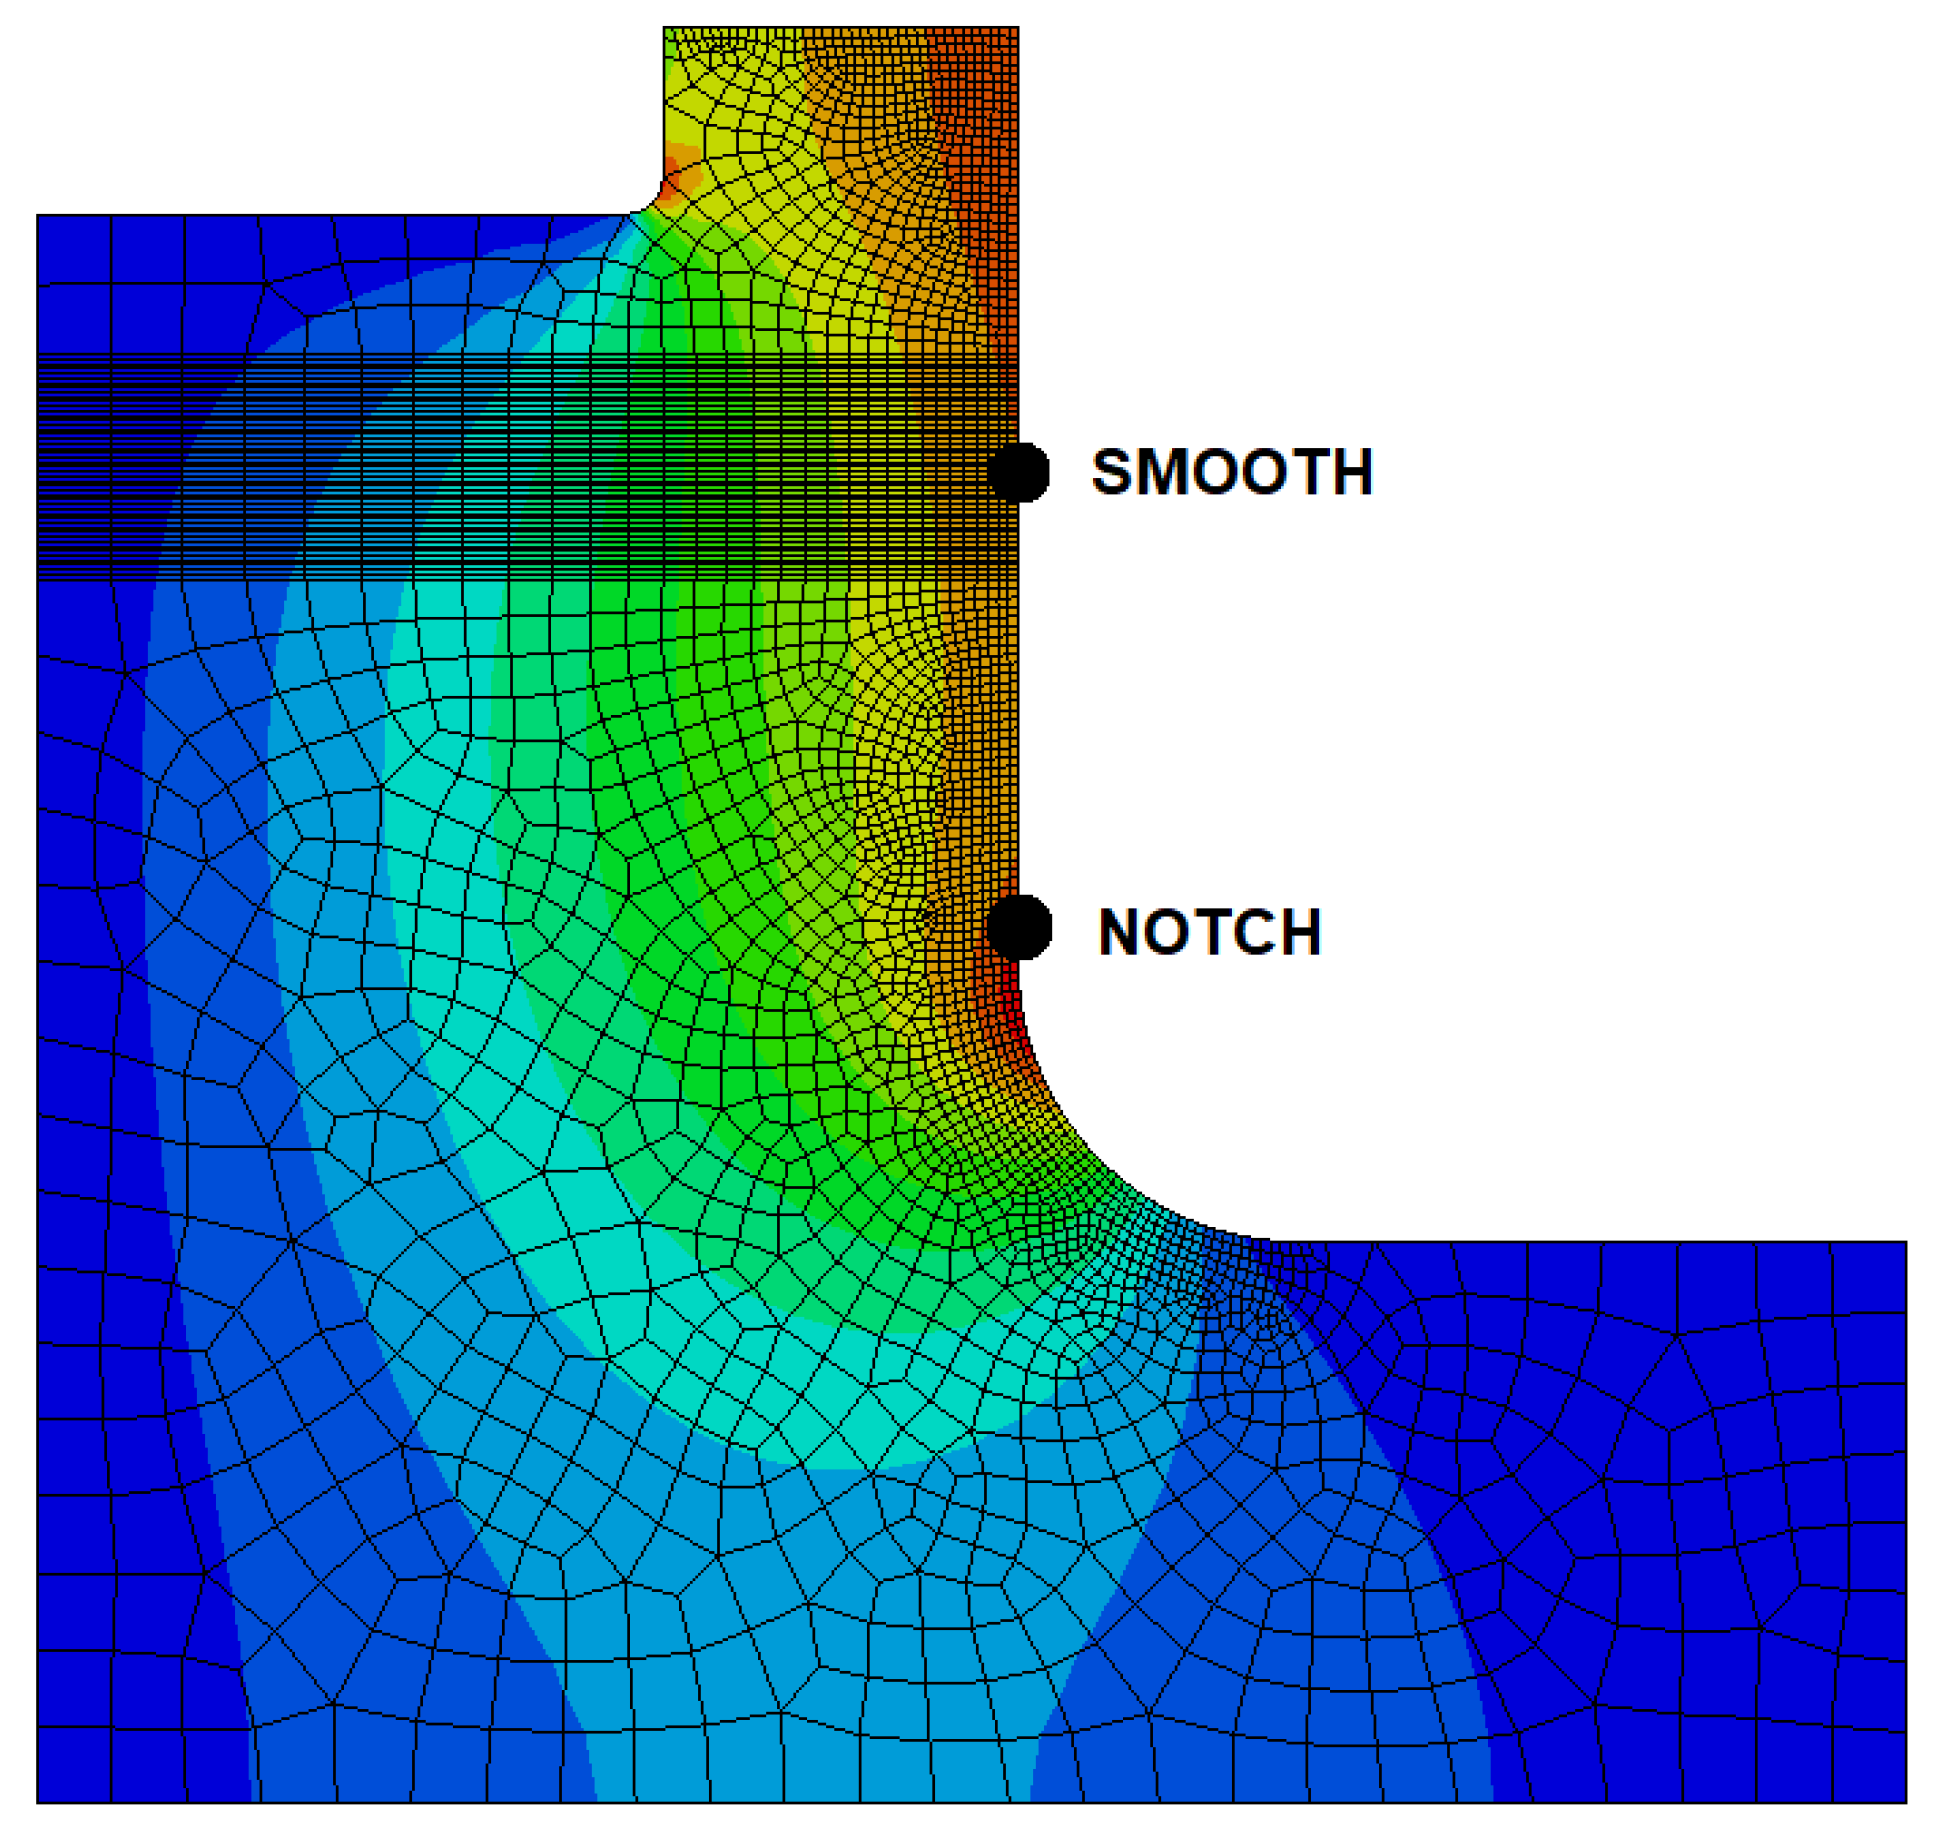
For the purpose of torque measurement, error analysis is carried out for the output shaft of the gearbox with specific shape (see
Figure 3). The part is modelled by means of axial symmetry. Axisymmetric stress elements CGAX8R with reduced integration and quadratic shape functions are used.
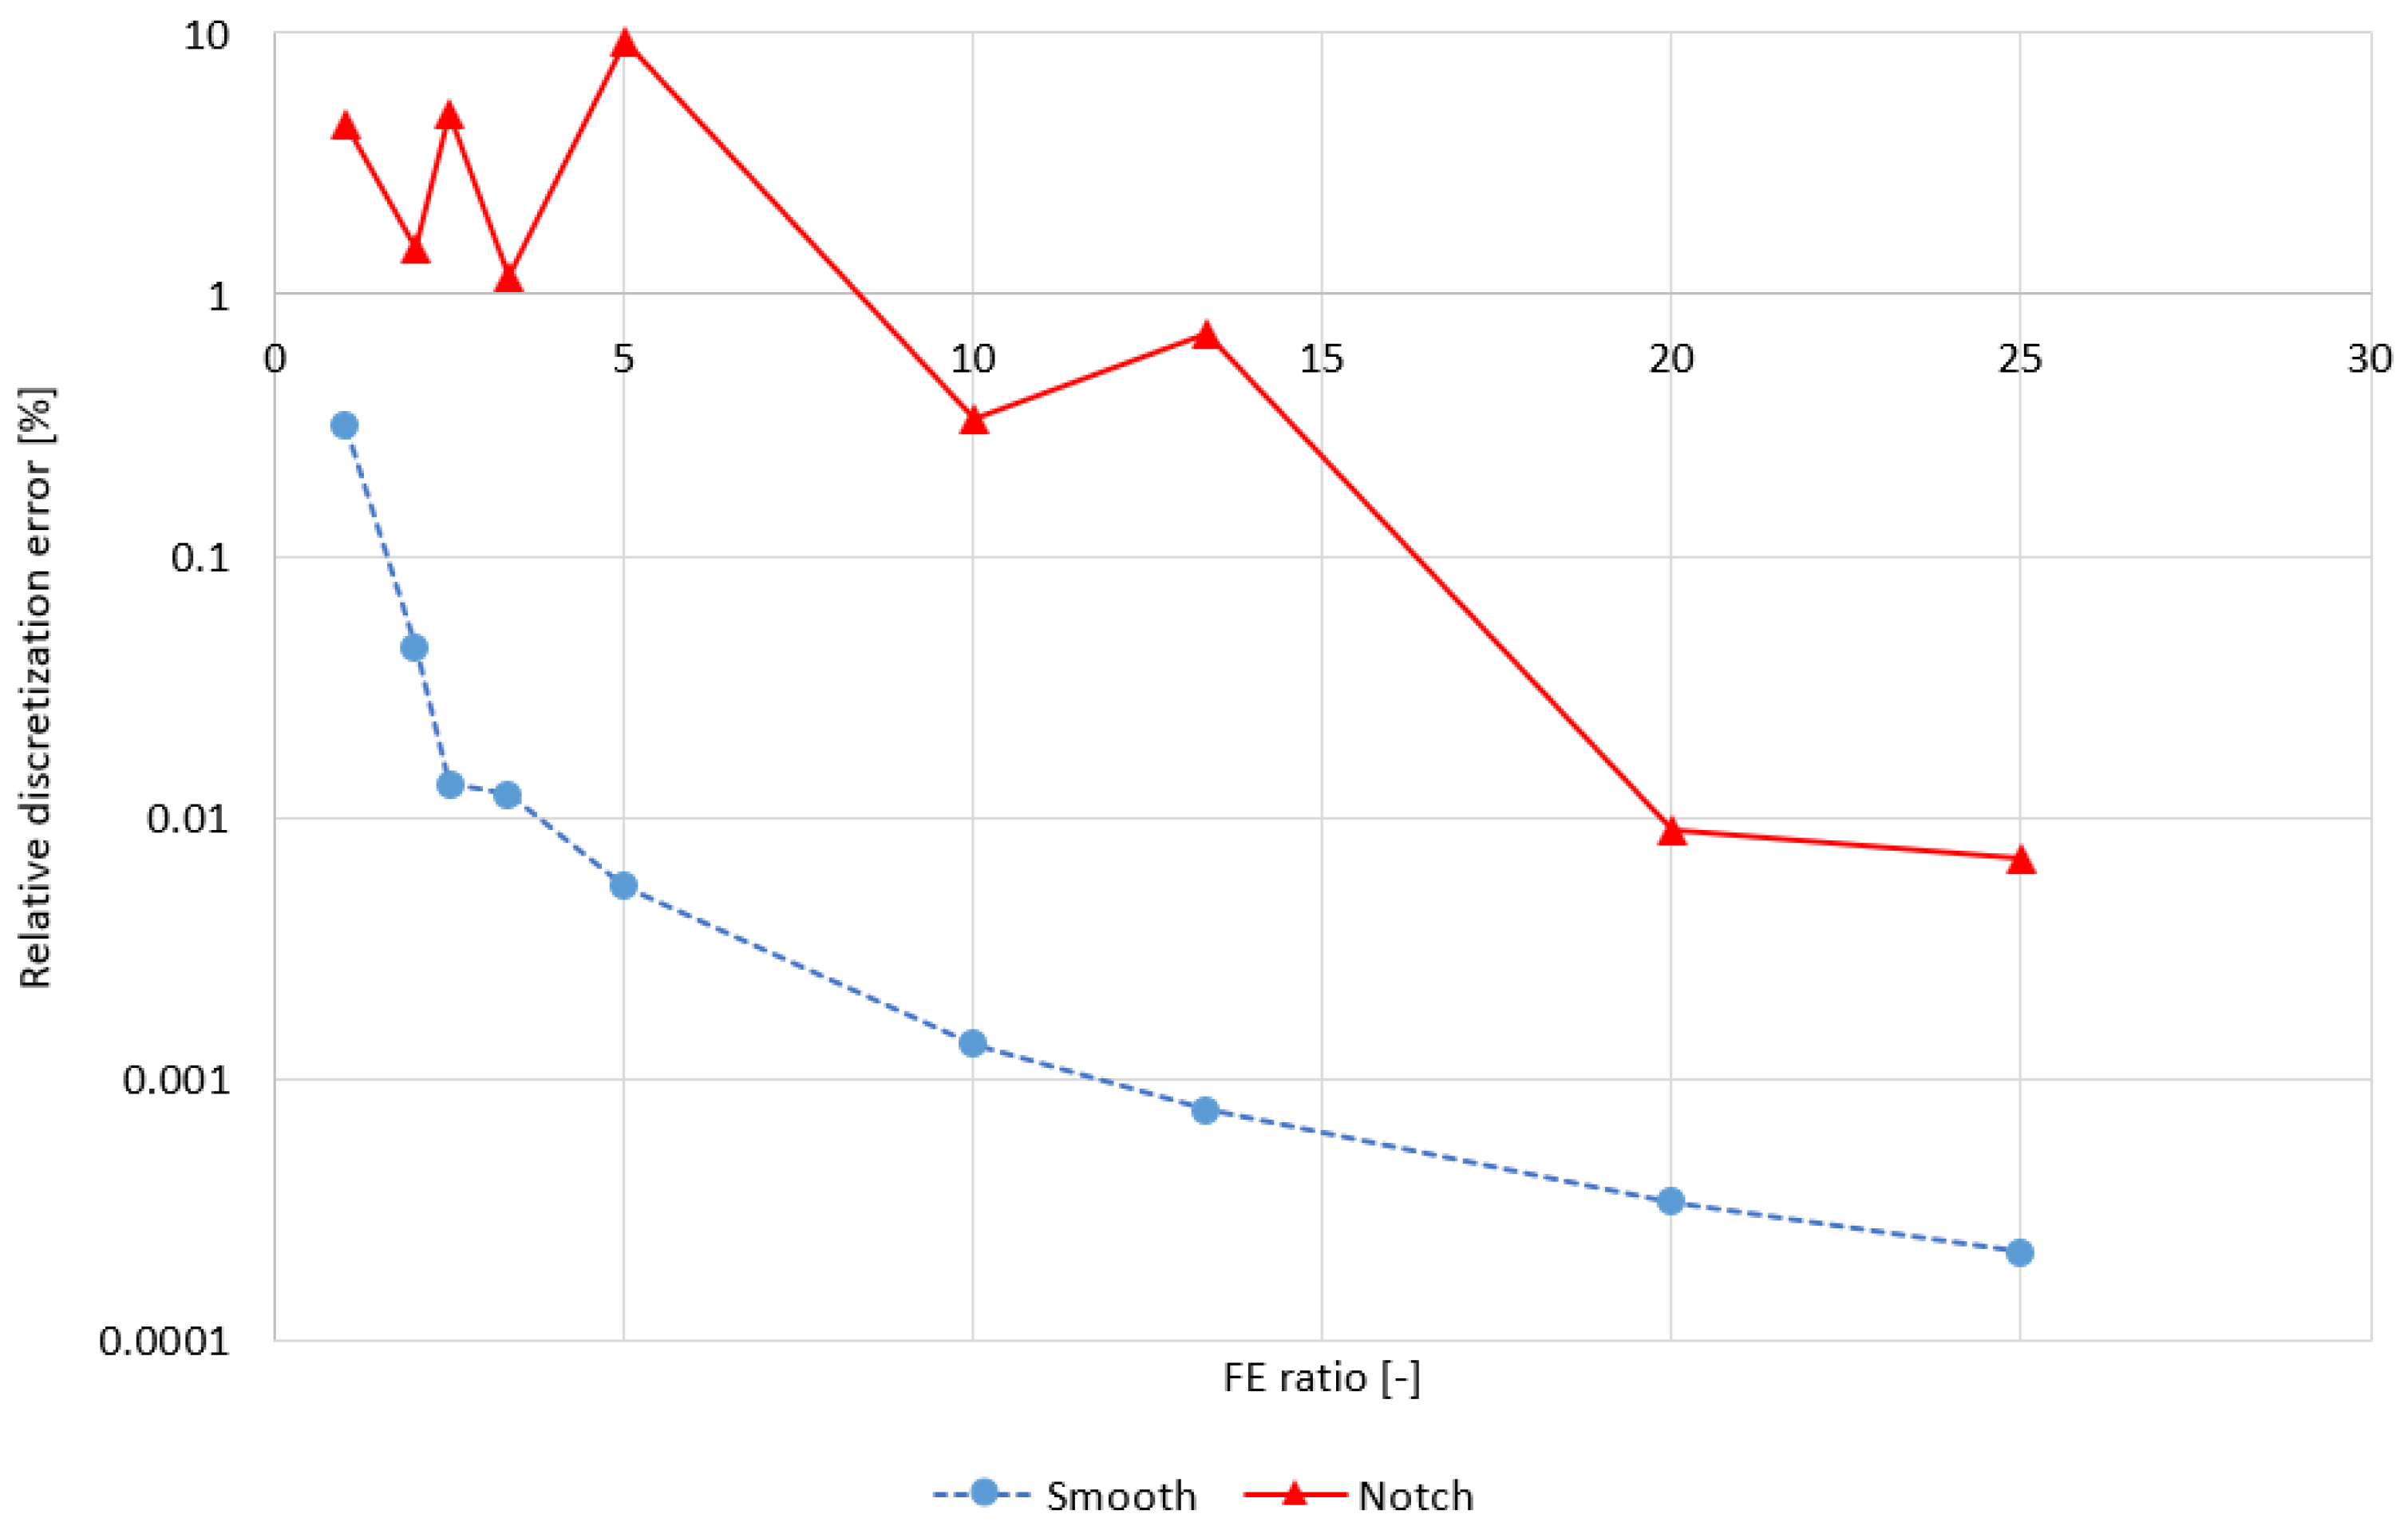
The von Mises stress and error estimation is evaluated in the smooth part of the shaft and at the beginning of the notch–transition radius. The relative discretization error is show in dependence on the dimensionless FE ratio
, where
is the FE initial size and
is the FE actual size.
The relative discretization error profile is in
Figure 4. For the smooth shaft, there is quick and stable approach to the low error values. In case of notch, the relative discretization error oscillates in the range of unfavorable values. To obtain sufficient values of the relative discretization error, it is necessary to use much finer mesh in comparison with the smooth shaft. Using the place nearby, the notch brings the advantage of stress concentration and thus the better sensitivity of the measurement.
2.3. Preparation of Installation Foils
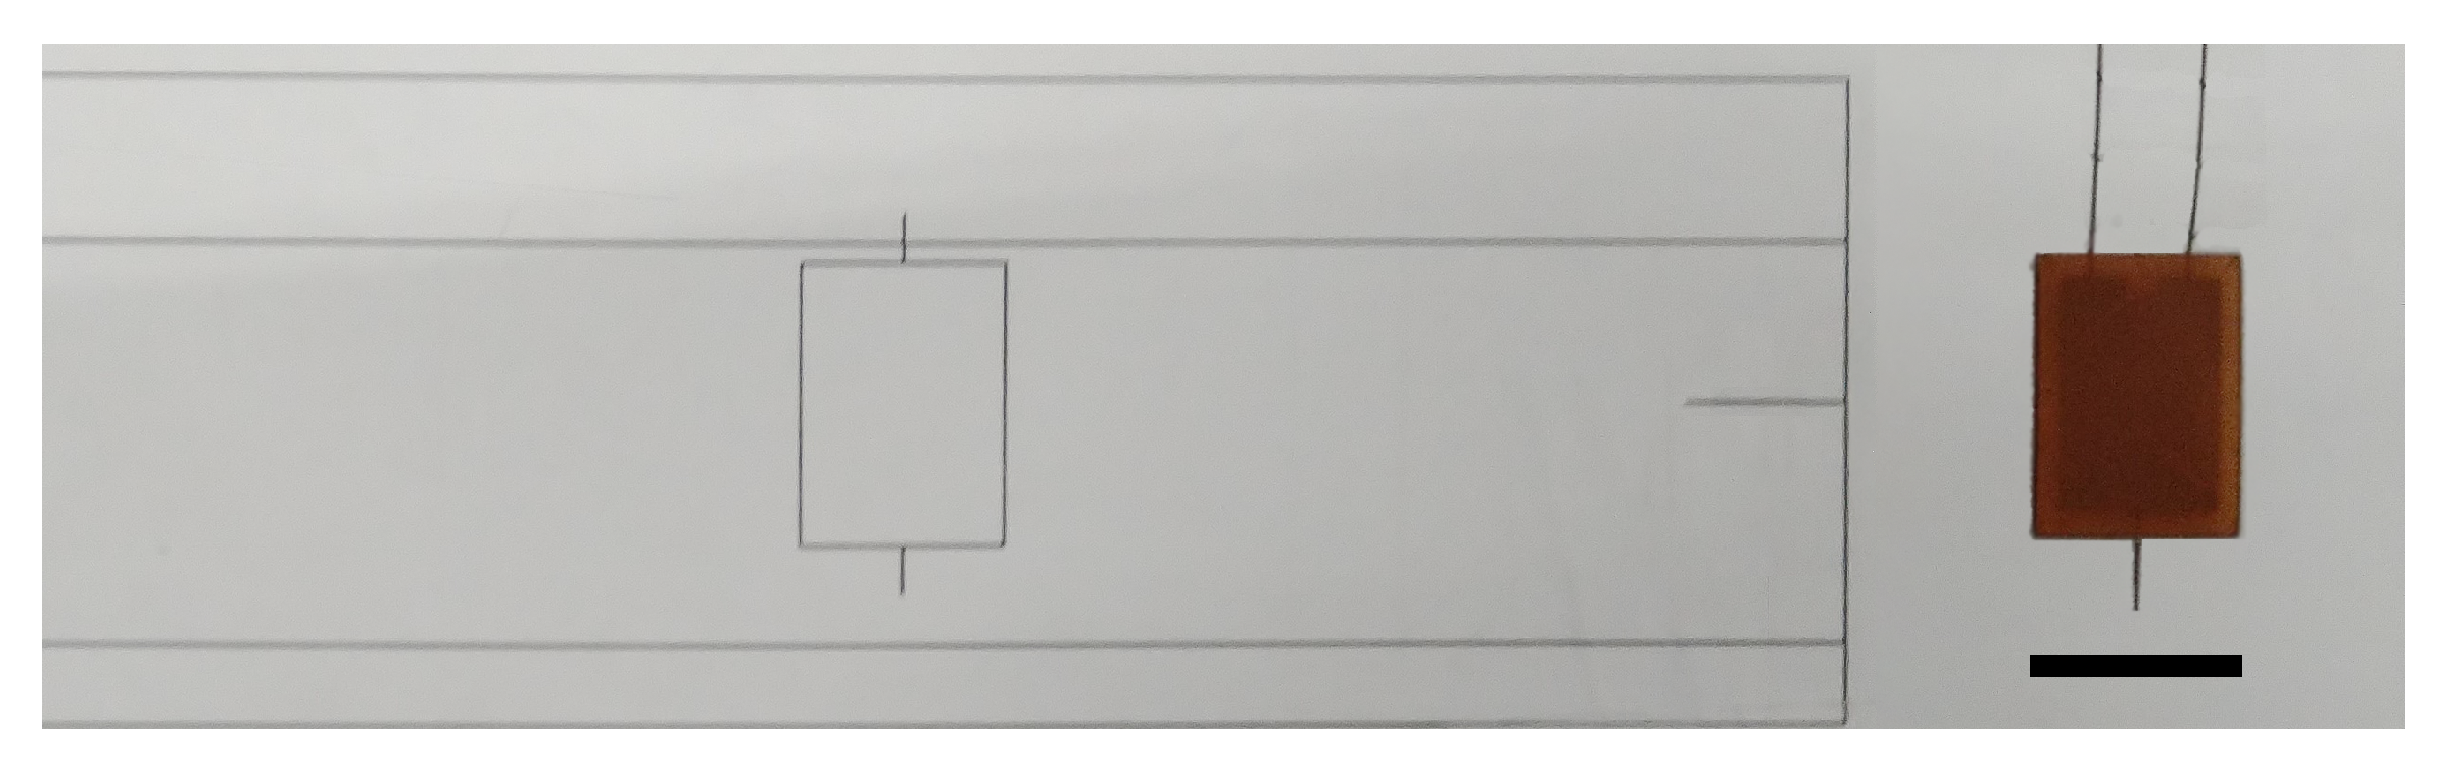
After the selection of measuring points is completed, application foils are prepared on the basis of the drawing documentation, as shown in
Figure 5.
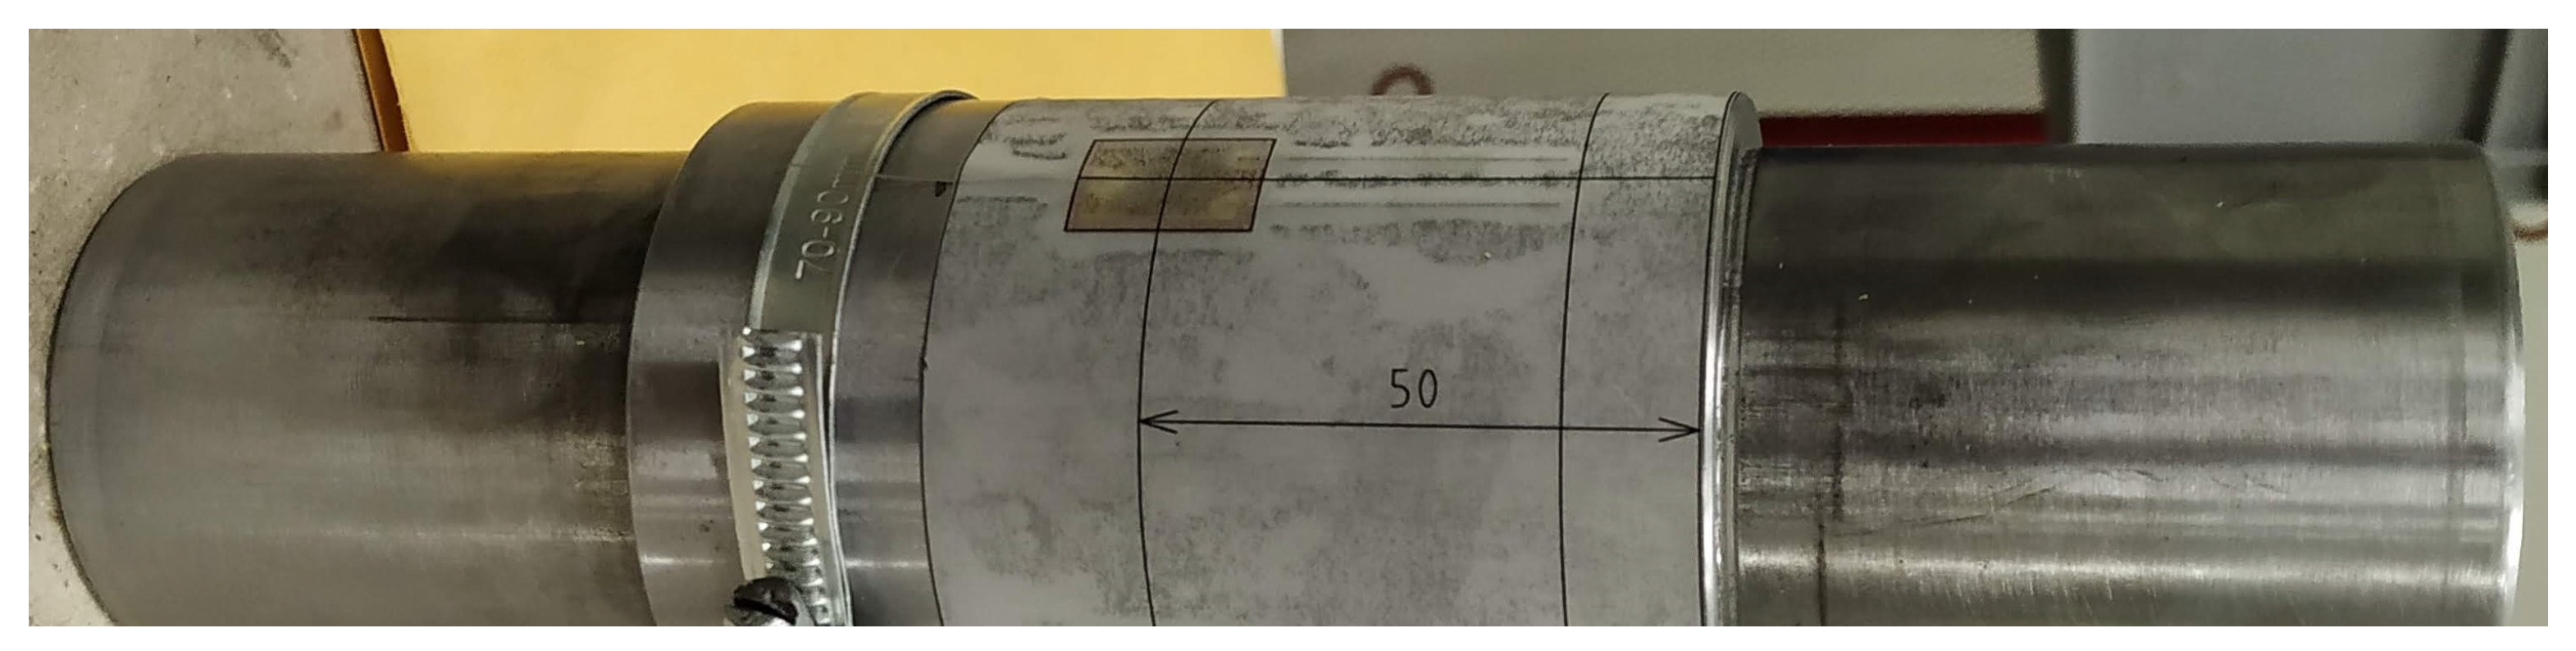
Conventional foil strain gauges are then placed on these transparent foils with high accuracy. These application foils are created by the shaft surface development in the measuring places. The self-adhesive material is used for this purpose. The use of these foils ensures maximum accuracy in the placement of strain gauges on the measured shafts, as can be seen in
Figure 6. The full Wheatstone bridge for measuring the torque is then created from the installed strain gauges. In order to determine the effect of the bending of the measured shafts both on the signal from the torsion strain gauges and on the determination of the efficiency of the gearbox, strain gauges for detecting stress in the direction of the shaft axis can be added. These strain gauges are most often connected in half or full bridges in two mutually perpendicular planes, so it is possible to determine the plane of maximum bending as simply and accurately as possible.
2.4. Installation of Strain Gauges and Apparatus
The actual installation of strain gauges is carried out according to generally respected principles for the application of foil strain gauges. The formed bridges are connected to recording units, which are placed directly on the measured shafts in the space of the gearbox, using various fastening jigs manufactured for each application separately. The example of the final installation can be seen in
Figure 7.
The recording device of our own design works with 24-bit converters and writes data to the microSD card in batches. Commonly available lithium batteries are used for power supply. Their capacity is set according to the time requirements of the planned measurements. Due to the high resolution of the used converters, the amplifiers could be removed from the apparatus; thus, energy consumption is reduced relatively significantly. On the other hand, this solution sets limits in relation to the range of measured voltage values, resp. torque.
Current hardware options allow measuring with sampling frequencies from hundreds to low thousands of Hz (200–6000 Hz). This range is fully sufficient for reliable identification of operating conditions. However, this is not enough to identify the effect of vibrations and the presence of frequency interference. Nevertheless, some frequency phenomena can be well identified in the records.
Each of the measured shafts has a separate unit with the possibility of mutual wireless communication for easier time synchronization of recorded data. Wireless communication with a PC or tablet is installed to continuously monitor the operation of the apparatus during the measurement. The installed bridges cannot usually be calibrated; therefore, the information from the FEM analysis is used. The presence of any shaft preload at the time of installation of the strain gauges is reflected in the steady-state modes by a step-change in the value of the signal after the gearbox has started. The effect of preload of shafts on the measurement result can therefore be easily eliminated within the data processing.
2.5. Measurement
Prior to the actual measurement, it is necessary to set all operating parameters and operating conditions of the tested gearbox to the prescribed values in order to prevent its damage. These are mainly the ambient temperature and the operating temperature of the gear unit oil. This phase is followed by a standardized measurement protocol, in which all specified operating points are measured according to
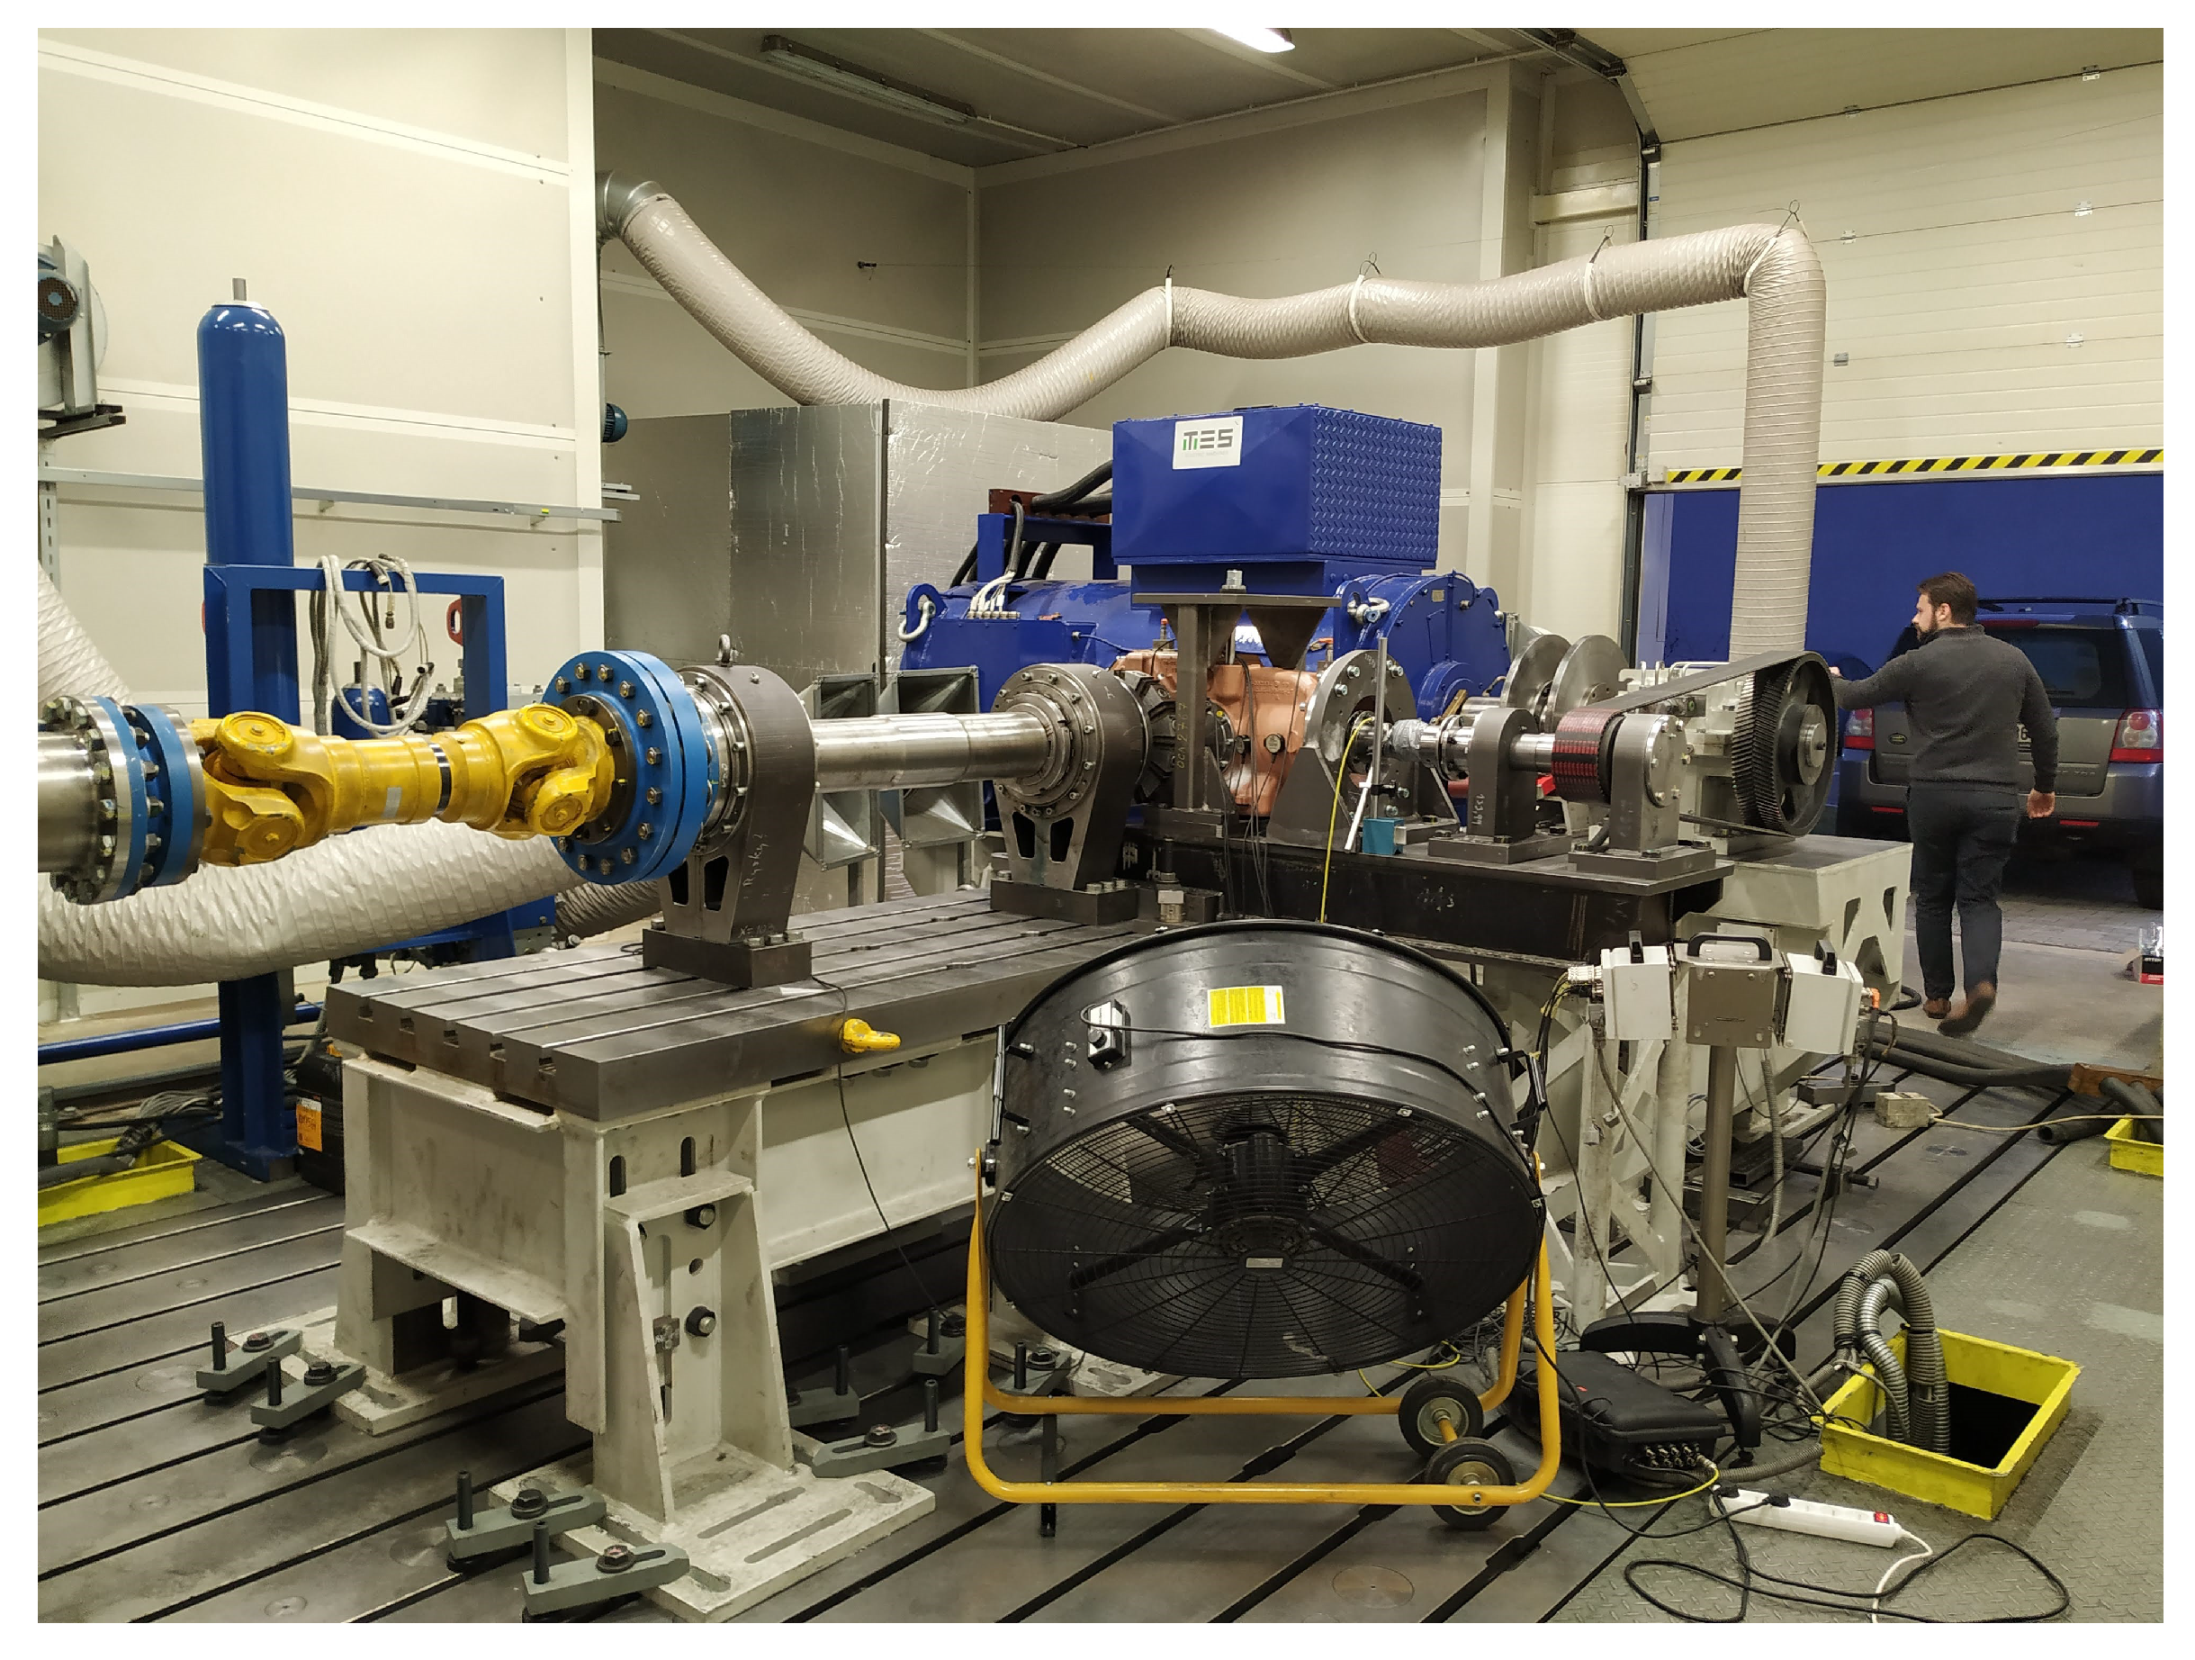
Figure 1 in the case of identification of a complete efficiency map. In the case of in-service measurement, the measurement identifies the efficiency at a given operating point. Typical arrangements of open power flow sites for identifying a complete efficiency map under prescribed operating conditions are shown in
Figure 8.
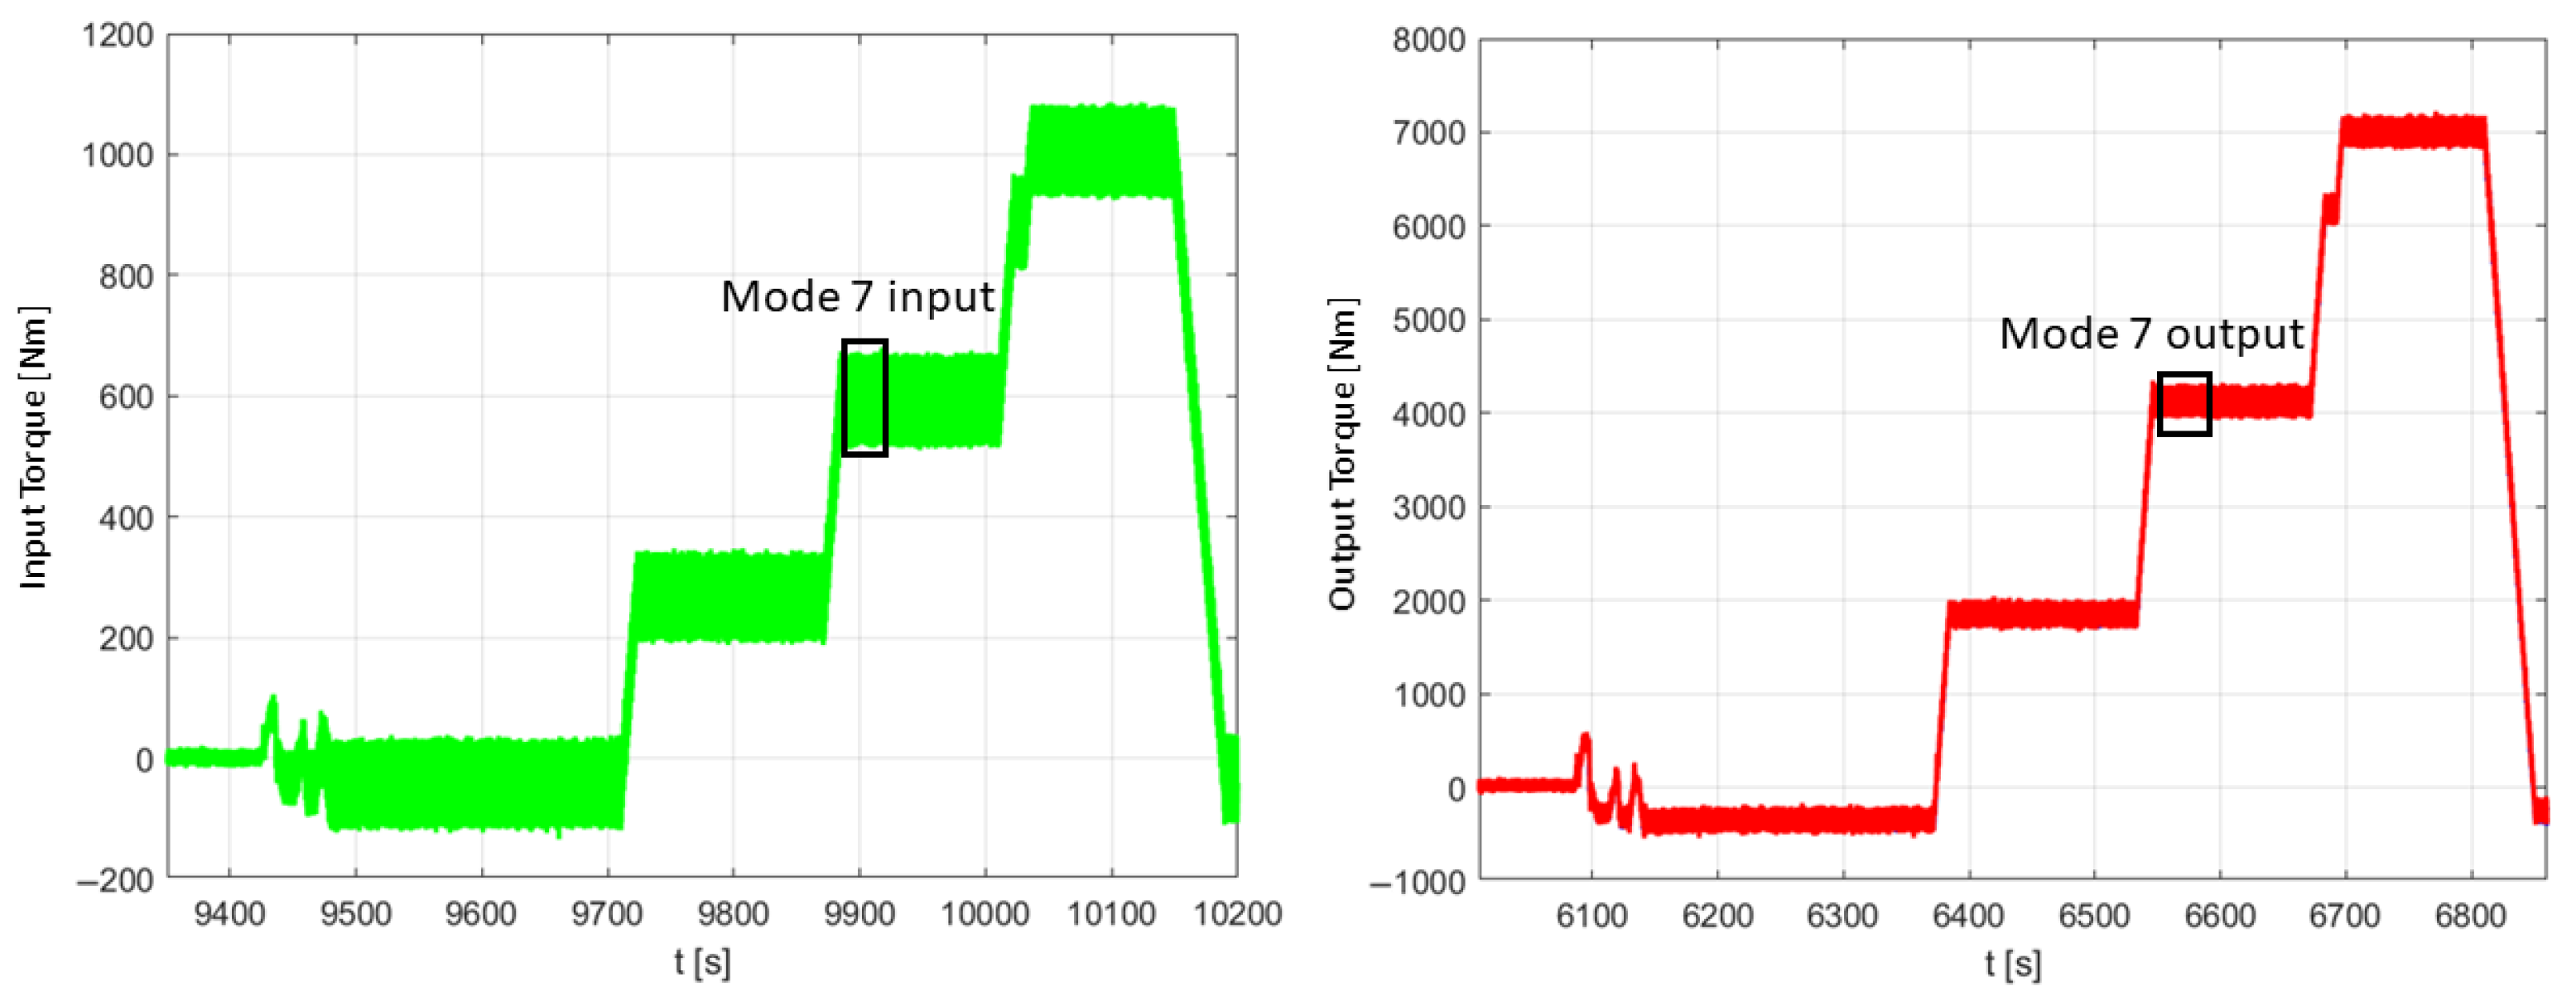
It is maintained at each measured operating point for a minimum of 30 s after the stabilized course of load, usually defined by the input torque and the speed of the input shaft. The recorded data can be displayed in a graph according to
Figure 9.
2.6. Data Processing
Interpretation of data processing outputs is based on the basic definition of energy efficiency of mechanical systems:
where
,
represents supplied energy eventually supplied power, and
and
represent output mechanical work and output mechanical power, respectively.
For transmission systems with a constant kinematic gear ratio without slippage and thus with a clear and constant relation between RPM, power, and torque, the above equation can be written as follows:
where
and
are input torque and output torque, respectively, and
i represents speed ratio.
The aim of data processing is to determine these necessary variables as reliably and accurately as possible and to define the uncertainty of the result, i.e., of the required mechanical efficiency of the tested gearbox.
In investigated industrial gearboxes, which most often use involute gearing, the fluctuation of their gear ratio is possible to considered negligible, resp. causing fluctuations of efficiency in steady-state operating modes of units at most of tenths of a percent depending on the load level of the gearbox related to the nominal one for which the gearbox is designed. The load level has a strong effect on the cooperation of the teeth on meshing wheels, which is, among others, manifested by fluctuations in the gear ratio.
The crucial task is therefore to detect the transmitted torques as accurately as possible. From the instrumentation used, information in mV/V with a resolution at the level of units of ten thousandths of mV/V is obtained. High-quality stabilization of the supply voltage for measuring bridges keeps its changes during the measurement below the limit of one thousandths of V; thus, this error can be considered negligible. Likewise, the quantization error of used A/D converters does not need to be applied in further data processing. With the supply voltage of 5 V, this error does not exceed 0.0000003 V. Using installation foils, the error of placement and orientation of strain gauges on measured shafts is minimized up to a negligible limit.
With reference to
Section 2.2, the error of performed virtual calibrations or measured data identification using FEM can also be neglected in the data processing. The actual dimensions of used shafts are measured by analog gauges with an accuracy of
mm. Considering that shaft diameters of most tested industrial gearboxes are at the level of higher tens up to low hundreds of mm, the influence of the above error is understood as negligible too. The uncertainty resulting from the gauge factor of the used foil strain gauges is given by the data of their manufacturer and, depending on their size, varies between ±1.5 and ±1.0% from the nominal value in relevant data sheet. In commonly used foil strain gauges with a grid length of 3 mm and with gauge factor, e.g., 2.03, this represents an uncertainty of, at most, 0.0203. This may seem like a relatively high value, but its actual effect on the torque calculation is fully eliminated by calibration of measuring points. Then, regarding the achieved accuracy of calibration processes and full temperature compensation of full bridges used, the gauge factors of individual strain gauges are also considered absolutely exact for our purpose. Thus, finally, the recorded data in mV/V are converted to torques in
without the above errors, and therefore, the uncertainty of required mechanical efficiency of the tested gearbox results just from the character of the recordings.
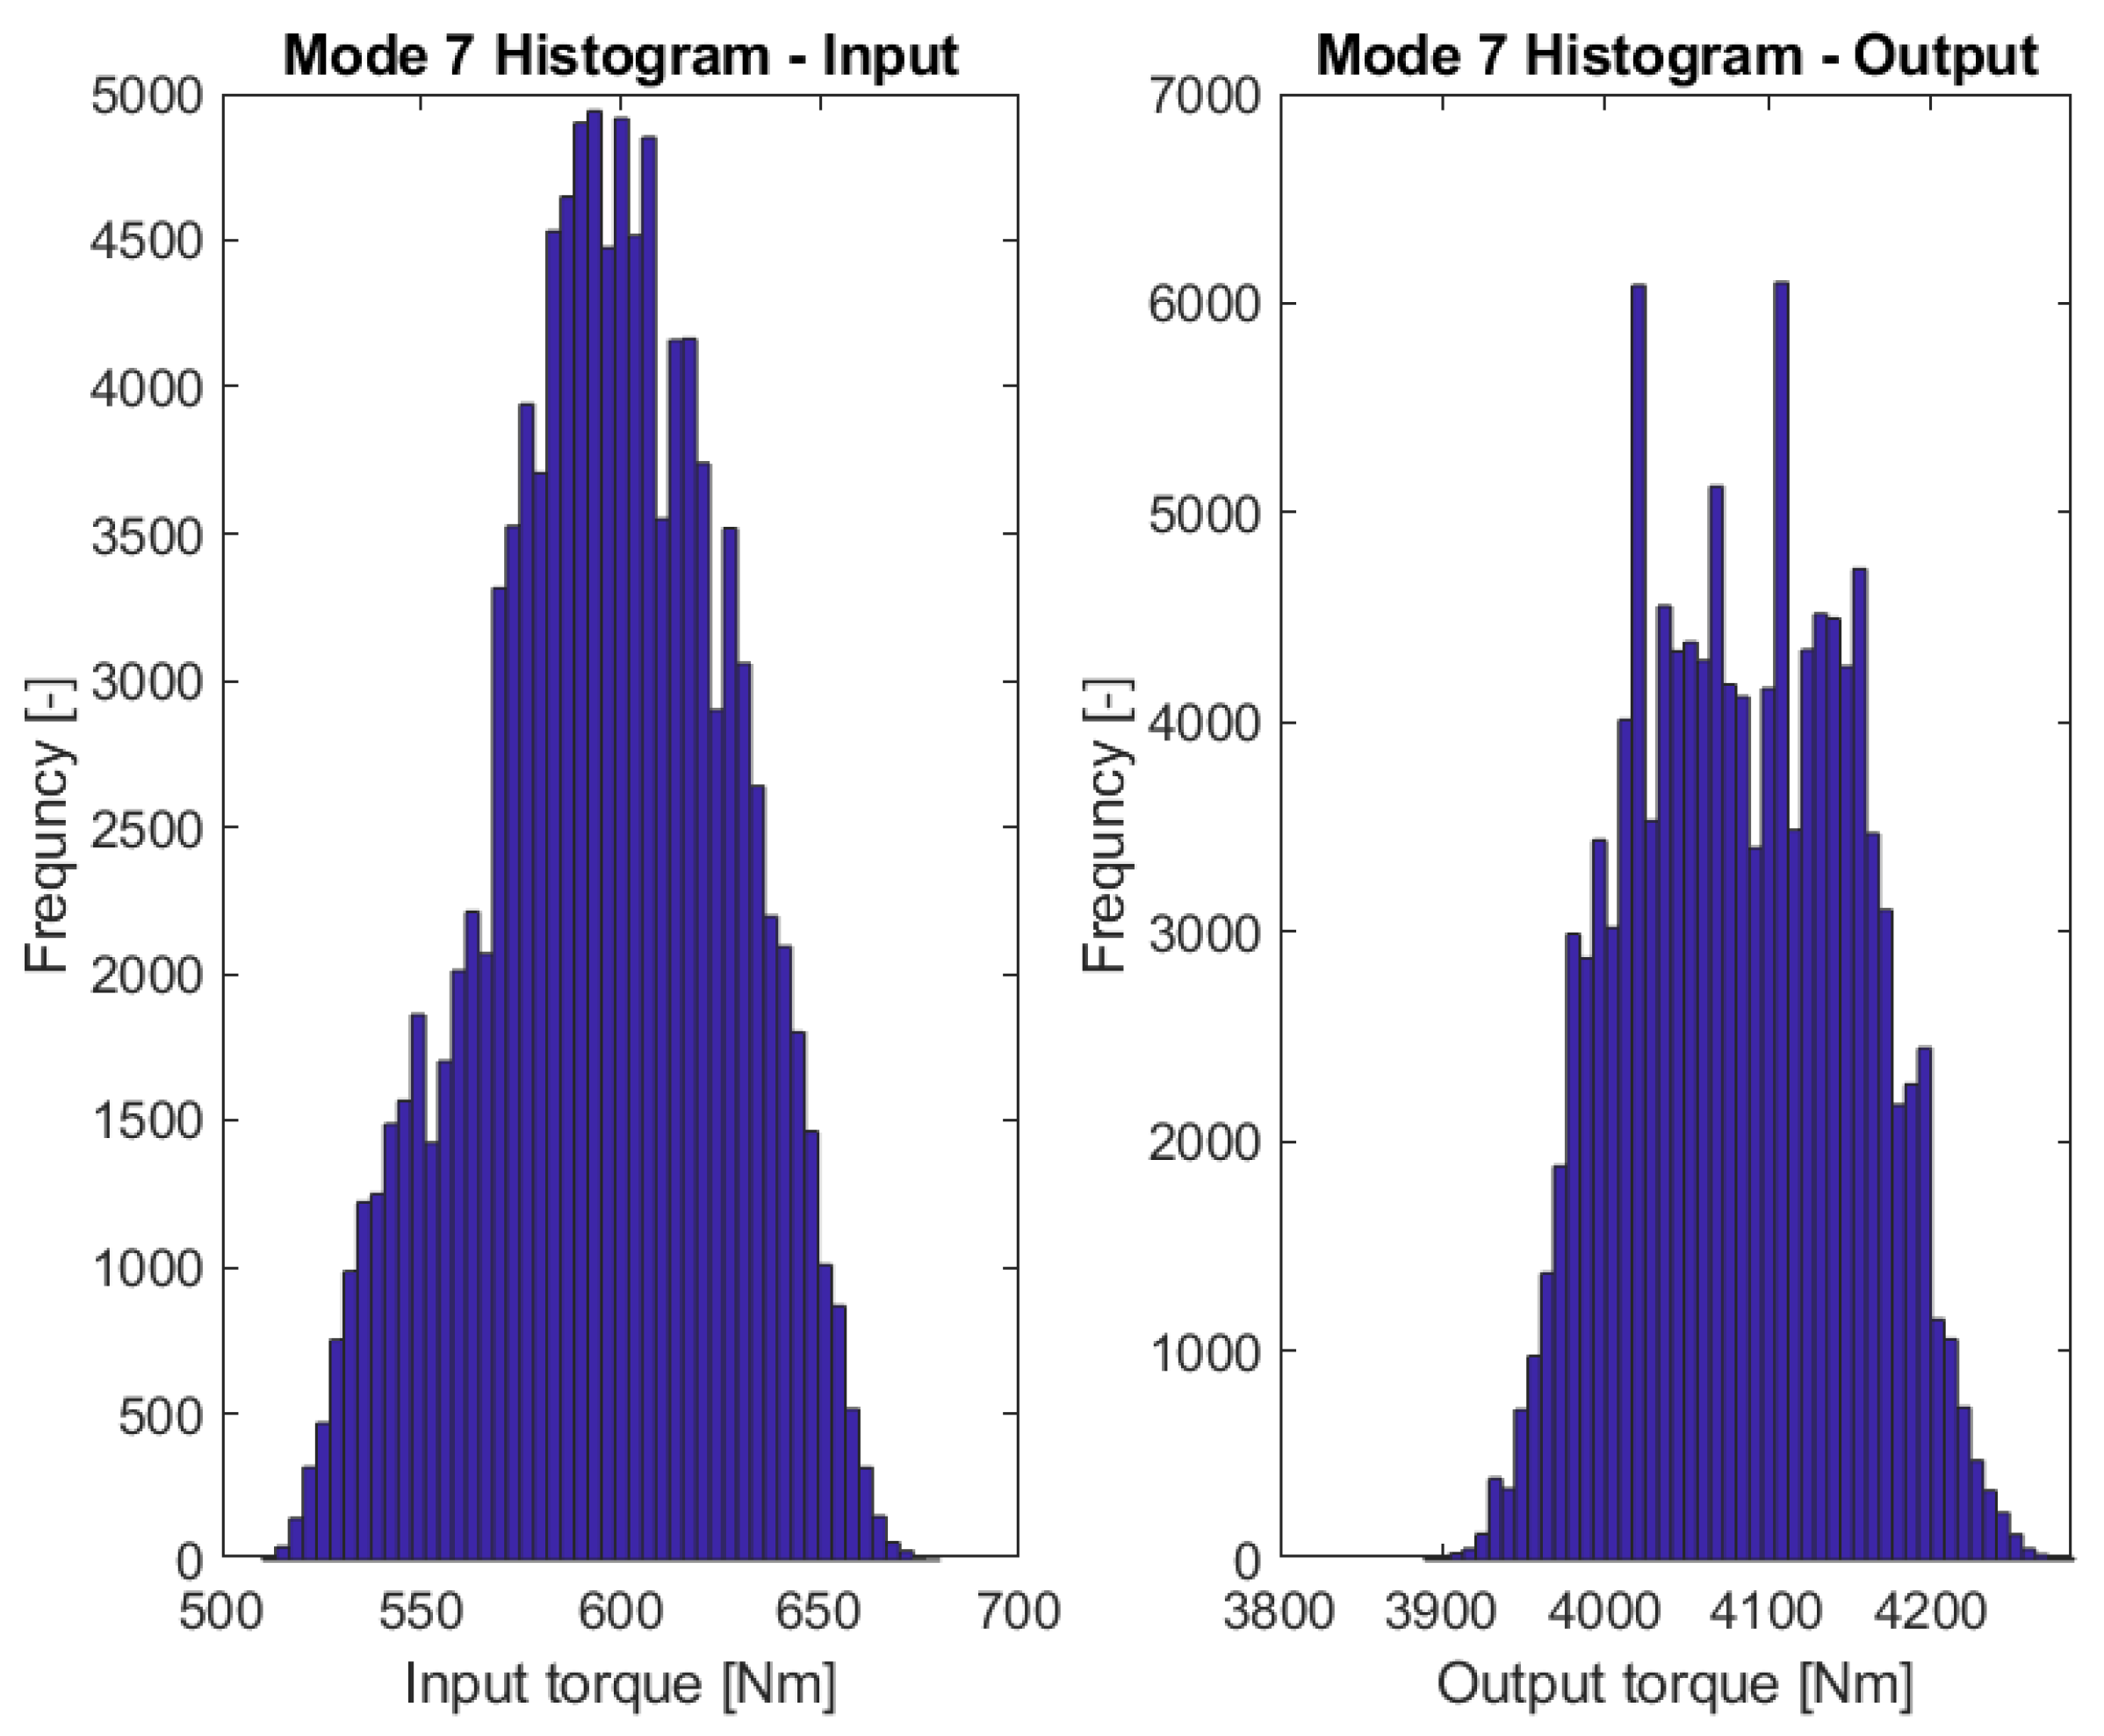
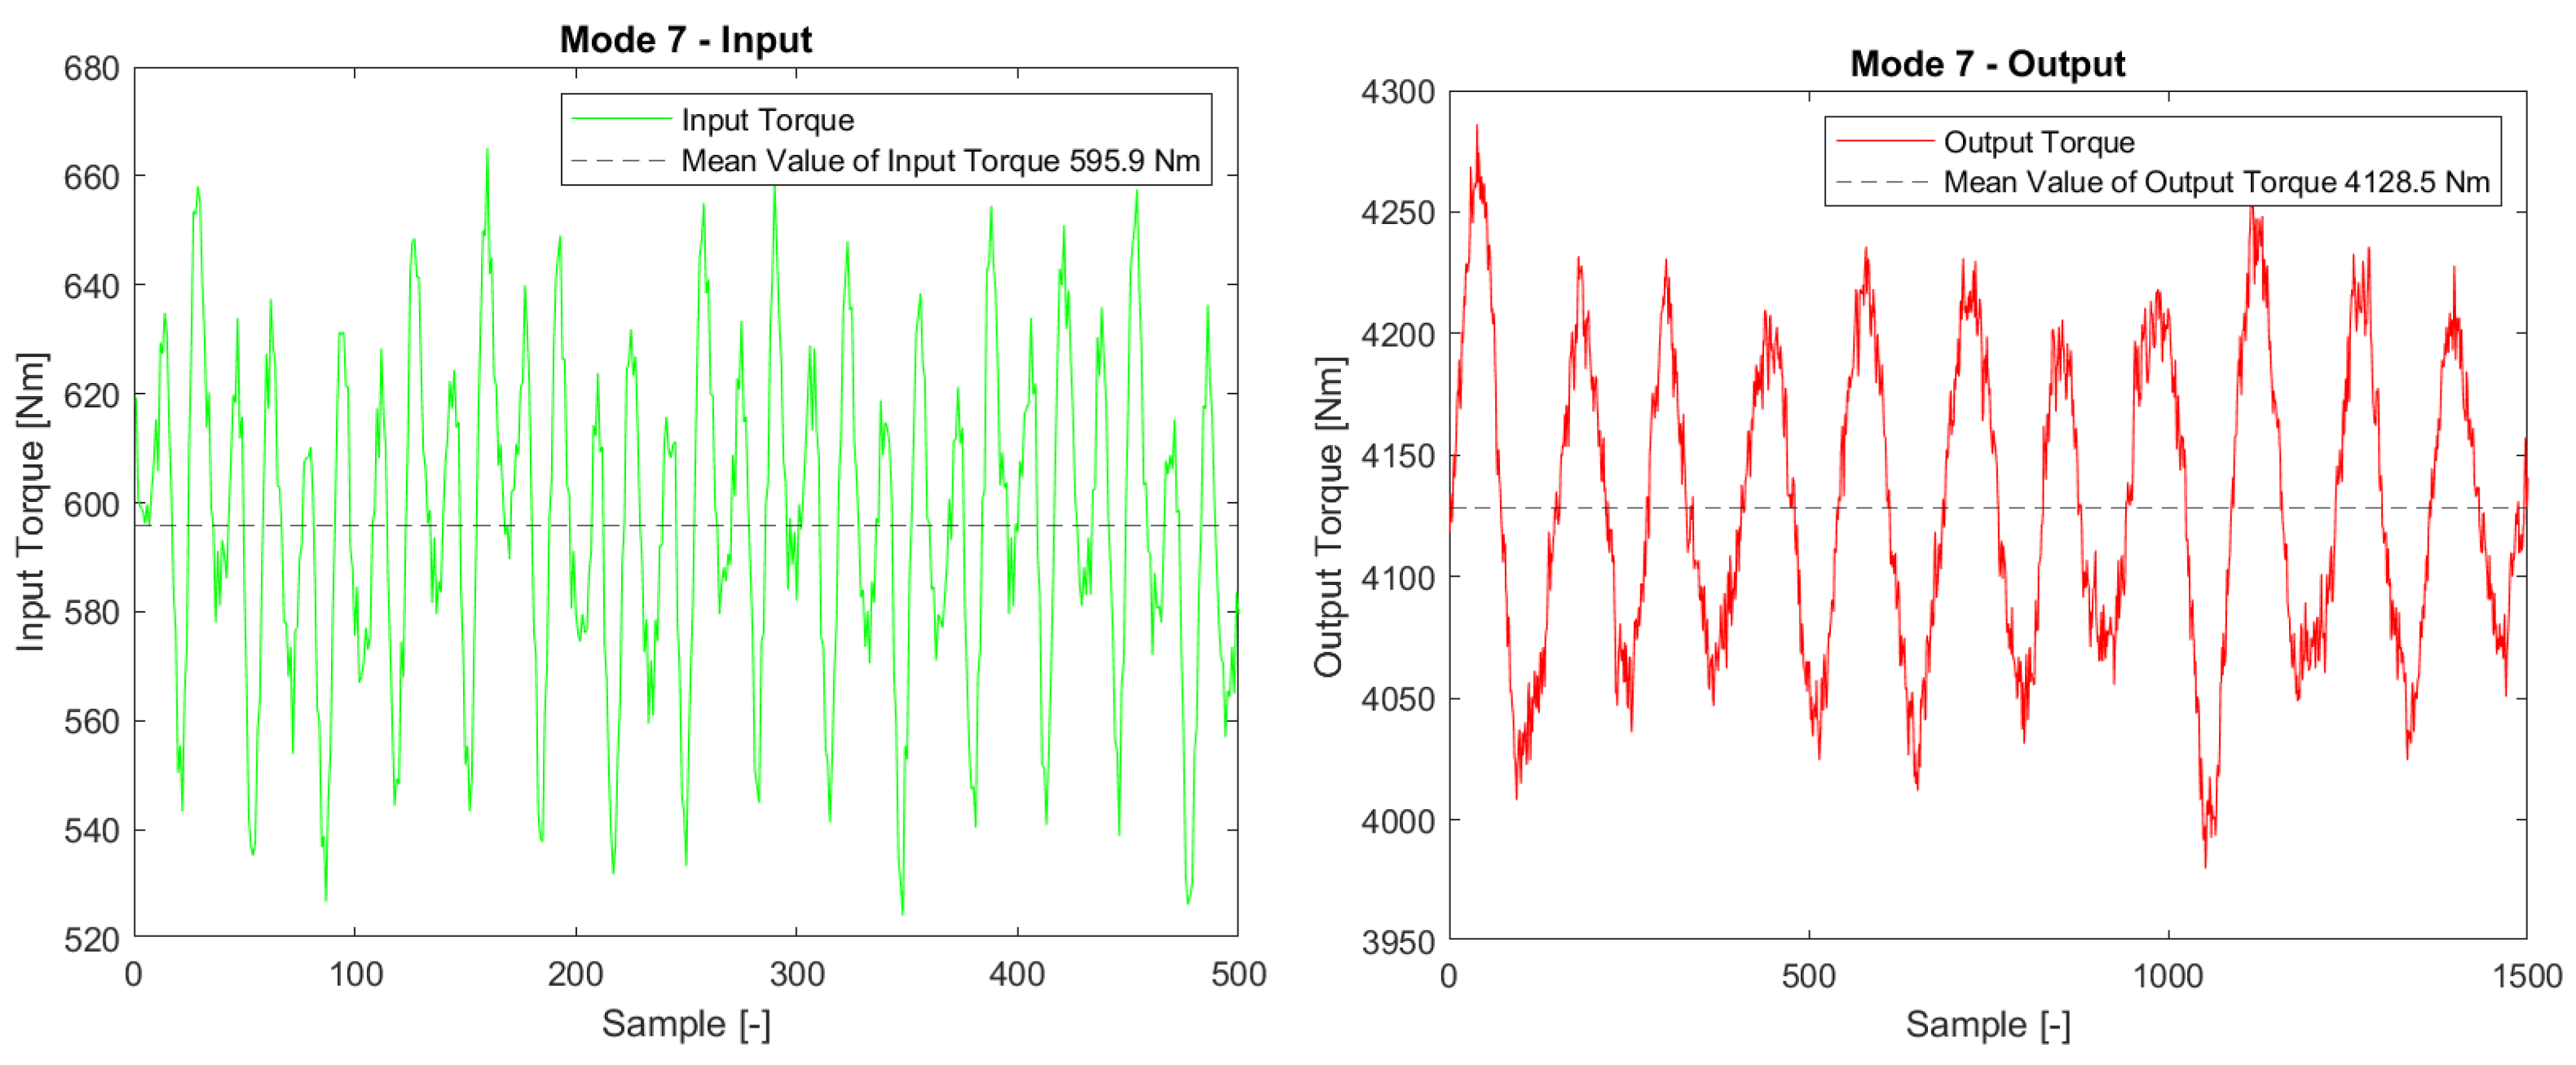
The following data processing procedure is based on the assumption of a normal distribution of the measured data.If the measured data approach the normal distribution, but there are also less significant side spectra of the measured data frequencies, it is necessary to accept the assumption of using the main peak, which carries essential information to determine efficiency and further consider these data as normally distributed.
Figure 10 shows histograms of the measured data, specifically Mode 7, which is demonstrated in
Figure 11. Mode 7 is the designation of one mode of the total measured data shown in
Section 2.5 in
Figure 9. It can be seen in
Figure 10 that the data can be considered normal, as they are in accordance with the normality test.
The recorded data are cropped for each operating point. The output time series
and the input time series
, where
are used to calculate the efficiency
for each operating point. The efficiency is traditionally expressed as the ratio between the output
and the input
:
where
.
Figure 9 illustrates that the time series for each operating point repeats infinitely with the same periodicity, and therefore, the time series is considered stationary. In such a case, covariance between any two points of the time series only depends on the distance between these points. Covariance
of the time series
a
is estimated as
where
is equal to variance of
, Refs. [
20,
21]. Variance of
is calculated from the covariance matrix
, where
according to the variance sum law
is calculated likewise [
20,
21].
As the returned variances are relatively small compare to the means, the variance formula for the ratio between output and input data in Equation (
5), i.e., efficiency, can be stated using the Taylor series expansion as
As the point synchronization is not ensured between the output and input series, covariance between
and
is neglected, and the standard deviation on establishing the efficiency is equal to
In this way, the uncertainty is determined respecting the calculation principle of the required efficiency from torques identified by their direct measurement.
3. Results
In the presented measurement example, the efficiencies for all working points according to sample
Figure 1 are collected in
Table 1.
In modes 5, 9, and 13, the power flow reversed in the direction from the generator to the motor, which was reflected in a change in the polarity of the signal from the measured components. To calculate the efficiency in these cases, the output of the gearbox was therefore considered an input, and conversely, the input was considered an output.
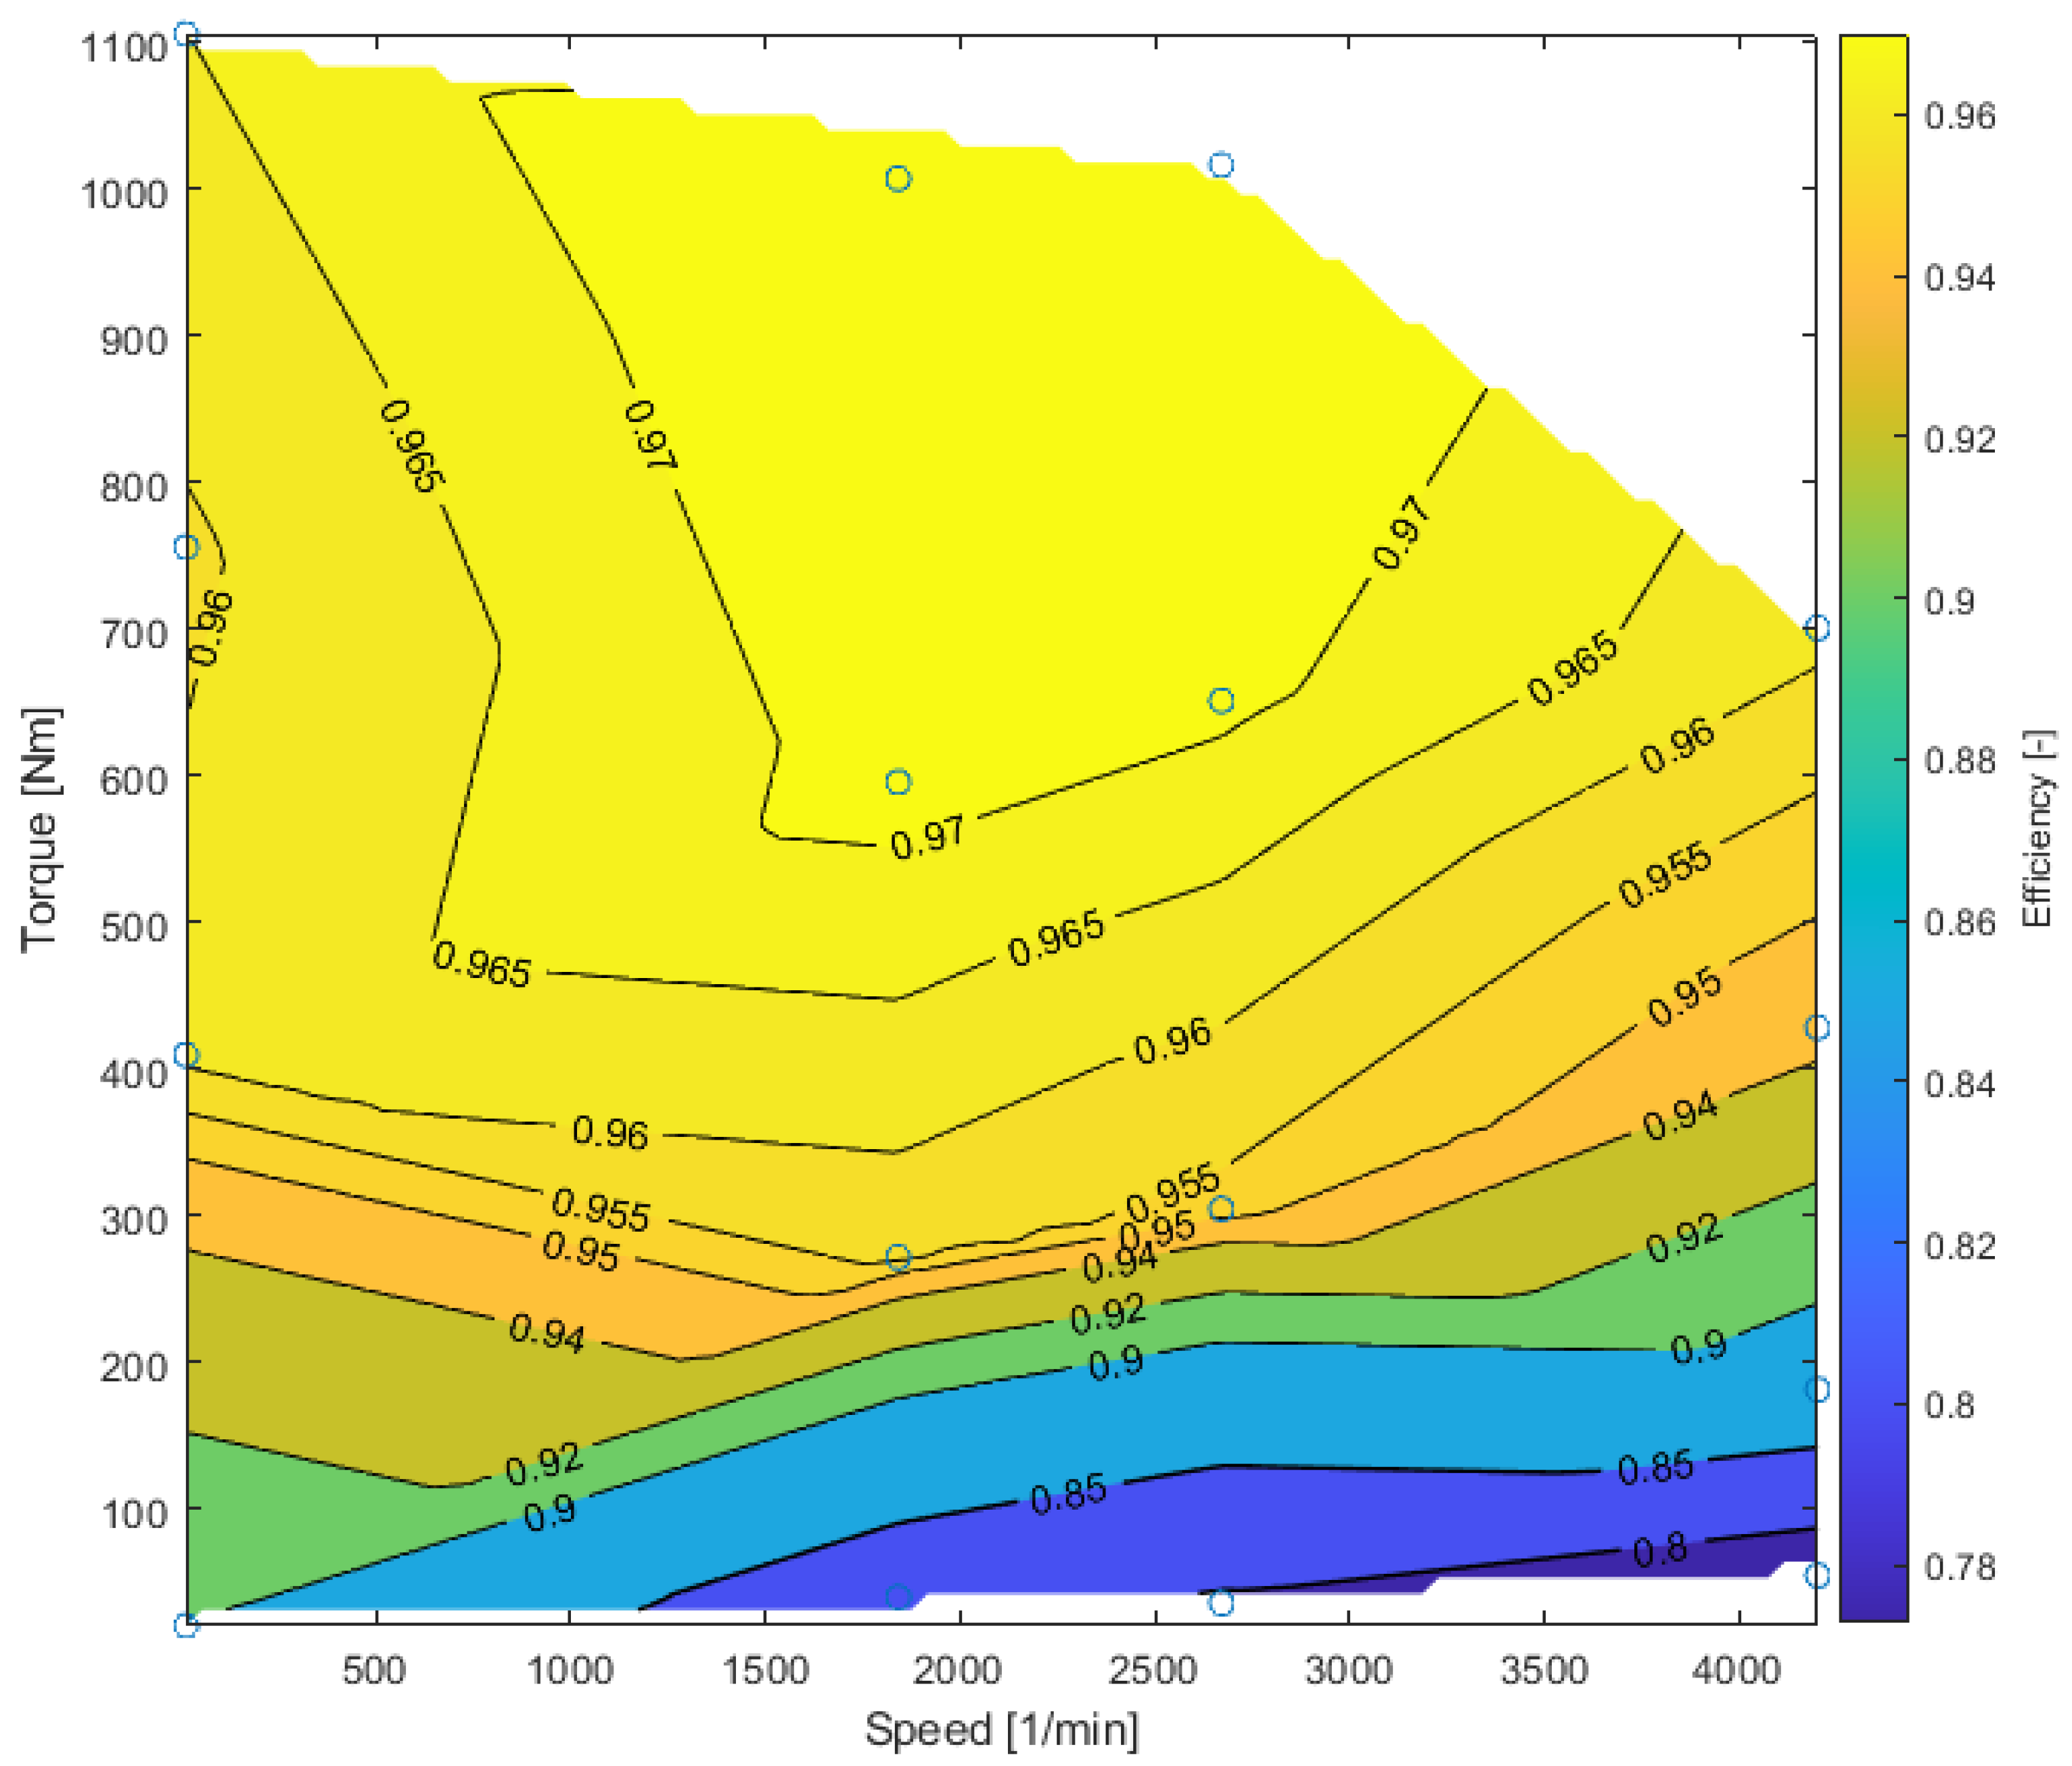
Table 1 can be clearly interpreted graphically like finalized efficiency map (
Figure 12).
From the measured data and the determined efficiencies (
Table 1), it is evident that the investigated gearbox achieves the highest efficiency above 97%. The gearbox achieves this maximum efficiency at speeds from 1800 rpm to 2700 rpm and at a nominal input torque of 600–1000 Nm. This area, which is clear on the efficiency map (
Figure 12), is the optimal functional area of the gearbox.
Figure 12 also shows that when the nominal input torque is reached, at speeds below 1800 rpm, the efficiency of the gearbox approximately drops to 96%. The same applies to speeds above 2700 rpm. In this area, however, the gearbox approaches the power limitation and the input torques should not exceed 700 Nm. Furthermore, it is also evident that, for the total speed range, at torques lower than 500 Nm, the efficiency of the gearbox decreases significantly. The least favorable in terms of efficiency are input torques below 100 Nm. In this area, efficiency is below 85%.
Table 1 shows the deviations of the determined efficiencies for the individual measured modes. The deviations are based on the definition of statistical evaluation described in
Section 2.6, which was applied to the measured data. The resulting percentage deviations show that the efficiency values for the nominal functional area of the gearbox are determined most accurately (approximately for input torques from 600 to 1000 Nm, at 1800–2700 rpm). For measured data in this area, the deviations range corresponds to higher units of hundredths of percent—specifically, 0.063–0.088%. If the gearbox is outside its optimum operating range, i.e., the input torques are less than 500 Nm, the deviation values are equal to low tenths of a percent (0.12–0.36%).
It can therefore be stated that the determination of the deviation and the most accurate efficiency depends on the quality and nature of the measured data, which is related to the functional area of the gearbox (i.e., values of torque and operating speed).
The presented efficiency map obviously does not provide information about efficiencies in the whole spectrum of investigated working points with the same uncertainty, but this is, unfortunately, a property of the method and a consequence of the relation between the behavior of such these mechanical transmissions and character and level of their load.
4. Discussion
Section 3 works as an illustrative example of the interpretation of compiled efficiency maps. Each sudden efficiency change announces the need for more thorough examination of surroundings of the relevant operating points in order to identify the reason for this change using one of other specialized methods (vibrometry, thermometry, acoustic measurement, etc.). Very often, a decrease in efficiency is associated with an increase in vibration. Some gearbox components have high resonance and cause a significant outflow of drive power. Another relatively frequent example is imperfect teeth mesh of the meshing wheels due to too low or too high deformations of shafts, gears, or the case. The crucial moment for a reliable interpretation of measurement outcomes is the correct identification of the absolute values of measured deformations, resp. torque. This step is important, because the searched efficiency is calculated according to common definition formula by the ratio of the absolute values of output and input torque. Thus, it is always necessary to reliably identify artefacts that could disrupt the described approach and cause an increase of uncertainty accompanied by a loss of data credibility. This step is not yet a part of the set of mathematical definitions of individual data processing steps. The main reason here is a significant increase in the necessary mathematical apparatus and, above all, the loss of direct control over the outputs of the data processing process. Therefore, so far, all data evaluated within the input task of data processing phase are checked visually. Based on this check, all data containing step changes in the measured steady signal from strain gauges after the gearbox has started operation are excluded from further processing. This symptom is a typical manifestation of the presence of the initial, resp. residual stress in the measured shafts. If we skip this step, we could obtain false absolute values of the actual torque on the measured shafts. However, since the results of FEA are at disposal, these artefacts are also reliably identified during the virtual calibration process described in
Section 2.2. The text above shows why the described method is such a robust tool, but also that there is still room for its further improvement to provide even more reliable and accurate outcomes. Therefore, it must be highlighted here that the above method is designed mainly for practical use to verify engineers’ expectations and to monitor the actual efficiency of gearboxes directly in their operational installations. Application of strain gauges directly to the gearbox input and output shafts eliminates the need to create space for torque sensors installation, which can affect the measured data, because the gearbox installation is altered. Therefore, we believe that the data obtained by the described method provide, in principle, as accurate as possible information about the operation of the gearbox in its working conditions and environment. Often, if there is enough space, we also install bridges to detect bending stresses in the measured shafts. This allows us to determine the quality of the gearbox installation or to assess the effectiveness of used couplings in this terms. In addition to the fact that bending usually reduces the efficiency of gearboxes, its presence always increases the risk of fatigue damages in their components. However, even in the torque recordings, much important information is hidden, from torsional vibrations, through manifestations of misalignments and ovalities, to projection of various defects mainly in gearings and bearings. Another interesting and, nowadays, more and more important issue is the monitoring of gearboxes efficiency in relation to the direction of power flow. This is especially important in gearboxes for rail vehicles where, in the run-up, the gearbox is loaded very lightly, and the direction of power flow changes repeatedly. Unfortunately, the deformation effect of this load on the gearbox shafts is usually, for our method, too low to obtain usable data. As a solution here, the above-mentioned use of structural and technical notches an be applied, because it can increase the sensitivity of our method so that it is able to provide reliable data again. Anyhow, the applicability of our method for these operating modes is here with our current equipment on its borderline and must be assessed on a case-by-case basis.
For most of the tested gearboxes, we cannot confirm a clear relation of its efficiency and its warming expressed by the oil or case of the gearbox temperature. Probably the simplest reason is the fact that the efficiency fluctuations in order of no more than low units of percents do not cause such changes in the operation of the gearbox in the time we have for measurement, which would increase or decrease the thermal emission for both passive and active lubrication gearboxes. It is also interesting to compare the efficiency maps generated by the engineers’ computional estimates with our maps obtained from real experiment. In general, they match very well; thus, it can be stated that the current relevant engineering software supported with the manufacturers experience are at such a level where they provide truly reliable data—especially for gearboxes of an established “classic” design. Larger deviations are found in gearboxes with an “experimental” or atypical design, which we perceive as proof of the still great importance of real experiments for technical development.
5. Conclusions
The aim of this article was to provide information on the method of experimental identification of the efficiency of gearboxes at the place of their final installation and to teach the reader about important steps and pitfalls that need to be taken and overcome in order to obtain useful and reliable data using this method. An important aspect of the presented method is the direct application of strain gauges to the shafts of the measured gearbox. In this way, the final installation of the gearbox is not affected; thus, the measurement provides the most relevant data as possible. Because the direct use of strain gauges outside the laboratory is usually associated with a number of technical complications, the article provides suggestions on how to work with them during installation so that they can provide the most accurate signal. The article also informs about the possibility to reliably record the signal from strain gauges in given conditions without its amplification by means of 24-bit A/D converters. The signal thus obtained is not filtered as part of its processing, so as not to lose or distort the information contained therein. Instead, it is statistically processed, and, based on the knowledge of its distribution functions, correct mean values and corresponding uncertainties of the measured torques and the searched mechanical efficiency of the tested gearbox are obtained. In addition, the records contain information about torsional vibrations of the measured shafts, about geometrical inaccuracies of cooperating gearbox components, about condition of the gears and bearings, and about other mechanical stresses the measured shafts are exposed to during the gearbox operation. Confronting these data with the outputs of other specialized measuring systems, it is possible to identify the causes of reduced efficiency or even the causes of gearbox failure. Additionally, as the main output of the presented method, the efficiency map of the tested gearboxes is presented. Using these maps, the areas of advantageous and, on the contrary, disadvantageous use of the tested gearboxes can be reliably identified. The biggest challenge for the near future in this context is to further increase the sensitivity of used equipment, so that it is possible to reliably measure the gearboxes for rail vehicles during run-up, when frequent changes in the direction of power flow occur. To achieve this aim, the development of our apparatus is still ongoing. Alternatives to the foil strain gauges are being searched, more efficient ways to store data and to communicate with the surrounding are being developed, and various ways of operating data-loggers even more economically and recharging their batteries without stopping the tested gearbox are being tried. If the last-mentioned task is successfully solved, the equipment can become a permanent part of big gearbox installations. In connection with the already common telemetry, which most often includes measurements of vibrations, noise, and temperatures, the entire system can provide truly comprehensive information about the current condition of the gearbox and its development over time. The method can thus provide useful data not only for the users of the tested gearboxes about their actual efficiency at the place of their final installation, but also for their manufacturers in development of new types and type series.


 ,
, 


