Article

The Influence of Calcium on the Growth, Morphology and Gene Regulation in Gemmatimonas phototrophica

1
Laboratory of Anoxygenic Phototrophs, Institute of Microbiology of the Czech Academy of Sciences, Novohradská 237, 37981 Třeboň, Czech Republic
2
Department of Plant Biophysics and Biochemistry, Institute of Plant Molecular Biology, Biology Centre of the Czech Academy of Sciences, Branišovská 1760/31, 37005 České Budějovice, Czech Republic
3
Department of Experimental Plant Biology, Faculty of Science, University of South Bohemia, Branišovská 1760/31a, 37005 České Budějovice, Czech Republic
*
Author to whom correspondence should be addressed.
Microorganisms 2023, 11(1), 27; https://doi.org/10.3390/microorganisms11010027
Submission received: 24 November 2022 / Revised: 14 December 2022 / Accepted: 16 December 2022 / Published: 22 December 2022
(This article belongs to the Special Issue Phototrophic Bacteria 2.0)

Abstract

:
The bacterium Gemmatimonas phototrophica AP64 isolated from a freshwater lake in the western Gobi Desert represents the first phototrophic member of the bacterial phylum Gemmatimonadota. This strain was originally cultured on agar plates because it did not grow in liquid medium. In contrast, the closely related species G. groenlandica TET16 grows both on solid and in liquid media. Here, we show that the growth of G. phototrophica in liquid medium can be induced by supplementing the medium with 20 mg CaCl2 L−1. When grown at a lower concentration of calcium (2 mg CaCl2 L−1) in the liquid medium, the growth was significantly delayed, cells were elongated and lacked flagella. The elevated requirement for calcium is relatively specific as it can be partially substituted by strontium, but not by magnesium. The transcriptome analysis documented that several groups of genes involved in flagella biosynthesis and transport of transition metals were co-activated after amendment of 20 mg CaCl2 L−1 to the medium. The presented results document that G. phototrophica requires a higher concentration of calcium for its metabolism and growth compared to other Gemmatimonas species.

1. Introduction

The bacterial phylum Gemmatimonadota was established by Kamagata in 2003 [1]. Its members are widespread and have been identified in diverse environments, such as soils, fresh waters, and sediments [2,3]. Until recently (2014), it contained only a handful of cultured heterotrophic species such as Gemmatimonas aurantiaca [4], Gemmatirosa kalamazoonensis [5], Longimicrobium terrare [6], and Roseisolibacter agri [7].
The first phototrophic member of the phylum, Gemmatimonas phototrophica, was isolated from a freshwater lake Tiān ér hú in the western Gobi Desert in Northern China [8]. It is a facultative photoheterotroph that requires oxygen for its growth and bacteriochlorophyll (BChl) synthesis [9,10]. G. phototrophica contains unique photosynthetic complexes with a double concentric ring antenna surrounding type-2 reaction centers (RC) [11,12]. Its genome contains a complete set of genes encoding RC and genes for BChl a biosynthesis organized in the photosynthesis gene cluster (PGC). The genes found inside the PGC of G. phototrophica are closely related to the genes from Proteobacteria, which suggests that Gemmatimonadota receive their PGC via horizontal gene transfer (HGT). Therefore, Gemmatimonadota is the only known phylum with a documented acquisition of the entire PGC via HGT event from a distant bacterial phylum [8,13].
Until recently, we cultured G. phototrophica on agar plates under semiaerobic conditions. Under these conditions it grew slowly with generation times between 2 and 4 days [10]. All the attempts to establish liquid cultures in the past few years have failed. This was quite puzzling, considering the fact that members of the Gemmatimonas genus seem to be mostly planktic species common in temperate freshwater lakes [14,15]. Moreover, the closely related species G. aurantiaca and G. groenlandica, as well as all other cultured Gemmatimonadota species, grow in liquid medium [15,16].
Growth is one of the main attributes that provides an ultimate measure of the metabolic activity of all living organisms [17]. Although bacteria have considerable metabolic versatility, they typically require only a limited number of macronutrients for growth, providing major elements (carbon, hydrogen, nitrogen, oxygen, phosphorus, and sulfur) as well as trace minerals, vitamins, or other growth factors. The challenge in this case was to establish how to provide the right substrates at optimal concentrations under the best physico-chemical conditions to allow the growth in liquid medium. The lack of established liquid culture under laboratory conditions significantly restricted further research on G. phototrophica. Basic experiments documenting phototrophic capacity were conducted with cells grown on agar plates (solid medium) [8,10], but many experiments became problematic as the agar-grown cultures suffered from poorly defined physiology and growth characteristics. Therefore, we decided to find suitable growth conditions for G. phototrophica in liquid medium.

2. Materials and Methods

2.1. Strains, Media and Growth Conditions

The experiments were conducted with the bacterium G. phototrophica AP64 (DSM 29774T). The previously described growth medium R2A+ was used to culture the cells on agar plates [8]. However, this medium was modified in order to test various nutrients to increase the yield of biomass. Different agar sources like BactoTM Agar (BD Biosciences, Sparks, MD, USA), Plant agar (Duchefa Biochemie, Haarlem, The Netherlands) and Micro agar (Duchefa Biochemie, Haarlem, The Netherlands) were assayed. Different carbon sources, vitamins and microelements were tested for the growth of cells on agar plates. Following the results obtained on agar plates, the growth experiments were performed with liquid media. Initially, the cells were streaked on agar plates and incubated for two weeks in microaerophilic conditions (10% O2 + 90% N2) at 28 ± 1 °C, and pH 7.7 in the dark. The individual colonies were picked from the agar plates and then transferred to liquid medium for continuous cultivation. The cells were grown in liquid medium containing (L−1) 0.5 g yeast extract, 0.5 g peptone, 0.3 g pyruvate, 0.5 g glucose, 0.5 g soluble starch, 0.3 g K2HPO4, 1 mL of modified SL8 trace metal solution (mL−1: 190 µg CoCl2.6H2O, 5.2 mg Na2-EDTA, 24 µg NiCl2.6H2O, 17 µg CuCl2.2H2O, 70 µg ZnCl2, 20.3 mg MgCl2, 62 µg H3BO3), and 1 mL of vitamin solution (mL−1: 200 µg B1, 20 µg B3, 10 µg B7, 10 µg B12) at 28 ± 1 °C and pH 7.3. If not stated otherwise, the concentration of CaCl2 used to obtain liquid cultures was 20 mg L−1. Cultures were incubated aerobically in Erlenmeyer flasks with cotton plugs on an orbital shaker (150 RPM) at 25 ± 1 °C in the dark for 8–10 days. At the beginning of each experiment, 1 mL of the inoculum (approx. OD600 = 0.25) was diluted in 100 mL of a fresh medium (equivalent to 1% v/v to the fresh nutrient media). The nutrient tests were made in duplicates depending upon the nutrient being tested. The effect of different nutrient sources on the growth were tested for both the presence and absence of the corresponding substrate. The growth response of G. phototrophica was tested and confirmed with semi-liquid agar slants and full liquid media at different concentrations of oxygen (atmospheric: 100%, 80%, and ∼0%, v/v) in the headspace of the medium. The liquid media were supplied with the corresponding mixture of sterile nitrogen and oxygen. In order to determine the optimal growth temperature, the cells were grown in the liquid media over the temperature range of 25–30 °C (± 1 °C). The optimal pH was tested in liquid media with pH ranging from 7.3 to 8.0 at 25 °C (± 1 °C). The pH values of the medium were adjusted prior to autoclaving the medium and were measured again at the end of the experiment to ensure that the pH had not changed during the experiment. The nutrient tests were made in duplicates depending upon the nutrient being tested. The effect of different nutrient sources on the growth was tested for both the presence and the absence of the corresponding substrate. The growth of the cultures was monitored by turbidity measurements at 600 nm using the DEN-600 photometer (Biosan SIA, Latvia). For some experiments, the closely related phototrophic bacterium G. groenlandica TET16 (DSM 110,279 T) was grown for comparison.

2.2. Transcriptome Sequencing and Analysis

Cells were harvested by centrifugation (8000 × g for 3 min, 4 °C). Pellets were resuspended in 1 mL PGTX extraction solution [18] and immediately frozen in liquid nitrogen. Cells were transferred into 2 mL Eppendorf tubes and immediately frozen in liquid nitrogen and stored at –80 °C until extraction. RNA was extracted as described earlier [19]. The RNeasy kit (Qiagen, the Netherlands) was used for purification according to the manufacturer’s protocol. The first digestion of genomic DNA was performed on the column, using DNase I (Qiagen, The Netherlands) as described by the manufacturer. Total RNA was eluted in 88 μL RNase-free H2O, and the second DNase I digestion was made in solution, followed by a second RNeasy purification step, which included an additional washing step with 80% ethanol done before elution with 30 μL RNase-free water.
Libraries were generated according to Shishkin et al. [20] including rRNA removal with the RiboZero Kit (Illumina Inc., San Diego, CA, USA). The library was sequenced on a NovaSeq 6000 (Illumina Inc., USA) in paired-end mode with 100 cycles in total using the FASTQ-mcf suite (https://github.com/ExpressionAnalysis/ea-utils accessed on 20 December 2021). The image analysis and base calling were performed using the Illumina pipeline v 1.8 (Illumina, San Diego, CA, USA). Raw reads were processed, and differential gene expression was assessed as described before [19]. Low-quality bases (Phred score < 30) and Illumina adapters were clipped. Briefly, quality filtered reads were mapped to the AP64 genome (NCBI RefSeq accession GCF_000695095.2) using bowtie2 [21]. FeatureCounts was used to assess the number of reads per gene [22]. Normalization and identification of significantly differentially regulated genes (FDR < 0.01, absolute log2 fold change (log2FC) > 1) were performed with edgeR [23]. The heatmap was generated with the package pheatmap. Hierarchical clustering based on the Euclidian distance of log2FC data was used to cluster genes. The obtained tree was cut into three clusters based on the branching points.

2.3. Procedure for Acid Digestion of Cells and Elemental Analysis with Inductively Coupled Plasma Mass Spectrometry (ICP-MS)

The 40 mL of cell culture was collected onto mixed cellulose ester (MCE) filters (Millipore, porosity 0.45 µm, diameter 25 mm) using gentle vacuum. The filter was washed by an equal amount of distilled water and placed in a desiccator containing silica gel. Once it was completely dry, the weight of the sample was determined by subtracting the initial weight of the MCE filter from the final weight of the MCE filter. Due to handling of small amounts of biomass, it was decided to digest the MCE filter membrane. MCE filter membranes were chosen as these can be digested easily with the protocol mentioned in Andresen et al. [24] contrary to other types of filter membranes. The filters were weighed with and without biomass and digested with a mixture of 85 mL/100 mL of 70% HClO4 (Suprapur® grade, Carl Roth, Karlsruhe, Germany) and 15 mL/100 mL of 69% HNO3 (Ultrapur® grade, Karlsruhe, Germany) in Duran glass tubes as mentioned in Andresen et al. [24]. The digestion was done using a Fuji PXG4 Thermoblock (AHF Analysentechnik AG, Germany), and after evaporation of the acid mix and cooling down, 0.5 mL of 5% HCl (Ultrapur® grade, Carl Roth, Karlsruhe, Germany) was added to each test tube to re-dissolve the salts. The glass tubes were heated to 90 °C for 1 h to obtain clear solutions. The final volume of 1.5 mL was set with ddH2O. Appropriate dilutions were done with 0.2% HNO3. Indium was added as an internal standard at 1 ng mL−1 to each test solution. The ICP multi-element standard solution VI (Merck KGaA Darmstadt Germany) was used to prepare standard curves. Analyses were done using the sector field ICP-MS (ICP-sfMS) Element XR-2 with a jet interface (Thermo Fisher Scientific, Bremen, Germany). Triplicate measurements of each technical replicate were made with lowest possible relative standard deviations. The instrument was tuned for least oxide ratios and maximum sensitivity. The potential interferences on the analyte of interest Ca44 were 27Al17O, 26Mg18O, 12C16O16O, 14N14N16O, 28Si16O etc., mainly eliminated with selection of high resolution 10000, which successfully resolves all these possible interferences. Other interferences on other analytes were dealt with medium resolution 4000.

2.4. Transmission Electron Microscopy

For transmission electron microscopy (TEM), the sample was concentrated by centrifugation at 3000 rpm for 3 min. Sample (4 μL drop) was applied to carbon coated copper grids (mesh 400) for 1 min followed by washed in two drops of water. Then a 4 μL drop of 1.2% aqueous uranyl acetate solution was applied on the grid for another 1 min and dried. The grids were visualized using Jeol JEM 1400 microscope at an operating voltage of 120 kV for detecting the cell morphology and flagella.

2.5. Statistical Analysis

Data analyses were performed using Sigma Plot (version 14.0). The data were analyzed for normal distribution using the Kolmogorov–Smirnov test. Multiple comparisons were carried out by one-way analysis of variance (ANOVA) and Tukey’s post hoc test (parametric data), Kruskal–Wallis and Dunn’s post hoc tests were used for the non-parametric data. The results are presented as mean ± SD, and p-values < 0.05 were considered statistically significant.

3. Results

3.1. Medium Optimization

There may be two possible explanations as to why G. phototrophica did not grow in liquid medium: (1) G. phototrophica is an organism naturally growing in biofilm and thus prefers the growth on solid medium, or (2) agar provides some vital nutrients, which are not present in the current formulation of the liquid medium. To test these two hypotheses, we grew the cells on a solid nutrient medium containing either regular bacteriological agar or pure agarose for molecular biology. Pure agarose was used since it does not contain any undefined nutrients, but it still serves as a gelling agent providing a support for the bacterial biofilm.
The agar and agarose plates were inoculated and incubated for 14 days in a desiccator in the dark under reduced oxygen tension (10% O2). G. phototrophica grew on the agar but not on the agarose plates. This result indicated that the agar likely provides some vital nutrient(s) for G. phototrophica growth. Therefore, we performed a systematic search for the missing nutrient(s) in the growth of G. phototrophica on the agar plates. First, we tested growth on different agars. The growth of the G. phototrophica cells was found to be best on BactoTM Agar followed by Micro agar and Plant agar. Utilization of different compounds as a carbon source was assayed on the agar plates containing BactoTM Agar. Carbohydrates like rhamnose, trehalose, erythritol, adonitol, melibiose, and dulcitol were tested. We noticed that the growth of the G. phototrophica cells was either not improved or delayed. Vitamins like folic acid, para-aminobenzoic acid, niacin, thiamine, riboflavin, nicotinamide, cobalamin, and pyridoxine hydrochloride were tested on BactoTM Agar plates. It was found that these vitamins were not indispensable sources but played a role in improving the growth of the G. phototrophica. With the results obtained from culturing on the agar plates with different combination of nutrient sources, we started to culture the cells in the modified liquid medium containing the nutrients which had the best effect on the growth. Since medium for cultivation of phototrophic bacteria often contains additional elements which are not part of the original R2A+ medium, we tested them separately. The inorganic components such as Co2+, Sr2+, SiO32-, Mn2+, Ni2+, Zn2+, Cu2+, and Ca2+ were added to test the growth. The strongest effect was observed with calcium, where the addition of 50 mg L−1 CaCl2 into the liquid medium resulted in an ample growth of G. phototrophica cells within 7 days (Figure 1). We also determined the optimal growth pH and temperature for growth in liquid medium in a different temperature and pH range. We found that the optimal growth temperature is between 26–28 °C and the optimal pH is 7.3–7.5.

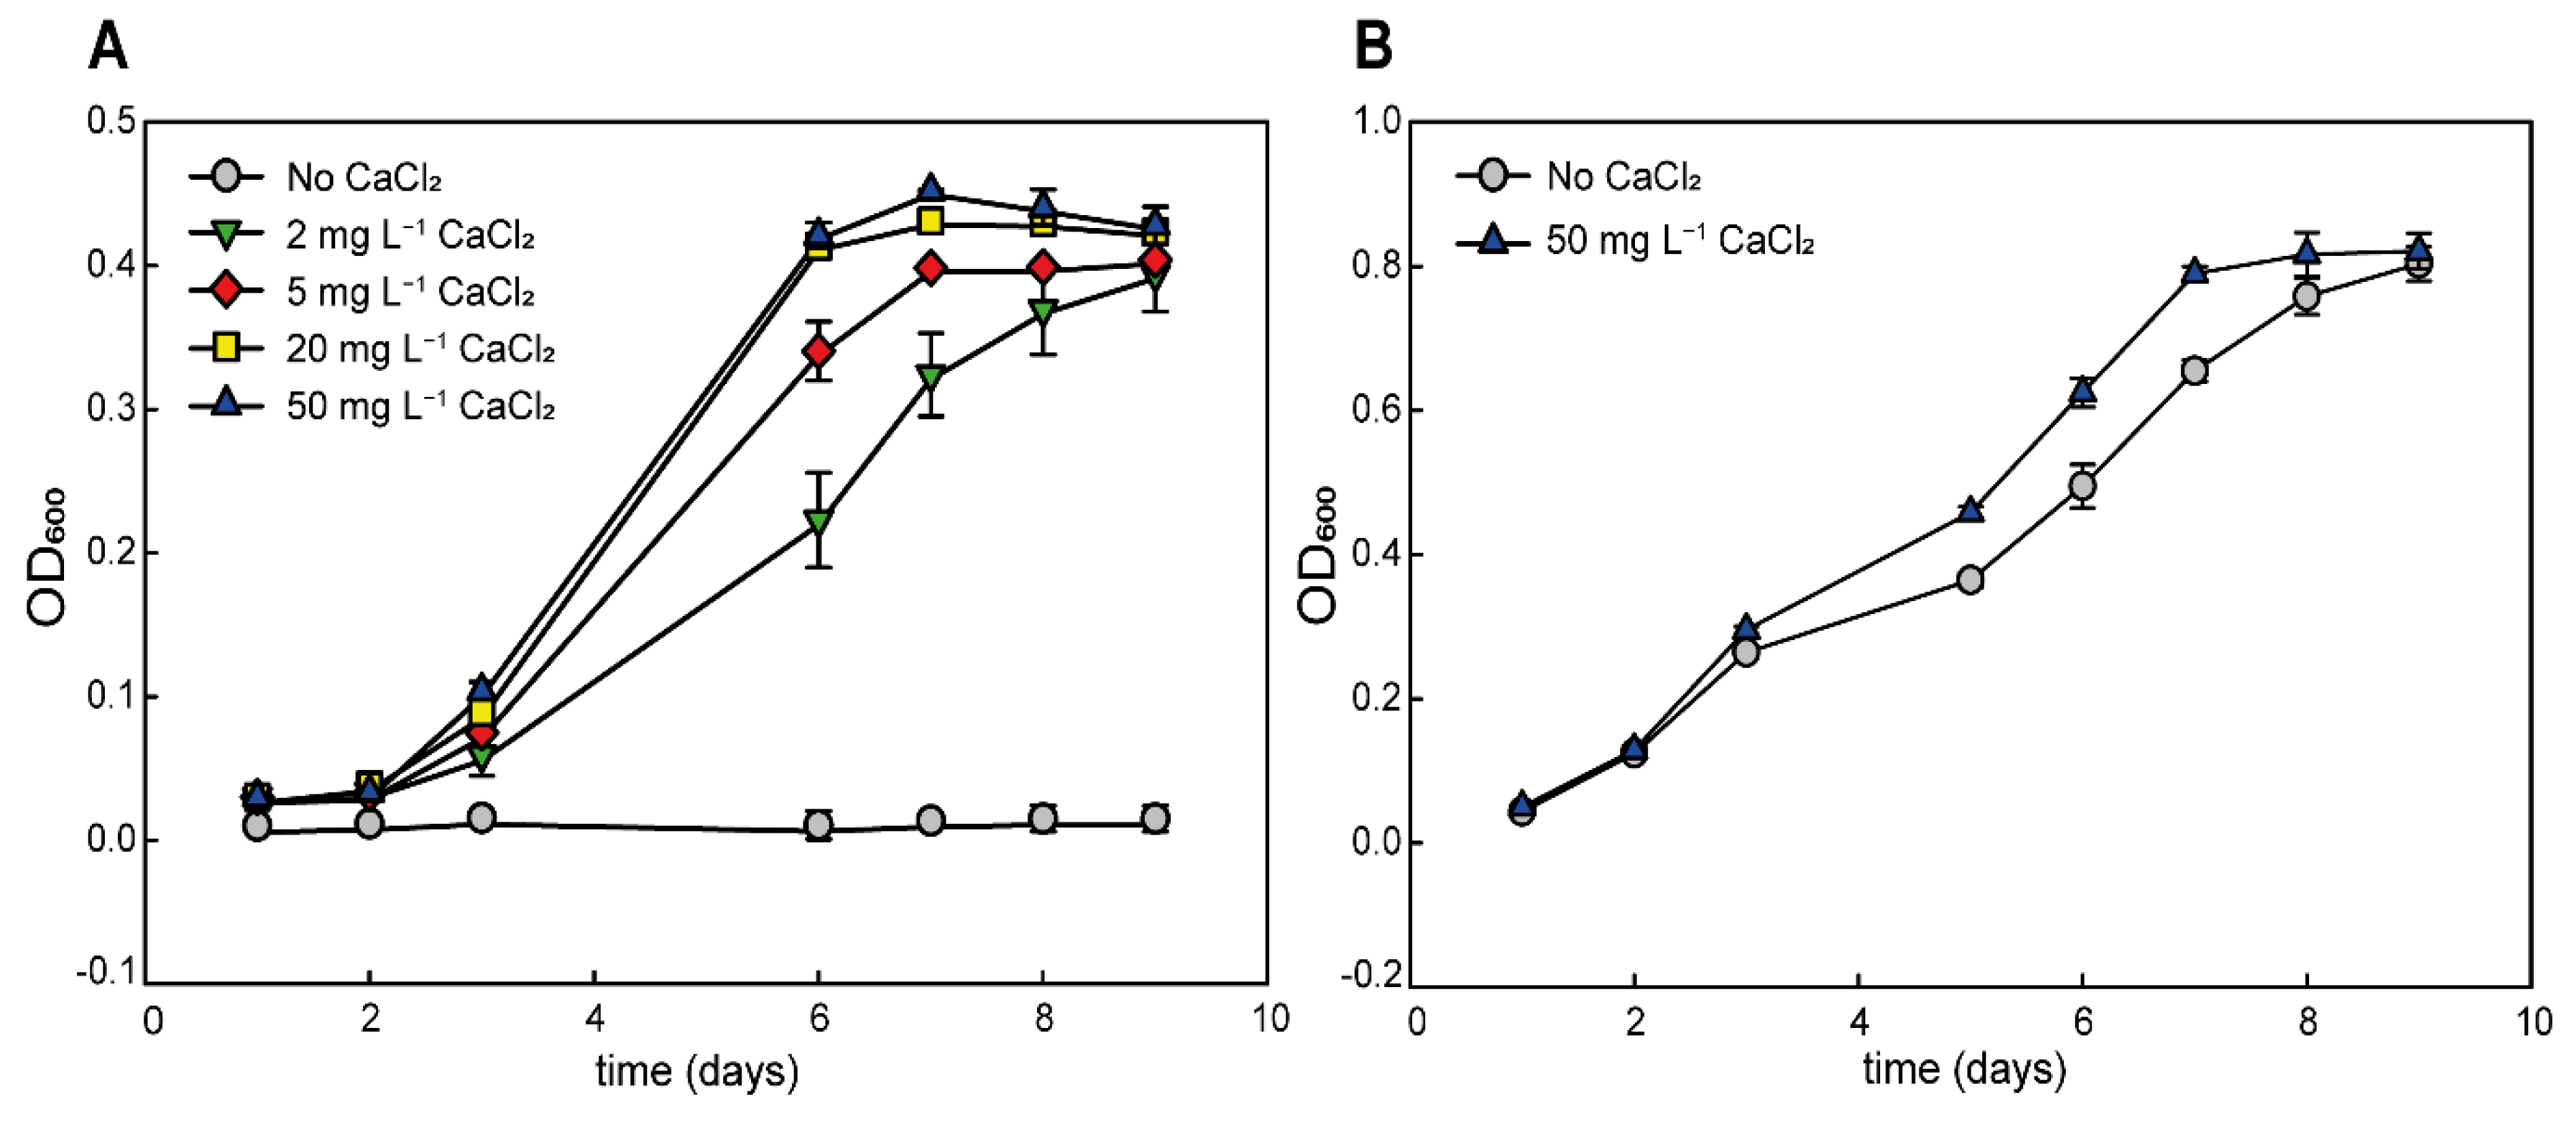
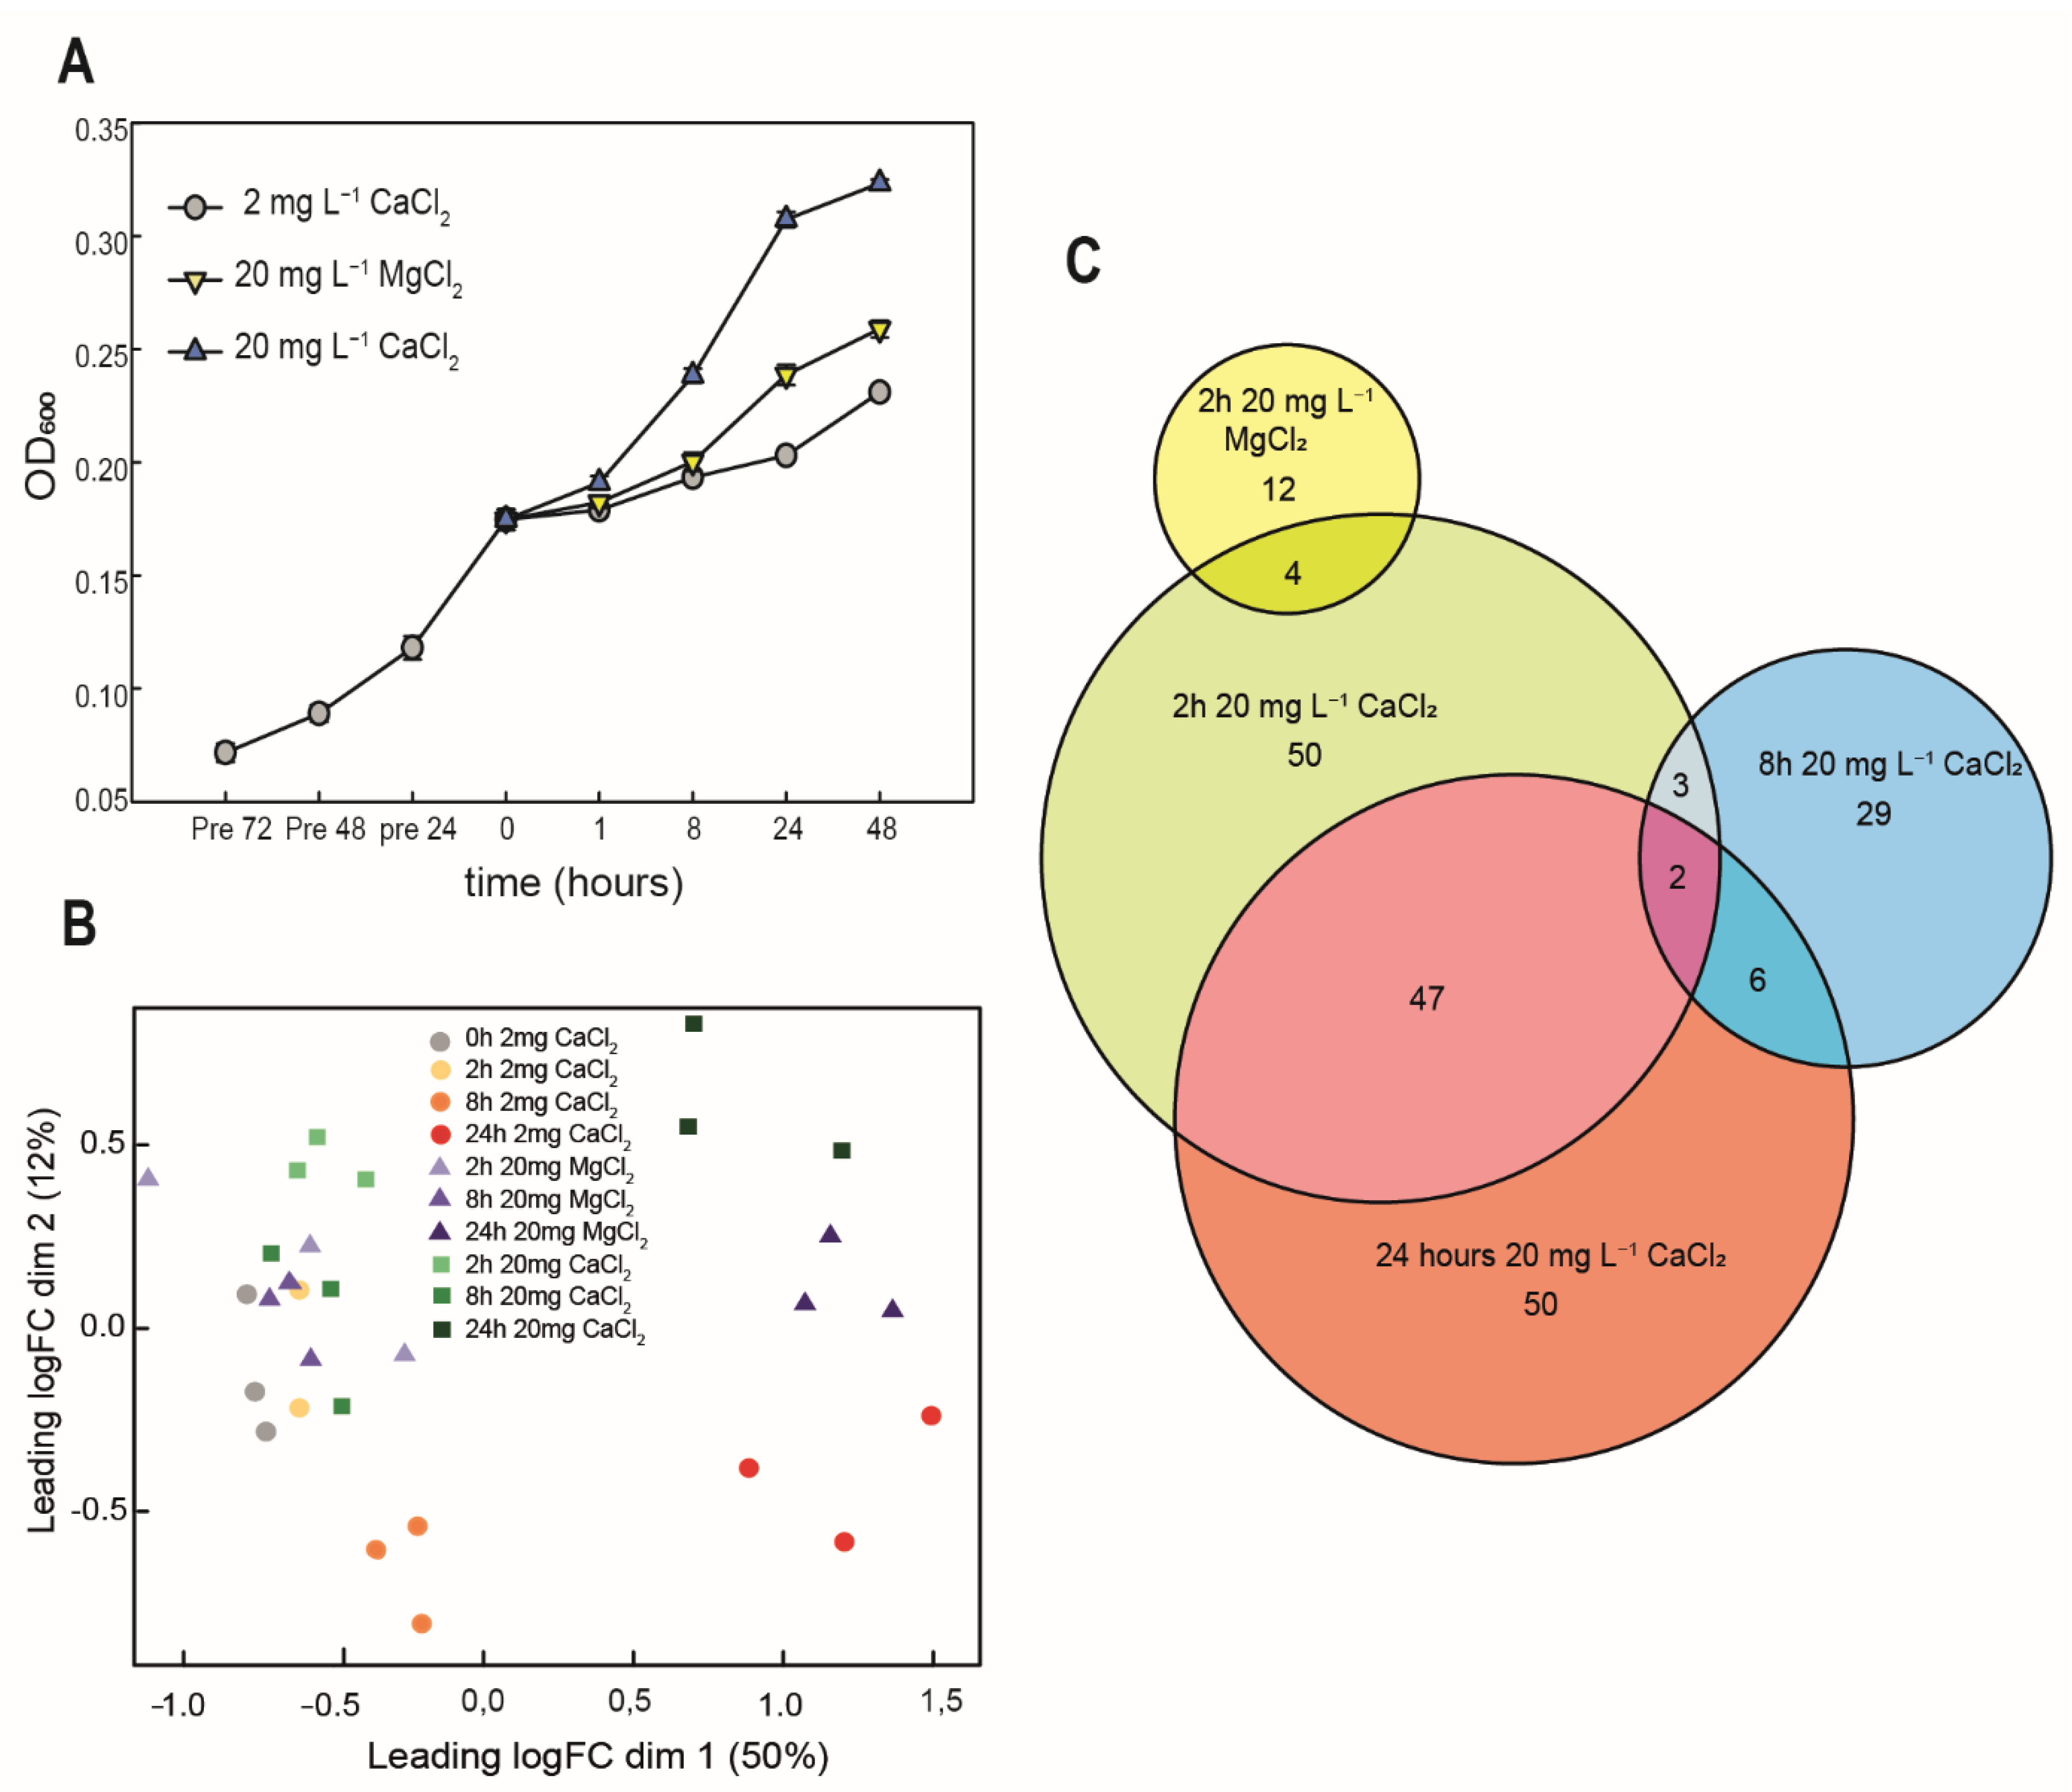
3.2. Calcium Requirement

We tested the growth of G. phototrophica in liquid medium with different concentrations of CaCl2 to detect the minimum and optimum concentration of CaCl2. Addition of 2 mg L−1 CaCl2 was sufficient to induce the stable growth of the cells. The best growth of the cells was observed at 20 mg and 50 mg L−1 CaCl2 (Figure 2A). Higher CaCl2 concentrations were not tested, since they caused the precipitation of the phosphate present in the medium. We also conducted the same control experiment with G. groenlandica, a close relative of G. phototrophica. However, this bacterium grew well even in liquid medium without added calcium (Figure 2B), which showed that G. phototrophica requires higher calcium concentrations for its growth when compared to other members of Gemmatimonas genus.
The morphology of G. phototrophica cells was observed by electron microscopy. The cells grown in 20 mg L−1 CaCl2 had dimensions of 2.25 × 0.7 µm and had a single flagellum with a length ranging between 3.9 to 7.5 µm (Figure 3). In contrast, the cells grown on low calcium medium were elongated with dimensions of 3.9 × 0.6 µm, and the flagella were frequently missing (Figure 3). The G. groenlandica cells grown in 20 mg L−1 CaCl2 and 50 mg L−1 CaCl2 were rod-like, whereas the G. groenlandica cells grown in 2 mg L−1 CaCl2 were elongated. Interestingly, its flagella were fully developed and up to 10 µm long in all the cases (Figure 3).
To establish the specificity of the calcium effect, we performed an experiment where calcium was substituted with either magnesium or strontium, which are also divalent cations from the same group in the periodic table of elements. While addition of magnesium did not have any strong effect (magnesium was a part of the original medium composition), strontium was able to support growth of G. phototrophica in liquid medium. We observed that the addition of SrCl2 facilitated the growth of G. phototrophica, although the growth rate was significantly lower when compared to medium amended with calcium (Figure 4).
Calcium has two main roles in various organisms. Either it is required to build inorganic structures in the cells such as shells or skeletons, or it is required for more specific purposes like enzymatic actions or assembly of specific biological complexes. To discriminate between these two options, we measured the amount of calcium in G. phototrophica biomass using ICP-MS. The content of calcium in the cells increased with the amount of calcium in the culture medium ranging from 6.76 × 10⁻³ to 8.79 × 10⁻³ calcium per DW (w:w). Interestingly, the calcium content in control cells of G. groenlandica was more similar to the G. phototrophica cells cultured in low calcium (Figure 5A). This result suggests that G. phototrophica requires somewhat higher cellular levels of calcium for its physiology and metabolism. The ICP-MS analysis furthermore documented that the relative content of strontium was higher in the cells grown in the calcium-limited medium (Figure 5B), which is consistent with the observation that strontium can partially substitute for calcium.

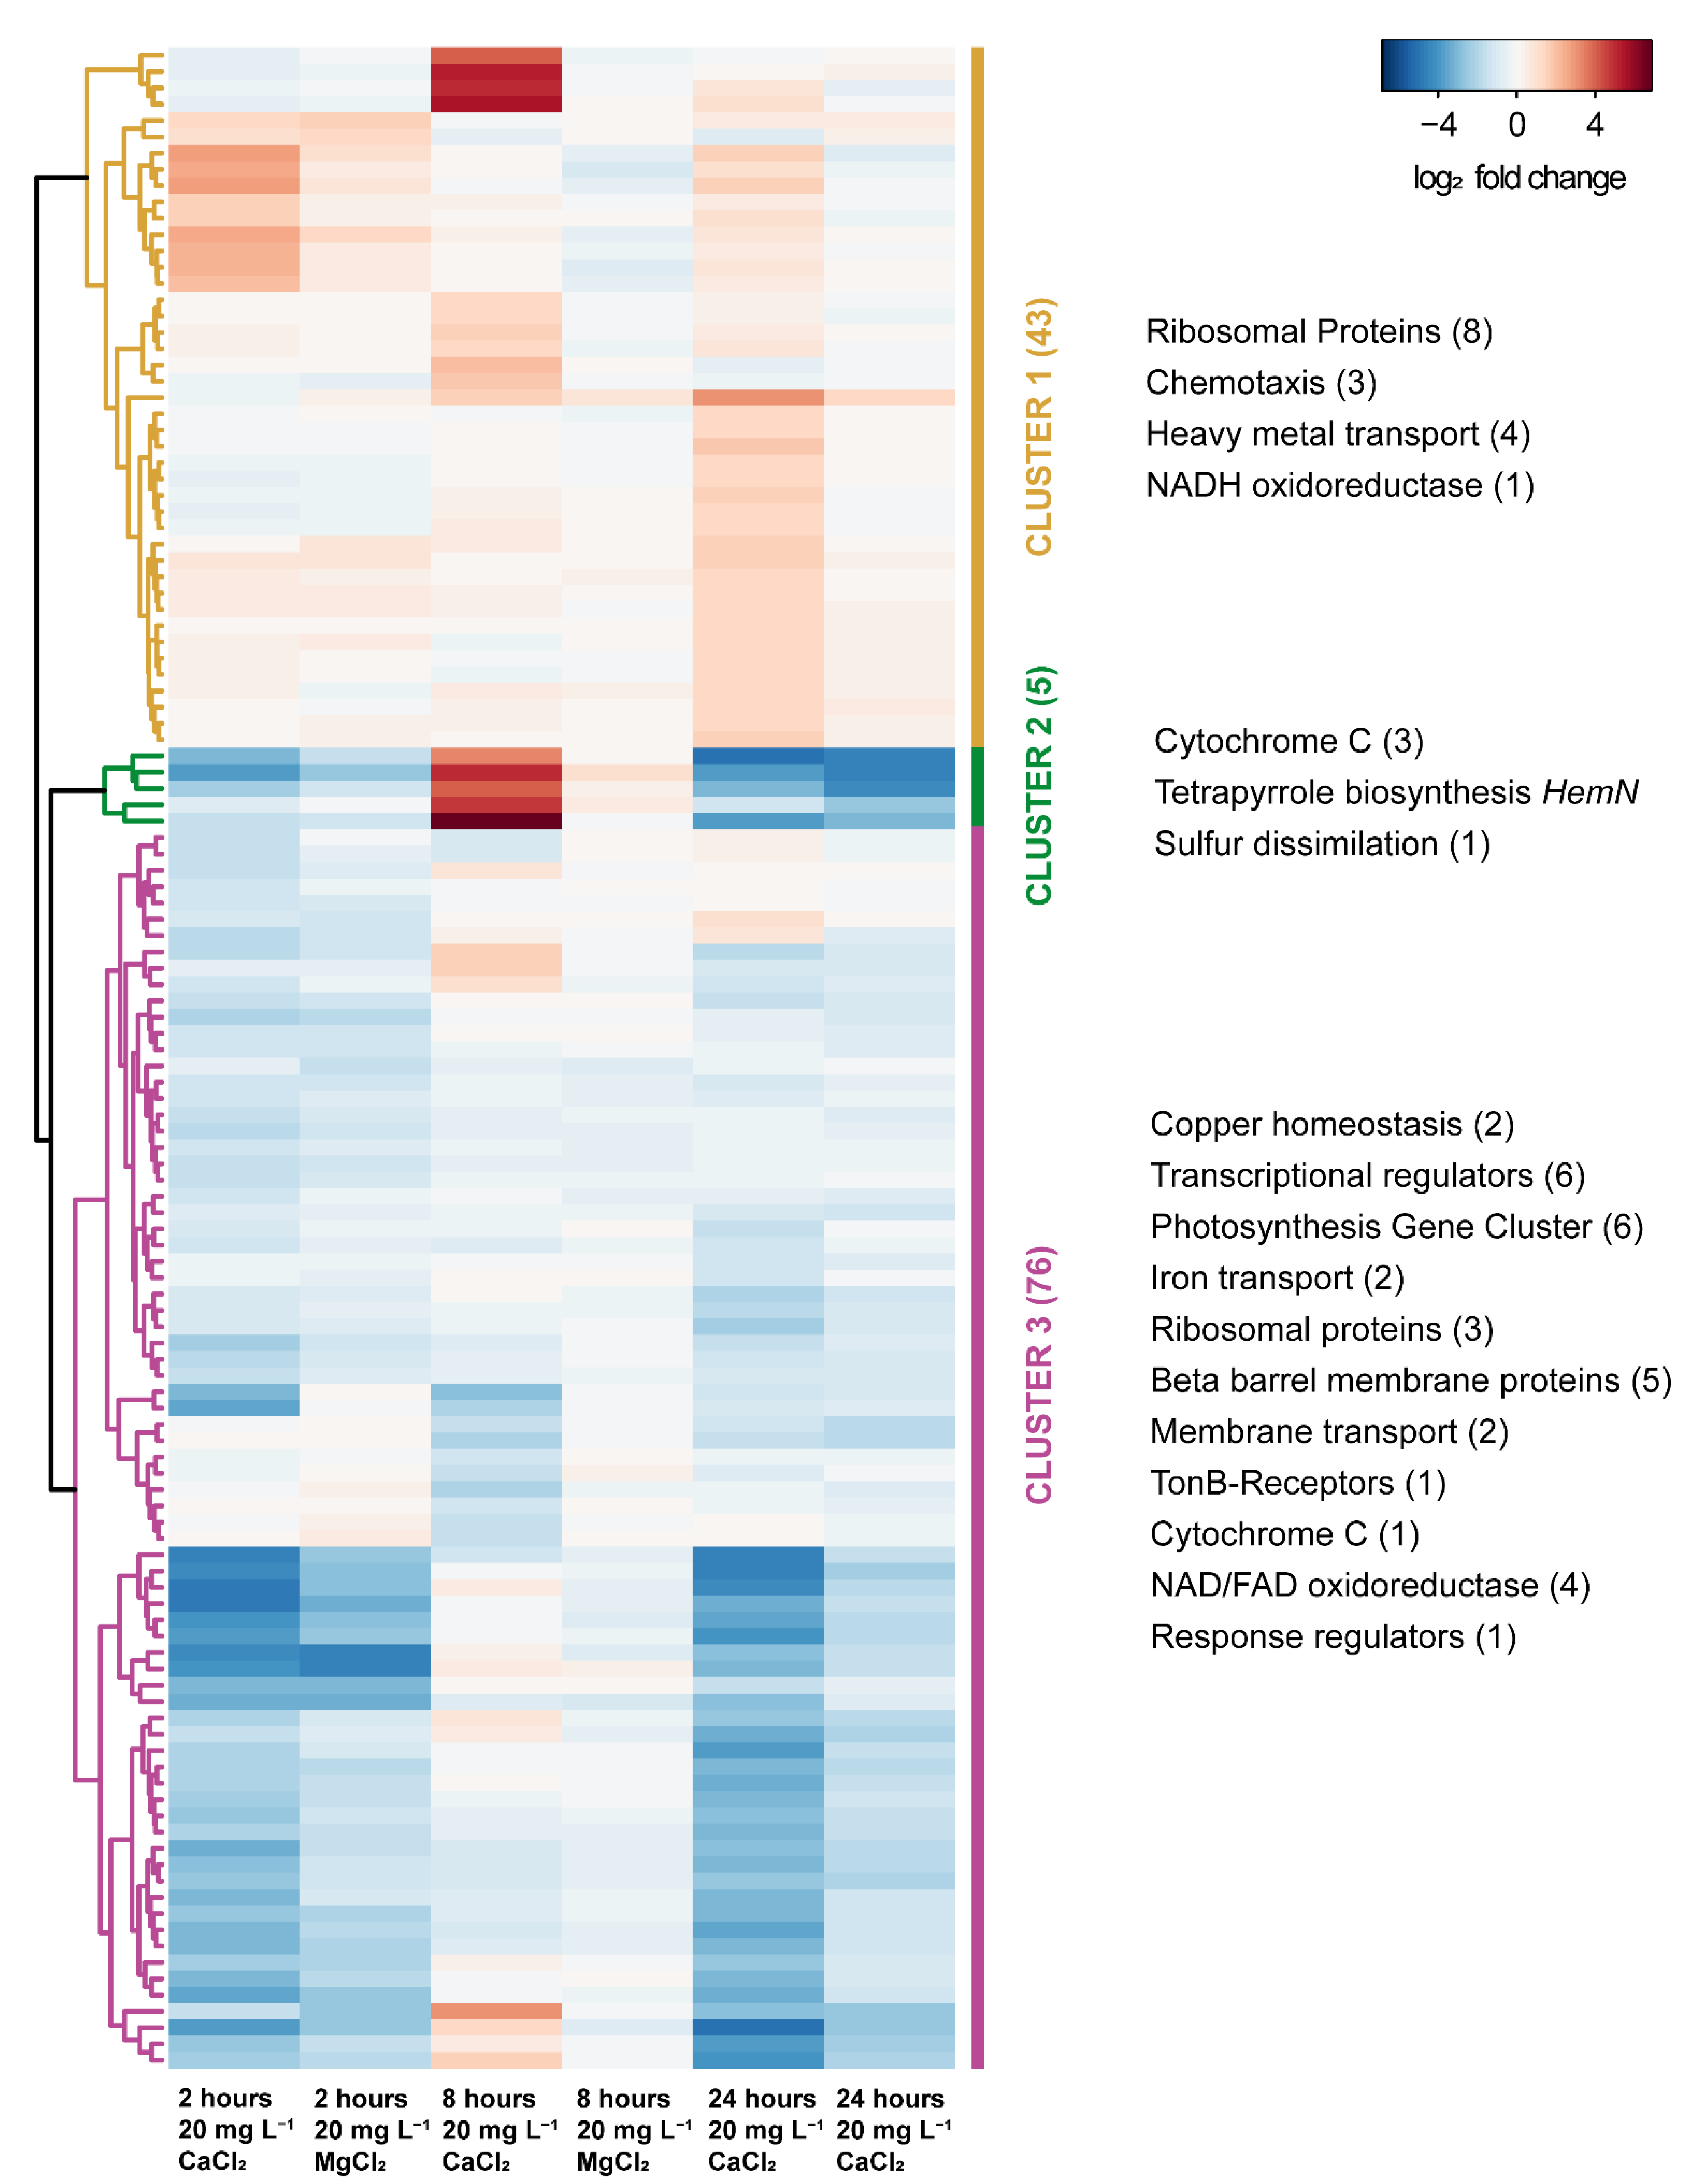
3.3. Transcriptome Response to Calcium Amendment

To identify which genes are activated after calcium amendment, we grew G. phototrophica in medium containing 2 mg L−1 CaCl2. After 3 days, the cultures were amended with 20 mg L−1 CaCl2, or 20 mg L−1 MgCl2 (Figure 6A). The gene expression profiles were analyzed for all treatments before as well as 2, 8, and 24 h after the respective amendments (Supplementary Dataset S1 and S2).
The obtained sequencing depth varied between 350,000 and 15 Mio. with a median of 7.5 Mio. reads. For data quality control and to check the reproducibility of independent replicates, we performed multidimensional scaling (MDS). The samples grown with different concentrations of CaCl2 and MgCl2 followed distinct trajectories separating them by time on the x-axis and by amendment on the y-axis (Figure 6B). We identified in total 203 differentially expressed genes (DEGs), in which 74 were upregulated and 129 were downregulated when comparing 20 mg L−1 CaCl2 vs. 2 mg L−1 CaCl2. A total of 67 DEGs were identified when comparing 20 mg L−1 MgCl2 vs. 2 mg L−1 CaCl2, in which 4 were upregulated and 63 were downregulated. A complete list of DEGs can be found in Supplementary Dataset S1.
Genes associated with membrane transport were differentially regulated in 20 mg L−1 CaCl2 at 2 h, 8 h and 24 h. Cells grown in 20 mg L−1 CaCl2 at 2 h and 24 h showed a similar number of DEGs and a relatively similar log2 fold change (log2FC). There was an overlap of 47 DEGs between 2 h and 24 h, whereas 8 h showed a little overlap with 2 h and 24 h in the cells grown with 20 mg L−1 CaCl2 (Figure 6C). There was no overlap of the DEGs between time points in the cells grown with 20 mg L−1 MgCl2. However, there was an overlap of 4 DEGs between the cells grown with 20 mg L−1 MgCl2 and 20 mg L−1 CaCl2 at 2 h (Figure 6C).
One locus (GEMMAAP_RS18425-18450) containing the respiratory enzymes involved in oxidative phosphorylation such as the cytochrome c oxidase accessory protein (CcoG), cbb3−type cytochrome oxidase assembly protein (CcoS), c−type cytochrome and cbb3−type cytochrome c oxidase subunit 3, was significantly upregulated in the 20 mg L−1 CaCl2 compared to 20 mg L−1 MgCl2 at 8 h. Also, another locus (GEMMAAP_RS19165-19180) containing genes involved in tetrapyrrole synthesis such as the oxygen independent coproporphyrinogen III oxidase, bchJ, magnesium protoporphyrin IX monomethyl ester anaerobic oxidative cyclase, bchE, and protoporphyrinogen oxidase, hemJ outside of the PGC, was significantly upregulated in the 20 mg L−1 CaCl2 compared to 20 mg L−1 MgCl2 at 8 h. Interestingly, all these genes were downregulated at 2 and 24 h, respectively (Figure 7). In contrast, the genes encoding enzymes for bacteriochlorophyll synthesis and encoded in the PGC showed a slightly decreased expression with CaCl2 only.
In particular, we were interested in the possibility of knowing the key role of calcium ions in the regulation of the calcium transport pathway of G. phototrophica. The chemotaxis protein CheA (GEMMAAP_RS15835) and methyl-accepting chemotaxis protein (GEMMAAP_RS00390), the integral membrane protein involved in the flagellar-motor complex showed a specific upregulation in 20 mg L−1 CaCl2, whereas both genes were downregulated in 20 mg L−1 MgCl2 at 8 h after amendment. The response to the 20 mg L−1 CaCl2 amendment was mostly acute and restricted to 8 h (Figure 7). The DEGs were associated with the organization of cellular components and membrane transport. We also found that the heme proteins and the two genes coding for the cation-transporting P-type ATPase involved in proton pumping (GEMMAAP_RS13065 and 18445) were significantly upregulated at 8 h for 20 mg L−1 CaCl2 compared to 20 mg L−1 MgCl2 (Figure 7).

4. Discussion

The objective of the presented study was to optimize the medium composition in order to establish liquid cultures of G. phototrophica. During the process, we found that its growth was primarily restricted by the lack of calcium. Besides, we did not find any other nutrient source bolstering its growth in liquid as explained in the results section. The established threshold of 20 mg L−1 CaCl2 corresponds to 7.2 mg Ca2+ L−1. In a recent report, it is described that the global median concentration of calcium in freshwaters is 4 mg L−1 [25]. The study documented that calcium concentrations are strongly linked to alkalinity, with the highest calcium and carbonate levels found in freshwaters with a pH around 8.0. In contrast, acidic lakes also have low Ca2+ concentrations, which may seriously limit the growth of G. phototrophica in these waters.
The higher calcium requirement also explains why G. phototrophica could have been grown on agar media [8,26]. Agar itself contains approximately 1 g of calcium per kg, which for 2% agar results in 20 mg calcium per L of agar medium. This concentration was fully sufficient to support growth. In contrast, the calcium content in peptone was almost nil and in yeast extract was only ~0.5 g per kg, which did not provide a sufficient enough amount to support the growth in liquid medium.
Intense research documented that calcium has multiple roles in eukaryotic organisms. Calcium plays a central role in various eukaryotic cellular functions and processes, predominantly via the action of cell signaling. Such roles include cell motility, proliferation, growth, calcification, flagella development, neurotransmission and many other biological processes [27,28,29,30]. Cells have to adapt to environmental changes by signal transduction and calcium ions often play the role of a versatile messenger, which transmits signals from the cell surface to the interior of the cells [27]. Calcium signaling is forced through the presence of concentration gradients across cellular membranes, as there are fewer calcium ions within the cell compared to extracellular concentrations [31]. However, excess calcium within the cytosol can cause subsequent deleterious effects, therefore a low cytosolic calcium concentration is ideally maintained by the action of calcium pumps, the process of chelation, or calcium compartmentalization in eukaryotes [32].
Much less is known about the specific role of calcium in prokaryotic cells. Calcium is required for the bacterial cytochrome c oxidase [33,34,35], which is in agreement with our finding that genes for this enzyme were up-regulated when more calcium was supplied. It is reported that calcium ions may play an essential role in chemotaxis, cell cycle, and competence by using calcium ions from an external source and calcium antagonists in prokaryotes [36,37,38]. However, direct evidence of the role of intercellular calcium ions in prokaryotes is still poorly understood and remains to be elucidated [39,40]. It is also reported that calcium impacts the control of gene expression and cytoskeletal reorganization in bacterial pathogens [41]. Bacteria maintain cytosolic calcium. It has previously been shown that the free cytosolic calcium levels maintained by the prokaryotic cells are quite low (100–300 nM) [42,43]. However, the molecular mechanisms by which the calcium levels are maintained remains unanswered
In the presented study we have observed that cells grown in low calcium concentrations were frequently elongated, which signaled possible problems with cell division and formation of the cytoskeletal complexes. We found many genes that are involved in cell division to be upregulated in the 20 mg L−1 CaCl2 compared to the 2 mg L−1 CaCl2. There are reports on the formation of elongated or filamentous cells in many species such as B. subtilis instead of the bloated and spherical cells in the absence of cytoskeletal proteins involved in the assembly of the cytoskeletal complexes [44]. It is apparent that cells grown in low calcium concentration lack flagella compared to cells grown in high calcium concentration as mentioned in the results. We found the chemotaxis and fli genes which are involved in flagella formation were slightly upregulated in cells grown in high calcium concentration.
We found that the calcium content was about 20% higher in the cells grown in 20 mg L−1 CaCl2 when compared to the cells grown in 2 mg L−1 CaCl2. This suggests that the G. phototrophica cells require higher calcium concentration in their cells. Recent reports showed that calcium has control over the formation and activity of the cytoskeleton by modulating the proteins associated with the structural organization [30]. The growth and division of bacterial cells are tightly coordinated with the cytoskeleton to maintain its structural integrity [45,46]. The cytoskeleton gives an order to a cell, and in large cells, where diffusion may become limiting, it facilitates the transport of the metabolites in the cell [47]. Some bacteria have the capability to store calcium ions in membrane-bound structures. Since it has been reported in E. coli that the cytosolic free calcium is regulated through influx and efflux [39], we aimed to identify putative genes involved in calcium efflux pathways. It was expected that proteins involved in calcium efflux will be upregulated in the cells grown at higher concentrations of calcium, whereas those involved in calcium influx would be downregulated. However, we did not find the regulation of proteins involved in calcium signaling in this study.
The performed transcriptome analysis documents upregulation of genes linked to cell division, RNA synthesis, photosynthesis and respiration in the 20 mg CaCl2 L−1 compared to 20 mg MgCl2 L−1. There are several studies indicating that calcium ions play a regulatory role in the physiology of prokaryotes [39,48,49,50,51,52]. The transcriptomic analyses in Escherichia coli and Bacillus subtilis revealed that the expression of hundreds of genes is regulated by changes in calcium ions in response to increased calcium levels from external sources [39,50]. They reported that the processes such as flagella formation, biofilm matrix production, iron acquisition, polysaccharide production and general stress response were affected. We also found that genes such as calcium transporting ATPase and large conductance mechanosensitive channel MscL, to which calcium is specifically bound and acts as cofactor, were not significantly upregulated in high calcium.

5. Conclusions

In conclusion, the presented study shows that G. phototrophica requires a higher concentration of calcium than related microorganisms for its growth in liquid medium. While calcium is known to be required, e.g., for bacterial respiration due to its role in cytochrome oxidase, the elevated requirement here was unexpected and furthermore affected the regulation of genes involved in tetrapyrrole biosynthesis, cell division, transition metal transport, and other fundamental cellular pathways. Yet, the exact role of calcium in G. phototrophica still has to be determined. Now with the established liquid growth conditions, much more detailed research on its physiology, regulation, and metabolism can be undertaken.

Supplementary Materials

The following supporting information can be downloaded at: https://www.mdpi.com/article/10.3390/microorganisms11010027/s1, Figure S1. pure cultures of G. phototrophica growing on the agar but not on the agarose plates. Dataset S1 and S2: Transcriptional response of G. phototrophica to Ca2+ or Mg2+ amendment.

Author Contributions

Conceptualization, S.S., J.T. and M.K., Methodology, S.S., J.T., N., S.N.H.B. and H.K., Investigation, S.S., M.K.S., N., S.N.H.B. and H.K., Data Curation, S.S., J.T., K.K. and M.K., Writing—original draft preparation, S.S. and M.K.; reviewing and editing, all authors; funding acquisition, M.K. All authors have read and agreed to the published version of the manuscript.

Funding

This research was financially supported by the Czech Science Foundation (project PhotoGemm+ GX19-28778X), the Ministry of Education, Youth and Sports of the Czech Republic with co-financing from the EU (grant “KOROLID”, CZ.02.1.01/0.0/0.0/15_003/0000 336 to HK) and the Czech Academy of Sciences (RVO 60077344).

Institutional Review Board Statement

Not applicable.

Informed Consent Statement

Not applicable.

Data Availability Statement

Data availability. RNA sequencing data is publicly available at the NCBI gene expression omnibus database under accession number GSE217809 (https://www.ncbi.nlm.nih.gov/geo/query/acc.cgi?acc=GSE217809, accessed on 20 December 2022).

Acknowledgments

We thank Astrid Dröge (Helmholtz Centre for Infection Research, Braunschweig, Germany) for the generous cooperation with RNA-seq library preparation.

Conflicts of Interest

The authors declare no conflict of interest.

References

  1. Kamagata, Y. Phylum XXI. Gemmatimonadetes Zhang, Sekiguchi, Hanada, Hugenholtz, Kim, Kamagata and Nakamura 2003, 1161VP. In Bergey’s Manual® of Systematic Bacteriology, 2nd ed.; Springer: New York, NY, USA, 2010; pp. 781–784.1161VP. [Google Scholar]
  2. Hanada, S.; Sekiguchi, Y. The phylum Gemmatimonadetes. Prokaryotes 2014, 11, 677–681. [Google Scholar]
  3. Zeng, Y.; Baumbach, J.; Barbosa, E.G.V.; Azevedo, V.; Zhang, C.; Koblížek, M. Metagenomic evidence for the presence of phototrophic Gemmatimonadetes bacteria in diverse environments. Environ. Microbiol. Rep. 2016, 8, 139–149. [Google Scholar] [CrossRef] [PubMed]
  4. Zhang, H.; Sekiguchi, Y.; Hanada, S.; Hugenholtz, P.; Kim, H.; Kamagata, Y.; Nakamura, K. Gemmatimonas aurantiaca gen. nov., sp. nov., a Gram-negative, aerobic, polyphosphate-accumulating micro-organism, the first cultured representative of the new bacterial phylum Gemmatimonadetes phyl. nov. Int. J. Syst. Evol. Microbiol. 2003, 53, 1155–1163. [Google Scholar] [CrossRef] [PubMed]
  5. DeBruyn, J.M.; Fawaz, M.N.; Peacock, A.D.; Dunlap, J.R.; Nixon, L.T.; Cooper, K.E.; Radosevich, M. Gemmatirosa kalamazoonesis gen. nov., sp. nov., a member of the rarely-cultivated bacterial phylum Gemmatimonadetes. J. Gen. Appl. Microbiol. 2013, 59, 305–312. [Google Scholar] [CrossRef] [PubMed] [Green Version]
  6. Pascual, J.; Garcia-Lopez, M.; Bills, G.F.; Genilloud, O. Longimicrobium terrae gen. nov., sp. nov., an oligotrophic bacterium of the under-represented phylum Gemmatimonadetes isolated through a system of miniaturized diffusion chambers. Int. J. Syst. Evol. Microbiol. 2016, 66, 1976–1985. [Google Scholar] [CrossRef] [PubMed]
  7. Pascual, J.; Foesel, B.U.; Geppert, A.; Huber, K.J.; Boedeker, C.; Luckner, M.; Wanner, G.; Overmann, J. Roseisolibacter agri gen. nov., sp. nov., a novel slow-growing member of the under-represented phylum Gemmatimonadetes. Int. J. Syst. Evol. Microbiol. 2018, 68, 1028–1036. [Google Scholar] [CrossRef]
  8. Zeng, Y.; Feng, F.; Medová, H.; Dean, J.; Koblížek, M. Functional type 2 photosynthetic reaction centers found in the rare bacterial phylum Gemmatimonadetes. Proc. Natl. Acad. Sci. USA 2014, 111, 7795–7800. [Google Scholar] [CrossRef] [Green Version]
  9. Zeng, Y.; Selyanin, V.; Lukeš, M.; Dean, J.; Kaftan, D.; Feng, F.; Koblížek, M. Characterization of the microaerophilic, bacteriochlorophyll a-containing bacterium Gemmatimonas phototrophica sp. nov., and emended descriptions of the genus Gemmatimonas and Gemmatimonas aurantiaca. Int. J. Syst. Evol. Microbiol. 2015, 65, 2410–2419. [Google Scholar] [CrossRef] [Green Version]
  10. Koblížek, M.; Dachev, M.; Bína, D.; Piwosz, K.; Kaftan, D. Utilization of light energy in phototrophic Gemmatimonadetes. J. Photochem. Photobiol. B, Biol. 2020, 213, 112085. [Google Scholar] [CrossRef]
  11. Dachev, M.; Bína, D.; Sobotka, R.; Moravcová, L.; Gardian, Z.; Kaftan, D.; Šlouf, V.; Fuciman, M.; Polívka, T.; Koblížek, M. Unique double concentric ring organization of light harvesting complexes in Gemmatimonas phototrophica. PLoS Biol. 2017, 15, e2003943. [Google Scholar] [CrossRef] [Green Version]
  12. Qian, P.; Gardiner, A.T.; Šímová, I.; Naydenova, K.; Croll, T.I.; Jackson, P.J.; Nupur; Kloz, M.; Čubáková, P.; Kuzma, M.; et al. 2.4-Å structure of the double-ring Gemmatimonas phototrophica photosystem. Sci. Adv. 2022, 8, eabk3139. [Google Scholar] [CrossRef] [PubMed]
  13. Zeng, Y.; Koblížek, M. Phototrophic Gemmatimonadetes: A new “purple” branch on the bacterial tree of life. In Modern Topics in the Phototrophic Prokaryotes; Springer: New York, NY, USA, 2017; pp. 163–192. [Google Scholar]
  14. Piwosz, K.; Shabarova, T.; Tomasch, J.; Šimek, K.; Kopejtka, K.; Kahl, S.; Pieper, D.H.; Koblížek, M. Determining lineage-specific bacterial growth curves with a novel approach based on amplicon reads normalization using internal standard (ARNIS). ISME J. 2018, 12, 2640–2654. [Google Scholar] [CrossRef] [PubMed] [Green Version]
  15. Mujakić, I.; Piwosz, K.; Koblížek, M. Phylum Gemmatimonadota and its role in the environment. Microorganisms 2022, 10, 151. [Google Scholar] [CrossRef] [PubMed]
  16. Zeng, Y.; Wu, N.; Madsen, A.M.; Chen, X.; Gardiner, A.T.; Koblížek, M. Gemmatimonas groenlandica sp. nov. is an aerobic anoxygenic phototroph in the phylum Gemmatimonadetes. Front. Microbiol. 2021, 11, 606612. [Google Scholar] [CrossRef] [PubMed]
  17. Kirchman, D.L. Growth rates of microbes in the oceans. Annu. Rev. Mar. Sci. 2016, 8, 285–309. [Google Scholar] [CrossRef]
  18. Pinto, F.L.; Thapper, A.; Sontheim, W.; Lindblad, P. Analysis of current and alternative phenol based RNA extraction methodologies for cyanobacteria. BMC Mol. Biol. 2009, 10, 79. [Google Scholar] [CrossRef] [Green Version]
  19. Kopejtka, K.; Tomasch, J.; Zeng, Y.; Selyanin, V.; Dachev, M.; Piwosz, K.; Tichý, M.; Bína, D.; Gardian, Z.; Bunk, B.; et al. Simultaneous presence of bacteriochlorophyll and xanthorhodopsin genes in a freshwater bacterium. mSystems 2020, 5, e01044-20. [Google Scholar] [CrossRef]
  20. Shishkin, A.A.; Giannoukos, G.; Kucukural, A.; Ciulla, D.; Busby, M.; Surka, C.; Chen, J.; Bhattacharyya, R.P.; Rudy, R.F.; Patel, M.M.; et al. Simultaneous generation of many RNA-seq libraries in a single reaction. Nat. Methods 2015, 12, 323–325. [Google Scholar] [CrossRef]
  21. Langmead, B.; Salzberg, S.L. Fast gapped-read alignment with Bowtie2. Nat. Methods 2012, 9, 357–359. [Google Scholar] [CrossRef] [Green Version]
  22. Liao, Y.; Smyth, G.K.; Shi, W. featureCounts: An efficient general-purpose read summarization program. Bioinformatics 2014, 30, 923–930. [Google Scholar] [CrossRef] [Green Version]
  23. Robinson, M.D.; McCarthy, D.J.; Smyth, G.K. 2010. edgeR: A Bioconductor package for differential expression analysis of digital gene expression data. Bioinformatics 2010, 26, 139–140. [Google Scholar] [CrossRef] [PubMed]
  24. Andresen, E.; Lyubenova, L.; Hubáček, T.; Bokhari, S.N.H.; Matoušková, Š.; Mijovilovich, A.; Rohovec, J.; Küpper, H. Chronic exposure of soybean plants to nanomolar cadmium reveals specific additional high-affinity targets of Cd toxicity. J. Exp. Bot. 2020, 71, 1628–1644. [Google Scholar] [CrossRef] [PubMed]
  25. Weyhenmeyer, G.A.; Hartmann, J.; Hessen, D.O.; Kopáček, J.; Hejzlar, J.; Jacquet, S.; Hamilton, S.K.; Verburg, P.; Leach, T.H.; Schmid, M.; et al. Widespread diminishing anthropogenic effects on calcium in freshwaters. Sci. Rep. 2019, 9, 10450. [Google Scholar] [CrossRef] [PubMed] [Green Version]
  26. Nupur Kuzma, M.; Hájek, J.; Hrouzek, P.; Gardiner, A.T.; Lukeš, M.; Moos, M.; Šimek, P.; Koblížek, M. Structure elucidation of the novel carotenoid gemmatoxanthin from the photosynthetic complex of Gemmatimonas phototrophica AP64. Sci. Rep. 2021, 11, 15964. [Google Scholar] [CrossRef]
  27. Campbell, A.K. Intracellular Calcium, Its Universal Role as Regulator; Wiley: New York, NY, USA, 1983. [Google Scholar]
  28. Dominguez, D.C. Calcium signalling in bacteria. Mol. Microbiol. 2004, 54, 291–297. [Google Scholar] [CrossRef]
  29. Permyakov, E.A.; Kretsinger, R.H. Cell signaling, beyond cytosolic calcium in eukaryotes. J. Inorg. Biochem. 2009, 103, 77–86. [Google Scholar] [CrossRef]
  30. Hepler, P.K. The cytoskeleton and its regulation by calcium and protons. Plant Physiol. 2016, 170, 3–22. [Google Scholar] [CrossRef] [Green Version]
  31. Zampese, E.; Pizzo, P. Intracellular organelles in the saga of Ca2+ homeostasis: Different molecules for different purposes? Cell. Mol. Life Sci. 2012, 69, 1077–1104. [Google Scholar] [CrossRef]
  32. Brini, M.; Carafoli, E. The plasma membrane Ca2+ ATPase and the plasma membrane sodium calcium exchanger cooperate in the regulation of cell calcium. Cold Spring Harb. Perspect. Biol. 2011, 3, a004168. [Google Scholar] [CrossRef]
  33. Ostermeier, C.; Harrenga, A.; Ermler, U.; Michel, H. Structure at 2.7 Å resolution of the Paracoccus denitrificans two-subunit cytochrome c oxidase complexed with an antibody FV fragment. Proc. Natl. Acad. Sci. USA 1998, 94, 10547–10553. [Google Scholar] [CrossRef] [Green Version]
  34. Ludwig, B.; Bender, E.; Arnold, S.; Hüttemann, M.; Lee, I.; Kadenbach, B. Cytochrome c oxidase and the regulation of oxidative phosphorylation. ChemBioChem 2001, 2, 392–403. [Google Scholar] [CrossRef] [PubMed]
  35. Svensson-Ek, M.; Abramson, J.; Larsson, G.; Törnroth, S.; Brzezinski, P.; Iwata, S. The X-ray crystal structures of wild-type and EQ(I-286) mutant cytochrome c oxidases from Rhodobacter sphaeroides. J. Mol. Biol. 2002, 321, 329–339. [Google Scholar] [CrossRef] [PubMed]
  36. Trombe, M.C.; Rieux, V.; Baille, F. Mutations which alter the kinetics of calcium transport alter the regulation of competence in Streptococcus pneumoniae. J. Bacteriol. 1994, 176, 1992–1996. [Google Scholar] [CrossRef] [PubMed] [Green Version]
  37. Tisa, L.S.; Adler, J. Cytoplasmic free-Ca2+ level rises with repellents and falls with attractants in Escherichia coli chemotaxis. Proc. Natl. Acad. Sci. USA 1995, 92, 10777–10781. [Google Scholar] [CrossRef] [PubMed] [Green Version]
  38. Norris, V.; Grant, S.; Freestone, P.; Canvin, J.; Sheikh, F.N.; Toth, I.; Trinei, M.; Modha, K.; Norman, R. Calcium signalling in bacteria. J. Bacteriol. 1996, 178, 3677–3682. [Google Scholar] [CrossRef] [Green Version]
  39. Naseem, R.; Wann, K.T.; Holland, I.B.; Campbell, A.K. ATP regulates calcium efflux and growth in E. coli. J. Mol. Biol. 2009, 391, 42–56. [Google Scholar] [CrossRef]
  40. Domínguez, D.C.; Guragain, M.; Patrauchan, M. Calcium binding proteins and calcium signaling in prokaryotes. Cell Calcium 2015, 57, 151–165. [Google Scholar] [CrossRef]
  41. Van Nhieu, G.T.; Clair, C.; Grompone, G.; Sansonetti, P. Calcium signalling during cell interactions with bacterial pathogens. Biol. Cell 2004, 96, 93–101. [Google Scholar] [CrossRef]
  42. Jones, H.E.; Holland, I.B.; Baker, H.L.; Campbell, A.K. Slow changes in cytosolic free Ca2+ in Escherichia coli highlight two putative influx mechanisms in response to changes in extracellular calcium. Cell Calcium 1999, 25, 265–274. [Google Scholar] [CrossRef]
  43. Herbaud, M.L.; Guiseppi, A.; Denizot, F.; Haiech, J.; Kilhoffer, M.C. Calcium signalling in Bacillus subtilis. Biochim. Biophys. Acta Mol. Cell Res. 1998, 1448, 212–226. [Google Scholar] [CrossRef] [Green Version]
  44. Claessen, D.; Emmins, R.; Hamoen, L.W.; Daniel, R.A.; Errington, J.; Edwards, D.H. Control of the cell elongation–division cycle by shuttling of PBP1 protein in Bacillus subtilis. Mol. Microbiol. 2008, 68, 1029–1046. [Google Scholar] [CrossRef] [PubMed]
  45. van den Ent, F.; Amos, L.A.; Löwe, J. Prokaryotic origin of the actin cytoskeleton. Nature 2001, 413, 39–44. [Google Scholar] [CrossRef] [PubMed]
  46. Wickstead, B.; Gull, K. The evolution of the cytoskeleton. J. Cell Biol. 2011, 194, 513–525. [Google Scholar] [CrossRef] [PubMed] [Green Version]
  47. Verchot-Lubicz, J.; Goldstein, R.E. Cytoplasmic streaming enables the distribution of molecules and vesicles in large plant cells. Protoplasma 2010, 240, 99–107. [Google Scholar] [CrossRef] [PubMed]
  48. Patrauchan, M.A.; Sarkisova, S.A.; Franklin, M.J. Strain-specific proteome responses of Pseudomonas aeruginosa to biofilm-associated growth and to calcium. Microbiology 2007, 153, 3838–3851. [Google Scholar] [CrossRef] [Green Version]
  49. Bilecen, K.; Yildiz, F.H. Identification of a calcium-controlled negative regulatory system affecting Vibrio cholerae biofilm formation. Environ. Microbiol. 2009, 11, 2015–2029. [Google Scholar] [CrossRef] [Green Version]
  50. Oomes, S.J.C.M.; Jonker, M.J.; Wittink, F.R.A.; Hehenkamp, J.O.; Breit, T.M.; Brul, S. The effect of calcium on the transcriptome of sporulating B. subtilis cells. Int. J. Food Microbiol. 2009, 133, 234–242. [Google Scholar] [CrossRef]
  51. Gode-Potratz, C.J.; Chodur, D.M.; McCarter, L.L. Calcium and iron regulate swarming and type III secretion in Vibrio parahaemolyticus. J. Bacteriol. 2010, 192, 6025–6038. [Google Scholar] [CrossRef] [Green Version]
  52. Domínguez, D.C.; Lopes, R.; Holland, I.B.; Campbell, A.K. Proteome analysis of B. subtilis in response to calcium. J. Anal. Bioanal. Techniq. 2011, S6, 001–010. [Google Scholar] [CrossRef]
Figure 1. Liquid culture of G. phototrophica showing growth in the medium containing 50 mg CaCl2 L−1 (left flask) and no growth in medium without added CaCl2 (right flask).
Microorganisms 11 00027 g001
Figure 2. (A) Growth rate of G. phototrophica grown in liquid media with different CaCl2 concentrations. (B) Growth rate of G. groenlandica in medium with 50 mg CaCl2 L−1 and in medium without added CaCl2.
Microorganisms 11 00027 g002
Figure 3. Transmission electron microscopy images of G. phototrophica and G. groenlandica cells grown in with and without CaCl2. (A) Cells of G. phototrophica in 2 mg CaCl2 L−1 were long rod shaped without flagella. (B) Cells of G. phototrophica in 20 mg CaCl2 L−1 were short rod shaped with polar flagella. (C) Cells of G. phototrophica in 50 mg CaCl2 L−1 were rod shaped with flagella. (D) Cells of G. groenlandica in 2 mg CaCl2 L−1 were rod-like and elongated in shape with short flagella. (E) Cells of G. groenlandica in 20 mg CaCl2 L−1 were rod shaped with flagella. (F) Cells of G. groenlandica in 50 mg CaCl2 L−1 were rod shaped with long flagella. Scale bar is included in each figure. Inlet shows the close-up images. Arrows show the flagella.
Microorganisms 11 00027 g003
Figure 4. Growth rate of G. phototrophica grown in liquid media with 50 mg L−1 CaCl2 and 50 mg L−1 SrCl2.
Microorganisms 11 00027 g004
Figure 5. (A) Accumulation of calcium in G. phototrophica and G. groenlandica cells grown in nutrient media containing different concentrations of CaCl2. (B) Accumulation of strontium in G. phototrophica cells grown in nutrient media containing different concentrations of CaCl2.
Microorganisms 11 00027 g005
Figure 6. (A) The figure shows the growth rate of G. phototrophica grown in 20 mg CaCl2 L−1 and no growth in 2 mg CaCl2 L−1 (Note: scale bar in the x-axis is uneven). (B) Multi-Dimensional Scaling (MDS) plot showing the similarity between the treatment replicates. (C) Venn diagram showing the differentially expressed genes in 20 mg MgCl2 L−1 and 20 mg CaCl2 L−1 at 2 h, 8 h and 24 h after amendment.
Microorganisms 11 00027 g006
Figure 7. Heatmap and hierarchical clustering based on the Euclidean distance of the log2 FC of significantly differentially expressed genes in 20 mg CaCl2 L−1 and 20 mg MgCl2 L−1 at 2 h, 8 h, and 24 h after amendment. The colors indicate three clusters obtained by cutting the tree at the earliest branching points. Functions of genes within the clusters are noted on the left with the numbers of coding genes in brackets.
Microorganisms 11 00027 g007
Disclaimer/Publisher’s Note: The statements, opinions and data contained in all publications are solely those of the individual author(s) and contributor(s) and not of MDPI and/or the editor(s). MDPI and/or the editor(s) disclaim responsibility for any injury to people or property resulting from any ideas, methods, instructions or products referred to in the content.

