
Diffusional Interactions among Marine Phytoplankton and Bacterioplankton: Modelling H2O2 as a Case Study


1
Department of Biology, Mount Allison University, Sackville, NB E4L1G7, Canada
2
Center Algatech, Laboratory of Photosynthesis, Novohradska 237, CZ 37981 Trebon, Czech Republic
3
Department of Biology, Massachusetts Institute of Technology, Boston, MA 02142, USA
*
Author to whom correspondence should be addressed.
Microorganisms 2022, 10(4), 821; https://doi.org/10.3390/microorganisms10040821
Submission received: 7 February 2022
/
Revised: 12 April 2022
/
Accepted: 13 April 2022
/
Published: 15 April 2022
(This article belongs to the Special Issue Phytoplankton-Bacteria Interactions 2.0)
Abstract
:Marine phytoplankton vary widely in size across taxa, and in cell suspension densities across habitats and growth states. Cell suspension density and total biovolume determine the bulk influence of a phytoplankton community upon its environment. Cell suspension density also determines the intercellular spacings separating phytoplankton cells from each other, or from co-occurring bacterioplankton. Intercellular spacing then determines the mean diffusion paths for exchanges of solutes among co-occurring cells. Marine phytoplankton and bacterioplankton both produce and scavenge reactive oxygen species (ROS), to maintain intracellular ROS homeostasis to support their cellular processes, while limiting damaging reactions. Among ROS, hydrogen peroxide (H2O2) has relatively low reactivity, long intracellular and extracellular lifetimes, and readily crosses cell membranes. Our objective was to quantify how cells can influence other cells via diffusional interactions, using H2O2 as a case study. To visualize and constrain potentials for cell-to-cell exchanges of H2O2, we simulated the decrease of [H2O2] outwards from representative phytoplankton taxa maintaining internal [H2O2] above representative seawater [H2O2]. [H2O2] gradients outwards from static cell surfaces were dominated by volumetric dilution, with only a negligible influence from decay. The simulated [H2O2] fell to background [H2O2] within ~3.1 µm from a Prochlorococcus cell surface, but extended outwards 90 µm from a diatom cell surface. More rapid decays of other, less stable ROS, would lower these threshold distances. Bacterioplankton lowered simulated local [H2O2] below background only out to 1.2 µm from the surface of a static cell, even though bacterioplankton collectively act to influence seawater ROS. These small diffusional spheres around cells mean that direct cell-to-cell exchange of H2O2 is unlikely in oligotrophic habits with widely spaced, small cells; moderate in eutrophic habits with shorter cell-to-cell spacing; but extensive within phytoplankton colonies.
1. Introduction
1.1. Marine Phytoplankton
Phytoplankton are a polyphyletic functional grouping of ~275,000 species of oxygenic photosynthetic microorganisms that grow while suspended in marine or freshwater habitats [1,2]. Phytoplankton interact with their aqueous environment [3], and with co-occurring bacterioplankton cells, through diffusion of nutrients, toxic compounds and signaling molecules, notably including reactive oxygen species (ROS). Phytoplankton span a wide size range [4] (Table 1), which directly affects their diffusional interactions. Larger cells have longer paths for intracellular diffusion or transport paths for solutes, and can therefore potentially impose larger concentration gradients between their internal cell contents and the local microenvironment. Larger cells also have lower surface to volume ratios which impose limits on their trans-membrane transport per biovolume of the cell [5]. On the other hand, some larger cells have dynamic control over their sinking through water, and can thereby refresh their surface boundary layers more effectively than can smaller cells [3,6].
1.2. Phytoplankton Cell Spacing in Oceans
Phytoplankton and bacterioplankton cell numbers in the ocean vary widely, and therefore so does intercellular distance (Table 1). Direct colonization of phytoplankton by bacteria [7], or colony-forming phytoplankters, bring multiple cells into yet closer local proximities. For example, within Phaeocystis colonies, cell densities reach 2.4 × 10⁷ cells mL−1 [8] (Table 1).

Table 1.
Phytoplankton and bacterioplankton cell sizes and representative suspension densities.
| Habitat | Taxa | Metabolism | Cell m−3 | Cell Radius µm | Citation |
|---|---|---|---|---|---|
| Oligotrophic | Bacterioplankton | Hetero | 4.7 × 10¹⁰ | 0.5 | [9] |
| Oligotrophic | Bacterioplankton | Hetero | 2.0 × 10¹¹ | 0.5 | [10] |
| Oligotrophic | Diatoms | Phyto | 5.6 × 10⁷ | 10.0 | [11] |
| Oligotrophic | Dinoflagellates | Phyto | 6.5 × 10⁶ | 10.0 | [11] |
| Oligotrophic | PicoEukaryotes | Phyto | 6.7 × 10⁸ | 2.0 | [12] |
| Oligotrophic | PicoEukaryotes | Phyto | 2.0 × 10⁹ | 2.0 | [10] |
| Oligotrophic | Prochlorococcus | Phyto | 4.7 × 10¹⁰ | 0.3 | [12] |
| Oligotrophic | Prochlorococcus | Phyto | 3.8 × 10¹⁰ | 0.3 | [10] |
| Oligotrophic | Silicoflagellates | Phyto | 1.3 × 10⁷ | 10.0 | [11] |
| Oligotrophic | Synechococcus | Phyto | 3.0 × 10⁹ | 1.0 | [12] |
| Oligotrophic | Synechococcus | Phyto | 2.0 × 10⁹ | 1.0 | [10] |
| Mesotrophic | Bacterioplankton | Hetero | 3.3 × 10¹¹ | 0.5 | [10] |
| Mesotrophic | PicoEukaryotes | Phyto | 3.0 × 10⁹ | 2.0 | [10] |
| Mesotrophic | Prochlorococcus | Phyto | 3.1 × 10¹⁰ | 0.3 | [10] |
| Mesotrophic | Synechococcus | Phyto | 6.0 × 10⁹ | 1.0 | [10] |
| Eutrophic | Bacterioplankton | Hetero | 4.6 × 10¹¹ | 0.5 | [10] |
| Eutrophic | Bacterioplankton | Hetero | 4.6 × 10¹³ | 0.5 | [13] |
| Eutrophic | Chlorophytes | Phyto | 8.2 × 10¹⁰ | 2.5 | [14] |
| Eutrophic | Chroococcales | Phyto | 8.2 × 10¹⁰ | 1.0 | [14] |
| Eutrophic | Cyanobium | Phyto | 4.0 × 10¹² | 1.0 | [14] |
| Eutrophic | PicoEukaryotes | Phyto | 3.0 × 10⁹ | 2.0 | [10] |
| Eutrophic | PicoEukaryotes | Phyto | 1.5 × 10¹³ | 2.0 | [13] |
| Eutrophic | Synechococcus | Phyto | 4.5 × 10⁹ | 1.0 | [10] |
| Colony | Cyanobium | Phyto | 1.0 × 10¹³ | 1.0 | [14] |
| Colony | Phaeocystis | Phyto | 2.4 × 10¹³ | 2.2 | [8] |
These wide ranges of cell suspension densities for phytoplankton and bacterioplankton across habitats strongly influence the extent to which the growth and activity of a phytoplankton population or community alters, or even governs, solute concentrations in the local habitat [15,16,17,18]. Beyond the bulk activities of the phytoplankton population or community, differences in cell suspension densities mean the diffusional path lengths for solutes separating individual cells vary by orders of magnitude across habitats and taxa. Intercellular distances then influence whether the activity of an individual cell can directly influence the microenvironment of neighboring cells [19].
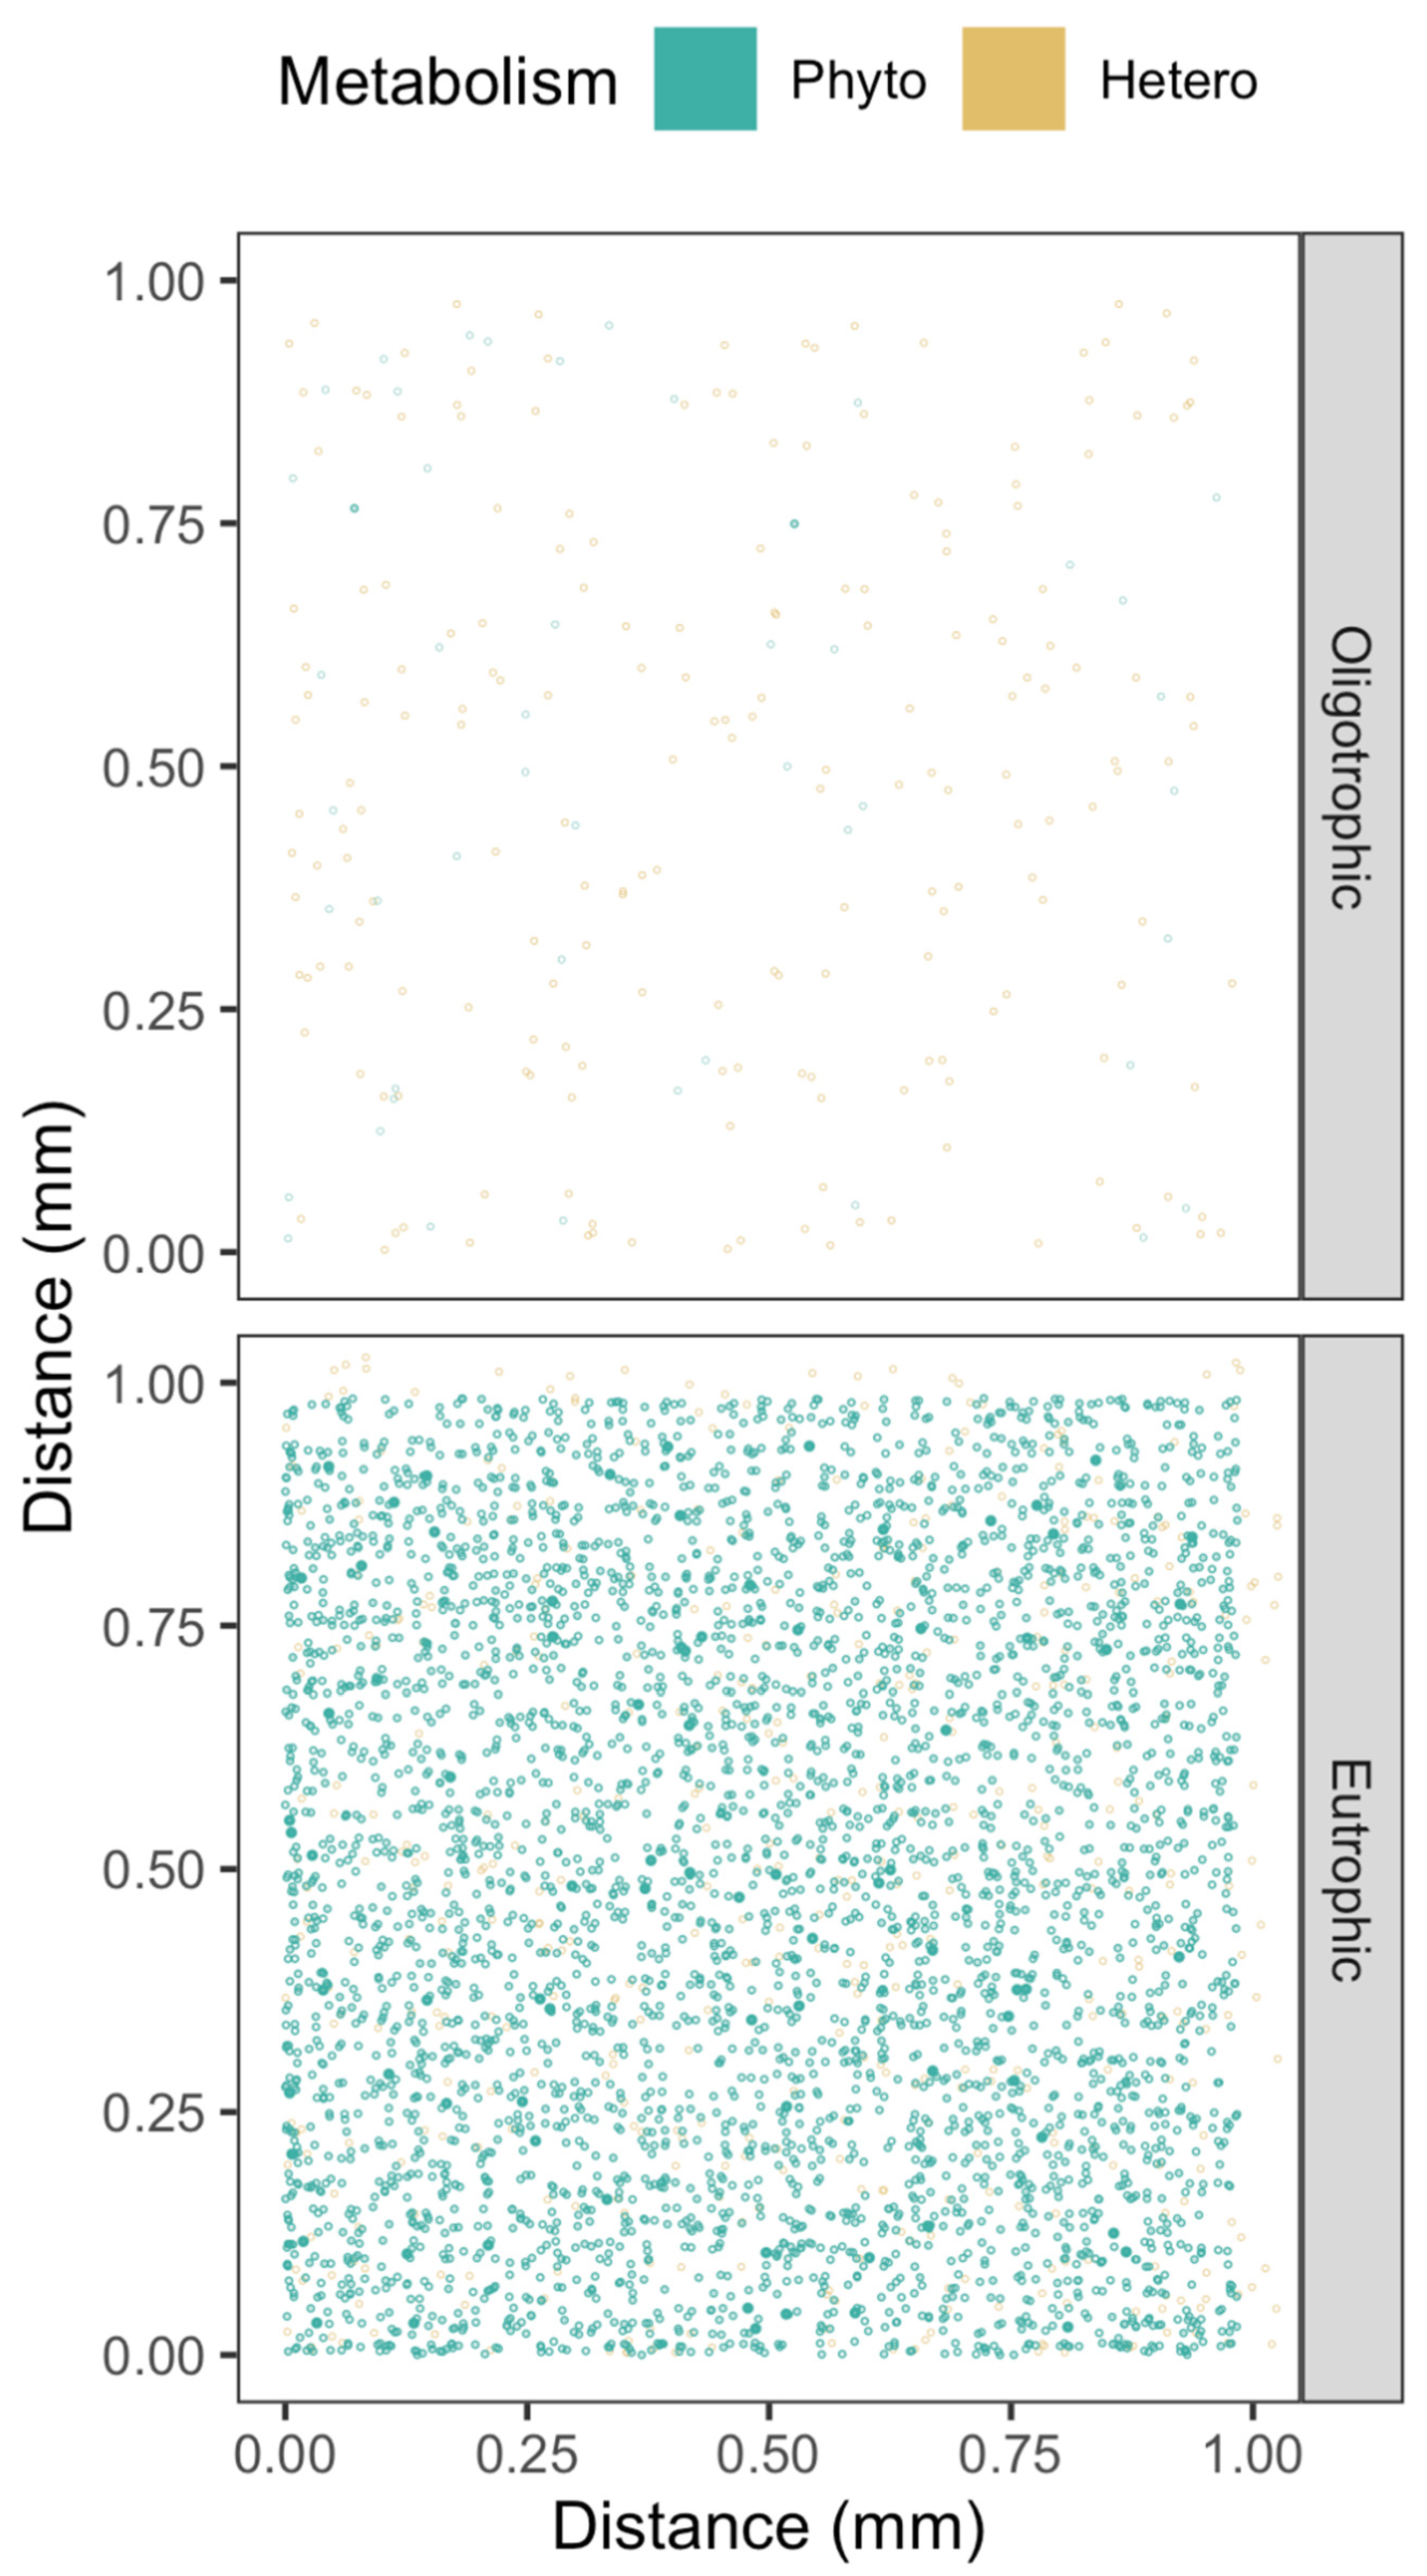
Our understanding of the taxa- and habitat-specific effects of cell-to-cell separation is then influenced by schematic visualizations of phytoplankton communities with implied cell suspension densities far higher than is realistic, or with cell symbol sizes scaled differently than the scaling of the spatial axes [20]. Symbol size scaling exaggerated relative to the scaling of the spatial axes allows schematic visualizations of cells, but can give a visual impression of a community with fairly close cell-to-cell interactions. In our visualizations, we maintain cell symbol size at the same size scaling as the spatial axes (Figure 1).
1.3. Reactive Oxygen Species
Electrons can transfer from photosynthetic or respiratory electron transport to reduce O2 to form the superoxide radical, a reactive oxygen species (ROS) [21,22] (Reaction (1)).
ROS include both radicals (superoxide, nitric oxide and hydroxyl radicals) and non-radicals (hydrogen peroxide, singlet oxygen and peroxynitrite), which are more reactive than ground state di-oxygen molecules [23,24]. Reduction of O2 to H2O requires the sequential addition of four electrons, and therefore progresses through three ROS intermediates: superoxide (O2•−), hydrogen peroxide (H2O2) and hydroxyl radical (OH•) (Reaction (1)) [25]. ROS are by-products of both photosynthetic and heterotrophic metabolism, but are also generated abiotically in seawater [26].
Biogenic production of extracellular ROS mediated by microorganisms is a significant contributor to marine environments [27,28], mediated by taxa ranging from heterotrophic bacteria to diatoms including those from the Thalassiosira and Coscinodiscus genera [28,29,30,31,32,33,34,35].
ROS are important at low concentrations due to their role in cell signaling [36,37,38,39,40,41,42] and lipid accumulation [43]. In order to benefit from ROS, organisms must maintain ROS levels above the cytostatic threshold, the minimum concentration of ROS required to maintain normal cellular processes, as well as below the cytotoxic threshold, the level at which the negative effects of ROS outweigh the positives [44].
1.4. Concentrations and Properties of H2O2
H2O2 is an uncharged compound documented in the ocean at concentrations of 10−9 to 10−6 mol L−1 [29,45] depending upon location and conditions. These [H2O2] are high enough to significantly contribute to the redox cycling of copper [46,47]. [H2O2] in seawater increases after precipitation, including rain and snowfall [18,26,48]. [H2O2] in seawater also follows a diurnal cycle with a peak at mid-day [18,49,50], which suggests significant direct or indirect photochemical or photobiological generation of H2O2. [H2O2] also exhibits latitudinal variation at the surface, higher in the brighter, warmer, mid to low latitudes compared to the colder, darker, higher latitudes [50]. The authors of [50] suggest that regional variation in [H2O2] may be caused by the depth of the mixed layer and the concentration of total dissolved organic carbon. Abiotic production rates of H2O2 vary from 0.28 to 4.2 pM s−1 in near surface open ocean waters vs. 1.0 to 84.4 pM s−1 in coastal sites [26].
The diffusion coefficients (a measure of how quickly a molecule travels via diffusion), and therefore the diffusional mobilities, of ROS through seawater vary widely. Diffusion coefficients in water decrease with increasing molecular mass, and from uncharged to charged compounds. Diffusion coefficients are strongly influenced by temperature and slightly influenced by pressure. For H2O2 at ~20 °C the diffusion coefficient is ~1500 µm2 µs−1 (note conversion of units from more typical reporting of cm2 s−1) [51]. In aquatic systems, H2O2 has extracellular lifetimes of hours to days [29,52] before decay.
H2O2 is acutely toxic to most cells in the range of 10−5 to 10−4 mol L−1 range [53], about 10-fold higher than seawater concentrations [29,45]. We found few quantitative estimates of the intracellular concentrations of H2O2 within cells [54,55,56,57,58,59,60], with a particular lack of measurements from phytoplankton. Limited data, from mammalian cells, support an intracellular H2O2 concentration of 10−6 M [61]. Although only weakly directly reactive, H2O2 can react with thiols and methionine [62] and thereby modulate gene expression and transcription [63,64]. Meanwhile, limited experimental data indicate that heterotrophic bacteria maintain an internal [H2O2] of 1/10 of the external [H2O2] when extracellular H2O2 is present [58,60], as it is in seawater. The authors of [58] also predicted an intracellular steady-state [H2O2] of 20 nM in the absence of extracellular H2O2, which is far below the toxic threshold of intracellular H2O2 [60], and is likely for the maintenance of physiological roles of H2O2. Cytotoxic effects of H2O2, including lipid damage, are primarily caused by H2O2 converting to the hydroxyl radical, which is strongly oxidative [52]. Interestingly, H2O2 may be used as a terminal electron acceptor in the absence of oxygen in Escherichia coli [65].
H2O2 readily crosses the cell membrane [53] primarily through aquaporins [66,67,68,69]. As a result, intracellular H2O2 exchanges with extracellular H2O2, but cells can nevertheless maintain intracellular [H2O2] significantly different than extracellular [H2O2] [58]. Other ROS rarely cross cell membranes and therefore the intra- and extracellular pools are not directly connected, although they may influence each other indirectly through transformations to other ROS, for example dismutation of intracellular O2•- to form intracellular H2O2 which can then exchange with extracellular H2O2, and vice versa.
A significant fraction of H2O2 destruction in aqueous systems may be attributed to the activities of heterotrophic microbes [70], although heterotrophs are minor contributors to bulk [H2O2]. Microbial scavenging of H2O2 indeed increases the survival of Prochlorococcus through extended periods of darkness, as demonstrated through co-culture studies [71] with ‘helper’ bacteria which carry genes for catalase. In the open ocean, bulk [H2O2] levels generally remain below the cytotoxic threshold, partly because heterotrophic organisms provide catalase [72].
Changes in [H2O2], or other ROS, around a cell will depend upon net production, or consumption by the cell, which generate net release (or uptake) of [H2O2] from the cell after any intracellular or cell-associated scavenging. These inputs can interact to generate a diffusion-generated gradient of [H2O2] around the cell, above or below seawater [H2O2]. Whether or not a cell establishes a zone of [H2O2] different from the [H2O2] background also depends upon extracellular destruction and diffusion rates. The extent of this altered zone will then influence downstream processes. For specific cell–cell interactions or responses, a cell has to change the [H2O2] in the local microenvironment sufficiently to provoke a response in neighboring cells. Beyond this local sphere of influence around an individual cell, the collective activity of cells in a community contributes to generating a general seawater [H2O2], which in turn influences cellular gene expression and metabolism.
1.5. Goals
Microbes consume and produce H2O2, thereby potentially helping, or at least influencing, other microbes. We sought to quantify the influences of cell density and cell size on these potential microbial interactions. H2O2 presents a good case study for diffusional interactions among microbes. H2O2 readily traverses cell membranes, and there is information on background concentrations of H2O2 in seawater, H2O2 diffusion coefficients in seawater and some estimates of cellular concentrations of H2O2, as either absolute values or ratios compared to external [H2O2]. We can therefore approximate concentration gradients generated by [H2O2] diluting outwards from a cell maintaining a homeostatic intracellular [H2O2] higher than seawater [H2O2], or the concentration gradient inwards towards a hypothetical cell maintaining a homeostatic intracellular [H2O2] lower than seawater [H2O2]. We can use these simple approximations to generate quantitative thresholds for when H2O2 released from a cell can directly influence neighboring cells, i.e., how much, and how far, a phytoplankton or bacterioplankton cell can change the local [H2O2].
2. Results and Discussion
2.1. Cell to Cell Spacing across Habitats and Taxa
Possible cell-to-cell exchanges of H2O2 are mediated by diffusions through intercellular path lengths, varying by orders of magnitude across habitats and taxa. To understand such diffusional exchanges we need realistic visualizations of cell spacings, achieved by maintaining cell symbol size at the same size scaling as the spatial axes (Figure 1). In the visualization of randomized cell spacing under oligotrophic conditions, we see wide spacing among cells, because the small cell symbols are on the same size scaling as the spatial axes. In the visualization of randomized cell spacing under eutrophic conditions, some cells are in close proximity. Note that this standardized scaling visualization approach is only feasible with highly expanded spatial axes such as the 1 mm axis used in Figure 1, equivalent to simulation of only 1 µL. Attempting to visualize 10 mm axes, equivalent to a 1 mL volume, causes the cell symbol size to shrink below visibility (data not presented). A further nuance not captured in these visualizations and subsequent simulations is non-random clustering of cells, as perhaps around particles of marine snow.
2.2. H2O2 Concentration Gradients around Cells
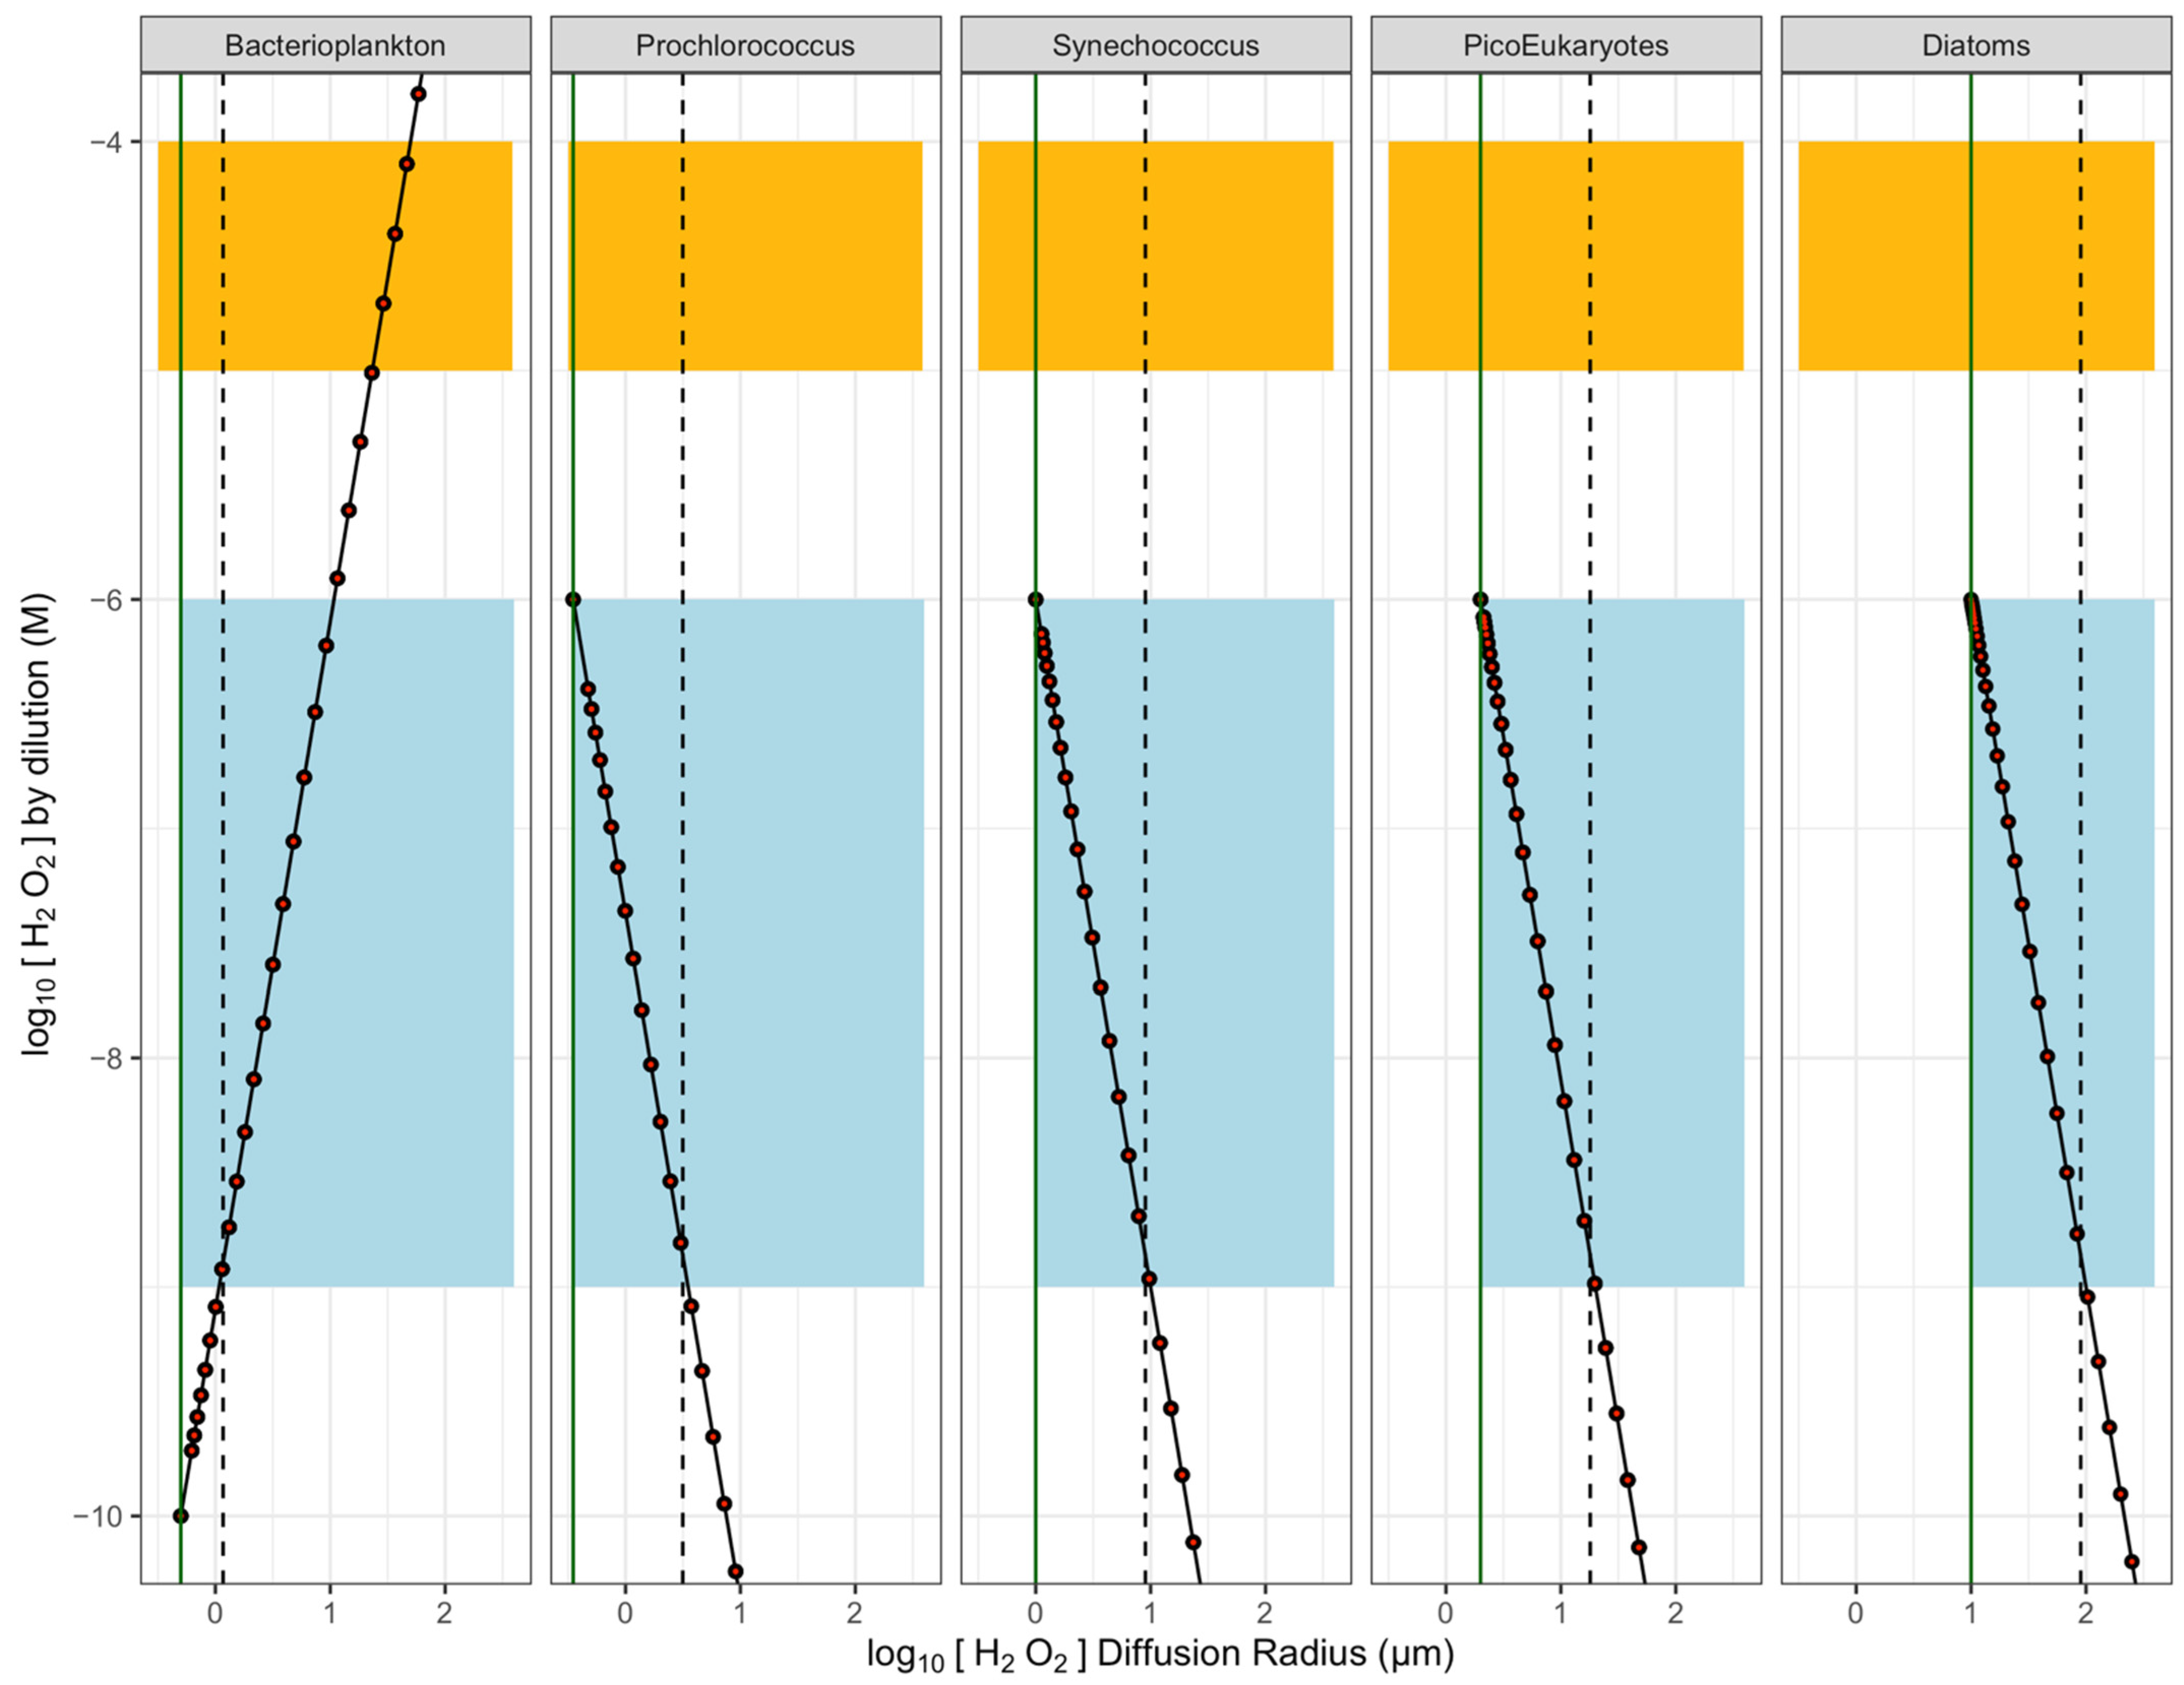
Figure 2 shows a light blue background for the approximate range of natural [H2O2] in seawater, with the simulated profiles of [H2O2] moving outward from a ‘Bacterioplankton’ cell with intracellular [H2O2] maintained below seawater [H2O2]; or outward from small phytoplankton cells of different sizes with intracellular [H2O2] maintained at 1 µmol L−1 [57], near the highest concentrations expected for seawater [ROS]. For [H2O2] generators (nominally, phytoplankton of different sizes), [H2O2] concentrations are highest near the cell surface and decrease with distance outwards. For [H2O2] consumers (nominally, bacterioplankton), [H2O2] concentrations are lowest near the cell surface.
Decay is a key influence on the pseudo-steady state bulk [H2O2] in seawater, but for our conceptual estimates of [H2O2] changing within the local region of the cell, the dilution term (black points, Figure 2) dominates the concentration gradient moving out from the cell. Including the influence of the decay term (red points, Figure 2) has only a negligible influence on [H2O2] moving out from the phytoplankton cell over simulated timescales of <100 µs and distances of ~100 µm. For other, less stable ROS, decay would become a significant influence, acting to narrow the local concentration gradients around cells.
Seawater contains H2O2 which varies significantly depending upon conditions and region. At some threshold distance out from the cell-specific sphere of influence upon local [ROS], it reaches the seawater [H2O2] (Figure 2), beyond which distance net [H2O2] production or consumption by the specific cell has no local influence on [H2O2], but is simply one input into the wider seawater [H2O2]. All other factors being equal, in our estimations the region over which a cell changes the local [H2O2] away from seawater [H2O2] increases with cell radius. This wider influence of cells with larger cell radii results primarily from the volume of the intracellular homeostatic [H2O2] increasing as the cube of cellular radius (Figure 2).
In this simple estimate, a heterotrophic bacterioplankton cell maintaining intracellular [H2O2] at 1/10 of the external seawater [H2O2] locally drops [H2O2] below the lower end of the seawater [H2O2] for a radius of only 1.2 µm. If the bacterioplankton cell were to maintain an intracellular [H2O2] of <1/10 of the external seawater [H2O2], the threshold distances would be greater. The phytoplankton cells maintaining intracellular [H2O2] at 1 µmol L−1 influence local [H2O2] above a low background level of seawater [H2O2] for radii of 3.1 µm for Prochlorococcus up to 90 µm for diatoms, or even more for yet larger phytoplankters not simulated. Furthermore, these threshold distances apply to the lowest published estimates for seawater [H2O2]. Under environments with higher seawater [H2O2], the threshold distances would be smaller.
2.3. Visualizing Cell to Cell Exchange of [H2O2]
We next combine our visualizations of cell suspensions from eutrophic, oligotrophic, or colonial habitats, overlaid with the mathematical expressions of cell-specific spheres of [H2O2] above or below seawater levels, to visualize the extent to which cells directly influence the [H2O2] environments of their neighbors.
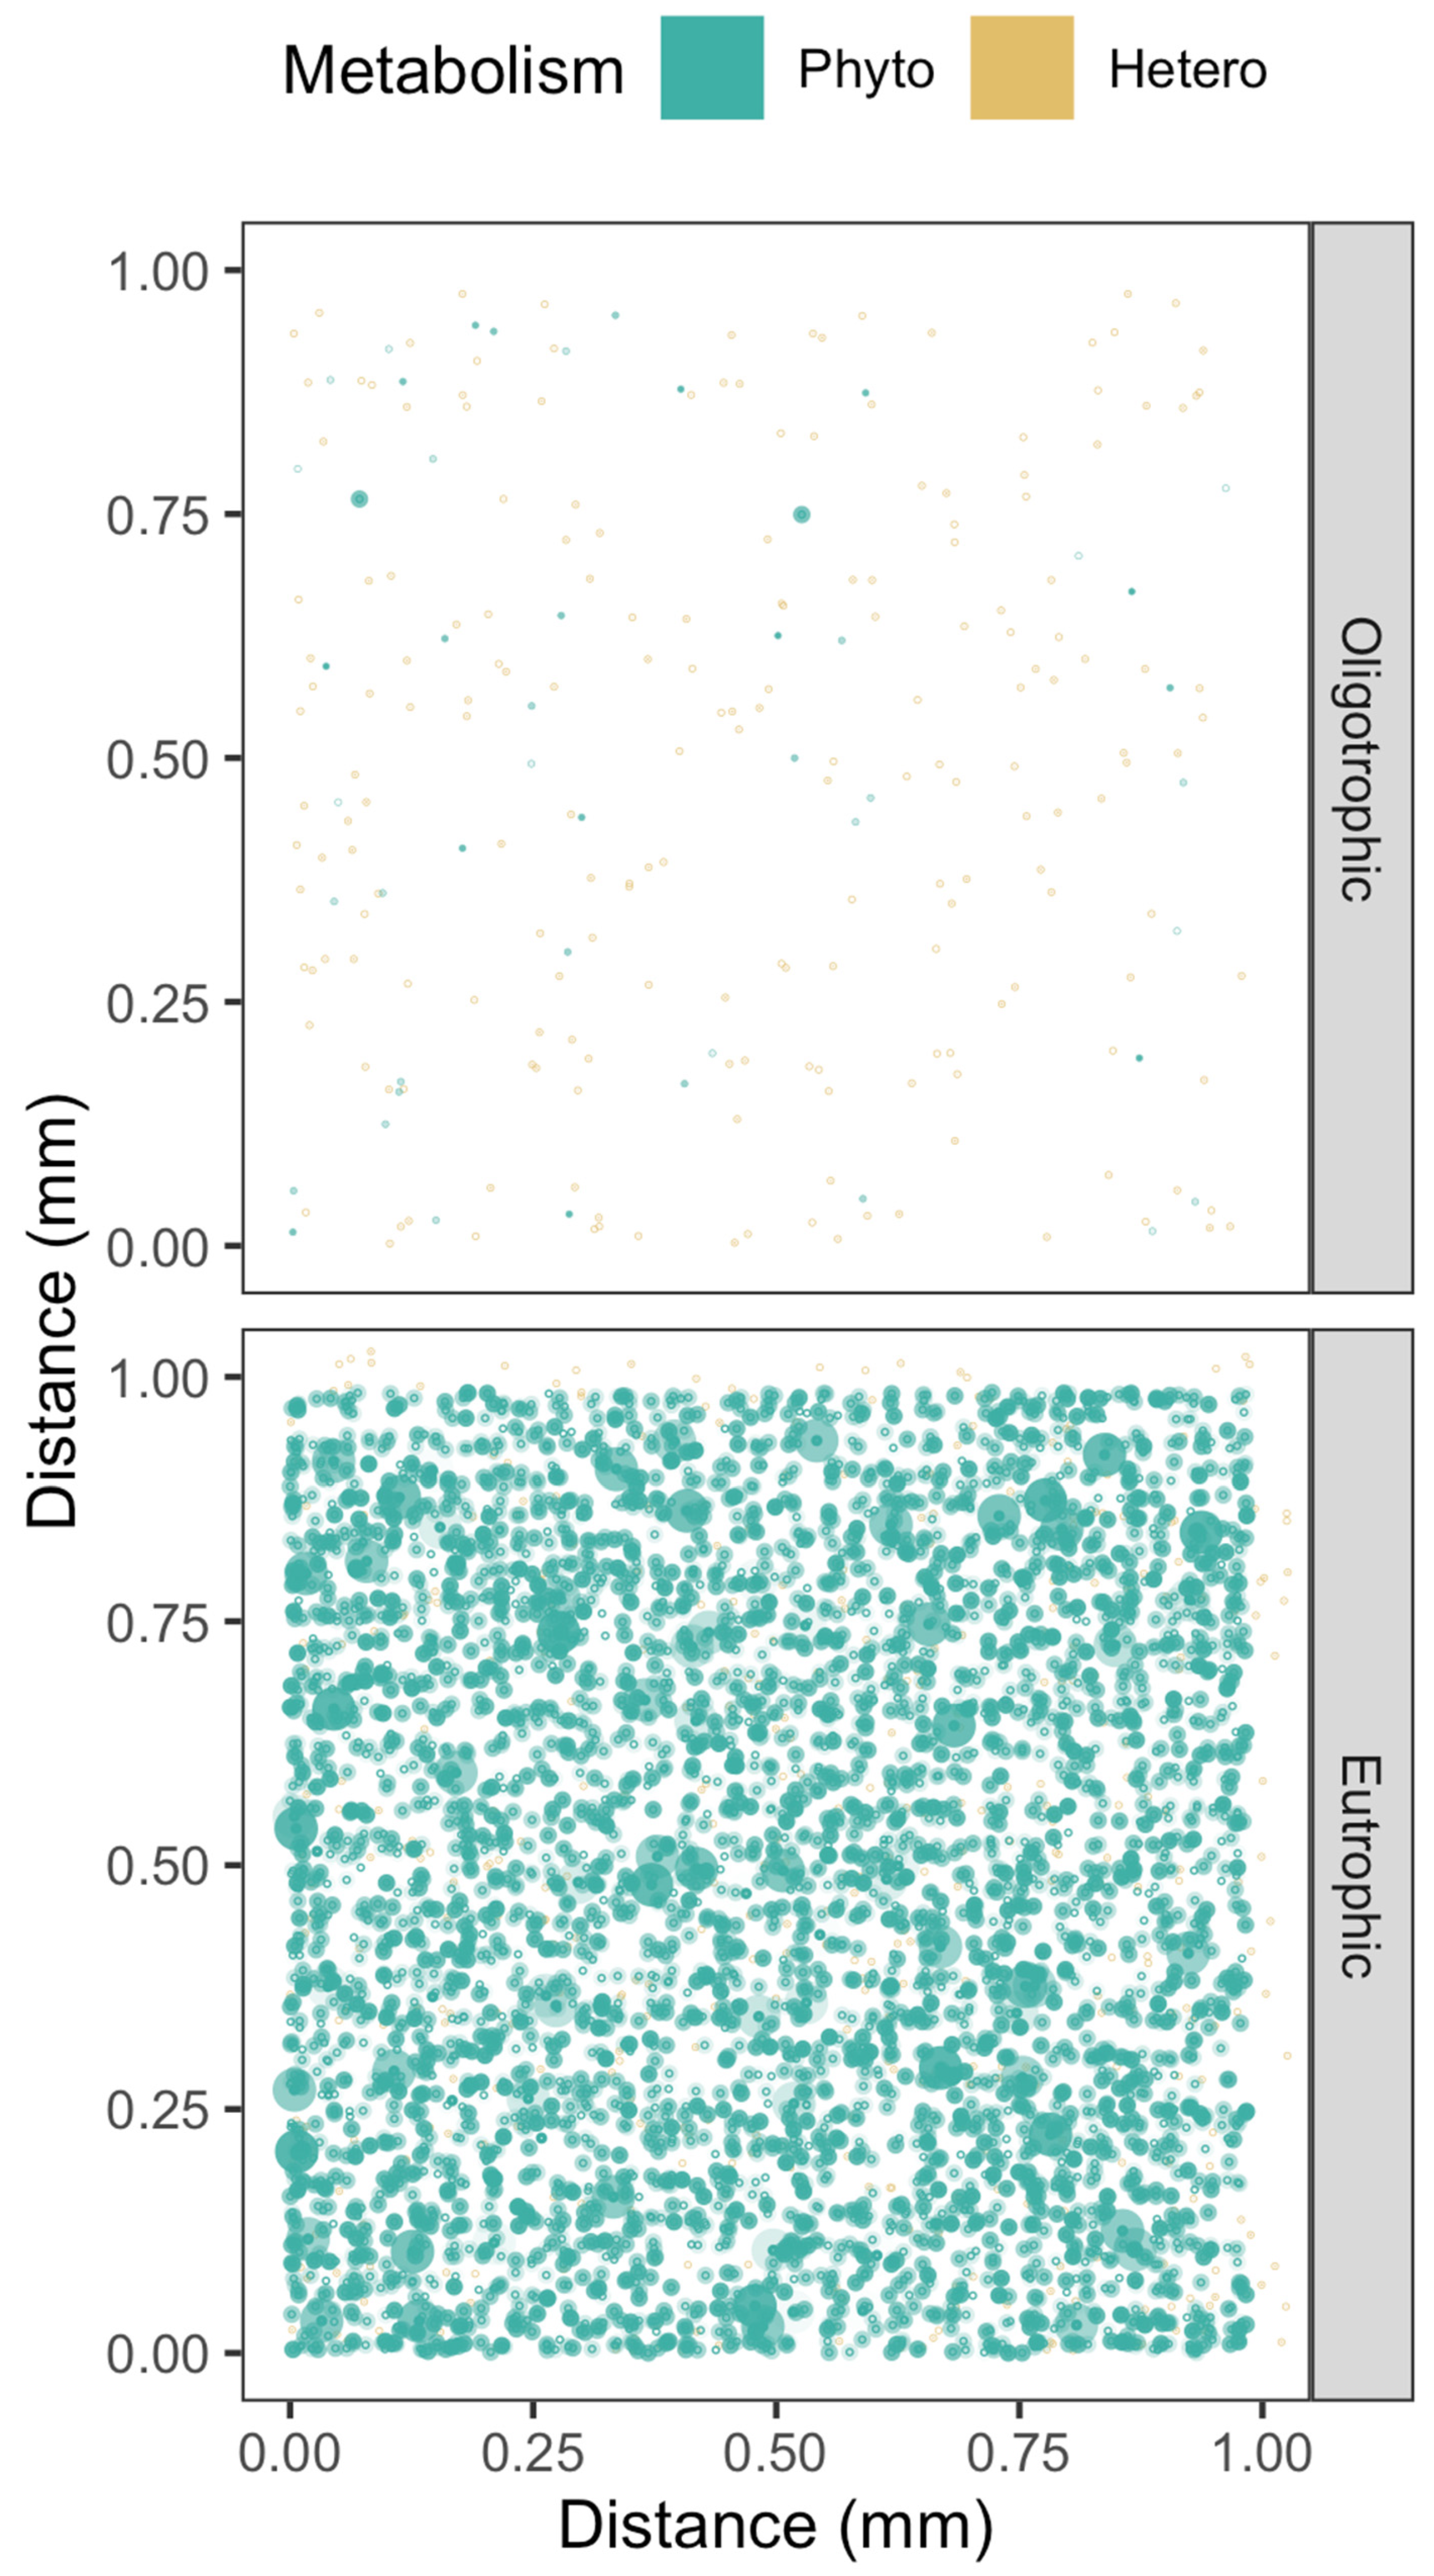
In eutrophic habitats, bacterioplankters are numerous, but their small cell size, and correspondingly small cell-specific spheres of upon local [H2O2], mean that their individual contributions towards local [H2O2] are negligible (Figure 3), even though their collective influence upon background [H2O2] may be considerable [71,72]. Phytoplankton cells, particularly the larger taxa, can however influence local [H2O2] over wider distances, leading to overlaps in their cell-specific spheres of influence (Figure 3) with bacterioplankton and with other phytoplankton, and opening the possibility of direct cell-to-cell signaling or cell-to-cell metabolic influences through [H2O2], beyond contributions to background seawater [H2O2]. In oligotrophic habitats, wider cell-to-cell spacings, and generally smaller cell sizes, make direct cell-to-cell reciprocal influences upon local [H2O2] unlikely, although the phytoplankton and bacterioplankton as a whole indeed contribute to establishment of the background [H2O2].
For phytoplankters growing colonially, the [H2O2] leaving specific cells within the colony strongly influence the local [H2O2] environments of neighboring cells in the colony (Figure 4). Such a colony could also be usefully simulated as a single homeostatic sphere of [H2O2], with a significant local sphere of influence beyond the colony. Although we did not include bacteria in Figure 4, in fact Phaeocystis antarctica colonies have rich bacterial components [73], which may greatly alter the local H2O2 environment within the colony, beyond the activities of the Phaeocystis cells.
2.4. Threshold Distances for Cell to Cell Exchange of [H2O2]
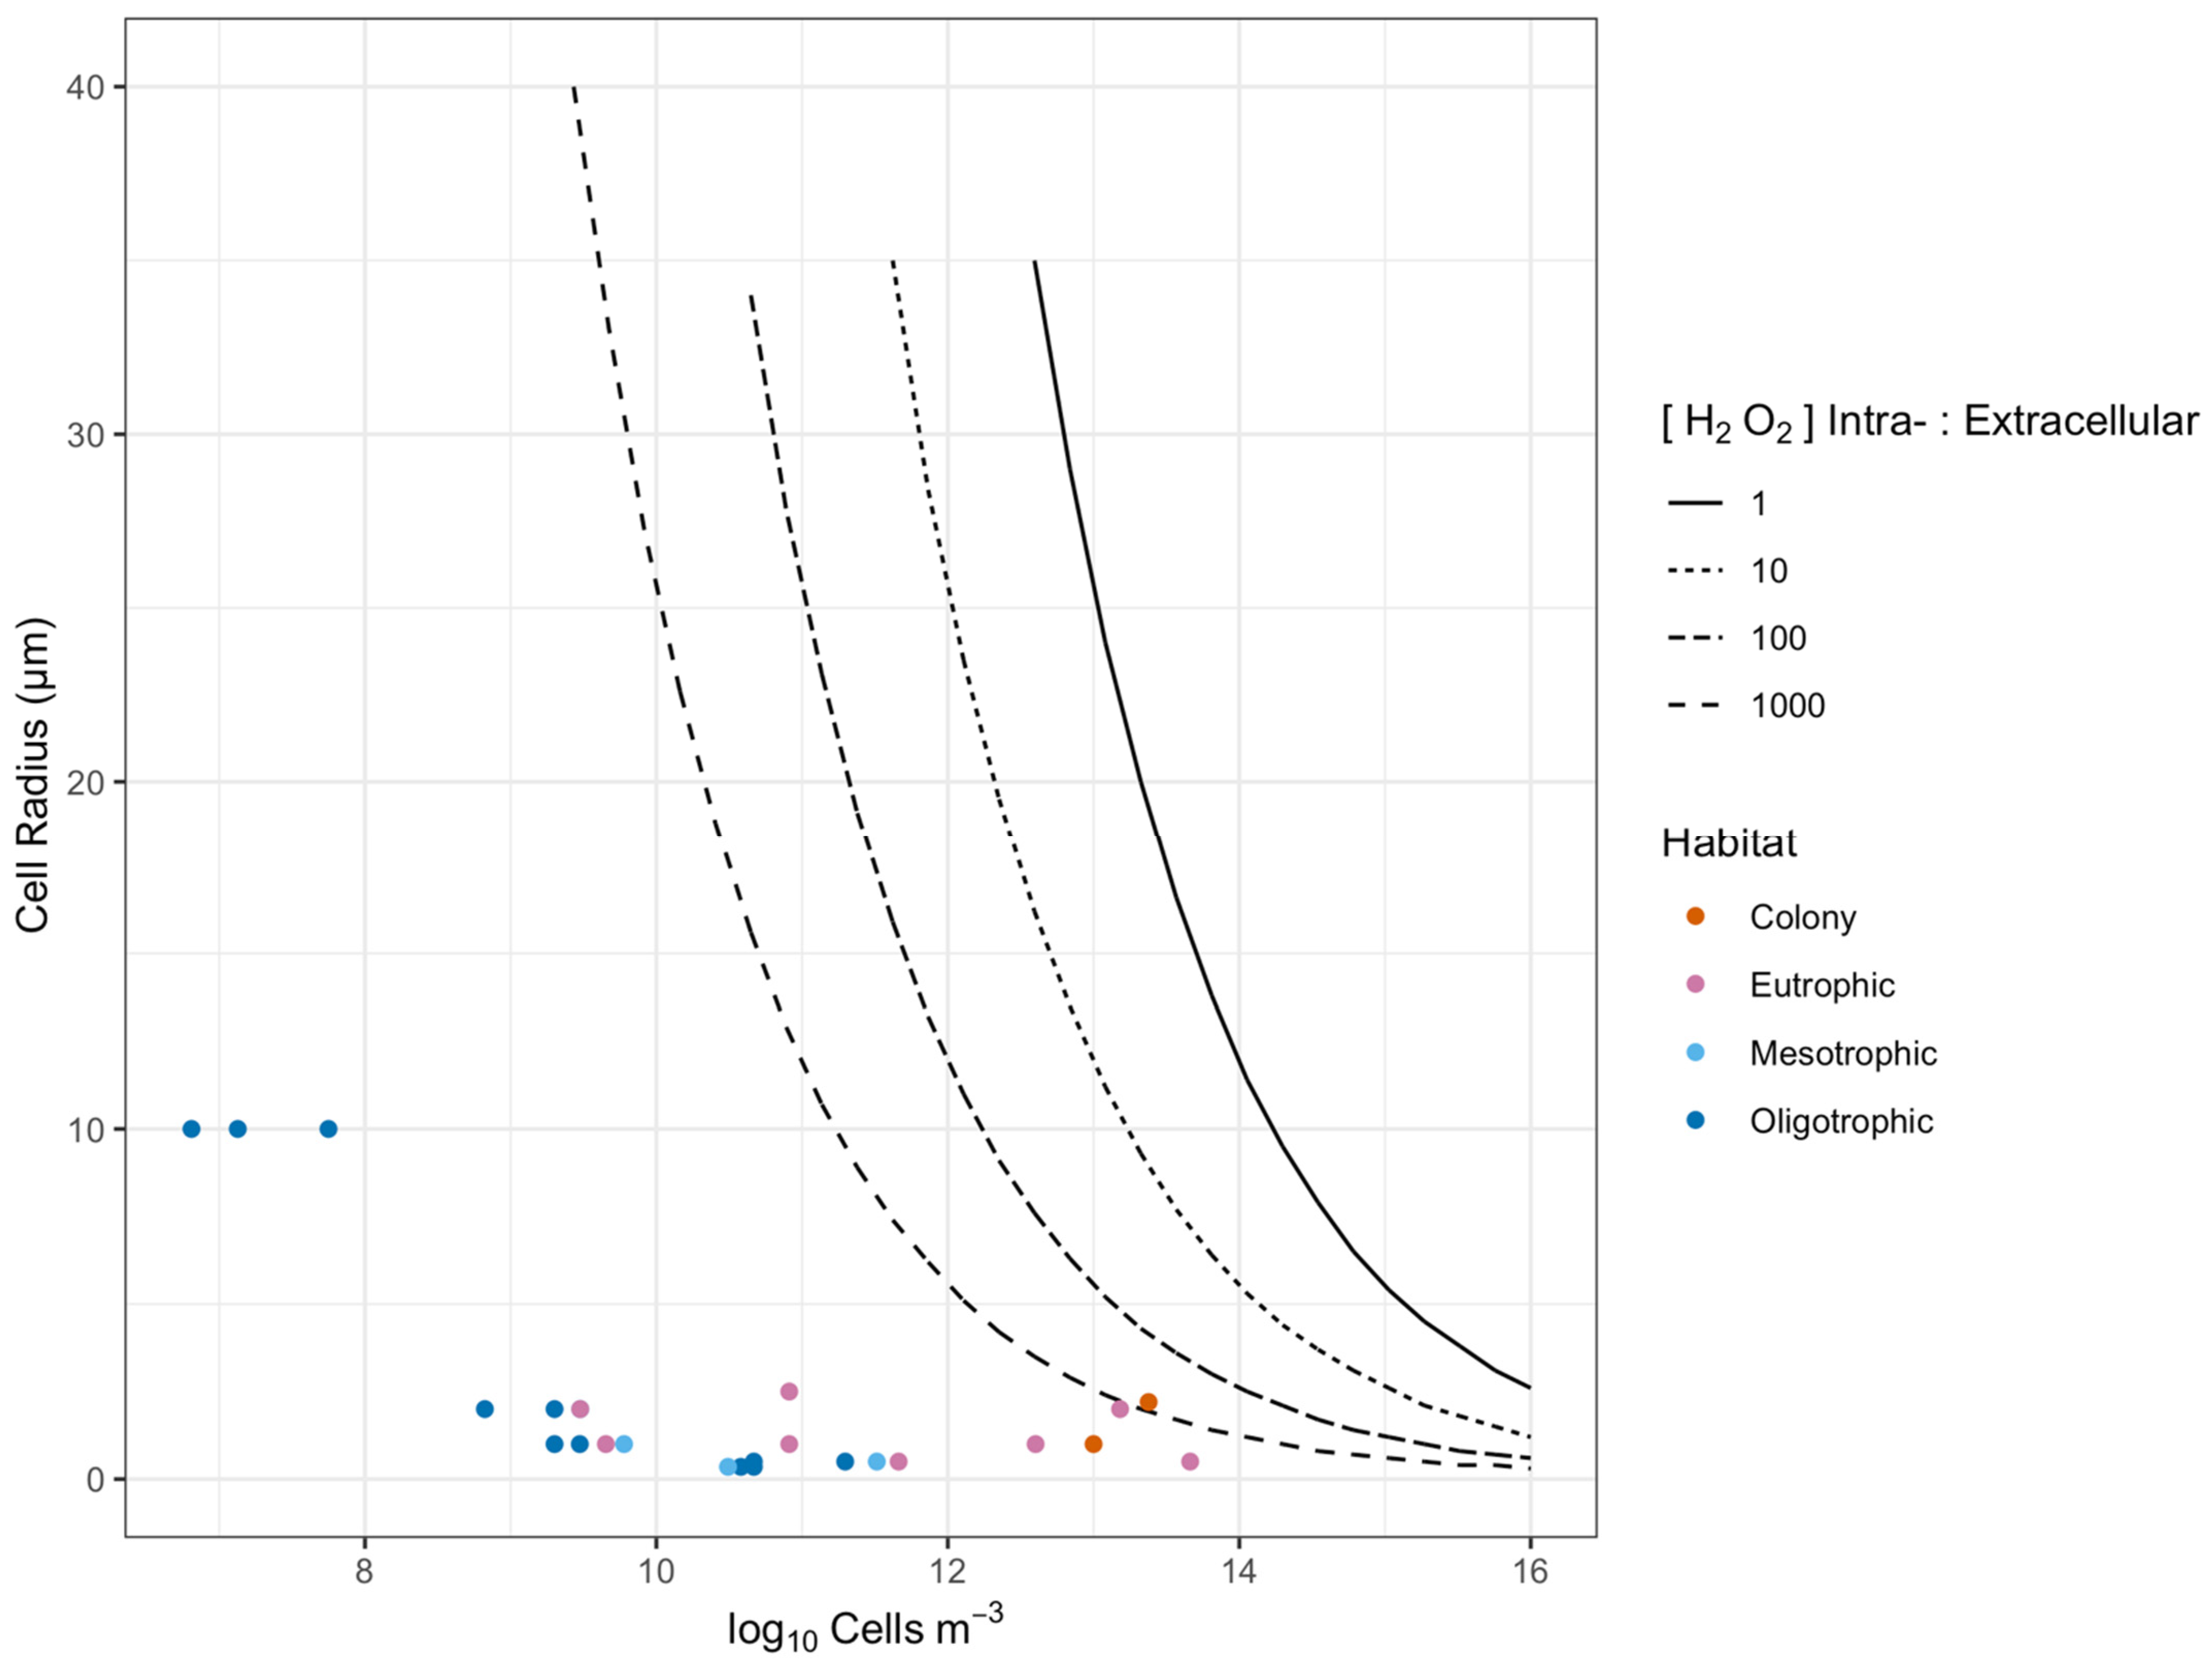
We find that cell size, cell suspension density, cellular [H2O2] and seawater [H2O2] interact to influence the potential for direct cell-to-cell diffusional interactions. We sought to generalize the estimations presented earlier for combinations of taxa x habitat (Figure 3) to summarize how these variables potentially affect cell-to-cell interactions via H2O2 (Figure 5).
Figure 5 plots combinations of cell suspension density (X axis, governing cell-to-cell distance), and the radii of the cell-specific sphere of influence upon [H2O2] exceeding seawater [H2O2] (Y axis), for homogeneous populations. The threshold lines mark the transition for cell-to-cell interactions, for four different ratios of cellular [H2O2] to seawater [H2O2]. The areas above the threshold lines show the regions of cell radius and cell suspension density where the cell-specific spheres of influence upon [H2O2] exceed the average cell-to-cell spacing, for a given ratio of cellular [H2O2] to seawater [H2O2]. For the purpose of presentation, we collapsed cellular [H2O2] and seawater [H2O2] to the ratio of cellular [H2O2] to seawater [H2O2] since that ratio determines the position of the threshold line, rather than the absolute values for cellular [H2O2] and seawater [H2O2]. We see that a homogeneous population of large cells of 40 µm radius would maintain overlapping cell-specific spheres of influence down to cell suspension densities of 2.7 × 10⁹ cells m3 (Figure 5). In contrast, a homogeneous population of cells of 0.5 µm radius would only achieve directly interacting cell-specific spheres of influence at a hypothetical 1.9 × 10¹⁵ cells m3, far above cell suspension densities for most marine habitats (Table 1). For comparison, in Figure 5 we overlay symbols for representative taxa from different habitats (Table 1) showing that for hypothetical homogeneous populations the cell-specific spheres of influence are generally far below the expected cell-to-cell spacing.
Figure 6 shows that for natural population densities of bacterioplankton (Figure 6; Points), the spheres of lowered local [H2O2] would overlap when [H2O2] intracellular:extracellular ratio is less than or equal to 0.01 (Figure 6, short dashed line). However, the limited available information [58] suggests that heterotrophic bacteria maintain an [H2O2] intracellular:extracellular ratio of about 0.1 (Figure 6, dotted line). It is possible that cells may not be able to maintain an intracellular:extracellular [H2O2] ratio of 0.1 at the lowest seawater [H2O2] given the likely roles of H2O2 in cell signaling [36], and the need to maintain a basal [H2O2] [44]. The authors of [58] predict an intracellular steady-state [H2O2] of 20 nM in heterotrophs in the absence of extracellular H2O2, which would suggest that at low extracellular [H2O2], the intracellular:extracellular [H2O2] ratio would be >0.1, and the spheres of lowered local [H2O2] would not overlap (Figure 6). Thus, the cell-specific effects of bacterioplankton upon local [H2O2] are unlikely to overlap at reasonable cell suspension densities.
3. Conclusions
Our approximations of cell-to-cell spacing are applied to each taxa x habitat combination separately, based upon published measures of cell suspension densities in marine systems. We then overlaid the taxa-specific simulations from a given habitat to give a visualization of community level cell-to-cell spacings, across taxa within a habitat (Figure 1). As a next step we aim to implement probability distributions of cell-to-cell spacings across all cells from a mixed community in the habitat, to more accurately capture the likelihood of cell-to-cell interactions. Our work used available cell suspension density data exclusively from marine habitats. In general, we would assume that if cell densities and [H2O2] in freshwater systems are similar to that of marine systems, the diffusional patterns described for marine habitats would be comparable to freshwater systems, but future studies would need to confirm this.
Our simple approximations of diffusion gradients out from cells are limited by a dearth of published information on the intracellular concentrations of H2O2, and other ROS, in phytoplankton or bacterioplankton cells. There are published estimates of intracellular and extracellular H2O2 production and decay rates in seawater, which could support more sophisticated reaction/diffusion simulation approaches.
The threshold lines for interacting cell-specific spheres of influence as functions of cell radii and cell suspension densities are generated for individual ‘taxa’ from marine environments with uniform intracellular [H2O2] (Figure 5), rather than for a mixed community of different cell sizes and physiologies. These fixed threshold lines also apply to a fixed ratio of internal to external [H2O2], whereas this ratio could vary rapidly with changes in cell physiology and external conditions, causing the threshold for direct cell-to-cell interactions to shift. Our models suggest that it is unlikely that H2O2 diffusing out of a phytoplankton cell directly interacts with another phytoplankton cell at natural seawater cell densities (Figure 5), with the exception of Phaeocystis, whereby H2O2 diffusing out of a cell would directly interact with other cells if the intracellular:extracellular [H2O2] ratio is greater than 100. A future approach aims to generate probability distributions for direct cell-to-cell interactions, since even populations with widely spaced cells occasionally generate close cell-to-cell distances. Analyses show higher rates of cell-normalized H2O2 production in bloom-forming phytoplankton taxa, providing support for the selective influence of cell suspension density upon ROS dynamics [29].
It is likely that extracellular ROS play a role in the growth and development of phytoplankton, given that [74] found that the addition of superoxide dismutase and catalase inhibited the growth of Chattonella marina. Our models suggest that H2O2 diffusing out of phytoplankton cells reaches external [H2O2] before interacting with other cells (Figure 3 and Figure 5), and are primarily driven by the influence of diffusion, and with negligible contribution from the decay of H2O2 (Figure 2). Indirect interaction of H2O2 diffusing out of cells is also possible as H2O2 can affect biogeochemical cycles and bioavailability of nutrients [75].
The simple estimates presented herein using H2O2 as a case study are generalizable to other, less stable ROS where decay will be a more immediate influence. For example, O2•− itself is not cell membrane permeable and so forms separate intra- and extracellular pools. However, O2•− is metabolized to H2O2, both inside and outside cells, and so could indirectly influence [H2O2], and thereby alter cell-to-cell interactions beyond the simple diffusion-dominated simulations we present. For example, extracellular production of O2•− by heterotrophic bacteria can significantly alter O2•− concentrations in the dark ocean [28]. Heterotrophs might also produce enough O2•− to indirectly influence concentrations of O2•− in the photic zone of the ocean. The phytoplankter T. weissflogii [34] generates ranges of ~8 × 10⁻¹⁶ mol O2•− cell−1 hr−1, while four raphidophytes show production ranges of 0.45 to 4 × 10⁻¹² mol O2•− cell−1 hr−1 [76], illustrating the wide range of extracellular production which can differentially influence extracellular [ROS] across communities or conditions.
The approaches presented here are a step towards visualizing and constraining estimates of cell-to-cell interactions in plankton communities. We next need to validate these approaches with quantitative estimates of intracellular [H2O2], and other [ROS], within phytoplankton and bacterioplankton cells.
4. Methods, Simplifying Assumptions, and Limitations
4.1. Estimation of Cell to Cell Spacing
A simplistic estimator of cell-to-cell spacing is the reciprocal of the cube root of the cell suspension density. For example, if cell suspension density is expressed as cells µL−1 (equivalent to cells mm−3), the reciprocal of the cube root gives a cell-to-cell spacing estimate in mm. This cube root estimate assumes equally spaced cells, which somewhat overestimates average cell-to-cell spacing, since equally spaced cells give a maximum spacing, not the average spacing of randomly located cells. An arithmetic correction based upon the gamma function of 4/3 generates a numeric correction to multiply the reciprocal of the cube root of the cell suspension density by 0.55 to approximate average spacing of cells [77] (Equation (2)).
We generated simulated cell suspension densities for each taxa and habitat by generating points separated by the average cell spacing between cells, along each of the X, Y, Z spatial axes. We then added random variation to the values of the evenly spaced points (R jitter, factor = 2), to generate a XYZ coordinate cloud. In a parallel approach (data not presented) we directly generated normally distributed random distributions around the average cell spacings, but that approach was computationally slow for denser cell suspension densities. Overlaying the results from co-occurring taxa then gives a visualization of the community in a habitat (Figure 1). Although overlaying data from separately simulated taxa is adequate for visualization, a more sophisticated model would be required to explicitly generate and retrieve the distributions of cell-to-cell distances within, or across, taxa. Furthermore, even in oligotrophic habitats with low average cell suspension densities the few cells present may be clustered non-randomly, an ecological nuance not captured in our approach.
4.2. Simulating Concentration Gradients
To simulate H2O2 concentration gradients generated around a given cell, we consider the cell as a fixed spherical volume which maintains a steady, homeostatic intracellular [H2O2]. For simulation of phytoplankton cells, we set a homeostatic intracellular [H2O2] of 10−6 M, based upon limited literature from other eukaryotes [61], and as a level below the cytotoxic threshold of 10−5 M. For simulation of bacterioplankton cells, we set a homeostatic intracellular [H2O2] of 1/10 the external seawater [H2O2] [58,60].
Using the H2O2 diffusion co-efficient in water, and time increments from 0 µs with a log10 series upwards to 100 µs, we calculate the progressive net diffusional displacement of H2O2 outward from the cell surface. We then estimate dilution of [H2O2] with diffusion outwards from a source ‘Phytoplankton’ cell or diffusion inwards towards a sink ‘Heterotrophic’ cell. In addition to the simple volumetric dilution as ROS diffuses outwards from ‘Phytoplankton’ cells, we add a time-dependent decay term based upon measured lifetimes of H2O2 in seawater, which also vary widely. We use nominal time increments to generate the diffusion distances of H2O2 outward from the cell and to simulate the concurrent effect of pseudo-first order decay as H2O2 moves outward from the cell with time, but this simple simulation assumes a steady state, without considering local mixing or fluctuations in cellular or environmental H2O2.
4.3. Simulating Threshold Radii for [H2O2] above or below Seawater [H2O2]
On a visual plot, the intersect of the [H2O2] outwards from a ‘Phytoplankton’ source cell, with the lowest seawater [H2O2] is obvious, but it proved challenging to estimate this threshold distance when outwardly diffusing [H2O2] declines to the lowest seawater [H2O2]. The time for [H2O2] to decline to seawater [H2O2] depends upon the ratio of intracellular:extracellular [H2O2]; the diffusion coefficient for ROS, which determines how far [H2O2] moves out from the cell radius in a given time interval; and thus the [H2O2] volumetric dilution factor over a given time interval. For [H2O2], concomitant decay was only a negligible factor, but to retain capacity for generalizations to other, less stable [ROS] we nevertheless included an extracellular decay rate constant in the estimations. After algebraic transforms we found that a LambertW function was appropriate [78] to estimate the threshold radius at which [H2O2] around a cell falls to the lowest seawater [H2O2] (Equation (3)).
In Equation (3), [H2O2]seawater is the seawater [H2O2] in the simulated habitat in mol L−1; [H2O2]cell is the intracellular homeostatic [H2O2] in mol L−1; DiffusionRadthreshold in µm is the radius of the diffusion sphere when [H2O2] drops to [H2O2]seawater; CellRadius is the radius of the cell in µm; µ is the pseudo-first order decay constant for H2O2 in seawater; usthreshold is the time in µs at which [H2O2] drops to [H2O2]seawater; Diffusion Coefficient (D) is expressed in µm2 µs−1; W0 is the Lambert W function, also known as the Omega function, used to solve for f(x) = xex.
For ‘Heterotrophic’ sink cells we simulated the sphere of [H2O2] below seawater [H2O2] accounting only for diffusion around the cell without including a rate constant for time-dependent bulk decay because the cell is acting, on top of any decay term, to further lower [H2O2] below seawater [H2O2] (Reaction (4)).
where [H2O2]seawater is again the seawater [H2O2] in the simulated habitat in mol L−1; [H2O2]cell is the intracellular homeostatic [H2O2] in mol L−1; and DiffusionRadthreshold in µm is the radius of the diffusion sphere when [H2O2] drops to [H2O2]seawater; CellRadius is the radius of the cell in µm.
Alter substitutions and re-arrangements:
Where µs_thresh is the elapsed time in µs to reach the threshold [H2O2]; Diffusion Coefficient (D) is expressed in µm2 µs−1; µs [1] is the first simulated time step. We then recover the threshold distance as:
4.4. Simulations and Plotting
We used R [79] running under RStudio [80], using packages ‘tidyverse’ [81], ‘pracma’ [82], ‘ggplot2′ [83], ‘cowplot’ [84], ‘ggpubr’ [85], ‘glue’ [86], ‘kableExtra’ [87], ‘LambertW’ [88], ‘ggforce’ [89], ‘googledrive’ [90], and ‘googlesheets4’ [91]. Citations were managed using Zotero [92] open access reference manager connected to RStudio using the ‘citr’ [93] package, with output generated using the ‘knitr’ [94,95,96] and ‘bookdown’ [97] packages.
Author Contributions
N.M.O. assembled the relevant literature, helped generate the mathematical formulations and figures and contributed to writing and completing the manuscript draft. O.P. contributed to the generation of the initial ideas and contributed to the manuscript draft. J.S.P.M. contributed ideas, literature and in particular formulated the concept for Figure 5. D.A.C. contributed to the generation of initial ideas, wrote the manuscript draft and helped complete the manuscript. All authors contributed extensive revisions and edits to the manuscript. All authors have read and agreed to the published version of the manuscript.
Funding
NMO was supported by the Mount Allison University Rice Memorial Graduate Fellowship and a New Brunswick Innovation Foundation STEM Graduate Award. DAC was supported by the Canada Research Chair in Phytoplankton Ecophysiology and by the Microbiology Institute of the Czech Academy of Science through project CZ.02.2.69/0.0/0.0/16_027/0007990 of the European Union Researcher Mobility program.
Institutional Review Board Statement
Not applicable.
Informed Consent Statement
Not applicable.
Data Availability Statement
The RStudio workbook used to generate this document is hosted at https://github.com/NaamanOmar/ROS_bioinfo.git.
Acknowledgments
The authors thank Maximilian Berthold for his comments.
Conflicts of Interest
The authors declare no conflict of interest.
References
- Reynolds, C.S. The Ecology of Phytoplankton; Cambridge University Press: Cambridge, UK, 2006; ISBN 978-1-139-45489-6. [Google Scholar]
- Falkowski, P.G.; Katz, M.E.; Knoll, A.H.; Quigg, A.; Raven, J.A.; Schofield, O.; Taylor, F.J.R. The Evolution of Modern Eukaryotic Phytoplankton. Sci. Wash. 2004, 305, 354–360. [Google Scholar] [CrossRef] [PubMed] [Green Version]
- Purcell, E.M. Life at Low Reynolds Number. Am. J. Phys. 1976, 45, 3–11. [Google Scholar] [CrossRef] [Green Version]
- Finkel, Z.V.; Beardall, J.; Flynn, K.J.; Quigg, A.; Rees, T.A.V.; Raven, J.A. Phytoplankton in a Changing World: Cell Size and Elemental Stoichiometry. J. Plankton Res. 2010, 32, 119–137. [Google Scholar] [CrossRef] [Green Version]
- Stolte, W.; Riegman, R. Effect of Phytoplankton Cell Size on Transient-State Nitrate and Ammonium Uptake Kinetics. Microbiology 1995, 141, 1221–1229. [Google Scholar] [CrossRef] [PubMed] [Green Version]
- Gemmell, B.J.; Oh, G.; Buskey, E.J.; Villareal, T.A. Dynamic Sinking Behaviour in Marine Phytoplankton: Rapid Changes in Buoyancy May Aid in Nutrient Uptake. Proc. R. Soc. B Biol. Sci. 2016, 283, 20161126. [Google Scholar] [CrossRef]
- Bertrand, E.M.; McCrow, J.P.; Moustafa, A.; Zheng, H.; McQuaid, J.B.; Delmont, T.O.; Post, A.F.; Sipler, R.E.; Spackeen, J.L.; Xu, K.; et al. Phytoplanktonbacterial Interactions Mediate Micronutrient Colimitation at the Coastal Antarctic Sea Ice Edge. Proc. Natl. Acad. Sci. USA 2015, 112, 9938–9943. [Google Scholar] [CrossRef] [Green Version]
- Jakobsen, H.; Tang, K. Effects of Protozoan Grazing on Colony Formation in Phaeocystis Globosa (Prymnesiophyceae) and the Potential Costs and Benefits. Aquat. Microb. Ecol. 2002, 27, 261–273. [Google Scholar] [CrossRef] [Green Version]
- Robarts, R.; Zohary, T.; Waiser, M.; Yacobi, Y. Bacterial Abundance, Biomass, and Production in Relation to Phytoplankton Biomass in the Levantine Basin of the Southeastern Mediterranean Sea. Mar. Ecol. Prog. Ser. 1996, 137, 273–281. [Google Scholar] [CrossRef]
- Grob, C.; Ulloa, O.; Li, W.; Alarcón, G.; Fukasawa, M.; Watanabe, S. Picoplankton Abundance and Biomass Across the Eastern South Pacific Ocean Along Latitude 32.5. Mar. Ecol. Prog. Ser. 2007, 332, 53–62. [Google Scholar] [CrossRef] [Green Version]
- Olguín, H.F.; Boltovskoy, D.; Lange, C.B.; Brandini, F.; Flynn, K.J. Distribution of Spring Phytoplankton (Mainly Diatoms) in the Upper 50 m of the Southwestern Atlantic Ocean (30). J. Plankton Res. 2006, 28, 1107–1128. [Google Scholar] [CrossRef] [Green Version]
- Agustí, S.; Llabrés, M. Solar Radiation-induced Mortality of Marine Pico-phytoplankton in the Oligotrophic Ocean. Photochem. Photobiol. 2007, 83, 793–801. [Google Scholar] [CrossRef] [PubMed]
- Klinkenberg, G.; Schumann, R. Abundance Changes of Autotrophic and Heterotrophic Picoplankton in the Zingster Strom, a Shallow, Tideless Estuary South of the Darß-Zingst Peninsula (Southern Baltic Sea). Arch. Hydrobiol. 1995, 134, 359–377. [Google Scholar] [CrossRef]
- Albrecht, M.; Pröschold, T.; Schumann, R. Identification of Cyanobacteria in a Eutrophic Coastal Lagoon on the Southern Baltic Coast. Front. Microbiol. 2017, 8, 923. [Google Scholar] [CrossRef] [PubMed] [Green Version]
- Pintoa, E.; Van Nieuwerburgha, L.; De Barros, M.P.; Pedersén, M.; Colepicolo, P.; Snoeijs, P. Density-Dependent Patterns of Thiamine and Pigment Production in the Diatom Nitzschia Microcephala. Phytochemistry 2003, 63, 155–163. [Google Scholar] [CrossRef]
- Fogel, M.L.; Cifuentes, L.A.; Velinsky, D.J.; Sharp, J.H. Relationship of Carbon Availability in Estuarine Phytoplankton to Isotopic Composition. Mar. Ecol. Prog. Ser. 1992, 82, 291–301. [Google Scholar] [CrossRef]
- Hansen, P.J.; Lundholm, N.; Rost, B. Growth Limitation in Marine Red-Tide Dinoflagellates: Efects of pH Versus Inorganic Carbon Availability. Mar. Ecol. Prog. Ser. 2007, 334, 10. [Google Scholar] [CrossRef] [Green Version]
- Avery, G.B.; Cooper, W.J.; Kieber, R.J.; Willey, J.D. Hydrogen Peroxide at the Bermuda Atlantic Time Series Station: Temporal Variability of Seawater Hydrogen Peroxide. Mar. Chem. 2005, 97, 236–244. [Google Scholar] [CrossRef]
- Kearns, K.D.; Hunter, M.D. Algal Extracellular Products Suppress Anabaena Flos-Aquae Heterocyst Spacing. Microb. Ecol. 2002, 43, 174–180. [Google Scholar] [CrossRef]
- Biller, S.J.; Berube, P.M.; Lindell, D.; Chisholm, S.W. Prochlorococcus: The Structure and Function of Collective Diversity. Nat. Rev. Microbiol. 2015, 13, 13–27. [Google Scholar] [CrossRef]
- Kozuleva, M.A.; Ivanov, B.N.; Vetoshkina, D.V.; Borisova-Mubarakshina, M.M. Minimizing an Electron Flow to Molecular Oxygen in Photosynthetic Electron Transfer Chain: An Evolutionary View. Front. Plant Sci. 2020, 11, 211. [Google Scholar] [CrossRef] [Green Version]
- Sharma, P.; Jha, A.B.; Dubey, R.S.; Pessarakli, M. Reactive Oxygen Species, Oxidative Damage, and Antioxidative Defense Mechanism in Plants Under Stressful Conditions. J. Bot. 2012, 2012, e217037. [Google Scholar] [CrossRef] [Green Version]
- Li, R.; Jia, Z.; Trush, M.A. Defining ROS in Biology and Medicine. React. Oxyg. Species (Apex) 2016, 1, 9–21. [Google Scholar] [CrossRef] [PubMed] [Green Version]
- Radi, R. Oxygen Radicals, Nitric Oxide, and Peroxynitrite: Redox Pathways in Molecular Medicine. Proc. Natl. Acad. Sci. USA 2018, 115, 5839–5848. [Google Scholar] [CrossRef] [Green Version]
- Fridovich, I. Oxygen Toxicity: A Radical Explanation. J. Exp. Biol. 1998, 201, 1203–1209. [Google Scholar] [CrossRef]
- Zinser, E.R. The Microbial Contribution to Reactive Oxygen Species Dynamics in Marine Ecosystems. Environ. Microbiol. Rep. 2018, 10, 412–427. [Google Scholar] [CrossRef] [PubMed]
- Zhang, T.; Hansel, C.M.; Voelker, B.M.; Lamborg, C.H. Extensive Dark Biological Production of Reactive Oxygen Species in Brackish and Freshwater Ponds. Environ. Sci. Technol. 2016, 50, 2983–2993. [Google Scholar] [CrossRef] [PubMed]
- Diaz, J.M.; Hansel, C.M.; Voelker, B.M.; Mendes, C.M.; Andeer, P.F.; Zhang, T. Widespread Production of Extracellular Superoxide by Heterotrophic Bacteria. Science 2013, 340, 1223–1226. [Google Scholar] [CrossRef] [PubMed]
- Diaz, J.M.; Plummer, S. Production of Extracellular Reactive Oxygen Species by Phytoplankton: Past and Future Directions. J. Plankton Res. 2018, 40, 655–666. [Google Scholar] [CrossRef] [Green Version]
- Diaz, J.M.; Plummer, S.; Tomas, C.; Alves-de-Souza, C. Production of Extracellular Superoxide and Hydrogen Peroxide by Five Marine Species of Harmful Bloom-Forming Algae. J. Plankton Res. 2018, 40, 667–677. [Google Scholar] [CrossRef] [Green Version]
- Rose, A.L.; Webb, E.A.; Waite, T.D.; Moffett, J.W. Measurement and Implications of Nonphotochemically Generated Superoxide in the Equatorial Pacific Ocean. Environ. Sci. Technol. 2008, 42, 2387–2393. [Google Scholar] [CrossRef]
- Schneider, R.J.; Roe, K.L.; Hansel, C.M.; Voelker, B.M. Species-Level Variability in Extracellular Production Rates of Reactive Oxygen Species by Diatoms. Front. Chem. 2016, 4, 5. [Google Scholar] [CrossRef] [PubMed] [Green Version]
- Sutherland, K.M.; Coe, A.; Gast, R.J.; Plummer, S.; Suffridge, C.P.; Diaz, J.M.; Bowman, J.S.; Wankel, S.D.; Hansel, C.M. Extracellular Superoxide Production by Key Microbes in the Global Ocean. Limnol. Oceanogr. 2019, 64, 2679–2693. [Google Scholar] [CrossRef] [Green Version]
- Kustka, A.B.; Shaked, Y.; Milligan, A.J.; King, D.W.; Morel, F.M.M. Extracellular Production of Superoxide by Marine Diatoms: Contrasting Effects on Iron Redox Chemistry and Bioavailability. Limnol. Oceanogr. 2005, 50, 1172–1180. [Google Scholar] [CrossRef]
- Hansel, C.M.; Buchwald, C.; Diaz, J.M.; Ossolinski, J.E.; Dyhrman, S.T.; Mooy, B.A.S.V.; Polyviou, D. Dynamics of Extracellular Superoxide Production by Trichodesmium Colonies from the Sargasso Sea. Limnol. Oceanogr. 2016, 61, 1188–1200. [Google Scholar] [CrossRef] [Green Version]
- Mittler, R.; Vanderauwera, S.; Suzuki, N.; Miller, G.; Tognetti, V.B.; Vandepoele, K.; Gollery, M.; Shulaev, V.; Breusegem, F.V. ROS Signaling: The New Wave? Trends Plant Sci. 2011, 16, 300–309. [Google Scholar] [CrossRef]
- Rhee, S.G. H2O2, a Necessary Evil for Cell Signaling. Science 2006, 312, 1882–1883. [Google Scholar] [CrossRef]
- del Río, L.A.; López-Huertas, E. ROS Generation in Peroxisomes and Its Role in Cell Signaling. Plant Cell Physiol. 2016, 57, 1364–1376. [Google Scholar] [CrossRef]
- del Río, L.A.; Puppo, A. (Eds.) Reactive Oxygen Species in Plant Signaling, Signaling and Communication in Plants; Springer: Dordrecht, The Netherlands; New York, NY, USA, 2009; ISBN 978-3-642-00389-9/978-3-642-00390-5. [Google Scholar]
- Foyer, C.H.; Noctor, G. Redox Homeostasis and Antioxidant Signaling: A Metabolic Interface Between Stress Perception and Physiological Responses. Plant Cell 2005, 17, 1866–1875. [Google Scholar] [CrossRef] [Green Version]
- Schmitt, F.-J.; Renger, G.; Friedrich, T.; Kreslavski, V.D.; Zharmukhamedov, S.K.; Los, D.A.; Kuznetsov, V.V.; Allakhverdiev, S.I. Reactive Oxygen Species: Re-evaluation of Generation, Monitoring and Role in Stress-Signaling in Phototrophic Organisms. Biochim. Biophys. Acta (BBA) Bioenerg. 2014, 1837, 835–848. [Google Scholar] [CrossRef] [Green Version]
- Miller, G.; Suzuki, N.; Ciftci-Yilmaz, S.; Mittler, R. Reactive Oxygen Species Homeostasis and Signalling During Drought and Salinity Stresses. Plant Cell Environ. 2010, 33, 453–467. [Google Scholar] [CrossRef]
- Shi, K.; Gao, Z.; Shi, T.-Q.; Song, P.; Ren, L.-J.; Huang, H.; Ji, X.-J. Reactive Oxygen Species-Mediated Cellular Stress Response and Lipid Accumulation in Oleaginous Microorganisms: The State of the Art and Future Perspectives. Front. Microbiol. 2017, 8, 793. [Google Scholar] [CrossRef] [PubMed]
- Mittler, R. ROS Are Good. Trends Plant Sci. 2017, 22, 11–19. [Google Scholar] [CrossRef] [PubMed] [Green Version]
- Schneider, R. Kinetics of Biological Hydrogen Peroxide Production. Ph.D. Thesis, Colorado School of Mines, Golden, CO, USA, 2015. [Google Scholar]
- Millero, F.J.; Sharma, V.K.; Karn, B. The Rate of Reduction of Copper(II) with Hydrogen Peroxide in Seawater. Mar. Chem. 1991, 36, 71–83. [Google Scholar] [CrossRef]
- Moffett, J.W.; Zika, R.G. Reaction Kinetics of Hydrogen Peroxide with Copper and Iron in Seawater. Environ. Sci. Technol. 1987, 21, 804–810. [Google Scholar] [CrossRef] [PubMed]
- Kelly, T.J.; Daum, P.H.; Schwartz, S.E. Measurements of Peroxides in Cloudwater and Rain. J. Geophys. Res. Atmos. 1985, 90, 7861–7871. [Google Scholar] [CrossRef]
- Morris, J.J.; Johnson, Z.I.; Wilhelm, S.W.; Zinser, E.R. Diel Regulation of Hydrogen Peroxide Defenses by Open Ocean Microbial Communities. J. Plankton Res. 2016, 38, 1103–1114. [Google Scholar] [CrossRef]
- Yuan, J.; Shiller, A.M. The Distribution of Hydrogen Peroxide in the Southern and Central Atlantic Ocean. Deep Sea Res. Part II Top. Stud. Oceanogr. 2001, 48, 2947–2970. [Google Scholar] [CrossRef]
- Tjell, A.Ø.; Almdal, K. Diffusion Rate of Hydrogen Peroxide Through Water-Swelled Polyurethane Membranes. Sens. Bio-Sens. Res. 2018, 21, 35–39. [Google Scholar] [CrossRef]
- Lesser, M.P. Oxidative Stress in Marine Environments: Biochemistry and Physiological Ecology. Annu. Rev. Physiol. 2006, 68, 253–278. [Google Scholar] [CrossRef] [Green Version]
- Halliwell, B.; Gutteridge, J.M.C. Free Radicals in Biology and Medicine, 3rd ed.; Oxford Science Publications: Oxford, UK; Clarendon Press, Oxford University Press: Oxford, UK, 1999; ISBN 978-0-19-850045-2/978-0-19-850044-5. [Google Scholar]
- González-Flecha, B.; Demple, B. Homeostatic Regulation of Intracellular Hydrogen Peroxide Concentration in Aerobically Growing Escherichia Coli. J. Bacteriol. 1997, 179, 382–388. [Google Scholar] [CrossRef] [Green Version]
- Lyublinskaya, O.; Antunes, F. Measuring Intracellular Concentration of Hydrogen Peroxide with the Use of Genetically Encoded H2O2 Biosensor HyPer. Redox Biol. 2019, 24, 101200. [Google Scholar] [CrossRef] [PubMed]
- Stone, J.R.; Yang, S. Hydrogen Peroxide: A Signaling Messenger. Antioxid. Redox Signal. 2006, 8, 243–270. [Google Scholar] [CrossRef] [PubMed]
- Sies, H. Hydrogen Peroxide as a Central Redox Signaling Molecule in Physiological Oxidative Stress: Oxidative Eustress. Redox Biol. 2017, 11, 613–619. [Google Scholar] [CrossRef]
- Seaver, L.C.; Imlay, J.A. Hydrogen Peroxide Fluxes and Compartmentalization Inside Growing Escherichia Coli. J. Bacteriol. 2001, 183, 7182–7189. [Google Scholar] [CrossRef] [PubMed] [Green Version]
- Huang, B.K.; Sikes, H.D. Quantifying Intracellular Hydrogen Peroxide Perturbations in Terms of Concentration. Redox Biol. 2014, 2, 955–962. [Google Scholar] [CrossRef] [Green Version]
- Li, X.; Imlay, J.A. Improved Measurements of Scant Hydrogen Peroxide Enable Experiments That Define Its Threshold of Toxicity for Escherichia Coli. Free Radic. Biol. Med. 2018, 120, 217–227. [Google Scholar] [CrossRef]
- Forman, H.J.; Bernardo, A.; Davies, K.J.A. What Is the Concentration of Hydrogen Peroxide in Blood and Plasma? Arch. Biochem. Biophys. 2016, 603, 48–53. [Google Scholar] [CrossRef]
- Winterbourn, C.C.; Hampton, M.B. Thiol Chemistry and Specificity in Redox Signaling. Free Radic. Biol. Med. 2008, 45, 549–561. [Google Scholar] [CrossRef]
- Apel, K.; Hirt, H. Reactive Oxygen Species: Metabolism, Oxidative Stress, and Signal Transduction. Annu. Rev. Plant Biol. 2004, 55, 373–399. [Google Scholar] [CrossRef] [Green Version]
- Fedurayev, P.V.; Mironov, K.S.; Gabrielyan, D.A.; Bedbenov, V.S.; Zorina, A.A.; Shumskaya, M.; Los, D.A. Hydrogen Peroxide Participates in Perception and Transduction of Cold Stress Signal in Synechocystis. Plant Cell Physiol. 2018, 59, 1255–1264. [Google Scholar] [CrossRef]
- Khademian, M.; Imlay, J.A. Escherichia Coli Cytochrome c Peroxidase Is a Respiratory Oxidase That Enables the Use of Hydrogen Peroxide as a Terminal Electron Acceptor. Proc. Natl. Acad. Sci. USA 2017, 114, E6922–E6931. [Google Scholar] [CrossRef] [PubMed] [Green Version]
- Bienert, G.P.; Chaumont, F. Aquaporin-Facilitated Transmembrane Diffusion of Hydrogen Peroxide. Biochim. Biophys. Acta 2014, 1840, 1596–1604. [Google Scholar] [CrossRef] [PubMed]
- Almasalmeh, A.; Krenc, D.; Wu, B.; Beitz, E. Structural Determinants of the Hydrogen Peroxide Permeability of Aquaporins. FEBS J. 2014, 281, 647–656. [Google Scholar] [CrossRef] [PubMed]
- Wang, H.; Schoebel, S.; Schmitz, F.; Dong, H.; Hedfalk, K. Characterization of Aquaporin-Driven Hydrogen Peroxide Transport. Biochim. Biophys. Acta (BBA) Biomembr. 2020, 1862, 183065. [Google Scholar] [CrossRef]
- Miller, E.W.; Dickinson, B.C.; Chang, C.J. Aquaporin-3 Mediates Hydrogen Peroxide Uptake to Regulate Downstream Intracellular Signaling. Proc. Natl. Acad. Sci. USA 2010, 107, 15681–15686. [Google Scholar] [CrossRef] [Green Version]
- Bond, R.J.; Hansel, C.M.; Voelker, B.M. Heterotrophic Bacteria Exhibit a Wide Range of Rates of Extracellular Production and Decay of Hydrogen Peroxide. Front. Mar. Sci. 2020, 7, 72. [Google Scholar] [CrossRef] [Green Version]
- Coe, A.; Ghizzoni, J.; LeGault, K.; Biller, S.; Roggensack, S.E.; Chisholm, S.W. Survival of Prochlorococcus in Extended Darkness. Limnol. Oceanogr. 2016, 61, 1375–1388. [Google Scholar] [CrossRef]
- Zinser, E.R. Cross-Protection from Hydrogen Peroxide by Helper Microbes: The Impacts on the Cyanobacterium Prochlorococcus and Other Beneficiaries in Marine Communities. Environ. Microbiol. Rep. 2018, 10, 199–411. [Google Scholar] [CrossRef]
- Zhu, Z.; Meng, R.; Smith, W.O., Jr.; Doan-Nhu, H.; Nguyen-Ngoc, L.; Jiang, X. Bacterial Composition Associated With Giant Colonies of the Harmful Algal Species Phaeocystis Globosa. Front. Microbiol. 2021, 12, 737484. [Google Scholar] [CrossRef]
- Oda, T.; Moritomi, J.; Kawano, I.; Hamaguchi, S.; Ishimatsu, A.; Muramatsu, T. Catalase- and Superoxide Dismutase-induced Morphological Changes and Growth Inhibition in the Red Tide Phytoplankton Chattonella Marina. Biosci. Biotechnol. Biochem. 1995, 59, 2044–2048. [Google Scholar] [CrossRef]
- Morris, J.J.; Rose, A.L.; Lu, Z. Reactive Oxygen Species in the World Ocean and Their Impacts on Marine Ecosystems. Redox Biol. 2022, 52, 102285. [Google Scholar] [CrossRef] [PubMed]
- Oda, T.; Nakamura, A.; Shikayama, M.; Kawano, I.; Ishimatsu, A.; Muramatsu, T. Generation of Reactive Oxygen Species by Raphidophycean Phytoplankton. Biosci. Biotechnol. Biochem. 1997, 61, 1658–1662. [Google Scholar] [CrossRef] [PubMed]
- Average Separation of Objects within a Volume? 2009. Available online: http://www.forum.cosmoquest.org/showthread.php?93443-Average-separation-of-objects-within-a-volume (accessed on 21 October 2021).
- Lambert W Function. 2022. Available online: https://en.wikipedia.org/wiki/Lambert_W_function (accessed on 19 January 2022).
- RC Team. R: A Language and Environment for Statistical Computing; R Foundation for Statistical Computing: Vienna, Austria, 2019. [Google Scholar]
- RStudio Team. RStudio: Integrated Development Environment for R.; RStudio, Inc.: Boston, MA, USA, 2015. [Google Scholar]
- Wickham, H.; Averick, M.; Bryan, J.; Chang, W.; McGowan, L.D.; François, R.; Grolemund, G.; Hayes, A.; Henry, L.; Hester, J.; et al. Welcome to the tidyverse. J. Open Source Softw. 2019, 4, 1686. [Google Scholar] [CrossRef]
- Borchers, H.W. Pracma: Practical Numerical Math Functions. 2021. Available online: https://cran.r-project.org/web/packages/pracma/index.html (accessed on 22 October 2021).
- Wickham, H. Ggplot2: Elegant Graphics for Data Analysis; Springer: New York, NY, USA, 2016; ISBN 978-3-319-24277-4. [Google Scholar]
- Wilke, C.O. Cowplot: Streamlined Plot Theme and Plot Annotations for ‘Ggplot2’. 2019. Available online: https://cran.r-project.org/web/packages/ggplot2/index.html (accessed on 12 December 2021).
- Kassambara, A. Ggpubr: ‘Ggplot2’ Based Publication Ready Plots. 2018. Available online: https://cran.r-project.org/web/packages/ggpubr/index.html (accessed on 17 July 2019).
- Hester, J. Glue: Interpreted String Literals. 2018. Available online: https://cran.r-project.org/web/packages/glue/index.html (accessed on 17 July 2019).
- Zhu, H. kableExtra: Construct Complex Table with ‘Kable’ and Pipe Syntax. 2019. Available online: https://cran.r-project.org/web/packages/kableExtra/index.html (accessed on 30 July 2019).
- Goerg, G.M. LambertW: Probabilistic Models to Analyze and Gaussianize Heavy-Tailed, Skewed Data. 2020. Available online: https://cran.r-project.org/web/packages/LambertW/index.html (accessed on 16 December 2020).
- Pedersen, T.L. RStudio Ggforce: Accelerating ‘Ggplot2’. 2021. Available online: https://cran.r-project.org/web/packages/ggforce/index.html (accessed on 5 March 2021).
- D’Agostino McGowan, L.; Bryan, J. Googledrive: An Interface to Google Drive. 2020. Available online: https://cran.r-project.org/web/packages/googledrive/index.html (accessed on 21 October 2021).
- Bryan, J. Googlesheets4: Access Google Sheets Using the Sheets API V4. 2021. Available online: https://cran.r-project.org/web/packages/googlesheets4/index.html (accessed on 21 October 2021).
- Zotero|Your Personal Research Assistant. Available online: https://www.zotero.org/ (accessed on 7 December 2021).
- Aust, F. Citr: ’RStudio’ Add-in to Insert Markdown Citations. 2018. Available online: https://github.com/crsh/citr (accessed on 17 July 2019).
- Xie, Y. Knitr: A Comprehensive Tool for Reproducible Research in R. In Implementing Reproducible Computational Research; Stodden, V., Leisch, F., Peng, R.D., Eds.; Chapman and Hall/CRC: Boca Raton, FL, USA, 2014; Available online: https://www.taylorfrancis.com/chapters/edit/10.1201/9781315373461-1/knitr-comprehensive-tool-reproducible-research-yihui-xie (accessed on 30 July 2019).
- Xie, Y. Dynamic Documents with R and Knitr; Chapman and Hall/CRC: Boca Raton, FL, USA, 2015; Available online: https://duhi23.github.io/Analisis-de-datos/Yihue.pdf (accessed on 30 July 2019).
- Xie, Y. Knitr: A General-Purpose Package for Dynamic Report Generation in R; 2018. Available online: https://cran.r-project.org/web/packages/knitr/index.html (accessed on 30 July 2019).
- Xie, Y. Bookdown: Authoring Books and Technical Documents with R Markdown; 2019. Available online: https://cran.r-project.org/web/packages/bookdown/index.html (accessed on 22 November 2021).
Figure 1.
Phytoplankton and heterotrophic bacteria spacing from eutrophic or oligotrophic environments, with cell size on the same scaling as the 1 mm XY spatial axes. A 1 mm Z spatial axis is coded with fainter points farther back.
Figure 1.
Phytoplankton and heterotrophic bacteria spacing from eutrophic or oligotrophic environments, with cell size on the same scaling as the 1 mm XY spatial axes. A 1 mm Z spatial axis is coded with fainter points farther back.

Figure 2.
Estimates of concentration gradients of [H2O2] vs. distance outwards from ‘heterotrophic’ Bacterioplankton cell maintaining an internal [H2O2] below seawater background [H2O2] (blue band); or outwards from ‘Phytoplankton’ cells of different radii, maintaining an internal [H2O2] equal to 1/10 the cytotoxic threshold for [H2O2]. Orange indicates cytotoxic concentration range for [H2O2] (1 × 10⁻⁵ to 1 × 10⁻⁴ M). Black points show modelled [H2O2] under the influence of dilution alone. Red points show modelled [H2O2] under superimposed influences of dilution and (negligible) decay of H2O2. Vertical green lines indicate the cell surface. Vertical dashed lines indicate threshold radii out from cells, where [H2O2] around the cell falls or rises to seawater background levels. Beyond that threshold, the cell has no specific, local influence upon seawater [H2O2].

Figure 3.
Simulations of [H2O2] above seawater [H2O2] (pale blue) out from Phytoplankton cells (green spheres, spanning a size range), or [H2O2] below seawater [H2O2] out from Bacterioplankton cells (red spheres, single nominal cell size). Cell position along a third Z axis is simulated by the ‘alpha’ with lighter cells further back.

Figure 4.
Simulation of [H2O2] above seawater [H2O2] within a Phaeocystis colony. Note the expansion of the axes scales to 0.1 mm. Cell position along a third Z axis is simulated by the ‘alpha’ with lighter cells further back.
Figure 4.
Simulation of [H2O2] above seawater [H2O2] within a Phaeocystis colony. Note the expansion of the axes scales to 0.1 mm. Cell position along a third Z axis is simulated by the ‘alpha’ with lighter cells further back.

Figure 5.
Thresholds for direct phytoplankton cell-to-cell interaction through [H2O2] above seawater background. The X axis shows a range of cell m−3 (which in turn governs cell-to-cell distances), while the Y axis shows radii for cell-specific spheres of influence upon [H2O2] (a function of cell size, intracellular [H2O2] and seawater [H2O2]). The areas below the threshold lines show combinations where phytoplankton cell-to-cell distance exceeds the cell-specific [H2O2] distance, so direct cell-to-cell interactions mediated by [H2O2] are unlikely. The area above the threshold lines show combinations where phytoplankton cell-to-cell distance is less than the cell-specific [H2O2] distance, so direct cell-to-cell interactions mediated by [H2O2] are feasible. The four threshold lines refer to a range of ratios of phytoplankton intracellular to extracellular [H2O2]. Data points from different habitats show that direct phytoplankton cell-to-cell interactions are likely only within the Phaeocystis colony, whereas single phytoplankton cells are generally too small or too distant for direct interactions.

Figure 6.
Thresholds for direct bacterioplankton cell-to-cell interaction through [H2O2] above seawater background. The X axis shows a range of cell m−3 (which in turn governs cell-to-cell distances), while the Y axis shows radii for cell-specific spheres of influence upon [H2O2] (a function of cell size, intracellular [H2O2] and seawater [H2O2]). The areas below the threshold lines show combinations where bacterioplankton cell-to-cell distance exceeds the cell-specific [H2O2] distance, so direct cell-to-cell interactions mediated by [H2O2] are unlikely. The area above the threshold lines show combinations where bacterioplankton cell-to-cell distance is less than the cell-specific [H2O2] distance, so direct cell-to-cell interactions mediated by [H2O2] are feasible. The four threshold lines refer to a range of ratios of bacterioplankton intracellular to extracellular [H2O2]. Data points from different habitats show that direct bacterioplankton cell-to-cell interactions are likely, over a range of reasonable ratios of intracellular to extracellular [H2O2], at >1010 cells m−3.

Publisher’s Note: MDPI stays neutral with regard to jurisdictional claims in published maps and institutional affiliations. |
© 2022 by the authors. Licensee MDPI, Basel, Switzerland. This article is an open access article distributed under the terms and conditions of the Creative Commons Attribution (CC BY) license (https://creativecommons.org/licenses/by/4.0/).
Share and Cite
MDPI and ACS Style
Omar, N.M.; Prášil, O.; McCain, J.S.P.; Campbell, D.A. Diffusional Interactions among Marine Phytoplankton and Bacterioplankton: Modelling H2O2 as a Case Study. Microorganisms 2022, 10, 821. https://doi.org/10.3390/microorganisms10040821
AMA Style
Omar NM, Prášil O, McCain JSP, Campbell DA. Diffusional Interactions among Marine Phytoplankton and Bacterioplankton: Modelling H2O2 as a Case Study. Microorganisms. 2022; 10(4):821. https://doi.org/10.3390/microorganisms10040821
Chicago/Turabian StyleOmar, Naaman M., Ondřej Prášil, J. Scott P. McCain, and Douglas A. Campbell. 2022. "Diffusional Interactions among Marine Phytoplankton and Bacterioplankton: Modelling H2O2 as a Case Study" Microorganisms 10, no. 4: 821. https://doi.org/10.3390/microorganisms10040821
Note that from the first issue of 2016, this journal uses article numbers instead of page numbers. See further details here.