
The Effect of Microbial Diversity and Biomass on Microbial Respiration in Two Soils along the Soil Chronosequence

Abstract
:1. Introduction
2. Materials and Methods
2.1. Sampling, Preparation, and Experimental Setup
2.2. Measurements
2.2.1. Microbial Respiration
2.2.2. Microbial Community Characteristics
2.3. Data Analysis
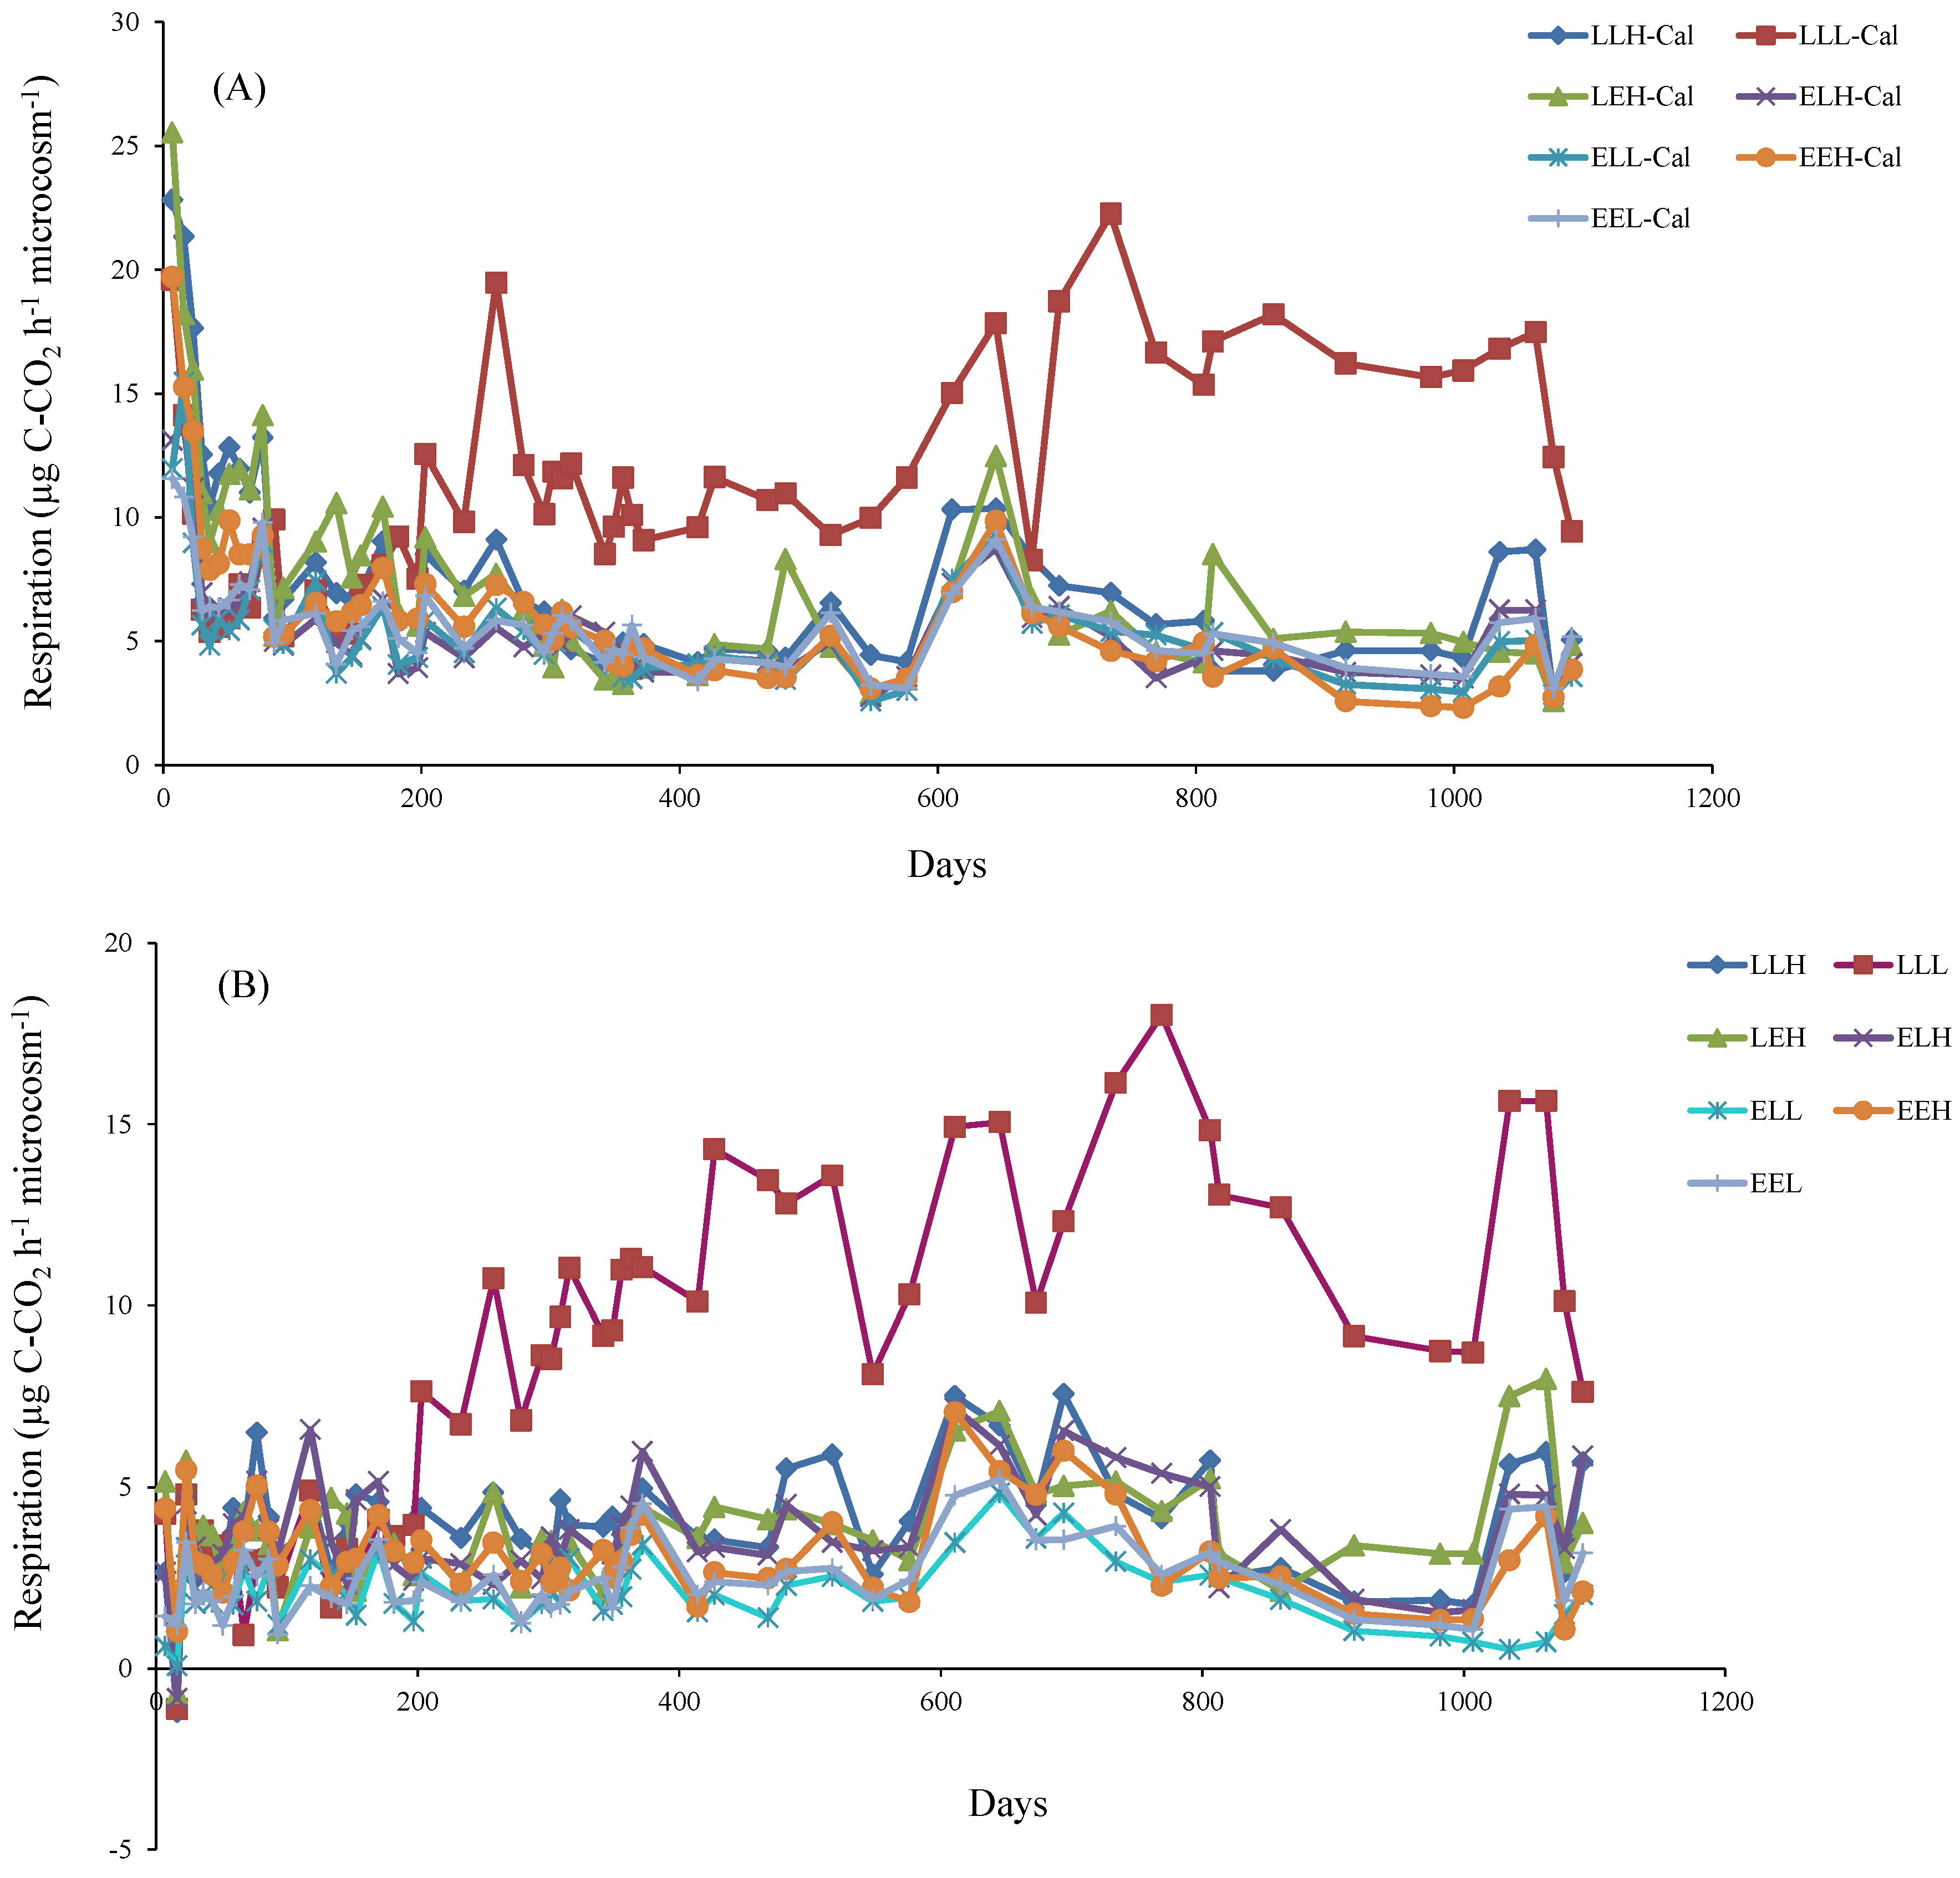
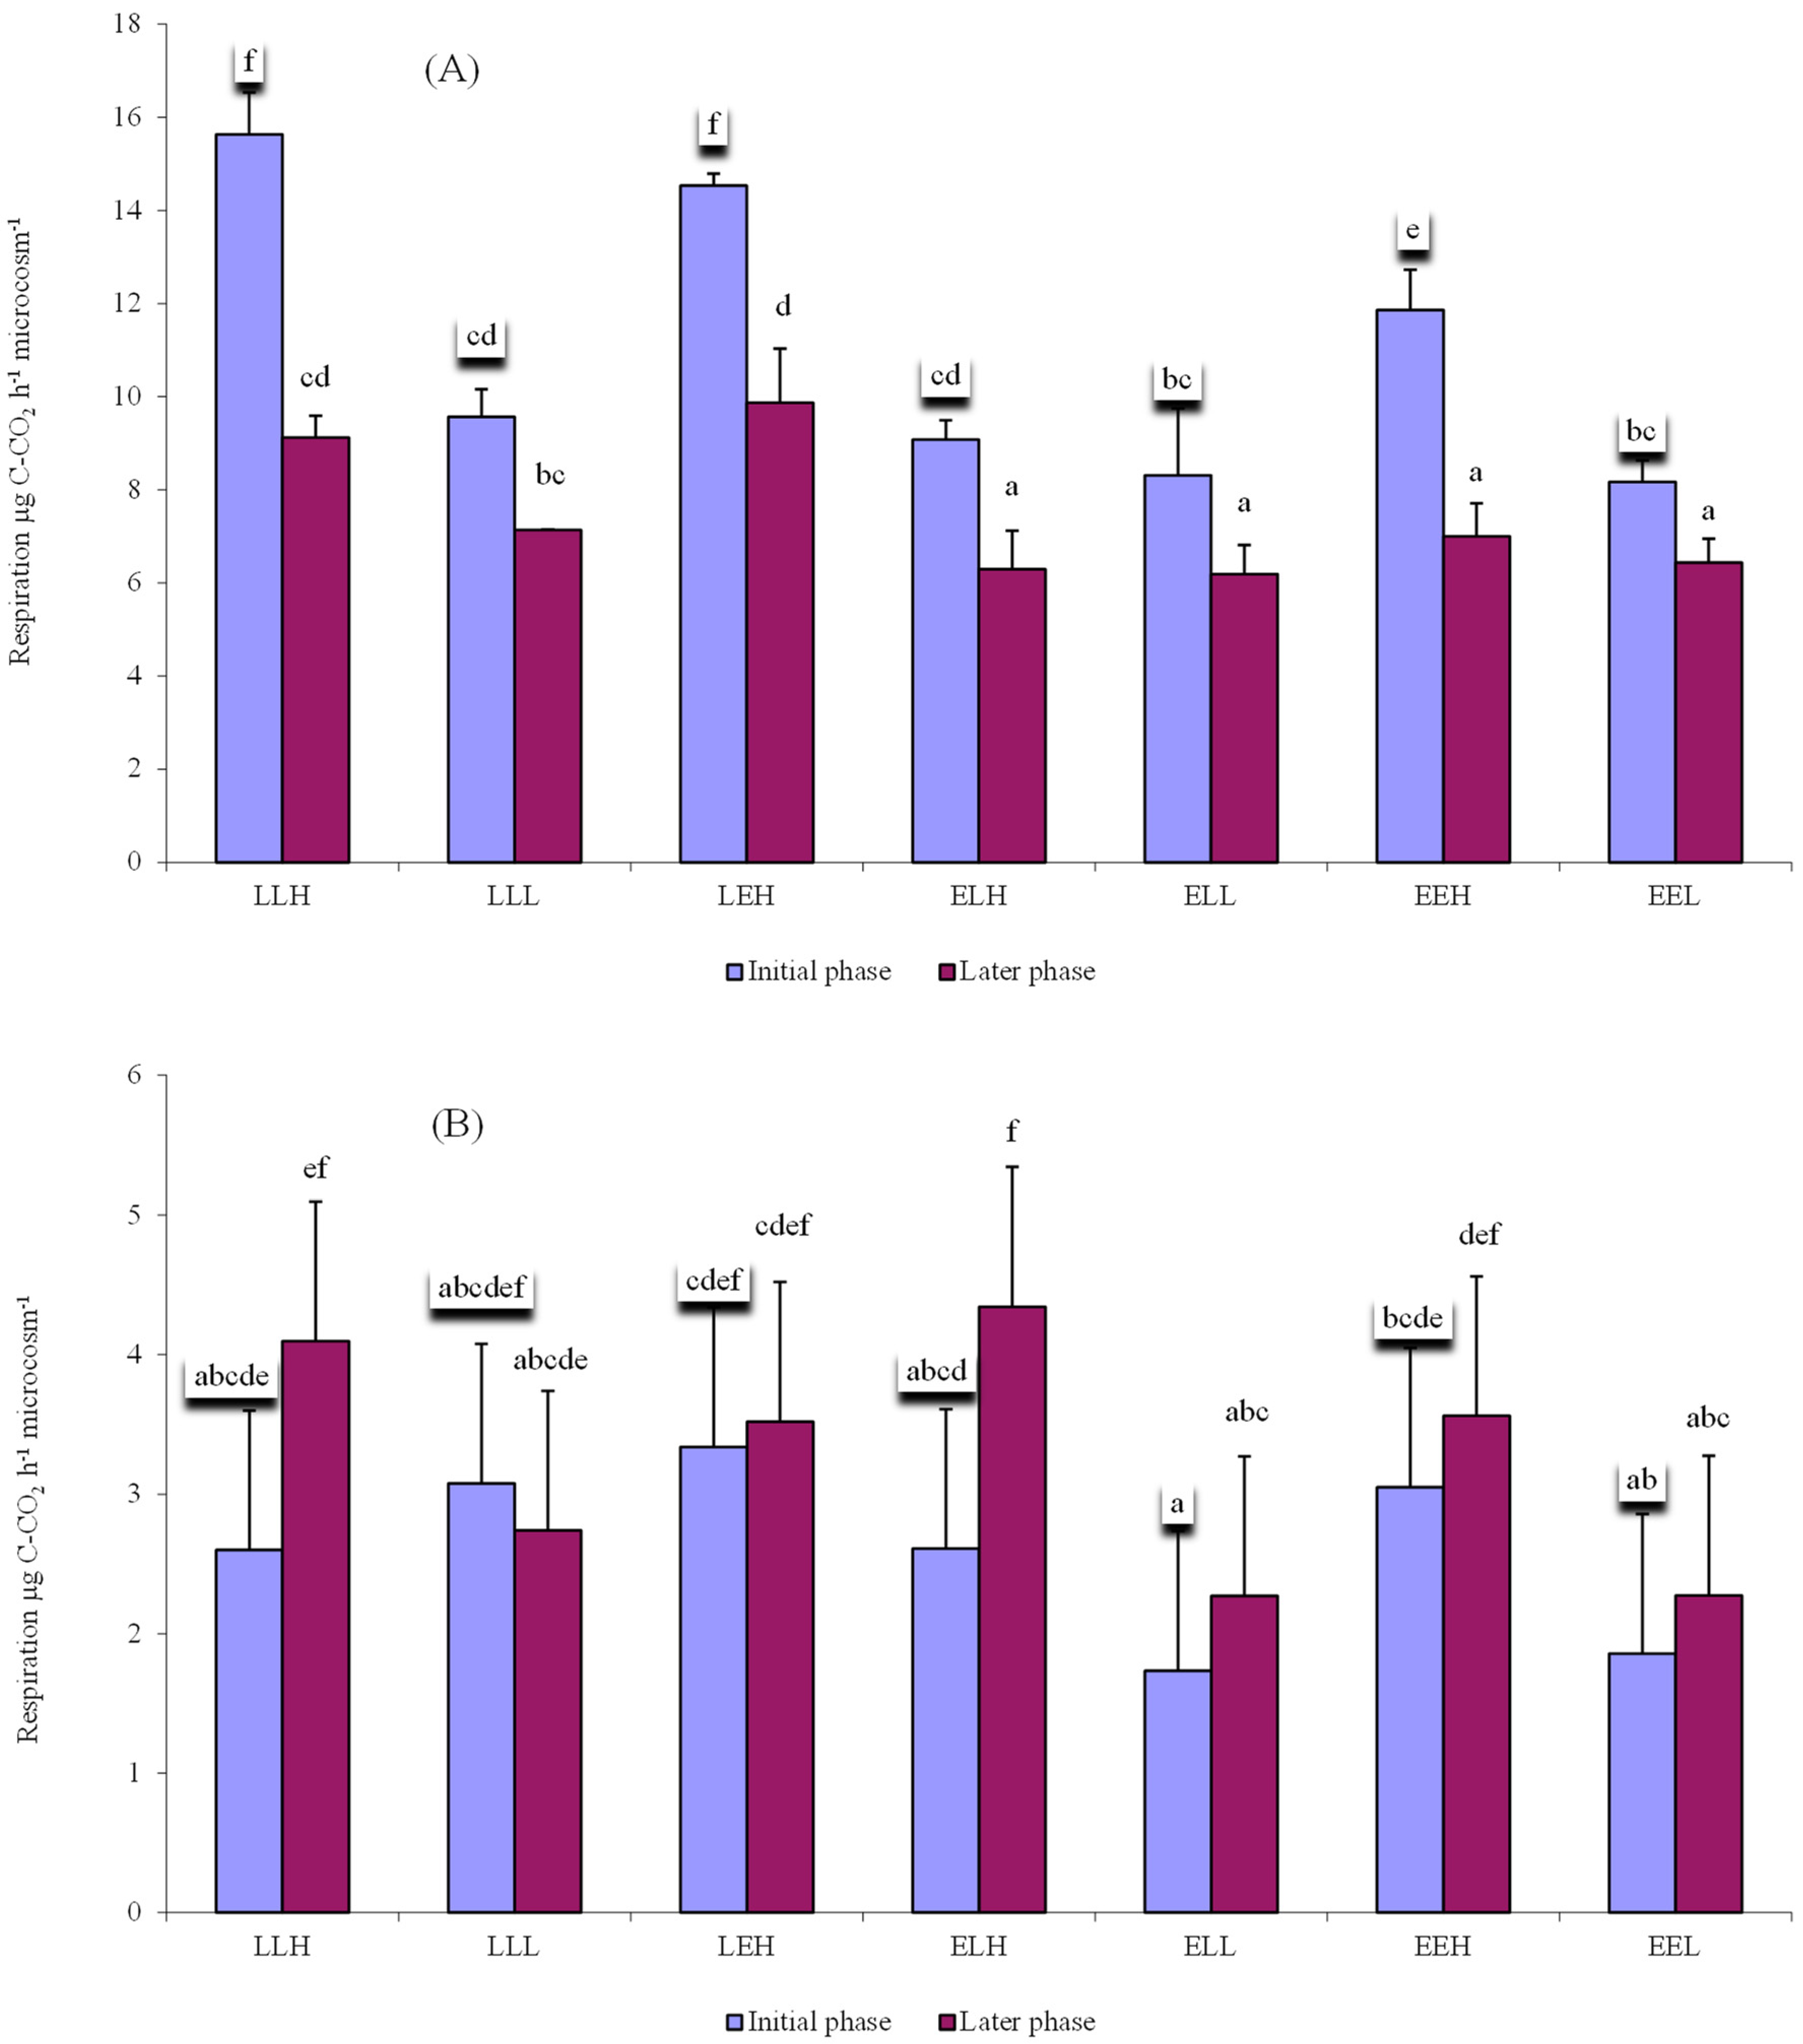
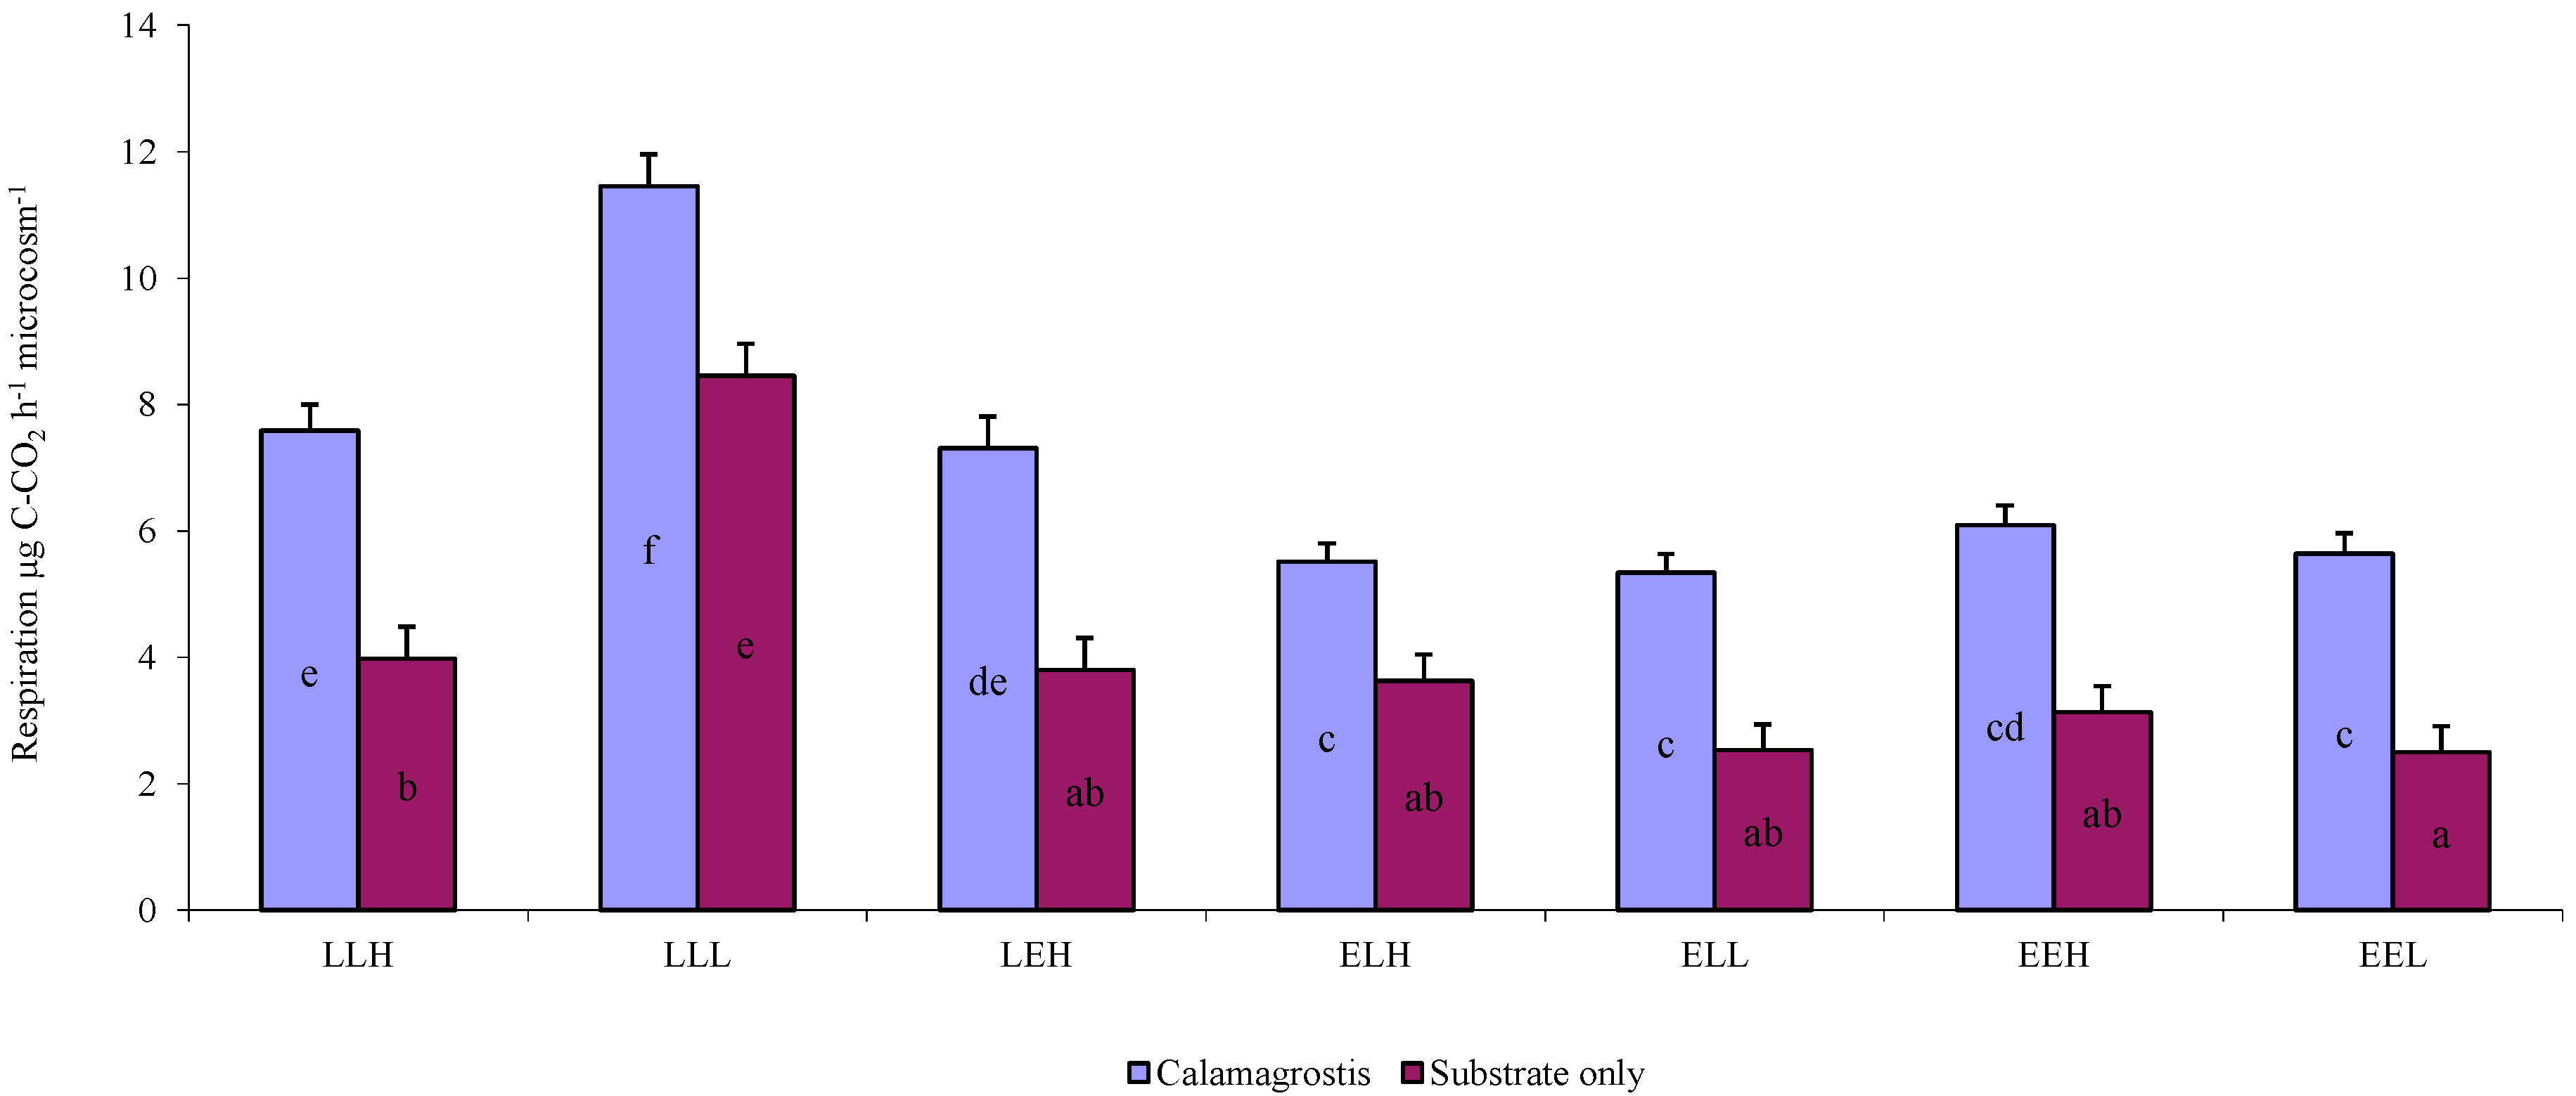
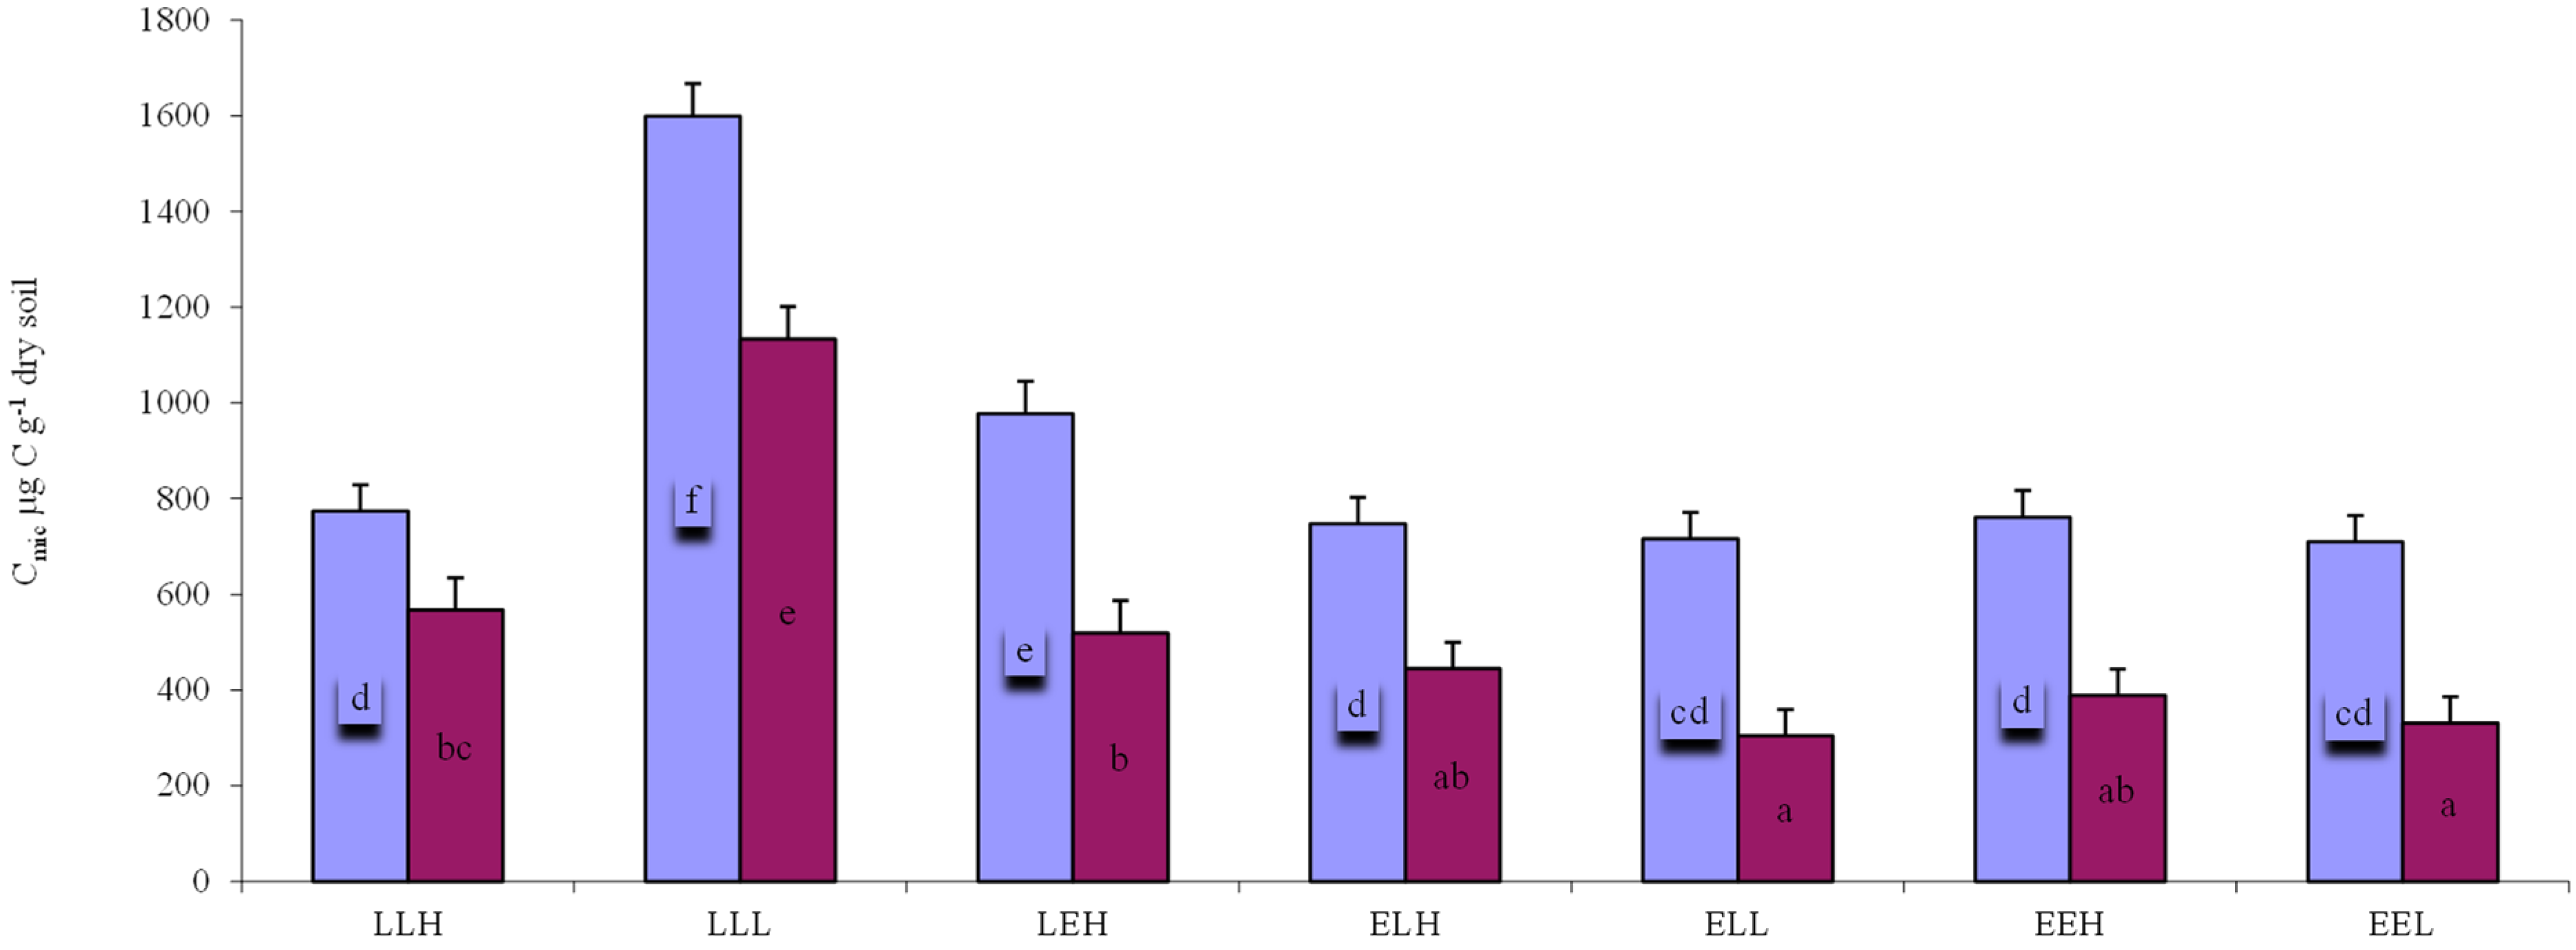
3. Results
4. Discussion
4.1. Relationship between Diversity, Respiration, and Biomass of Microbial Community
4.2. Influence of Litter and Water Addition on Respiration
5. Conclusions
Supplementary Materials
Author Contributions
Funding
Conflicts of Interest
References
- Song, G.H.; Li, L.Q.; Pan, G.X.; Zhang, Q. Topsoil organic carbon storage of China and its loss by cultivation. Biogeochemistry 2005, 74, 47–62. [Google Scholar] [CrossRef]
- Vitousek, P.M.; Mooney, H.A.; Lubchenco, J.; Melillo, J.M. Human domination of Earth’s ecosystems. Science 1997, 277, 494–499. [Google Scholar] [CrossRef]
- Manlay, R.J.; Feller, C.; Swift, M.J. Historical evolution of soil organic matter concepts and their relationships with the fertility and sustainability of cropping systems. Agric. Ecosyst. Environ. 2007, 119, 217–233. [Google Scholar] [CrossRef]
- Batjes, N.H. Total carbon and nitrogen in the soils of the world. Eur. J. Soil Sci. 2014, 65, 10–21. [Google Scholar] [CrossRef]
- Sheng, Y.; Zhan, Y.; Zhu, L. Reduced carbon sequestration potential of biochar in acidic soil. Sci. Total Environ. 2016, 572, 129–137. [Google Scholar] [CrossRef] [PubMed]
- Karu, H.; Szava-Kovats, R.; Pensa, M.; Kull, O. Carbon sequestration in a chronosequence of Scots pine stands in a reclaimed opencast oil shale mine. Can. J. For. Res. 2009, 39, 1507–1517. [Google Scholar] [CrossRef]
- Vindušková, O.; Frouz, J. Soil carbon accumulation after open-cast coal and oil shale mining in Northern Hemisphere: A quantitative review. Environ. Earth Sci. 2013, 69, 1685–1698. [Google Scholar] [CrossRef]
- Novák, P.; Vopravil, J.; Lagová, J. Assessment of the soil quality as a complex of productive and environmental soil function potentials. Soil Water Res. 2010, 5, 113–119. [Google Scholar] [CrossRef]
- Sokol, N.W.; Bradford, M.A. Microbial formation of stable soil carbon is more efficient from belowground than aboveground input. Nat. Geosci. 2019, 12, 46–53. [Google Scholar] [CrossRef]
- Aerts, R. Climate, leaf litter chemistry and leaf litter decomposition in terrestrial ecosystems: A triangular relationship. Oikos 1997, 79, 439–449. [Google Scholar] [CrossRef]
- GLOBE. 2007. Available online: www.meteocentrum.cz/zajimavosti/globalnioteplovani/sklenikovy-efekt (accessed on 10 July 2016).
- Bragazza, L.; Siffi, C.; Iacumin, P.; Gerdol, R. Mass loss and nutrient release during litter decay in peatland: The role of microbial adaptability to litter chemistry. Soil Biol. Biochem. 2007, 39, 257–267. [Google Scholar] [CrossRef]
- Berg, B.; McClaugerty, C. Plant Litter: Decomposition, Humus Formation, Carbon Sequestration, 2nd ed.; Springer: Berlin/Heidelberg, Germany, 2008. [Google Scholar]
- Jayasinghe, D.B.T.D.; Parkinson, D. Earthworms as the vectors of actinomycetes antagonistic to litter decomposer fungi. Appl. Soil Ecol. 2009, 43, 1–10. [Google Scholar] [CrossRef]
- Sagova-Mareckova, M.; Omelka, M.; Cermak, L.; Kamenik, Z.; Olsovska, J.; Hackl, E.; Kopecky, J.; Hadacek, F. Microbial communities show parallels at sites with distinct litter and soil characteristics. Appl. Environ. Microbiol. 2011, 77, 7560–7567. [Google Scholar] [CrossRef]
- Kjøller, A.; Struwe, S. Microfungi in ecosystems: Fungal occurrence and activity in litter and soil. Oikos 1982, 39, 389–422. [Google Scholar] [CrossRef]
- Tuomela, M.; Vikman, M.; Hatakka, A.; Itävaara, M. Biodegradation of lignin in a compost environment: A review. Bioresour. Technol. 2000, 72, 169–183. [Google Scholar] [CrossRef]
- de Boer, W.; Folman, L.B.; Summerbell, R.C.; Boddy, L. Living in a fungal world: Impact of fungi on soil bacterial niche development. FEMS Microbiol. Rev. 2005, 29, 795–811. [Google Scholar] [CrossRef]
- Loreau, M. Microbial diversity, producer-decomposer interactions, and ecosystem processes: A theoretical model. Proc. Biol. Sci. 2001, 268, 303–309. [Google Scholar] [CrossRef]
- Moorhead, D.L.; Sinsabaugh, R.L. A theoretical model of litter decay and microbial interaction. Ecol. Monogr. 2006, 76, 151–174. [Google Scholar] [CrossRef]
- Miki, T.; Ushio, M.; Fukui, S.; Kondoh, M. Functional diversity of microbial decomposers facilitates plant coexistence in a plant-microbe-soil feedback model. Proc. Natl. Acad. Sci. USA 2010, 107, 14251–14256. [Google Scholar] [CrossRef]
- McGuire, K.L.; Treseder, K.K. Microbial communities and their relevance for ecosystem models: Decomposition as a case study. Soil Biol. Biochem. 2010, 42, 529–535. [Google Scholar] [CrossRef] [Green Version]
- Zhang, F.; Zhang, Q. Microbial diversity limits soil heterotrophic respiration and mitigates the respiration response to moisture increase. Soil Biol. Biochem. 2016, 98, 180–185. [Google Scholar] [CrossRef]
- Luo, L.; Gu, J. Alteration of extracellular enzyme activity and microbial abundance by biochar addition: Implication for carbon sequestration in subtropical mangrove sediment. J. Environ. Manag. 2016, 182, 29–36. [Google Scholar] [CrossRef] [PubMed]
- Nannipieri, P.; Ascher, J.; Ceccherini, M.T.; Landi, L.; Pietramellara, G.; Renella, G. Microbial diversity and soil functions. Eur. J. Soil Sci. 2017, 68, 12–26. [Google Scholar] [CrossRef]
- Wagg, C.; Schlaeppi, K.; Banerjee, S.; Kuramae, E.E.; van der Heijden, M.G.A. Fungal-bacterial diversity and microbiome complexity predict ecosystem functioning. Nat. Commun. 2019, 10, 4841. [Google Scholar] [CrossRef]
- Balvanera, P.; Pfisterer, A.B.; Buchmann, N.; He, J.S.; Nakashizuka, T.; Raffaelli, D.; Schmid, B. Quantifying the evidence for biodiversity effects on ecosystem functioning and services. Ecol. Lett. 2006, 9, 1146–1156. [Google Scholar] [CrossRef]
- Reed, H.E.; Martiny, J.B.H. Testing the functional significance of microbial composition in natural communities. FEMS Microbiol. Ecol. 2007, 62, 161–170. [Google Scholar] [CrossRef]
- Maron, P.A.; Sarr, A.; Kaisermann, A.; Lévêque, J.; Mathieu, O.; Guigue, J.; Karimi, B.; Bernard, L.; Dequiedt, S.; Terrat, S.; et al. High microbial diversity promotes soil ecosystem functioning. Appl. Environ. Microbiol. 2018, 84, e02738-17. [Google Scholar] [CrossRef]
- Baumann, K.; Dignac, M.F.; Rumpel, C.; Bardoux, G.; Sarr, A.; Steffens, M.; Maron, P.A. Soil microbial diversity affects soil organic matter decomposition in a silty grassland soil. Biogeochemistry 2013, 114, 201–212. [Google Scholar] [CrossRef]
- Crampon, M.; Bodilis, J.; Portet-Koltalo, F. Linking initial soil bacterial diversity and polycyclic aromatic hydrocarbons (PAHs) degradation potential. J. Hazard. Mater. 2018, 359, 500–509. [Google Scholar] [CrossRef]
- Angst, S.; Baldrian, P.; Harantová, L.; Cajthaml, T.; Frouz, J. Different twig litter (Salix caprea) diameter does affect microbial community activity and composition but not decay rate. FEMS Microbiol. Ecol. 2018, 94, fiy126. [Google Scholar] [CrossRef]
- Fierer, N.; Jackson, R.B. The diversity and biogeography of soil bacterial communities. Proc. Natl. Acad. Sci. USA 2006, 103, 626–631. [Google Scholar] [CrossRef] [PubMed]
- Lauber, C.L.; Hamady, M.; Knight, R.; Fierer, N. Pyrosequencing-based assessment of soil pH as a predictor of soil bacterial community structure at the continental scale. Appl. Environ. Microbiol. 2009, 75, 5111–5120. [Google Scholar] [CrossRef] [PubMed]
- Berg, B.; Smalla, K. Plant species and soil type cooperatively shape the structure and function of microbial communities in the rhizosphere. FEMS Microbiol. Ecol. 2009, 68, 1–13. [Google Scholar] [CrossRef]
- Bertness, M.D.; Callaway, R. Positive interactions in communities. Trends Ecol. Evol. 1994, 9, 187–191. [Google Scholar] [CrossRef]
- Wardle, D.A.; Parkinson, D. Interactions between microclimatic variables and the soil microbial biomass. Biol. Fertil. Soils 1990, 9, 273–280. [Google Scholar] [CrossRef]
- Frouz, J.; Toyota, A.; Mudrák, O.; Jílková, V.; Filipová, A.; Cajthaml, T. Effects of soil substrate quality, microbial diversity, and community composition on the plant community during primary succession. Soil Biol. Biochem. 2016, 99, 75–84. [Google Scholar] [CrossRef]
- Frouz, J.; Prach, K.; Pizl, V.; Hanel, L.; Starý, J.; Tajovský, K.; Materna, J.; Balík, V.; Kalcík, J.; Rehounkova, K. Interactions between soil development, vegetation, and soil fauna during spontaneous succession in post mining sites. Eur. J. Soil Biol. 2008, 44, 109–121. [Google Scholar] [CrossRef]
- Ardestani, M.M.; Mudrák, O.; Vicena, J.; Sun, D.; Veselá, H.; Frouz, J. Microbial community from species rich meadow supports plant specialists during meadow restoration. Funct. Ecol. 2022, 36, 1573–1584. [Google Scholar] [CrossRef]
- Wertz, S.; Degrange, V.; Prosser, J.I.; Poly, F.; Cornmeuax, C.; Freitag, T.; Guillaumaud, N.; Le Roux, X. Maintenance of soil functioning following erosion of microbial diversity. Environ. Microbiol. 2006, 8, 2162–2169. [Google Scholar] [CrossRef]
- Berg, B.; Laskowski, R. Litter Decomposition: A Guide to Carbon and Nutrient Turnover; Elsevier Academic Press: Amsterdam, The Netherlands, 2006. [Google Scholar]
- Vance, E.D.; Brookes, P.C.; Jenkinson, D.S. An extraction method for measuring soil microbial biomass C. Soil Biol. Biochem. 1987, 19, 703–707. [Google Scholar] [CrossRef]
- Ardestani, M.M.; Frouz, J. The arbuscular mycorrhizal fungi Rhizophagus intraradices and other microbial groups affect plant species in copper-contaminated post-mining soil. J. Trace Elem. Med. Biol. 2020, 62, 126594. [Google Scholar] [CrossRef] [PubMed]
- Ardestani, M.M.; Jílková, V.; Bonkowski, M.; Frouz, J. The effect of arbuscular mycorrhizal fungi Rhizophagus intraradices and soil microbial community on a model plant community in a post-mining soil. Plant Ecol. 2019, 220, 789–800. [Google Scholar] [CrossRef]
- Sagová-Marečková, M.; Čermák, L.; Novotná, J.; Plháčková, K.; Forstová, J.; Kopecký, J. Innovative methods for soil DNA purification tested in soils with widely differing characteristics. Appl. Environ. Microbiol. 2008, 74, 2902–2907. [Google Scholar] [CrossRef] [PubMed]
- Reeder, J.; Knight, R. Rapidly denoising pyrosequencing amplicon reads by exploiting rank-abundance distributions. Nat. Methods 2010, 7, 668–669. [Google Scholar] [CrossRef] [PubMed]
- Edgar, R.C. Search and clustering orders of magnitude faster than BLAST. Bioinformatics 2010, 26, 2460–2461. [Google Scholar] [CrossRef]
- Edgar, R.C.; Haas, B.; Clemente, J.C.; Quince, C.; Knight, R. UCHIME improves sensitivity and speed of chimera detection. Bioinformatics 2011, 27, 2194–2200. [Google Scholar] [CrossRef]
- Edgar, R.C. MUSCLE: Multiple sequence alignment with high accuracy and high throughput. Nucleic Acids Res. 2004, 32, 1792–1797. [Google Scholar] [CrossRef]
- Lozupone, C.; Knight, R. UniFrac: A new phylogenetic method for comparing microbial communities. Appl. Environ. Microbiol. 2005, 71, 8228–8235. [Google Scholar] [CrossRef]
- Schimel, J.P.; Schaeffer, S.M. Microbial control over carbon cycling in soil. Front. Microbiol. 2012, 3, 348. [Google Scholar] [CrossRef]
- Shi, A.; Marschner, P. Soil respiration and microbial biomass after residue addition are influenced by the extent by which water-extractable organic C was removed from the residues. Eur. J. Soil Biol. 2014, 63, 28–32. [Google Scholar] [CrossRef]
- Spohn, M.; Chodak, M. Microbial respiration per unit biomass increases with carbon-to-nutrient ratios in forest soils. Soil Biol. Biochem. 2015, 81, 128–133. [Google Scholar] [CrossRef]
- Grant, W.D.; West, A.W. Measurement of ergosterol, diaminopimelic acid and glucosamine in soil: Evaluation as indicators of soil microbial biomass. J. Microbiol. Methods 1986, 6, 47–53. [Google Scholar] [CrossRef]
- Davis, M.V.; Lamar, R.T. Evaluation of methods to extract ergosterol for quantitation of soil fungal biomass. Soil Biol. Biochem. 1992, 24, 189–198. [Google Scholar] [CrossRef]
- Montgomery, H.J.; Monreal, C.M.; Young, J.C.; Seifert, K.A. Determination of soil fungal biomass from soil ergosterol analyses. Soil Biol. Biochem. 2000, 32, 8–9. [Google Scholar] [CrossRef]
- Porep, J.U.; Walter, R.; Kortekamp, A.; Carle, R. Ergosterol as an objective indicator for grape rot and fungal biomass in grapes. Food Control 2014, 37, 77–84. [Google Scholar] [CrossRef]
- Sanchez, C. Lignocellulosic residues: Biodegradation and bioconversion by fungi. Biotechnol. Adv. 2009, 27, 185–194. [Google Scholar] [CrossRef] [PubMed]
- Al-Karaki, G.N.; McMichael, B.; Zak, J. Field response of wheat to arbuscular mycorrhizal fungi and drought stress. Mycorrhiza 2004, 14, 263–269. [Google Scholar] [CrossRef] [PubMed]
- Ouahmane, L.; Hafidi, M.; Kisa, M.; Boumezzough, A.; Thoulouse, J.; Duponnois, R. Lavandula species as accompanying plants in Cupressus replanting strategies: Effect on plant growth, mycorrhizal soil infectivity and soil microbial catabolic diversity. Appl. Soil Ecol. 2006, 34, 190–199. [Google Scholar] [CrossRef]
- Urbanová, M.; Šnajdr, J.; Baldrian, P. Composition of fungal and bacterial communities in forest litter and soil is largely determined by dominant trees. Soil Biol. Biochem. 2015, 84, 53–64. [Google Scholar] [CrossRef]
- Lepš, J. Diversity and Ecosystem Function. In Vegetation Ecology, 1st ed.; van der Maarel, E., Franklin, J., Eds.; Blackwell Publishing, John Wiley & Sons: Hoboken, NJ, USA, 2005. [Google Scholar]
- Toïgo, M.; Vallet, P.; Perot, T.; Bontemps, J.; Piedallu, C.; Courbaud, B. Overyielding in mixed forests decreases with site productivity. J. Ecol. 2015, 103, 502–512. [Google Scholar] [CrossRef]
- Fontaine, S.; Mariotti, A.; Abbadie, L. The priming effect of organic matter: A question of microbial competition? Soil Biol. Biochem. 2003, 35, 837–843. [Google Scholar] [CrossRef]
- Kuzyakov, Y. Factors affecting rhizosphere priming effects. J. Plant Nutr. Soil Sci. 2002, 165, 382–396. [Google Scholar] [CrossRef]
- Cheng, W.; Parton, W.J.; Gonzalez-Meler, M.; Phillips, R.; Asao, S.; McNickle, G.; Brzostek, E.; Jastrow, J. Synthesis and modeling perspectives of rhizosphere priming. New Phytol. 2014, 201, 31–44. [Google Scholar] [CrossRef] [PubMed]
- Hamer, U.; Marschner, B. Priming effects in soils after combined and repeated substrate additions. Geoderma 2005, 128, 38–51. [Google Scholar] [CrossRef]
- Kuzyakov, Y.; Frieldel, J.K.; Stahr, K. Review of mechanisms and quantification of priming effects. Soil Biol. Biochem. 2000, 32, 1485–1498. [Google Scholar] [CrossRef]
- Luo, Z.; Wang, E.; Sun, O. A meta-analysis of the temporal dynamics of priming soil carbon decomposition by fresh carbon inputs across ecosystems. Soil Biol. Biochem. 2016, 101, 96–103. [Google Scholar] [CrossRef]
- Blagodatskaya, E.; Khomyakovc, N.; Myachinac, O.; Bogomolovac, I.; Blagodatsky, S.; Kuzyakova, Y. Microbial interactions affect sources of priming induced by cellulose. Soil Biol. Biochem. 2014, 74, 39–49. [Google Scholar] [CrossRef]
- Blagodatsky, S.A.; Heinemeyer, O.; Richter, J. Estimating the active and total soil microbial biomass by kinetic respiration analysis. Biol. Fertil. Soils 2000, 32, 73–81. [Google Scholar] [CrossRef]
- Yates, G.T.; Smotzer, T. On the lag phase and initial decline of microbial growth curves. J. Theor. Biol. 2007, 244, 511–517. [Google Scholar] [CrossRef] [PubMed]
- Verhoef, A.; Allen, S.J.; de Bruin, H.A.; Jacobs, C.M.; Heusinkveld, B.G. Fluxes of carbon dioxide and water vapor from a Sahelian savanna. Agric. For. Meteorol. 1996, 80, 231–248. [Google Scholar] [CrossRef]
- Wang, X.; Liu, L.L.; Piao, S.L.; Janssens, I.A.; Tang, J.W.; Liu, W.X.; Chi, Y.; Wang, J.; Xu, S. Soil respiration under climate warming: Differential response of heterotrophic and autotrophic respiration. Glob. Chang. Biol. 2014, 20, 3229–3237. [Google Scholar] [CrossRef] [PubMed]
- Liua, Y.; Liua, S.; Wanb, S.; Wangc, J.; Luand, J.; Wanga, H. Differential responses of soil respiration to soil warming and experimental throughfall reduction in a transitional oak forest in central China. Agric. For. Meteorol. 2016, 226–227, 186–198. [Google Scholar] [CrossRef]
- Nikolova, P.S.; Raspe, S.; Andersen, C.P.; Mainiero, R.; Blaschke, H.; Matyssek, H.; Häberle, H.K. Effects of the extreme drought in 2003 on soil respiration in a mixed forest. Eur. J. For. Res. 2009, 128, 87–98. [Google Scholar] [CrossRef]
- Sotta, E.D.; Veldkamp, E.; Schwendenmann, L.; Guimaraes, B.R.; Paixao, R.K.; Ruivo, M.; da Costa, L.; Carlos, A.; Meir, P. Effects of an induced drought on soil carbon dioxide (CO2) efflux and soil CO2 production in an Eastern Amazonian rainforest, Brazil. Glob. Chang. Biol. 2007, 13, 2218–2229. [Google Scholar] [CrossRef]
- Barnard, R.L.; Osborne, C.A.; Firestone, M.K. Responses of soil bacterial and fungal communities to extreme desiccation and rewetting. ISME J. 2013, 7, 2229. [Google Scholar] [CrossRef]
- Placella, S.A.; Brodie, E.L.; Firestone, M.K. Rainfall-induced carbon dioxide pulses result from sequential resuscitation of phylogenetically clustered microbial groups. Proc. Natl. Acad. Sci. USA 2012, 109, 10931–10936. [Google Scholar] [CrossRef] [PubMed] [Green Version]


| LLH | LLL | LEH | ELH | ELL | EEH | EEL | |
|---|---|---|---|---|---|---|---|
| OTU richness | 69 | 79 | 87 | 127 | 86 | 111 | 125 |
| Available carbon | 3.12 | 3.12 | 3.12 | 0.96 | 0.96 | 0.96 | 0.96 |
| Soil pH | 7.16 | 7.16 | 7.16 | 8.75 | 8.75 | 8.75 | 8.75 |
| Microbial Respiration | Microbial Respiration per Gram C | Ergosterol | Microbial Biomass | Available C per Microcosm | Number of OTU | |
|---|---|---|---|---|---|---|
| Ergosterol | 0.76 | - | - | - | - | - |
| Microbial biomass | 0.97 | - | 0.78 | - | - | - |
| Available C per microcosm | 0.60 | −0.55 | 0.88 | 0.59 | - | - |
| OTU richness | −0.39 | 0.51 | −0.63 | −0.36 | −0.76 | - |
| Addition of litter | 0.64 | 0.52 | 0.38 | 0.57 | - | - |
| Area age | 0.54 | −0.61 | 0.85 | 0.54 | 1.00 | −0.77 |
| Substrate age from which inoculum was obtained | 0.63 | - | 0.63 | 0.64 | 0.65 | −0.54 |
Publisher’s Note: MDPI stays neutral with regard to jurisdictional claims in published maps and institutional affiliations. |
© 2022 by the authors. Licensee MDPI, Basel, Switzerland. This article is an open access article distributed under the terms and conditions of the Creative Commons Attribution (CC BY) license (https://creativecommons.org/licenses/by/4.0/).
Share and Cite
Vicena, J.; Ardestani, M.M.; Baldrian, P.; Frouz, J. The Effect of Microbial Diversity and Biomass on Microbial Respiration in Two Soils along the Soil Chronosequence. Microorganisms 2022, 10, 1920. https://doi.org/10.3390/microorganisms10101920
Vicena J, Ardestani MM, Baldrian P, Frouz J. The Effect of Microbial Diversity and Biomass on Microbial Respiration in Two Soils along the Soil Chronosequence. Microorganisms. 2022; 10(10):1920. https://doi.org/10.3390/microorganisms10101920
Chicago/Turabian StyleVicena, Jakub, Masoud M. Ardestani, Petr Baldrian, and Jan Frouz. 2022. "The Effect of Microbial Diversity and Biomass on Microbial Respiration in Two Soils along the Soil Chronosequence" Microorganisms 10, no. 10: 1920. https://doi.org/10.3390/microorganisms10101920