
Workers’ Satisfaction during the COVID-19 Pandemic in Central and Eastern Europe


Department of Economic Sociology, Institute of Sociology of the Czech Academy of Sciences, 110 00 Prague, Czech Republic
Soc. Sci. 2023, 12(9), 505; https://doi.org/10.3390/socsci12090505
Submission received: 14 June 2023
/
Revised: 28 August 2023
/
Accepted: 30 August 2023
/
Published: 8 September 2023
(This article belongs to the Special Issue Political, Economic and Social Crises, and National Solidarity in the Early 2020s)
Abstract
:This article analyses the determinants of worker satisfaction in Central and Eastern European countries, focusing on the effects of the COVID-19 pandemic. For this purpose, the latest European Social Survey data were utilised in a multilevel framework, covering 5681 workers from eight countries. The results suggest that both the general stringency of policies aimed at containing the spread of the COVID-19 contagion and the resulting disruptions to individuals’ working lives significantly affected the well-being of workers. Workers’ satisfaction with their jobs was negatively affected mainly through decreases in work income, but the impact on their overall life satisfaction was more complex. While income reductions and workplace relocation negatively impacted life satisfaction, the opportunity and possible necessity to stay home more positively affected the life satisfaction of workers. Nevertheless, the overall stringency of governmental policies related to COVID-19 significantly reduced workers’ life satisfaction.
1. Introduction
The coronavirus pandemic had a broad impact on society. The ensuing governmental restrictions aimed at containing the spread of the contagion also had huge effects on national labour markets, but their magnitude varied considerably across countries as well as within countries, with a tendency to exacerbate existing social inequalities (Adams-Prassl et al. 2020). These effects covered immediate short-term limitations on work and either triggered or accelerated long-term changes in the organisation of work, such as the shift to remote work and the implementation of new technological solutions.
As a result of coping with a difficult situation for many people, the pandemic resulted in an increased level of stress, a rise in fear and anxiety and a decrease in general well-being (Grover et al. 2020). It affected people’s satisfaction, including their job and overall life satisfaction, in many ways (Duong 2021; Cheng et al. 2022; Kondratowicz et al. 2022). This decline in satisfaction may have a huge array of adverse consequences for the general well-being of workers (Cannas et al. 2019) and many labour market outcomes, such as the productivity of establishments (Böckerman and Ilmakunnas 2012), and lead to higher turnover rates, absenteeism (Vroom 1964) and quitting rates (Freeman 1978). Job satisfaction is also significantly and positively related to job performance (see, e.g., Judge et al. 2001; or Petty et al. 1984), which makes this topic highly relevant for human resources management.
Compared with Western Europe (WE), the Central and Eastern European (CEE) region has received limited attention in job satisfaction research so far. However, CEE countries hold a specific position compared to those of WE regarding both the levels and drivers of job satisfaction (Borooah 2009; Mysíková and Večerník 2013; Sousa-Poza and Sousa-Poza 2000; Večerník 2004). Furthermore, the impact of the COVID-19 pandemic and the corresponding policy reactions exhibited both shared characteristics and unique traits throughout the CEE region, setting the countries apart from the situation observed in WE (Bohle et al. 2022). The literature on COVID-19’s impact as regards job satisfaction has been generally limited to studies focusing on one particular country and/or profession, often addressing a limited sample of workers (Cheng and Kao 2022; Johnson and Whillans 2022; Kondratowicz et al. 2022; Martin et al. 2022; Mohammed et al. 2022).
The purpose of this paper is to contribute to the literature by providing new evidence on patterns of job satisfaction in CEE countries from a multi-country perspective and to identify the effect of pandemic-related restrictions on the satisfaction of workers. The effect of the restrictions is studied both in terms of their impact on the organisation of work and disruptions to the careers of individuals, as well as in terms of their general impact on the functioning of society as a whole. It also compares the effect of pandemic-related restrictions on job satisfaction with their effect on workers’ life satisfaction. For this purpose, the 2020 European Social Survey (ESS) Round 10 data in a multilevel framework were used. The dataset is unique as regards the availability of personal characteristics, subjective evaluations of job characteristics and information on the impact of the COVID-19 pandemic on various dimensions of the respondents’ work lives.
In the following text, I first survey the existing literature and present a theoretical framework for subsequent analysis. A description of the utilised data and methodology is then provided. The next section offers an overview of life and job satisfaction and also the impact of COVID-19 and its related restrictions on the examined group of CEE countries. This is followed by a discussion of the results and the conclusion.
2. Literature Review
Job satisfaction is usually defined as one’s positive or negative attitude toward one’s job (Brayfield and Crockett 1955) and refers to satisfaction with work-related factors. Similar to overall life satisfaction, job satisfaction is a complex and multidimensional phenomenon that may be understood as the result of several direct and indirect influences. Empirical research on job satisfaction evaluates the effects of its different determinants through various theoretical lenses. Sousa-Poza and Sousa-Poza (2000) discuss various approaches and argue that most economic studies on job satisfaction lack a clear definition of a particular theoretical framework. Nevertheless, such studies implicitly apply the bottom-up psychological model of job satisfaction determinants. Similarly, the approach of this study mainly builds upon the bottom-up framework, which is conceptually close to the microeconomic utility approach (Clark and Oswald 1996).
Bottom-up models study how external factors—including situations and demographics—affect satisfaction. This approach assumes the existence of basic and universal human needs: if an individual fulfils these needs under current circumstances, he or she is happy (Diener et al. 1999, p. 278). In this theoretical framework, work–role inputs (e.g., education, working time and having a tiring job) are supposed to negatively affect job satisfaction—thereby being associated with ‘pain’. On the other hand, work–role outputs (e.g., income from work, independent work, job security, advancement opportunities and positive relationships with management) are supposed to have a positive effect—thereby being associated with ‘pleasure’. Overall, job satisfaction then depends on a balance between these two groups of factors: if work–role inputs increase relative to work–role outputs, job satisfaction will decrease and vice versa. This implies that factors influencing job satisfaction can be discerned at both the individual level, encompassing worker attributes, as well as at the organisational level, involving job-related characteristics and working conditions (for an overview, see, e.g., Cannas et al. 2019).
On an individual level, the most important determinants of job satisfaction include the sociodemographic characteristics of workers, such as gender, age and educational level as well as income and various job characteristics. Regarding the effect of gender, most scholars explain that women are generally more satisfied at work than men (Clark 1997). Bender et al. (2005) associate the higher job satisfaction of women to a greater preference for flexibility. Once job flexibility is accounted for, the effect of gender itself diminishes. Similarly, Sousa-Poza and Sousa-Poza (2000) stress that the gender paradox may be due to other factors. Recently, Perugini and Vladisavljević (2019) confirmed that women are generally more satisfied in their jobs and associated this difference to a fluctuating scale of gender equality exposure in different national contexts.
The results of studies that consider age a factor that determines job satisfaction are inconclusive. Some researchers report that age has a significant positive effect (Borooah 2009; Brush et al. 1987), while others report an insignificant effect (Chaudhuri et al. 2015). Furthermore, some researchers describe a U-shaped pattern of age (Clark et al. 1995). The effect of education on job satisfaction is similarly unclear in the literature. For instance, Vila and García-Mora (2005) find that one’s educational level did not significantly influence overall job satisfaction. However, it correlates positively with workers’ satisfaction in various aspects of their jobs. Conversely, Clark and Oswald (1996) describe a negative effect of education on worker satisfaction.
The effect of income on job satisfaction has also been widely researched without any clear consensus. The effect may differ when we consider objective and subjective income levels (Clark and Oswald 1996) as well as absolute income and income growth (Clark 1999; Grund and Sliwka 2003). Similarly, the effect of trade union membership is not clear in the literature. A positive effect was documented by Borjas (1979) and Clark (1996) but was not confirmed by Bryson et al. (2004) or Renaud (2002). Furthermore, the experience of unemployment may reduce the overall well-being of workers (Frey and Stutzer 2002) with an effect on job satisfaction as well.
Job satisfaction may also differ by type of contract: fixed-term workers may have lower satisfaction due to lower job security (Dawson et al. 2017) and poorer job quality. Canzio et al. (2022) ascertained that involuntary temporary workers are less satisfied in their jobs than permanent employees, but this does not apply to voluntary temporary workers. Their results differ between the analysed European countries, with greater differences in the post-socialist states of CEE.
The existing empirical literature indicates that job satisfaction has specific patterns in the CEE region and that the effect of various determinants may differ compared to WE. Borooah (2009) examined the differences in job satisfaction between Eastern and Western European countries and found that workers in the latter region generally exhibit higher levels of job satisfaction. The author explains that these results reflect both a better endowment of the factors that promote job satisfaction in WE and a possibility that these factors may be more conducive to job satisfaction in WE than in CEE. Using data from three cross-national European surveys, Večerník (2004) identified substantial differences in work values and job satisfaction between the countries of Western and Eastern Europe. Mysíková and Večerník (2013) confirm the existence of these differences, which also relate to the factors that affect job satisfaction: while gender and education showed a significant influence in WE, no such significant effects were present in CEE. The most common and most important factors significant for both regions were (a) the perception of being paid appropriately, which had a positive effect on job satisfaction, and (b) worker dissatisfaction with work–life balance, which had a negative impact. Moreover, Sousa-Poza and Sousa-Poza (2000) discuss how lower levels of job satisfaction among Eastern European workers may be attributed to a greater prevalence of factors that negatively affect satisfaction (e.g., lower income) compared to positive influences.
The COVID-19 pandemic highlighted and often magnified many forms of social and economic disadvantages and existing inequalities in labour markets by hitting the most vulnerable groups the most (Blundell et al. 2020). According to Oellerich and Toplišek (2022), while the COVID-19 crisis uncovered several deep flaws in the socioeconomic models of CEE countries, policy responses in a majority of these countries tended to further amplify them. Rather than building a more resilient socioeconomic model, national governments mostly aimed to keep the status quo by disfavouring weaker groups and favouring stronger ones. This development may result in a further rise in inequality and magnify the COVID-19 crisis’s impact on the most vulnerable groups. Furthermore, it may impact worker satisfaction. We may expect that the specificity of the CEE region—regarding socioeconomic conditions (e.g., a lower wage level; see Myant 2018) and the effect of various drivers of job satisfaction—may further play a role in the response to COVID-related restrictions on the organisation of work. In this vein, Johnson and Whillans (2022) documented the differential impact of the COVID-19 pandemic on job satisfaction across different pay levels in the United States. The dissatisfaction of workers in low-wage jobs even increased compared to those in higher-paid jobs. In addition, the importance of pay in determining the job satisfaction of workers in low-wage occupations increased.
Möhring et al. (2021) studied the effects of major COVID-19 lockdown policies on job satisfaction and identified a negative impact on worker satisfaction in Germany, particularly for mothers and childless workers who were forced to switch to short-time work. Mohammed et al. (2022) document that the pandemic-driven feelings of anxiety and the increased work-family conflict negatively impacted the satisfaction levels of employees in India. Similarly, the perceived threat of COVID-19 was negatively related to the job satisfaction of employees in Taiwan, with job stress having a mediating effect (Cheng and Kao 2022). The literature on the pandemic’s impact on job satisfaction largely focuses on the shift to working from home that was triggered by lockdown regulations. The evidence, however, is inconsistent. While some studies document how working from home negatively affects mental health (Felstead and Reuschke 2020), some do not indicate any adverse effects on workers’ well-being and even report that workers experienced fewer negative emotions (Pelly et al. 2021). Several studies document the positive effects of working from home on job satisfaction (Kondratowicz et al. 2022; Blahopoulou et al. 2022). Makridis and Schloetzer (2022) studied the relationship between working from home and job satisfaction among US workers during the COVID-19 pandemic and found a positive association. This, however, vanishes after controls for individual demographics, income, occupation and workplace environment attributes were accounted for. The study underscores the significance of job-related factors in explaining the determination of job satisfaction.
Detailed evidence on the impact of restriction measures (e.g., changes in working hours and income, other related changes in the organisation of work) on worker satisfaction in CEE is still lacking (as far as the author is aware). This study aims to fill this gap in the literature.
3. Data and Methodology
This study uses the 2020 ESS Round 10 data, which also include information on the COVID-19 pandemic’s impact on the organisation of work. The full dataset is expected to cover thirty-two European countries. I limited my analysis to eight CEE countries for which data were available during my research: Bulgaria, Croatia, Czechia, Estonia, Hungary, Lithuania, Slovenia and Slovakia. I assume that this group of countries exhibits a certain level of cultural, economic and social homogeneity, allowing for its analysis on an aggregate level (this assumption is common in this line of research—see also Mysíková and Večerník 2013; or Sousa-Poza and Sousa-Poza 2000). These post-communist countries share a social and economic milieu. Furthermore, they were affected by similar factors that may have had long-lasting effects—in particular, the legacies of dictatorial communist regimes followed by the transition towards a market economy and democratic society. Moreover, this perspective is consistent with Inglehart and Baker’s (2000) classification of nations.
The individual data from the respondents were mostly collected during the second half of 2021 and thus refer to that year. I restricted my sample to individuals aged 16–64 who had worked as employees (even if they were on temporary leave) or were self-employed within the last seven days before the interview. I omitted observations with missing data on relevant variables. The final sample includes an average of 710 participants per country (a total of 5681 out of 14,506 observations in the ESS dataset, making up 39%). The descriptive statistics were weighted by analysis weights according to the recommendations of the ESS manual (Kaminska 2020). However, the weights were not utilised in the multilevel regression analyses due to technical limitations that may lead to fundamental biases in the estimates: the literature lacks consensus regarding the issue of weighting, and many authors do not recommend weighting data in multilevel models (see discussion in Gelman 2007; or Rabe-Hesketh and Skrondal 2006). Due to the lack of consensus, I also ran the model estimations in weighted forms, which did not alter the results significantly.
Two dependent variables referring to subjectively perceived well-being are drawn from the ESS data. (1) I use the job satisfaction variable that reports the answer to the question, ‘How satisfied are you in your main job?’ (2) To examine life satisfaction, I utilise a variable that reports the answer to the question, ‘All things considered, how satisfied are you with your life as a whole nowadays?’ Both variables take values from 0 (‘extremely dissatisfied’) to 10 (‘extremely satisfied’). The nature of ESS data only enables the analysis of job satisfaction as a single item reflecting overall job satisfaction without the possibility of reflecting on the individual components of job satisfaction (e.g., satisfaction with supervisory support and promotion opportunities). Nevertheless, following the results of meta-analyses carried out by Wanous et al. (1997), this single-item measure of overall job satisfaction is acceptable for the examination of worker satisfaction.
Since attitudinal variables are ordinal variables, an ordered response model (e.g., ordered probit) would have been an appropriate estimation method. However, as the outcomes of ordered response models are harder to interpret, I utilised an approach proposed by Van Praag and Ferrer-i-Carbonell (2006), known as the Probit-OLS (POLS) approach, as an attempt to cardinalise the ordinal data. In POLS, the equidistant responses to attitudinal questions are replaced by transformations that reflect the distribution of the reported levels within the sample. The POLS transformation involves calculating the relative frequencies of the different response categories and then obtaining a standard, normally distributed, cardinal-scaled variable by inserting these frequencies into a standard, normal distribution function. The resulting transformed variable could consequently be used as the dependent variable in an OLS regression, and the estimated coefficients have the same interpretation as in the ordered probit model. POLS transformation was run on the whole sample, which corresponded with the grand mean centring of the variable (see discussion in Enders and Tofighi 2007).
The data were conceptualised as a multilevel structure with individual observations nested within countries. Multilevel models with random intercepts were used for their analyses, which account for differences in individual-level relationships between countries. The best-fitting model was chosen based on the Bayesian information criterion (BIC).
The determinants of worker satisfaction at the individual level, serving as independent variables in the regression estimations, were divided into five categories. Firstly, the individual sociodemographic controls included gender (dummy for female), age and age squared, marital status (dummy for being married), children younger than 16 living in the household (dummy equalling one irrespective of the number of children) and a dummy equalling one if the person had ever been unemployed and sought work for a period of more than three months. I also controlled for the degree of domicile urbanisation by adding a dummy for living in a big city, a suburb or the periphery of a big city. Additionally, this group of factors also encompasses a control for respondents with unfavourable subjective general health (rated bad or very bad on a 5-point scale, where 1 means ‘very good’ and 5 stands for ‘very bad’), despite health status not being classified as a sociodemographic variable. A summary of the statistics on individual-level characteristics is presented in Table A1 in the Appendix A.
Secondly, characteristics of the respondent’s employer and job were controlled for: the size of the company (a dummy for working in an establishment of fewer than 25 employees and a dummy for working in an establishment of 100 or more employees), the employer’s sector of economic activity (NACE classification) and the respondent’s type of occupation (ISCO classification). Furthermore, dummies for working for an employer in the state or public sphere (central or local government, other public sectors or a state-owned enterprise), having a work contract of limited duration, being self-employed, being a member of trade unions and having a part-time job were applied. The threshold of working hours for classifying part-time employees was set to 30 h following the International Labour Organization’s approach (ILO 2004).
The third group of controls are work–role inputs—the ‘pains’. The educational attainment of the respondent is reflected in two dummies for secondary and tertiary educational degrees. The dummy for tiring jobs equalled one if respondents always or often (4–5 on a 5-point scale, where 1 means ‘never’ and 5 stands for ‘always’) felt too tired after work to enjoy home activities. The dummy reflecting the time-demandingness of respondents’ jobs and work–life balance equalled one if the respondent stated that his/her job always or often (4–5 on a 5-point scale, where 1 means ‘never’ and 5 stands for ‘always’) prevents him/her from dedicating time to a partner or family. Furthermore, a dummy equalling one was applied if the respondent stated that employees in his/her organisation were expected to work overtime (whether at the workplace or at home) or to be responsive to work communications outside working hours every day or several times a week (1–2 on a 6-point scale, where 1 means ‘every day’ and 6 stands for ‘never’).
The fourth group of controls involve work–role outputs—the ‘pleasures’. One of the most important output variables is supposed to be income from work. Unfortunately, information on the usual gross pay of respondents is not available in this wave of ESS data. The dataset contains information on the total net household income in decile categories, but such a measure is not feasible since it cannot be rescaled to the individual level of the respondent. The only available measure referring to respondents’ income situations is based on subjective information on the respondents’ attitude toward their current household income (possible answers included 1 for ‘living comfortably on present income’, 2 for ‘coping on present income’, 3 for ‘finding it difficult on present income’ and 4 for ‘finding it very difficult on present income’). Employing this variable is not an ideal solution because it does not refer to the respondent’s work income but to the total household level. However, since income from work accounts for the majority of the household income for prime-aged employees (Večerník 2009), it is reasonable to expect a significant relationship between this subjective measure and respondents’ income from work. Therefore, this subjective measure can be used as a proxy for income from work. I employ two dummies—one for respondents living comfortably on their present income and the other for respondents coping on their present income (a similar strategy was already utilised in previous research, see, e.g., Mysíková and Večerník 2013).
Moreover, in the work–role output group, two controls for respondents’ autonomy at work were included: (1) a dummy showing how much the management allows respondents to decide how their daily work is organised and (2) how much the management allows respondents to influence policy decisions about the organisation’s activities (both equal one if the respondent indicated codes 6–10 on an 11-point scale, where 10 means ‘complete control’ and 0 stands for ‘no influence’). Next, a dummy referring to the supervision of colleagues’ work was covered (equals one if the respondent indicated ‘yes’ for the responsibility to supervise other employees). A dummy reflecting the time flexibility of the job equalled one if the respondent was completely or to some extent permitted to decide his/her starting and finishing times at work (2–3 on a 3-point scale, where 1 means ‘not at all’ and 3 stands for ‘completely’). A dummy reflecting the spatial flexibility of the job equals one if the respondent was allowed to work from home or another place of choice during the regular working hours every day or several times a week (1–2 on a 6-point scale, where 1 means ‘every day’ and 6 stands for ‘never’). A dummy reflecting the support of management was added, equalling one if that respondent felt supported in balancing work and personal commitments (codes 6–10 on an 11-point scale, where 10 means ‘complete support’ and 0 stands for ‘not at all’) or considers it likely that the manager gives work-related help or advice if needed (1–2 on a 4-point scale, where 1 means ‘very likely’ and 4 stands for ‘not at all likely’).
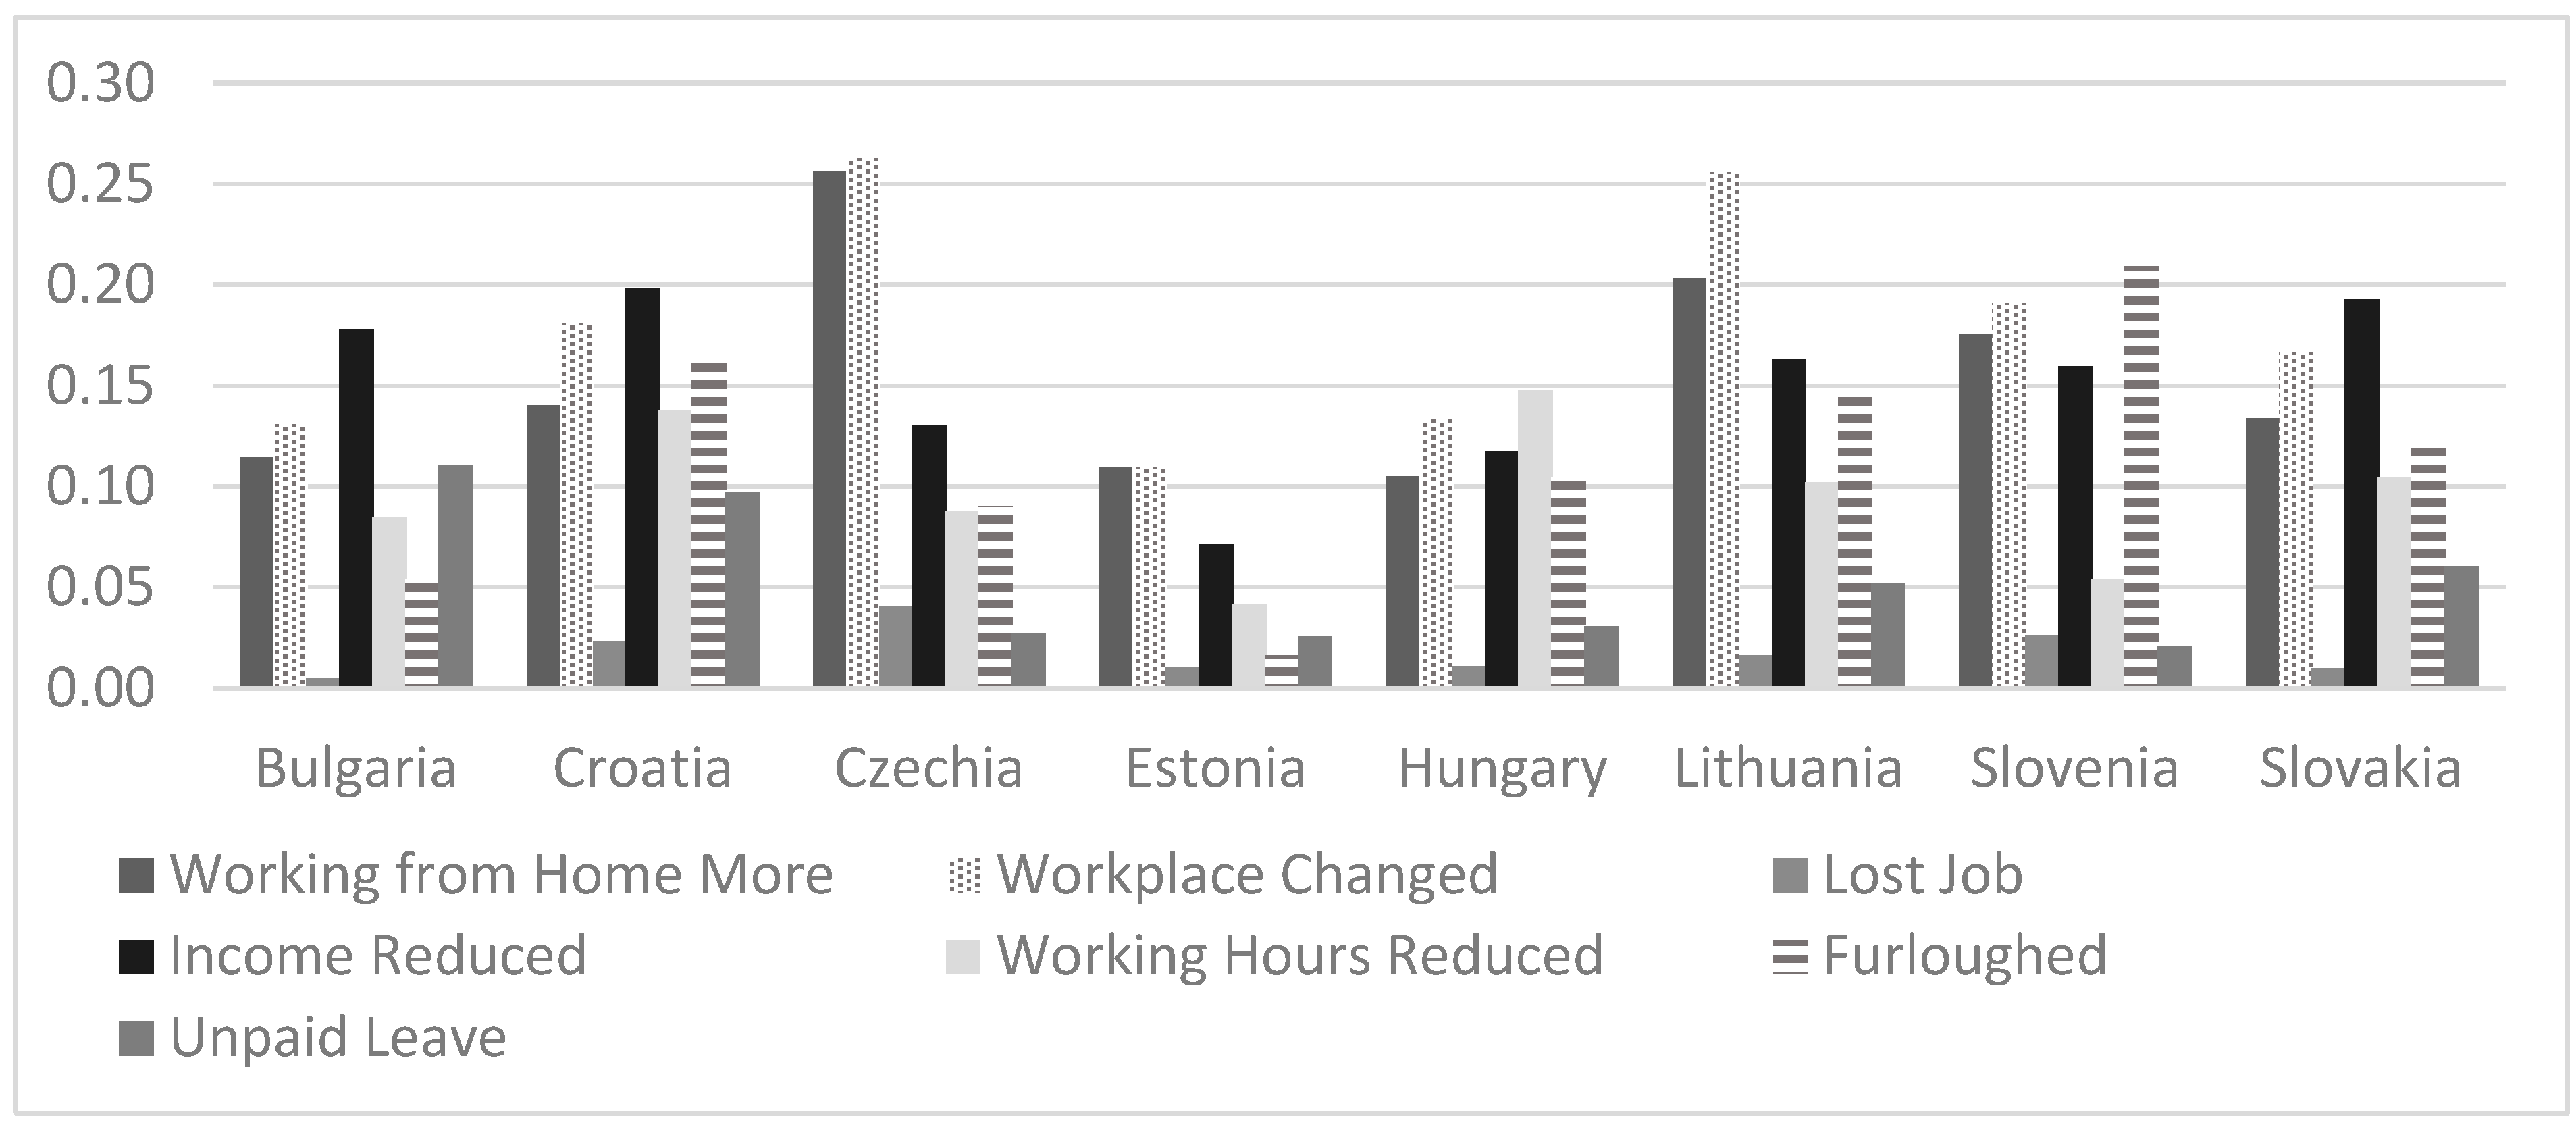
The fifth group of controls covers variables reflecting the real impact of the COVID-19 pandemic on an individual level. Dummies equalled one if the following situations had happened to the respondent since the start of the COVID-19 pandemic: a workplace change (entirely or partially) occurred to the respondent as a result of COVID-19 measures; the respondent started to work from home or a place of choice more often than before the COVID-19 pandemic; the respondent was made redundant or lost his/her job; the respondent’s work income or working hours were reduced; the respondent was furloughed (i.e., on temporary leave with no pay) or was forced to take unpaid leave or holiday. The shares of respondents impacted by these events in the examined countries are depicted in Figure 1.
At the country level, I included two variables theoretically related to individual-level variation in job satisfaction—the first being the unemployment rate (reflecting the tightness of the 2021 national labour markets, for persons between 20 and 64 years of age according to the Eurostat LFS survey), the second being the stringency index (reflecting the strictness of the national restrictive anti-contagion policies) (Hale et al. 2021). The stringency index is a composite indicator based on nine response metrics, including school and workplace closures, travel bans and stay-at-home requirements (scaled from 0 to 100, with 100 being the strictest). The average level of the index for the first half of 2021 was employed.
4. Satisfaction of Workers and the COVID-19 Pandemic in CEE Countries
Along with job satisfaction, the severity of the COVID-19 pandemic and policy responses were, in many aspects, specific and uniform across the CEE region as well as distinct from the experience in WE (see details in Bohle et al. 2022). A summary of the COVID-19 pandemic and information on the job and life satisfaction of workers (dependent variables in subsequent analyses) in the eight countries considered in this study are offered in Table 1.
During the first COVID-19 wave in the first half of 2020, most of the CEE governments quickly imposed severe restrictions, and the case numbers stayed moderate. In contrast, the following waves hit the region hard, with rising infection numbers, death tolls and hospital bed shortages regularly making international headlines—especially in the case of Visegrad countries and Slovenia. As of mid-2021, Estonia, Lithuania, Slovakia, Slovenia and Czechia had the highest total COVID-19 cases per million inhabitants in the EU—exceeding 100 thousand. The ranking of the countries by death rate only modestly differed: Hungary, Czechia, Bulgaria, Slovakia, Slovenia and Croatia ranked highest, with more than 2000 total deaths per million inhabitants by mid-2021. For both measures, the CEE average was much higher than the respective average figure for WE states. Nevertheless, the containment regimes introduced by CEE governments were often not as tough as they were during the first wave. However, this was not the case for Visegrad countries and Slovenia (Oellerich and Toplišek 2022). According to the stringency index (Hale et al. 2021), the contagion measures during the first half of 2021 were, on average, significantly looser in the CEE region than in WE. In particular, most modest restrictions were introduced in the Baltics, Croatia and Bulgaria.
Despite these similarities, worker satisfaction and the economic hardship experienced during the COVID-19 crisis differed between CEE countries. According to ESS data, Estonia and Slovenia reported the highest levels of job satisfaction in 2021. Contrariwise, Czech workers reported the lowest levels of job satisfaction—even lower than in 2012. Except for Czechia, all other countries recorded growth in job satisfaction between 2012 and 2021. Workers’ general satisfaction with life was mostly lower than their satisfaction with their jobs. This holds true for all countries in 2012 and with three exceptions for 2021—Czechia, Croatia and Slovenia, where life satisfaction was higher. Similar to job satisfaction, the highest levels of life satisfaction in 2021 were recorded in Estonia and Slovenia and the lowest in Bulgaria, Slovakia and Hungary. In contrast to countries in the WE region, individuals in CEE experienced notably lower levels of both life and job satisfaction on average. A particularly noteworthy distinction was observed in terms of overall life satisfaction, which remained significantly lower in CEE in both years.
5. Results of Multilevel Model Estimations
The results of the multilevel model estimations of worker job and life satisfaction in CEE countries are reported in Table 2. The first model (cols. a–b) considers the determinants of respondents’ satisfaction with their jobs. The baseline specification (col. a) only includes individual-level variables related to the characteristics of workers and their jobs. A full specification (col. b) is extended to variables reflecting the impact of the COVID-19 pandemic on an individual level and the political response and unemployment rate on a national level.
The results of models explaining the determinants of job satisfaction suggest that individual characteristics are generally less important drivers of worker satisfaction than job characteristics or work–role inputs and outputs. This outcome is in line with the results of previous studies on the topic (e.g., Borooah 2009; Mysíková and Večerník 2013). The estimated effects are robust for various specifications (not reported for the sake of brevity) and do not change with the inclusion of COVID-related and level-two variables.
Only two coefficients are significant in the first group of sociodemographic factors: while the presence of children younger than 16 in the household is generally connected with a higher level of job satisfaction, the experience of unemployment for a period of more than three months has a negative impact. Other respondent characteristics do not show significant effects. This may be due to the coverage of other job aspects in the model which capture the major determinants of job satisfaction.
Regarding the characteristics of jobs and employers, three factors are significantly associated with higher job satisfaction: working in a small enterprise of fewer than 25 employees, working in state or public sectors and being self-employed. In contrast, workers in the secondary sector, trade, transportation, accommodation and food service have significantly lower job satisfaction compared with workers in the primary economic sector (reference category). In addition, workers in all occupational classes—except for workers classified as professionals—have lower job satisfaction compared to the reference category of legislators, senior officials and managers.
In the group of work–role inputs, only education lacks a significant relationship to job satisfaction, which is consistent with the results of Mysíková and Večerník (2013). All other work–role inputs have a significant negative relation to job satisfaction: overtime work and having a tiring job or a time-demanding job disturbing the work–life balance all decrease worker satisfaction. In the group of work–role outputs, living comfortably with the present household income, coping with the present household income, the autonomy of respondents at work and feelings of support from management all significantly increase worker job satisfaction. On the other hand, having a supervisory position and flexible work in terms of both time and space do not have significant links.
Among all the COVID-related events in the respondents’ work careers that were accounted for, only pandemic-related income reduction significantly decreased worker job satisfaction. All other COVID-related variable coefficients are insignificant. This may be a disquieting result since the list also covers serious work career disruptions such as job loss and unpaid leave. However, since the sample of respondents only covers those who worked during the time of the survey, career disruptions do not seem to have had a lasting effect on the job satisfaction of respondents in their current work. On the other hand, the reduction in work income may have a longer-lasting effect and significantly reduce worker job satisfaction. Finally, the stringency of anti-pandemic government policy measures does not show a significant effect on job satisfaction, nor do labour market conditions approximated by the rate of unemployment.
The second model (cols. c–e) examines the determinants of workers’ overall life satisfaction. The baseline specification (col. c) controls only for the characteristics of individual workers (the first group of independent variables), education and respondents’ feelings about their household income. This specification is further extended to other groups of factors. In the first step, this concerned variables capturing the impact of the COVID-19 pandemic on an individual level and two country-level variables (col. d). The second step involved factors related to respondents’ jobs (col. e, similar to the full specification of the model on job satisfaction in col. b).
In the case of worker life satisfaction, more individual characteristics are significant in model estimations compared to the previous model on job satisfaction. While having children younger than 16 living in the same household and being married are significantly and positively associated with life satisfaction, past experience with unemployment and poor subjective health negatively influence life satisfaction. In addition, life satisfaction significantly decreases with the age of respondents. As with the job satisfaction model, the educational level of respondents does not have a significant influence. The ability to live comfortably or cope with one’s present household income, however, is a significant positive driver of overall life satisfaction.
In the group of job and employer characteristics, only three occupational categories—skilled agricultural, forestry and fishery workers; craft-related trade workers and elementary occupations—were significantly related to lower life satisfaction. Other factors, however, do not show a significant impact. Additionally, some of the work–role inputs and outputs influenced the life satisfaction of workers. Having autonomy in the organisation of work has a positive relation. Contrary and somewhat surprisingly, flexible work hours are associated with lower life satisfaction. Time flexibility of the job may be generally favourable for maintaining a positive work–life balance and job satisfaction (Wöhrmann et al. 2021) but, in some cases, larger autonomy in working time setting may have an adverse effect on workers’ private lives (e.g., Seitz and Rigotti 2018). This can lead to a work–life conflict or an unhealthy extension of working hours (Lott 2020) and thus have a negative effect on workers’ well-being and satisfaction. Indeed, having a job that is time-consuming, tiring and/or that disturbs one’s work–life balance is also significantly associated with lower life satisfaction, by my estimates.
Concerning the variables that capture the impact of the COVID-19 pandemic on overall life satisfaction, a decrease in income also has a significant negative effect (as seen in job satisfaction models). Moreover, changes in the workplace during the pandemic significantly impacted the life satisfaction of workers negatively. Nevertheless, some of the anti-pandemic measures increased worker life satisfaction by making it possible to work from home more often. Perhaps surprisingly, being furloughed was also positively related to workers’ life satisfaction. Regarding the workers who remained employed, the COVID-19 pandemic’s impact on their overall life satisfaction was much broader compared to its impact on their job satisfaction. Moreover, these effects were not purely negative: the opportunity/necessity to stay home more (either while continuing paid work from home or on furlough) increased the overall life satisfaction of workers. These positive effects were, however, offset by the purely negative impact of income reduction.
The overall life satisfaction of workers was also affected by the overall stringency of the governmental anti-pandemic policies, which was not the case for job satisfaction. The more restrictive the political measures were during the first half of 2021, the lower the life satisfaction of workers in mid-2021. This effect is statistically significant and robust across different model specifications.
6. Conclusions and Discussion
This paper aimed to analyse worker satisfaction in Central and Eastern Europe during the COVID-19 pandemic in a cross-country setting using the latest available European Social Survey dataset. It examined the effect of work career disruptions resulting from anti-pandemic measures and the overall stringency of COVID-19-related governmental policies on the job and overall life satisfaction of workers in 2021.
Previous research has indicated that job satisfaction has specific patterns in CEE compared to Western European countries regarding both CEE’s lower level and differences in its determinants and their effects. According to the ESS data for 2012 and 2021, both life and job satisfaction were, on average, lower in CEE than in WE—a more pronounced difference was observable regarding workers’ overall life satisfaction. Across the CEE region, the general satisfaction of workers with their lives tended to be lower than their satisfaction with their jobs in both 2012 and 2021. Notably, job satisfaction increased across all countries during this period, except for Czechia.
The severity of the COVID-19 pandemic and policy responses were, in many aspects, specific and relatively uniform across the CEE region as well. As of mid-2021, CEE’s average number of total COVID-19 cases and deaths per million inhabitants were much higher than the respective averages for WE states. However, the containment regimes and restrictive policy measures introduced by the CEE governments during the first half of 2021 were, in general, considerably looser in the CEE region. My results show that both the general stringency of anti-COVID policies and the resulting disruptions to individuals’ work lives significantly impacted their well-being.
While workers’ satisfaction with their jobs was negatively affected mainly by reductions in work income resulting from anti-pandemic measures, workers’ overall life satisfaction was impacted by the COVID-19 pandemic in a more complex way. While income reductions also impacted life satisfaction negatively, a similar negative effect was revealed for workplace relocation during the pandemic. Furthermore, workers’ life satisfaction was significantly reduced by stringent governmental anti-COVID policies (e.g., stay-at-home requirements, workplace closures and travel bans). However, the consequences of COVID-19-related disruptions to working lives regarding overall life satisfaction were not purely negative. The opportunity/necessity to stay home more—either while continuing paid work from home or on furlough—positively affected the life satisfaction of workers.
It is necessary to stress that the information on both measures of satisfaction only concerns those workers who retained their jobs despite the adverse consequences of the pandemic and related policy responses. Most probably, the decline in the well-being of those workers who lost their jobs during the pandemic crisis (who were not included in the examined sample) would be considerably different. Nevertheless, my results suggest that other career disruptions apart from income reduction did not have major effects on workers’ job satisfaction—indicating that if they occurred, their effect was not significant or long-lasting (e.g., if workers lost their jobs due to the pandemic but managed to find a new one and thus were covered in the sample).
As far as the effects of other variables are concerned, the results suggest that individual characteristics are generally less important determinants of job satisfaction than job characteristics or work–role inputs and outputs, which is in line with the findings of previous studies. Furthermore, the results confirm the insignificant effect of educational attainment on job satisfaction. In contrast, workers in small enterprises, in state or public sectors and the self-employed show higher job satisfaction. Furthermore, factors such as ease of coping with household income, a sense of autonomy in respondents’ work roles and feelings of support from management all exhibit a significant positive link to worker job satisfaction. Conversely, engagement in overtime work and the presence of a tiring or time-demanding job that disrupts the work–life balance are connected with a significantly lower level of job satisfaction among workers. These results may be applied to standard situations outside the pandemic period as well.
The main limitations of my research concern the utilised data. Most importantly, the ESS data lack several variables representing important drivers of job satisfaction. Firstly, it lacks detailed information on work income that was not covered in the data and that needed to be approximated by respondents’ feelings about household income. Furthermore, the dataset lacks more detailed characteristics of jobs (e.g., the possibility to learn new things, the opportunity for career advancement or the variety of work). Furthermore, although the relationship between satisfaction and work career disruptions resulting from anti-pandemic measures may develop over the longer term, I utilised a comparative perspective focusing on one particular period and do not make causal interferences between the variables. Nevertheless, the variables were selected based on previous theoretical and empirical research and were reasonably deduced and verified. Finally, the size of the national samples in surveys of opinions and perceptions such as the ESS is limited, which makes the data vulnerable to various biases. All these caveats should lead to more caution when considering and interpreting my findings.
Funding
This research was funded by the Ministry of Education, Youth and Sports of the Czech Republic under project no. LM2018139 and LTT20011 ‘Výzkum na ESS Round 9 a ESS Round 10’.
Institutional Review Board Statement
Not applicable.
Informed Consent Statement
Not applicable.
Data Availability Statement
Data publicly available: ESS Round 10: European Social Survey European Research Infrastructure (ESS ERIC). (2023). ESS10 integrated file, edition 3.1 [Data set]. Sikt—Norwegian Agency for Shared Services in Education and Research. https://doi.org/10.21338/ess10e03_1 (accessed on 31 August 2022).
Conflicts of Interest
The author declares no conflict of interest. The funders had no role in the design of the study; in the collection, analyses, or interpretation of data; in the writing of the manuscript; or in the decision to publish the results.
Appendix A

Table A1.
Summary statistics on individual-level characteristics (country averages).
| Bulgaria | Czechia | Estonia | Croatia | Hungary | Lithuania | Slovenia | Slovakia | |||||||||
|---|---|---|---|---|---|---|---|---|---|---|---|---|---|---|---|---|
| Mean | Std. Dev. | Mean | Std. Dev. | Mean | Std. Dev. | Mean | Std. Dev. | Mean | Std. Dev. | Mean | Std. Dev. | Mean | Std. Dev. | Mean | Std. Dev. | |
| Female | 0.47 | 0.50 | 0.46 | 0.50 | 0.50 | 0.50 | 0.45 | 0.50 | 0.46 | 0.50 | 0.49 | 0.50 | 0.45 | 0.50 | 0.48 | 0.50 |
| Age | 43.82 | 11.34 | 45.15 | 11.06 | 42.39 | 12.35 | 42.06 | 11.65 | 42.41 | 11.36 | 42.55 | 12.02 | 42.94 | 11.17 | 42.40 | 11.63 |
| Married | 0.54 | 0.50 | 0.55 | 0.50 | 0.39 | 0.49 | 0.61 | 0.49 | 0.59 | 0.49 | 0.57 | 0.50 | 0.50 | 0.50 | 0.62 | 0.49 |
| Children | 0.33 | 0.47 | 0.25 | 0.43 | 0.37 | 0.48 | 0.35 | 0.48 | 0.25 | 0.43 | 0.32 | 0.47 | 0.40 | 0.49 | 0.26 | 0.44 |
| Bad Health | 0.01 | 0.10 | 0.02 | 0.15 | 0.03 | 0.18 | 0.02 | 0.15 | 0.01 | 0.12 | 0.03 | 0.16 | 0.02 | 0.15 | 0.01 | 0.10 |
| Ever Unemployed | 0.29 | 0.45 | 0.22 | 0.42 | 0.31 | 0.46 | 0.38 | 0.49 | 0.17 | 0.37 | 0.33 | 0.47 | 0.31 | 0.46 | 0.24 | 0.43 |
| City | 0.41 | 0.49 | 0.38 | 0.48 | 0.46 | 0.50 | 0.34 | 0.47 | 0.33 | 0.47 | 0.40 | 0.49 | 0.25 | 0.43 | 0.25 | 0.43 |
| Small Enterprise | 0.63 | 0.48 | 0.45 | 0.50 | 0.50 | 0.50 | 0.56 | 0.50 | 0.54 | 0.50 | 0.54 | 0.50 | 0.37 | 0.48 | 0.57 | 0.50 |
| Big Enterprise | 0.12 | 0.32 | 0.25 | 0.43 | 0.24 | 0.43 | 0.20 | 0.40 | 0.20 | 0.40 | 0.16 | 0.37 | 0.41 | 0.49 | 0.16 | 0.37 |
| NACE 1 | 0.04 | 0.20 | 0.03 | 0.16 | 0.03 | 0.16 | 0.04 | 0.19 | 0.03 | 0.17 | 0.04 | 0.20 | 0.02 | 0.14 | 0.02 | 0.14 |
| NACE 2 | 0.26 | 0.44 | 0.31 | 0.46 | 0.28 | 0.45 | 0.24 | 0.43 | 0.28 | 0.45 | 0.22 | 0.42 | 0.35 | 0.48 | 0.31 | 0.46 |
| NACE 3 | 0.27 | 0.44 | 0.26 | 0.44 | 0.18 | 0.39 | 0.32 | 0.47 | 0.26 | 0.44 | 0.23 | 0.42 | 0.19 | 0.39 | 0.24 | 0.43 |
| NACE 4 | 0.36 | 0.48 | 0.35 | 0.48 | 0.40 | 0.49 | 0.35 | 0.48 | 0.33 | 0.47 | 0.42 | 0.49 | 0.37 | 0.48 | 0.33 | 0.47 |
| NACE 5 | 0.07 | 0.25 | 0.06 | 0.23 | 0.11 | 0.31 | 0.06 | 0.23 | 0.10 | 0.30 | 0.09 | 0.29 | 0.07 | 0.25 | 0.10 | 0.30 |
| ISCO 1 | 0.07 | 0.25 | 0.08 | 0.26 | 0.09 | 0.28 | 0.05 | 0.23 | 0.06 | 0.23 | 0.14 | 0.35 | 0.08 | 0.26 | 0.06 | 0.23 |
| ISCO 2 | 0.14 | 0.35 | 0.18 | 0.39 | 0.26 | 0.44 | 0.13 | 0.33 | 0.14 | 0.35 | 0.23 | 0.42 | 0.22 | 0.42 | 0.16 | 0.37 |
| ISCO 3 | 0.09 | 0.29 | 0.12 | 0.33 | 0.15 | 0.35 | 0.15 | 0.36 | 0.13 | 0.34 | 0.10 | 0.29 | 0.16 | 0.37 | 0.19 | 0.39 |
| ISCO 4 | 0.10 | 0.29 | 0.13 | 0.34 | 0.05 | 0.22 | 0.09 | 0.28 | 0.07 | 0.25 | 0.04 | 0.19 | 0.08 | 0.27 | 0.05 | 0.23 |
| ISCO 5 | 0.17 | 0.37 | 0.17 | 0.38 | 0.12 | 0.32 | 0.21 | 0.41 | 0.17 | 0.38 | 0.16 | 0.37 | 0.16 | 0.36 | 0.18 | 0.38 |
| ISCO 6 | 0.01 | 0.08 | 0.01 | 0.09 | 0.01 | 0.09 | 0.01 | 0.12 | 0.01 | 0.09 | 0.01 | 0.11 | 0.01 | 0.10 | 0.00 | 0.04 |
| ISCO 7 | 0.15 | 0.36 | 0.14 | 0.35 | 0.13 | 0.34 | 0.14 | 0.35 | 0.16 | 0.36 | 0.12 | 0.32 | 0.15 | 0.36 | 0.14 | 0.35 |
| ISCO 8 | 0.11 | 0.31 | 0.11 | 0.32 | 0.10 | 0.30 | 0.09 | 0.29 | 0.12 | 0.33 | 0.07 | 0.26 | 0.08 | 0.27 | 0.10 | 0.31 |
| ISCO 9 | 0.10 | 0.30 | 0.05 | 0.22 | 0.07 | 0.26 | 0.08 | 0.27 | 0.10 | 0.30 | 0.08 | 0.28 | 0.04 | 0.20 | 0.06 | 0.24 |
| ISCO 0 | 0.08 | 0.27 | 0.01 | 0.10 | 0.02 | 0.12 | 0.05 | 0.21 | 0.04 | 0.20 | 0.05 | 0.22 | 0.03 | 0.18 | 0.05 | 0.22 |
| State or Public Sector | 0.31 | 0.46 | 0.24 | 0.43 | 0.27 | 0.45 | 0.31 | 0.46 | 0.28 | 0.45 | 0.31 | 0.46 | 0.32 | 0.47 | 0.29 | 0.45 |
| Limited Contract | 0.09 | 0.28 | 0.12 | 0.32 | 0.06 | 0.24 | 0.13 | 0.34 | 0.13 | 0.33 | 0.06 | 0.25 | 0.11 | 0.31 | 0.08 | 0.27 |
| Self-Employed | 0.07 | 0.26 | 0.18 | 0.39 | 0.11 | 0.31 | 0.11 | 0.31 | 0.06 | 0.24 | 0.16 | 0.37 | 0.10 | 0.31 | 0.16 | 0.37 |
| Part-Time | 0.03 | 0.18 | 0.03 | 0.17 | 0.08 | 0.27 | 0.04 | 0.21 | 0.01 | 0.09 | 0.08 | 0.27 | 0.05 | 0.23 | 0.11 | 0.31 |
| Trade Union Membership | 0.12 | 0.32 | 0.07 | 0.25 | 0.06 | 0.24 | 0.14 | 0.35 | 0.05 | 0.23 | 0.04 | 0.19 | 0.19 | 0.39 | 0.07 | 0.26 |
| Secondary Education | 0.63 | 0.48 | 0.57 | 0.50 | 0.44 | 0.50 | 0.71 | 0.46 | 0.66 | 0.47 | 0.36 | 0.48 | 0.60 | 0.49 | 0.69 | 0.46 |
| Tertiary Education | 0.36 | 0.48 | 0.43 | 0.50 | 0.56 | 0.50 | 0.29 | 0.45 | 0.34 | 0.47 | 0.64 | 0.48 | 0.40 | 0.49 | 0.31 | 0.46 |
| Work–Life Balance | 0.15 | 0.36 | 0.17 | 0.38 | 0.18 | 0.38 | 0.27 | 0.45 | 0.10 | 0.30 | 0.17 | 0.37 | 0.19 | 0.39 | 0.18 | 0.39 |
| Tiring Job | 0.29 | 0.45 | 0.26 | 0.44 | 0.27 | 0.45 | 0.33 | 0.47 | 0.14 | 0.35 | 0.26 | 0.44 | 0.24 | 0.43 | 0.19 | 0.39 |
| Overtime Work | 0.14 | 0.35 | 0.17 | 0.38 | 0.24 | 0.43 | 0.26 | 0.44 | 0.15 | 0.36 | 0.26 | 0.44 | 0.31 | 0.46 | 0.19 | 0.39 |
| Living Comfortably on Household Income | 0.08 | 0.27 | 0.27 | 0.45 | 0.32 | 0.47 | 0.38 | 0.49 | 0.14 | 0.35 | 0.24 | 0.43 | 0.62 | 0.49 | 0.25 | 0.43 |
| Coping on Household Income | 0.58 | 0.49 | 0.51 | 0.50 | 0.60 | 0.49 | 0.52 | 0.50 | 0.69 | 0.46 | 0.61 | 0.49 | 0.32 | 0.47 | 0.61 | 0.49 |
| Autonomy in Work Organisation | 0.45 | 0.50 | 0.53 | 0.50 | 0.79 | 0.40 | 0.54 | 0.50 | 0.29 | 0.46 | 0.59 | 0.49 | 0.74 | 0.44 | 0.39 | 0.49 |
| Autonomy to Influence Policy | 0.23 | 0.42 | 0.34 | 0.47 | 0.41 | 0.49 | 0.30 | 0.46 | 0.22 | 0.41 | 0.36 | 0.48 | 0.50 | 0.50 | 0.27 | 0.44 |
| Supervising Position | 0.13 | 0.34 | 0.18 | 0.39 | 0.33 | 0.47 | 0.27 | 0.45 | 0.11 | 0.31 | 0.27 | 0.45 | 0.38 | 0.49 | 0.19 | 0.39 |
| Flexibility—Time | 0.34 | 0.47 | 0.60 | 0.49 | 0.71 | 0.45 | 0.46 | 0.50 | 0.42 | 0.49 | 0.56 | 0.50 | 0.67 | 0.47 | 0.47 | 0.50 |
| Flexibility—Space | 0.09 | 0.29 | 0.14 | 0.35 | 0.26 | 0.44 | 0.14 | 0.34 | 0.07 | 0.26 | 0.15 | 0.36 | 0.16 | 0.36 | 0.13 | 0.33 |
| Management Support | 0.83 | 0.38 | 0.78 | 0.41 | 0.82 | 0.38 | 0.80 | 0.40 | 0.86 | 0.35 | 0.80 | 0.40 | 0.86 | 0.35 | 0.78 | 0.42 |
| Working from Home More | 0.11 | 0.32 | 0.14 | 0.35 | 0.26 | 0.44 | 0.11 | 0.31 | 0.11 | 0.31 | 0.20 | 0.40 | 0.18 | 0.38 | 0.13 | 0.34 |
| Workplace Changed | 0.13 | 0.34 | 0.18 | 0.38 | 0.26 | 0.44 | 0.11 | 0.31 | 0.13 | 0.34 | 0.26 | 0.44 | 0.19 | 0.39 | 0.17 | 0.37 |
| Lost Job | 0.00 | 0.07 | 0.02 | 0.15 | 0.04 | 0.20 | 0.01 | 0.10 | 0.01 | 0.10 | 0.02 | 0.13 | 0.03 | 0.16 | 0.01 | 0.10 |
| Income Reduced | 0.18 | 0.38 | 0.20 | 0.40 | 0.13 | 0.34 | 0.07 | 0.26 | 0.12 | 0.32 | 0.16 | 0.37 | 0.16 | 0.37 | 0.19 | 0.39 |
| Working Hours Reduced | 0.08 | 0.28 | 0.14 | 0.34 | 0.09 | 0.28 | 0.04 | 0.20 | 0.15 | 0.36 | 0.10 | 0.30 | 0.05 | 0.23 | 0.10 | 0.31 |
| Furloughed | 0.05 | 0.23 | 0.16 | 0.37 | 0.09 | 0.29 | 0.02 | 0.13 | 0.10 | 0.31 | 0.15 | 0.36 | 0.21 | 0.41 | 0.12 | 0.33 |
| Unpaid Leave | 0.11 | 0.31 | 0.10 | 0.30 | 0.03 | 0.16 | 0.03 | 0.16 | 0.03 | 0.17 | 0.05 | 0.22 | 0.02 | 0.14 | 0.06 | 0.24 |
Source: ESS10, own calculations. Note: Data weighted by analysis weights. Variables were defined in the text. NACE 1 covers primary sectors; NACE 2 secondary sectors; NACE 3 trade, transportation, accommodation and food service activities; NACE 4 services classified J–R and NACE 5 covers other services (classified S-U). ISCO 1 covers managers; ISCO 2 professionals; ISCO 3 technicians and associate professionals; ISCO 4 clerical support workers; ISCO 5 service and sales workers; ISCO 6 skilled agricultural, forestry and fishery workers; ISCO 7 craft-related trades workers; ISCO 8 plant and machine operators and assemblers; ISCO 9 elementary occupations and ISCO 0 armed forces occupations.
References
- Adams-Prassl, Abi, Teodora Boneva, Marta Golin, and Christopher Rauh. 2020. Inequality in the impact of the coronavirus shock: Evidence from real time surveys. Journal of Public Economics 189: 104245. [Google Scholar] [CrossRef]
- Bender, Keith A., Susan M. Donohue, and John S. Heywood. 2005. Job satisfaction and gender segregation. Oxford Economic Papers 57: 479–96. [Google Scholar] [CrossRef]
- Blahopoulou, Joanna, Silvia Ortiz-Bonnin, Maribel Montañez-Juan, Gema Torrens Espinosa, and M. Esther García-Buades. 2022. Telework satisfaction, wellbeing and performance in the digital era. Lessons learned during COVID-19 lockdown in Spain. Current Psychology 41: 2507–20. [Google Scholar] [CrossRef] [PubMed]
- Blundell, Richard, Monica Costa Dias, Robert Joyce, and Xiaowei Xu. 2020. COVID-19 and Inequalities. Fiscal Studies 41: 291–319. [Google Scholar] [CrossRef] [PubMed]
- Böckerman, Petri, and Pekka Ilmakunnas. 2012. The Job Satisfaction-Productivity Nexus: A Study Using Matched Survey And Register Data. Industrial and Labor Relations Review 65: 244–62. [Google Scholar] [CrossRef]
- Bohle, Dorothee, Edgars Eihmanis, and Alen Toplišek, eds. 2022. The Political Economy of COVID-19 Responses in East Central Europe. Fiesole: European University Institute. [Google Scholar]
- Borjas, George. J. 1979. Job satisfaction, wages and unions. Journal of Human Resources 14: 21–40. [Google Scholar] [CrossRef]
- Borooah, Vani K. 2009. Comparing levels of job satisfaction in the countries of Western and Eastern Europe. International Journal of Manpower 30: 304–25. [Google Scholar] [CrossRef]
- Brayfield, Arthur H., and Walter H. Crockett. 1955. Employee attitudes and employee performance. Psychological Bulletin 52: 396–424. [Google Scholar] [CrossRef]
- Brush, Donald H., Michael K. Moch, and Abdullah Pooyan. 1987. Individual demographic differences and job satisfaction. Journal of Occupational Behaviour 8: 139–55. [Google Scholar] [CrossRef]
- Bryson, Alex, Lorenzo Cappellari, and Claudio Lucifora. 2004. Does union membership really reduce job satisfaction? British Journal of Industrial Relations 42: 439–59. [Google Scholar] [CrossRef]
- Cannas, Massimo, Bruno S. Sergi, Emiliano Sironi, and Urszula Mentel. 2019. Job Satisfaction and Subjective Well-Being in Europe. Economics & Sociology 12: 183–96. [Google Scholar]
- Canzio, Leandro Iván, Felix Bühlmann, and Jonas Masdonati. 2022. Job satisfaction across Europe: An analysis of the heterogeneous temporary workforce in 27 countries. Economic and Industrial Democracy 44: 728–54. [Google Scholar]
- Chaudhuri, Kausik, Kevin T. Reilly, and David A. Spencer. 2015. Job satisfaction, age and tenure: A generalized dynamic random effects model. Economics Letters 130: 13–16. [Google Scholar] [CrossRef]
- Cheng, Shao-Cheng, and Yu-Huan Kao. 2022. The impact of the COVID-19 pandemic on job satisfaction: A mediated moderation model using job stress and organizational resilience in the hotel industry of Taiwan. Heliyon 8: e09134. [Google Scholar] [CrossRef] [PubMed]
- Cheng, Terence C., Seonghoon Kim, and Kanghyock Koh. 2022. Life Satisfaction Changes and Adaptation in the Covid-19 Pandemic: Evidence from Singapore. Singapore Economic Review, 1–34. [Google Scholar] [CrossRef]
- Clark, Andrew E. 1996. Job satisfaction in Britain. British Journal of Industrial Relations 4: 341–72. [Google Scholar] [CrossRef]
- Clark, Andrew E. 1997. Job satisfaction and gender: Why are women so happy at work? Labour Economics 4: 341–72. [Google Scholar] [CrossRef]
- Clark, Andrew E. 1999. Are wages habit-forming? Evidence from micro data. Journal of Economic Behavior & Organization 39: 179–200. [Google Scholar]
- Clark, Andrew E., and Andrew J. Oswald. 1996. Satisfaction and comparison income. Journal of Public Economics 61: 359–81. [Google Scholar] [CrossRef]
- Clark, Andrew E., Andrew J. Oswald, and Peter B. Warr. 1995. Is job satisfaction U-shaped in age? Journal of Occupational and Organizational Psychology 69: 57–81. [Google Scholar] [CrossRef]
- Dawson, Chris, Michail Veliziotis, and Benjamin Hopkins. 2017. Temporary employment, job satisfaction and subjective well-being. Economic and Industrial Democracy 38: 69–98. [Google Scholar] [CrossRef]
- Diener, Ed, Eunkook M. Suh, Richard E. Lucas, and Heidi L. Smith. 1999. Subjective well-being: Three decades of progress. Psychological Bulletin 125: 276–302. [Google Scholar] [CrossRef]
- Duong, Doanh Cong. 2021. The impact of fear and anxiety of Covid-19 on life satisfaction: Psychological distress and sleep disturbance as mediators. Personality and Individual Differences 178: 110869. [Google Scholar] [CrossRef]
- Enders, Craig K., and Davood Tofighi. 2007. Centering predictor variables in cross-sectional multilevel models: A new look at an old issue. Psychological Methods 12: 121–38. [Google Scholar] [CrossRef]
- Felstead, Alan, and Darja Reuschke. 2020. Homeworking in the UK before and during the 2020 Lockdown. WISERD Report. Cardiff: Wales Institute of Social and Economic Research. [Google Scholar]
- Freeman, Richard B. 1978. Job satisfaction as an economic variable. American Economic Review 68: 135–41. [Google Scholar]
- Frey, Bruno, and Alois Stutzer. 2002. The Economics of Happiness. World Economics 3: 25–41. [Google Scholar]
- Gelman, Andrew. 2007. Struggles with survey weighting and regression modelling. Statistical Science 22: 153–64. [Google Scholar]
- Grover, Sandeep, Swapnajeet Sahoo, Aseem Mehra, Ajit Avasthi, Adarsh Tripathi, Alka Subramanyan, Amrit Pattojoshi, G Prasad Rao, Gautam Saha, K K Mishra, and et al. 2020. Psychological impact of COVID-19 lockdown: An online survey from India. Indian Journal of Psychiatry 62: 354–62. [Google Scholar] [CrossRef]
- Grund, Christian, and Dirk Sliwka. 2003. The Further We Stretch, the Higher the Sky: On the Impact of Wage Increases on Job Satisfaction. Bonn Econ Discussion Papers. 1/2003. Bonn: University of Bonn. [Google Scholar]
- Hale, Thomas, Noam Angrist, Rafael Goldszmidt, Beatriz Kira, Anna Petherick, Toby Phillips, Samuel Webster, Emily Cameron-Blake, Laura Hallas, Saptarshi Majumdar, and et al. 2021. A global panel database of pandemic policies (Oxford COVID-19 Government Response Tracker). Nature Human Behaviour 5: 529–38. [Google Scholar] [CrossRef] [PubMed]
- ILO. 2004. Part-Time Work. Conditions of Work and Employment Programme. Information Sheet No. WT-4. Geneva: International Labour Organization. [Google Scholar]
- Inglehart, Ronald, and Wayne E. Baker. 2000. Modernization, cultural change, and the persistence of traditional values. American Sociological Review 65: 19–51. [Google Scholar] [CrossRef]
- Johnson, Elizabeth R., and Ashley V. Whillans. 2022. The Impact of the COVID-19 Pandemic on the Satisfaction of Workers in Low-Wage Jobs. Working Paper 23-001. Boston: Harvard Business School. [Google Scholar]
- Judge, Timothy A., Carl J. Thoresen, Joyce E. Bono, and Gregory K. Patton. 2001. The job satisfaction-job performance relationship: A qualitative and quantitative review. Psychological Bulletin 127: 376–407. [Google Scholar] [CrossRef]
- Kaminska, Olena. 2020. Guide to Using Weights and Sample Design Indicators with ESS Data. European Social Survey. Available online: https://www.europeansocialsurvey.org/docs/methodology/ESS_weighting_data_1_1.pdf (accessed on 16 September 2022).
- Kondratowicz, Blanka, Dorota Godlewska-Werner, Piotr Połomski, and Meetu Khosla. 2022. Satisfaction with job and life and remote work in the COVID-19 pandemic: The role of perceived stress, self-efficacy and self-esteem. Current Issues in Personality Psychology 10: 49–60. [Google Scholar] [CrossRef]
- Lott, Yvonne. 2020. Does flexibility help employees switch off from work? Flexible working-time arrangements and cognitive work-to home spillover for women and men in Germany. Social Indicator Research 151: 471–94. [Google Scholar] [CrossRef]
- Makridis, Christos, and Jason D. Schloetzer. 2022. Does Working from Home Increase Job Satisfaction and Retention? Evidence from the COVID-19 Pandemic. Georgetown McDonough School of Business Research Paper No. 4016657. Available online: https://ssrn.com/abstract=4016657 (accessed on 16 September 2022).
- Martin, Ludivine, Laetitia Hauret, and Chantal Fuhrer. 2022. Digitally transformed home office impacts on job satisfaction, job stress and job productivity. COVID-19 findings. PLoS ONE 17: e0265131. [Google Scholar] [CrossRef]
- Mathieu, Edouard, Hannah Ritchie, Lucas Rodés-Guirao, Cameron Appel, Charlie Giattino, Joe Hasell, Bobbie Macdonald, Saloni Dattani, Diana Beltekian, Esteban Ortiz-Ospina, and et al. 2020. Coronavirus Pandemic (COVID-19). Published Online at OurWorldInData.org. Available online: https://ourworldindata.org/coronavirus (accessed on 16 September 2022).
- Mohammed, Zaidan, Dimpy Nandwani, Anushree Saboo, and Prakash Padakannaya. 2022. Job satisfaction while working from home during the COVID-19 pandemic: Do subjective work autonomy, work-family conflict, and anxiety related to the pandemic matter? Cogent Psychology 9: 2087278. [Google Scholar] [CrossRef]
- Möhring, Katja, Elias Naumann, Maximiliane Reifenscheid, Alexander Wenz, Tobias Rettig, Ulrich Krieger, Sabine Friedel, Marina Finkel, Carina Cornesse, and Annelies G. Blom. 2021. The COVID-19 pandemic and subjective well-being: Longitudinal evidence on satisfaction with work and family. European Societies 23: S601–S617. [Google Scholar] [CrossRef]
- Myant, Martin. 2018. Why Are Wages Still Lower in Eastern and Central Europe? WP 18/01. Brussels: ETUI. [Google Scholar]
- Mysíková, Martina, and Jiří Večerník. 2013. Job satisfaction across Europe: Differences between and within regions. Post-Communist Economies 25: 539–56. [Google Scholar] [CrossRef]
- Oellerich, Nils, and Alen Toplišek. 2022. Background: The pandemic, its economic fallout, and the European Framework. In The Political Economy of COVID-19 Responses in East Central Europe. Edited by Dorothee Bohle, Edgars Eihmanis and Alen Toplišek. San Domenico di Fiesole: EUI, pp. 25–33. [Google Scholar]
- Pelly, Diane, Orla Doyle, Michael Daly, and Liam Delaney. 2021. Worker Well-Being before and during the COVID-19 Restrictions: A Longitudinal Study in the UK. WP 2021/01. Dublin: UCD Centre for Economic Research. [Google Scholar]
- Perugini, Cristiano, and Marko Vladisavljević. 2019. Gender inequality and the gender-job satisfaction paradox in Europe. Labour Economics 60: 129–47. [Google Scholar] [CrossRef]
- Petty, M. M., Gail W. McGee, and Jerry W. Cavender. 1984. A meta-analysis of the relationship between individual job satisfaction and individual performance. Academy of Management Review 9: 712–21. [Google Scholar] [CrossRef]
- Rabe-Hesketh, Sophia, and Anders Skrondal. 2006. Multilevel modelling of complex survey data. Journal of the Royal Statistical Society 169: 805–27. [Google Scholar] [CrossRef]
- Renaud, Stephane. 2002. Rethinking the union membership/job satisfaction relationship: Some empirical evidence in Canada. International Journal of Manpower 23: 137–50. [Google Scholar] [CrossRef]
- Seitz, Julia, and Thomas Rigotti. 2018. How do differing degrees of working-time autonomy and overtime affect worker well-being? A multilevel approach using data from the German socio-economic panel (SOEP). German Journal of Human Resource Management 32: 177–94. [Google Scholar] [CrossRef]
- Sousa-Poza, Alfonso, and Andrés A. Sousa-Poza. 2000. Well-being at work: A cross-national analysis of the levels of job satisfaction. Journal of Socio-Economics 29: 517–38. [Google Scholar] [CrossRef]
- Van Praag, Bernard M., and Ada Ferrer-i-Carbonell. 2006. An Almost Integration Free Approach to Ordered Response Models. Technical Report. Amsterdam: Tinbergen Institute, University of Amsterdam. [Google Scholar]
- Večerník, Jiří. 2004. Skating on thin ice: A comparison of work values and job satisfaction in CEE and EU countries. International Journal for Comparative Sociology 44: 444–71. [Google Scholar] [CrossRef]
- Večerník, Jiří. 2009. Czech Society in the 2000s: A Report on Socio-Economic Policies and Structures. Prague: Academia. [Google Scholar]
- Vila, Luis E., and Belen García-Mora. 2005. Education and the determinants of job satisfaction. Education Economics 13: 409–25. [Google Scholar] [CrossRef]
- Vroom, Victor H. 1964. Work and Motivation. New York: Wiley. [Google Scholar]
- Wanous, John P., Arnon E. Reichers, and Michael J. Hudy. 1997. Overall job satisfaction: How good are single-item measures? Journal of Applied Psychology 82: 247–52. [Google Scholar] [CrossRef]
- Wöhrmann, Anne M., Nicola Dilchert, and Alexandra Michel. 2021. Working time flexibility and work-life balance: The role of segmentation preference. Zeitschrift für Arbeitswissenschaft 75: 74–85. [Google Scholar] [CrossRef]
Figure 1.
COVID-19-related events on an individual level (impacted respondents, a share of the total sample). Source: ESS round 10. Data weighted by analysis weights.
Figure 1.
COVID-19-related events on an individual level (impacted respondents, a share of the total sample). Source: ESS round 10. Data weighted by analysis weights.

Table 1.
COVID-19 severity, stringency of restrictions and job satisfaction.
| 30 June 2021 | 2012 | 2021 | ||||||
|---|---|---|---|---|---|---|---|---|
| Total Cases/Mil. | Total Deaths/mil. | Stringency Index, Average 1/20–6/21 | Stringency Index, Average 1/21–6/21 | Job Satisfaction | Life Satisfaction | Job Satisfaction | Life Satisfaction | |
| Bulgaria | 61,260 | 2623 | 50 | 54 | 6.97 | 5.24 | 7.39 | 6.57 |
| Croatia | 88,635 | 2021 | 50 | 49 | .. | .. | 7.53 | 7.55 |
| Czechia | 158,627 | 2883 | 58 | 68 | 7.58 | 6.84 | 7.11 | 7.26 |
| Estonia | 98,641 | 955 | 43 | 48 | 7.14 | 6.40 | 7.79 | 7.66 |
| Hungary | 83,228 | 3089 | 61 | 67 | 7.02 | 5.80 | 7.49 | 6.89 |
| Lithuania | 100,175 | 1574 | 54 | 58 | 7.32 | 6.16 | 7.48 | 7.11 |
| Slovakia | 142,266 | 2296 | 59 | 65 | 6.77 | 6.77 | 7.50 | 6.59 |
| Slovenia | 121,418 | 2085 | 58 | 62 | 7.30 | 7.20 | 7.70 | 7.79 |
| CEE | 106,781 | 2191 | 54 | 59 | 7.18 | 6.26 | 7.40 | 7.05 |
| WE | 72,017 | 1315 | 61 | 67 | 7.45 * | 7.14 * | 7.45 * | 7.30 * |
| EU | 81,870 | 1563 | 59 | 64 | 7.41 * | 7.02 * | 7.44 * | 7.26 * |
Source: ESS round 10, ESS round 6, Mathieu et al. (2020). Note: * Averages cover only the following WE countries with data available in ESS10: Belgium, Finland, France, Greece, Ireland, Italy, the Netherlands, Norway, Portugal, Switzerland and the United Kingdom. Data weighted by analysis weights.
Table 2.
Results of multilevel model estimations.
| Job Satisfaction | Life Satisfaction | |||||
|---|---|---|---|---|---|---|
| (a) | (b) | (c) | (d) | (e) | ||
| I. Group: Characteristics of Individual Workers | Female | 0.016 | 0.017 | 0.010 | 0.007 | −0.004 |
| Age | 0.009 | 0.009 | −0.020 ** | −0.019 ** | −0.020 ** | |
| Age sq. | −0.000 | −0.000 | 0.000 * | 0.000 * | 0.000 * | |
| Married | −0.016 | −0.014 | 0.133 *** | 0.133 *** | 0.136 *** | |
| Children | 0.086 *** | 0.081 *** | 0.127 *** | 0.123 *** | 0.113 *** | |
| Bad Health | 0.085 | 0.079 | −0.461 *** | −0.469 *** | −0.444 *** | |
| Ever Unemployed | −0.104 *** | −0.102 *** | −0.103 *** | −0.097 *** | −0.070 ** | |
| City | −0.023 | −0.022 | −0.009 | −0.010 | −0.012 | |
| II. Group: Characteristics of Jobs/Employers | Small Enterprise | 0.056 * | 0.058 * | 0.007 | ||
| Big Enterprise | −0.012 | −0.013 | −0.007 | |||
| NACE 2 | −0.212 *** | −0.203 *** | −0.079 | |||
| NACE 3 | −0.193 ** | −0.182 ** | −0.117 | |||
| NACE 4 | −0.108 | −0.102 | −0.034 | |||
| NACE 5 | −0.120 | −0.105 | −0.098 | |||
| ISCO 2 | −0.000 | −0.003 | −0.042 | |||
| ISCO 3 | −0.116 ** | −0.120 ** | −0.056 | |||
| ISCO 4 | −0.133 ** | −0.138 ** | −0.108 * | |||
| ISCO 5 | −0.198 *** | −0.199 *** | −0.077 | |||
| ISCO 6 | −0.295 * | −0.315 ** | −0.413 *** | |||
| ISCO 7 | −0.127 ** | −0.133 ** | −0.174 *** | |||
| ISCO 8 | −0.224 *** | −0.233 *** | −0.123 * | |||
| ISCO 9 | −0.229 *** | −0.242 *** | −0.186 *** | |||
| ISCO 0 | −0.176 ** | −0.185 ** | 0.007 | |||
| State or Public Sector | 0.073 ** | 0.067 ** | −0.037 | |||
| Limited Contract | 0.015 | 0.016 | 0.041 | |||
| Self-Employed | 0.290 *** | 0.300 *** | 0.049 | |||
| Part-Time | 0.004 | −0.001 | −0.043 | |||
| Trade Union Membership | 0.044 | 0.047 | 0.043 | |||
| III. Group: Work–Role Inputs | Secondary Education | −0.258 | −0.269 | −0.358 | −0.360 | −0.386 |
| Tertiary Education | −0.311 | −0.321 | −0.261 | −0.262 | −0.353 | |
| Work–Life Balance | −0.250 *** | −0.247 *** | −0.142 *** | |||
| Tiring Job | −0.309 *** | −0.308 *** | −0.121 *** | |||
| Overtime Work | −0.085 *** | −0.084 *** | −0.012 | |||
| IV. Group: Work–Role Outputs | Living Comfortably on Household Income | 0.512 *** | 0.501 *** | 0.698 *** | 0.690 *** | 0.601 *** |
| Coping on Household Income | 0.290 *** | 0.285 *** | 0.346 *** | 0.343 *** | 0.286 *** | |
| Autonomy in Work Organisation | 0.235 *** | 0.227 *** | 0.137 *** | |||
| Autonomy to Influence Policy | 0.118 *** | 0.119 *** | 0.049 | |||
| Supervising Position | 0.019 | 0.016 | 0.042 | |||
| Flexibility—Time | 0.007 | 0.013 | −0.072 ** | |||
| Flexibility—Space | −0.037 | −0.034 | −0.030 | |||
| Management Support | 0.193 *** | 0.190 *** | 0.012 | |||
| V. Group: COVID-19’s Impact | Working from Home More | 0.033 | 0.235 *** | 0.210 *** | ||
| Workplace Changed | −0.054 | −0.214 *** | −0.217 *** | |||
| Lost Job | −0.024 | −0.066 | −0.048 | |||
| Income Reduced | −0.080 ** | −0.118 *** | −0.120 *** | |||
| Working Hours Reduced | −0.005 | 0.002 | 0.012 | |||
| Furloughed | −0.038 | 0.070 * | 0.082 ** | |||
| Unpaid Leave | −0.051 | −0.038 | −0.012 | |||
| VI. Group: Level 2 Vars. | Unemployment Rate | 0.014 | −0.056 | −0.051 | ||
| Stringency Index | −0.006 | −0.019 ** | −0.018 ** | |||
| Constant | −0.202 | 0.104 | 0.368 | 1.802 *** | 1.994 *** | |
| Observations | 5681 | 5681 | 5669 | 5669 | 5669 | |
| Log Likelihood | −7353.2 | −7346.36 | −7514.91 | −7497.99 | −7432.87 | |
| Wald Chi2 | 1150 | 1168 | 562.3 | 607.3 | 756.2 | |
Source: ESS round 10, Mathieu et al. (2020), author’s calculations. Note: Multilevel models with random intercepts were utilised. ***/**/* statistically significant at 1%/5%/10% levels, respectively. Variables were defined in the text. NACE 1 (reference category) covers primary sectors; NACE 2 secondary sectors; NACE 3 trade, transportation, accommodation and food service activities; NACE 4 services classified J–R and NACE 5 covers other services (classified S-U). ISCO 1 (reference category) covers managers; ISCO 2 professionals; ISCO 3 technicians and associate professionals; ISCO 4 clerical support workers; ISCO 5 service and sales workers; ISCO 6 skilled agricultural, forestry and fishery workers; ISCO 7 craft-related trades workers; ISCO 8 plant and machine operators and assemblers; ISCO 9 elementary occupations and ISCO 0 armed forces occupations.
Disclaimer/Publisher’s Note: The statements, opinions and data contained in all publications are solely those of the individual author(s) and contributor(s) and not of MDPI and/or the editor(s). MDPI and/or the editor(s) disclaim responsibility for any injury to people or property resulting from any ideas, methods, instructions or products referred to in the content. |
© 2023 by the author. Licensee MDPI, Basel, Switzerland. This article is an open access article distributed under the terms and conditions of the Creative Commons Attribution (CC BY) license (https://creativecommons.org/licenses/by/4.0/).
Share and Cite
MDPI and ACS Style
Fialová, K. Workers’ Satisfaction during the COVID-19 Pandemic in Central and Eastern Europe. Soc. Sci. 2023, 12, 505. https://doi.org/10.3390/socsci12090505
AMA Style
Fialová K. Workers’ Satisfaction during the COVID-19 Pandemic in Central and Eastern Europe. Social Sciences. 2023; 12(9):505. https://doi.org/10.3390/socsci12090505
Chicago/Turabian StyleFialová, Kamila. 2023. "Workers’ Satisfaction during the COVID-19 Pandemic in Central and Eastern Europe" Social Sciences 12, no. 9: 505. https://doi.org/10.3390/socsci12090505
Note that from the first issue of 2016, this journal uses article numbers instead of page numbers. See further details here.