Effect of Severe Shot Peening on the Very-High Cycle Notch Fatigue of an AW 7075 Alloy
by
 , , ,
, , ,
Michal Jambor
1, 
Libor Trško
2,*,
Jan Klusák
3,
Stanislava Fintová
3,
Daniel Kajánek
2,
František Nový
4 and
Otakar Bokůvka
4 1
CEITEC IPM, Institute of Physics of Materials, Czech Academy of Sciences, Žižkova 513/22, 616 00 Brno, Czech Republic
2
Research Centre of the University of Žilina, University of Žilina, Univerzitná 8215/1, 010 26 Žilina, Slovakia
3
Institute of Physics of Materials, Czech Academy of Sciences, Žižkova 513/22, 616 00 Brno, Czech Republic
4
Department of Materials Engineering, Faculty of Mechanical Engineering, University of Žilina, Univerzitná 8215/1, 010 26 Žilina, Slovakia
*
Author to whom correspondence should be addressed.
Metals 2020, 10(9), 1262; https://doi.org/10.3390/met10091262
Submission received: 24 August 2020
/
Revised: 16 September 2020
/
Accepted: 17 September 2020
/
Published: 18 September 2020
(This article belongs to the Section Metal Failure Analysis)
Abstract
:The severe shot peening process was applied to the notched specimens from an AW 7075 alloy with the aim to improve fatigue endurance in the very-high cycle fatigue region. To reveal the stress state in the notch vicinity, finite element analysis was performed, simulating the conditions of the used 20 kHz ultrasonic fatigue loading. Modified surface characteristics by the severe shot peening process were analyzed in terms of residual stress distribution measured by X-ray diffraction methods and near-surface microstructural observations by scanning electron microscopy. The applied severe shot peening increased the fatigue limit by 11%; however, the positive effect was recorded only for the loading amplitudes corresponding to the fatigue lifetimes in the range 107–109 cycles. At higher loading amplitudes, the fatigue properties tended to decrease, most likely due to accelerated fatigue crack initiation on the surface damage features created by the peening process and also by rapid residual stress relaxation.
1. Introduction
High strength aluminum alloys based on the Al-Zn system are one of the most widely spread materials for the high strength application in the aircraft industry, combining high strength-related properties with sufficient toughness and corrosion resistance. The most serious drawback of these alloys is their low fatigue endurance, which has been reported by many authors [1,2]. The fatigue life is further reduced by the presence of notches in complexly shaped components. In the last decades, numerous methods of strengthening of the surface and subsurface layers were introduced to improve fatigue properties, especially in the high cycle fatigue area [3,4,5,6]. One of the most widely used methods is shot peening, where the treated surface is impacted by shots with high kinetic energy, resulting in the deformation of the surface layer. The positive effect of the shot peening on the fatigue properties has been proved in numerous studies [3,7,8,9,10,11] for various materials. In the shot peening process, several factors are contributing to the final surface properties, which influence the final fatigue life of the treated material [12]. The first and most important factor is considered the residual stresses state. The severe plastic deformation of the surface layer caused by the multiple impacts of the shot peening media introduces compressive residual stresses into the material. The depth and the character of the residual stress profile depend on the applied shot peening process parameters (intensity, coverage, and peening media type). The plastic deformation of the surface layer also causes an increase of dislocation density and, consequently, grain refinement; thus, the deformation strain hardening is the second considered aspect contributing to fatigue life improvement. The last factor is the surface state, which usually acts counter to the previous factors because the shot peening process in most cases decreases the surface quality, which is well known to shorten the fatigue life. The higher intensity of the peening process introduces residual stresses of higher amplitudes and depths, but concurrently, it creates a surface of greater roughness and with the occurrence of numerous discontinuities. As it has been shown by many authors [1,3,7,13,14,15,16], the degradation of the surface state is the main problem, reducing the overall fatigue properties of the shot peened components. The partial removal of the surface layer, with the aim to obtain a smooth surface, can improve the fatigue properties. However, at the same time, part of the deformed layer is removed, reducing the contribution of the strain hardening and the total depth of the induced residual stresses. Moreover, the application of similar treatments is not possible on the real machinery elements with complex shapes. Another approach to increase the surface strengthening effect is the application of so-called severe shot peening, which uses unconventionally high peening intensities and long peening duration to achieve a high level of coverage (in order of a few hundred %). Using such processing parameters can result in high levels of surface strengthening and deep compressive residual stress field, combined with the acceptable level of induced surface damage. However, when too severe peening parameters are used, a boundary can be reached, where the material is not able to accumulate more plastic deformation energy. To relieve the energy, surface micro-cracks are created, and sometimes whole layers of the material start to peel off. This surface damage, commonly known as “overpeening”, obviously causes a rapid drop in fatigue properties. This is the reason why the parameters of the severe shot peening need to be chosen carefully and experimentally optimized in relation to the final fatigue performance [3].
The fatigue properties of the structural materials in the very-high cycle fatigue are now of increased interest, especially in the field of transportation. It is well known that the fatigue strength of the Al alloys decreases continuously with an increasing number of loading cycles (no “fatigue limit” behavior is observed) [17,18]. A complete lack of information and results can be found about the notched very-high cycle fatigue of high strength aluminum alloys. The topic of the effect of shot peening on the fatigue properties in case of the presence of notches with various radii was performed by Bennedetti et al. in the range up to the 108 of loading cycles. In several works [1,11,12,16,19,20,21], authors have shown that the application of the shot peening increases the fatigue strength and reduces the notch influence. In [22], the effect of the shot peening and severe shot peening treatment on smooth and notched fatigue performance of the X70 microalloyed steel was compared. Rotating bending fatigue test (run-out number at 107 cycles) results showed that while identical peening parameters were used to treat the smooth and notched specimens, its influence on fatigue performance was very different. In the case of smooth specimens, the conventional shot peening increased fatigue life by 5% and the severe shot peening by 10%. However, in the case of the notched specimen, the improvement was 20% for the conventional shot peening and 50% for the severe shot peening. The significant difference in the peening effect between the smooth and notched specimens was attributed to the fact that the shot peening can redistribute the steep stress gradient in the notch root.
In the present study, the authors evaluated the very-high cycle fatigue properties of an AW 7075 aluminum alloy after a severe shot peening application on U-notched specimens. The fatigue tests were performed using the ultrasonic fatigue testing device, at symmetrical tension-compression loading (R = −1). The design and the stress state of notched specimens were critically revised using finite element (FE) analysis. To support the obtained results, the surface state and the residual stresses distribution in the shot peened and not peened specimens were evaluated. The results were then interpreted with the light of the surface condition and the residual stress depth profile.
2. Experimental Material and Methodology
2.1. Material and Specimens
As the experimental material, the high strength AW 7075 aluminum alloy was used. This alloy was chosen due to the numerous and extensive researches in the field of the high cycle fatigue already performed, so it was possible to compare the gained results and supplement this field with new findings. The material was delivered in the form of hot-extruded bars with a diameter of Ø 15 mm. The nominal chemical composition is shown in Table 1. The material was delivered in the T6511 state, implying solution annealing at 482 °C for 2 h, followed by water quenching and artificial aging at 130 °C for 24 h. After heat treatment, the material was stretched to relieve residual stresses introduced by the applied heat treatment [23]. The basic mechanical properties, according to [7], are shown in Table 2.
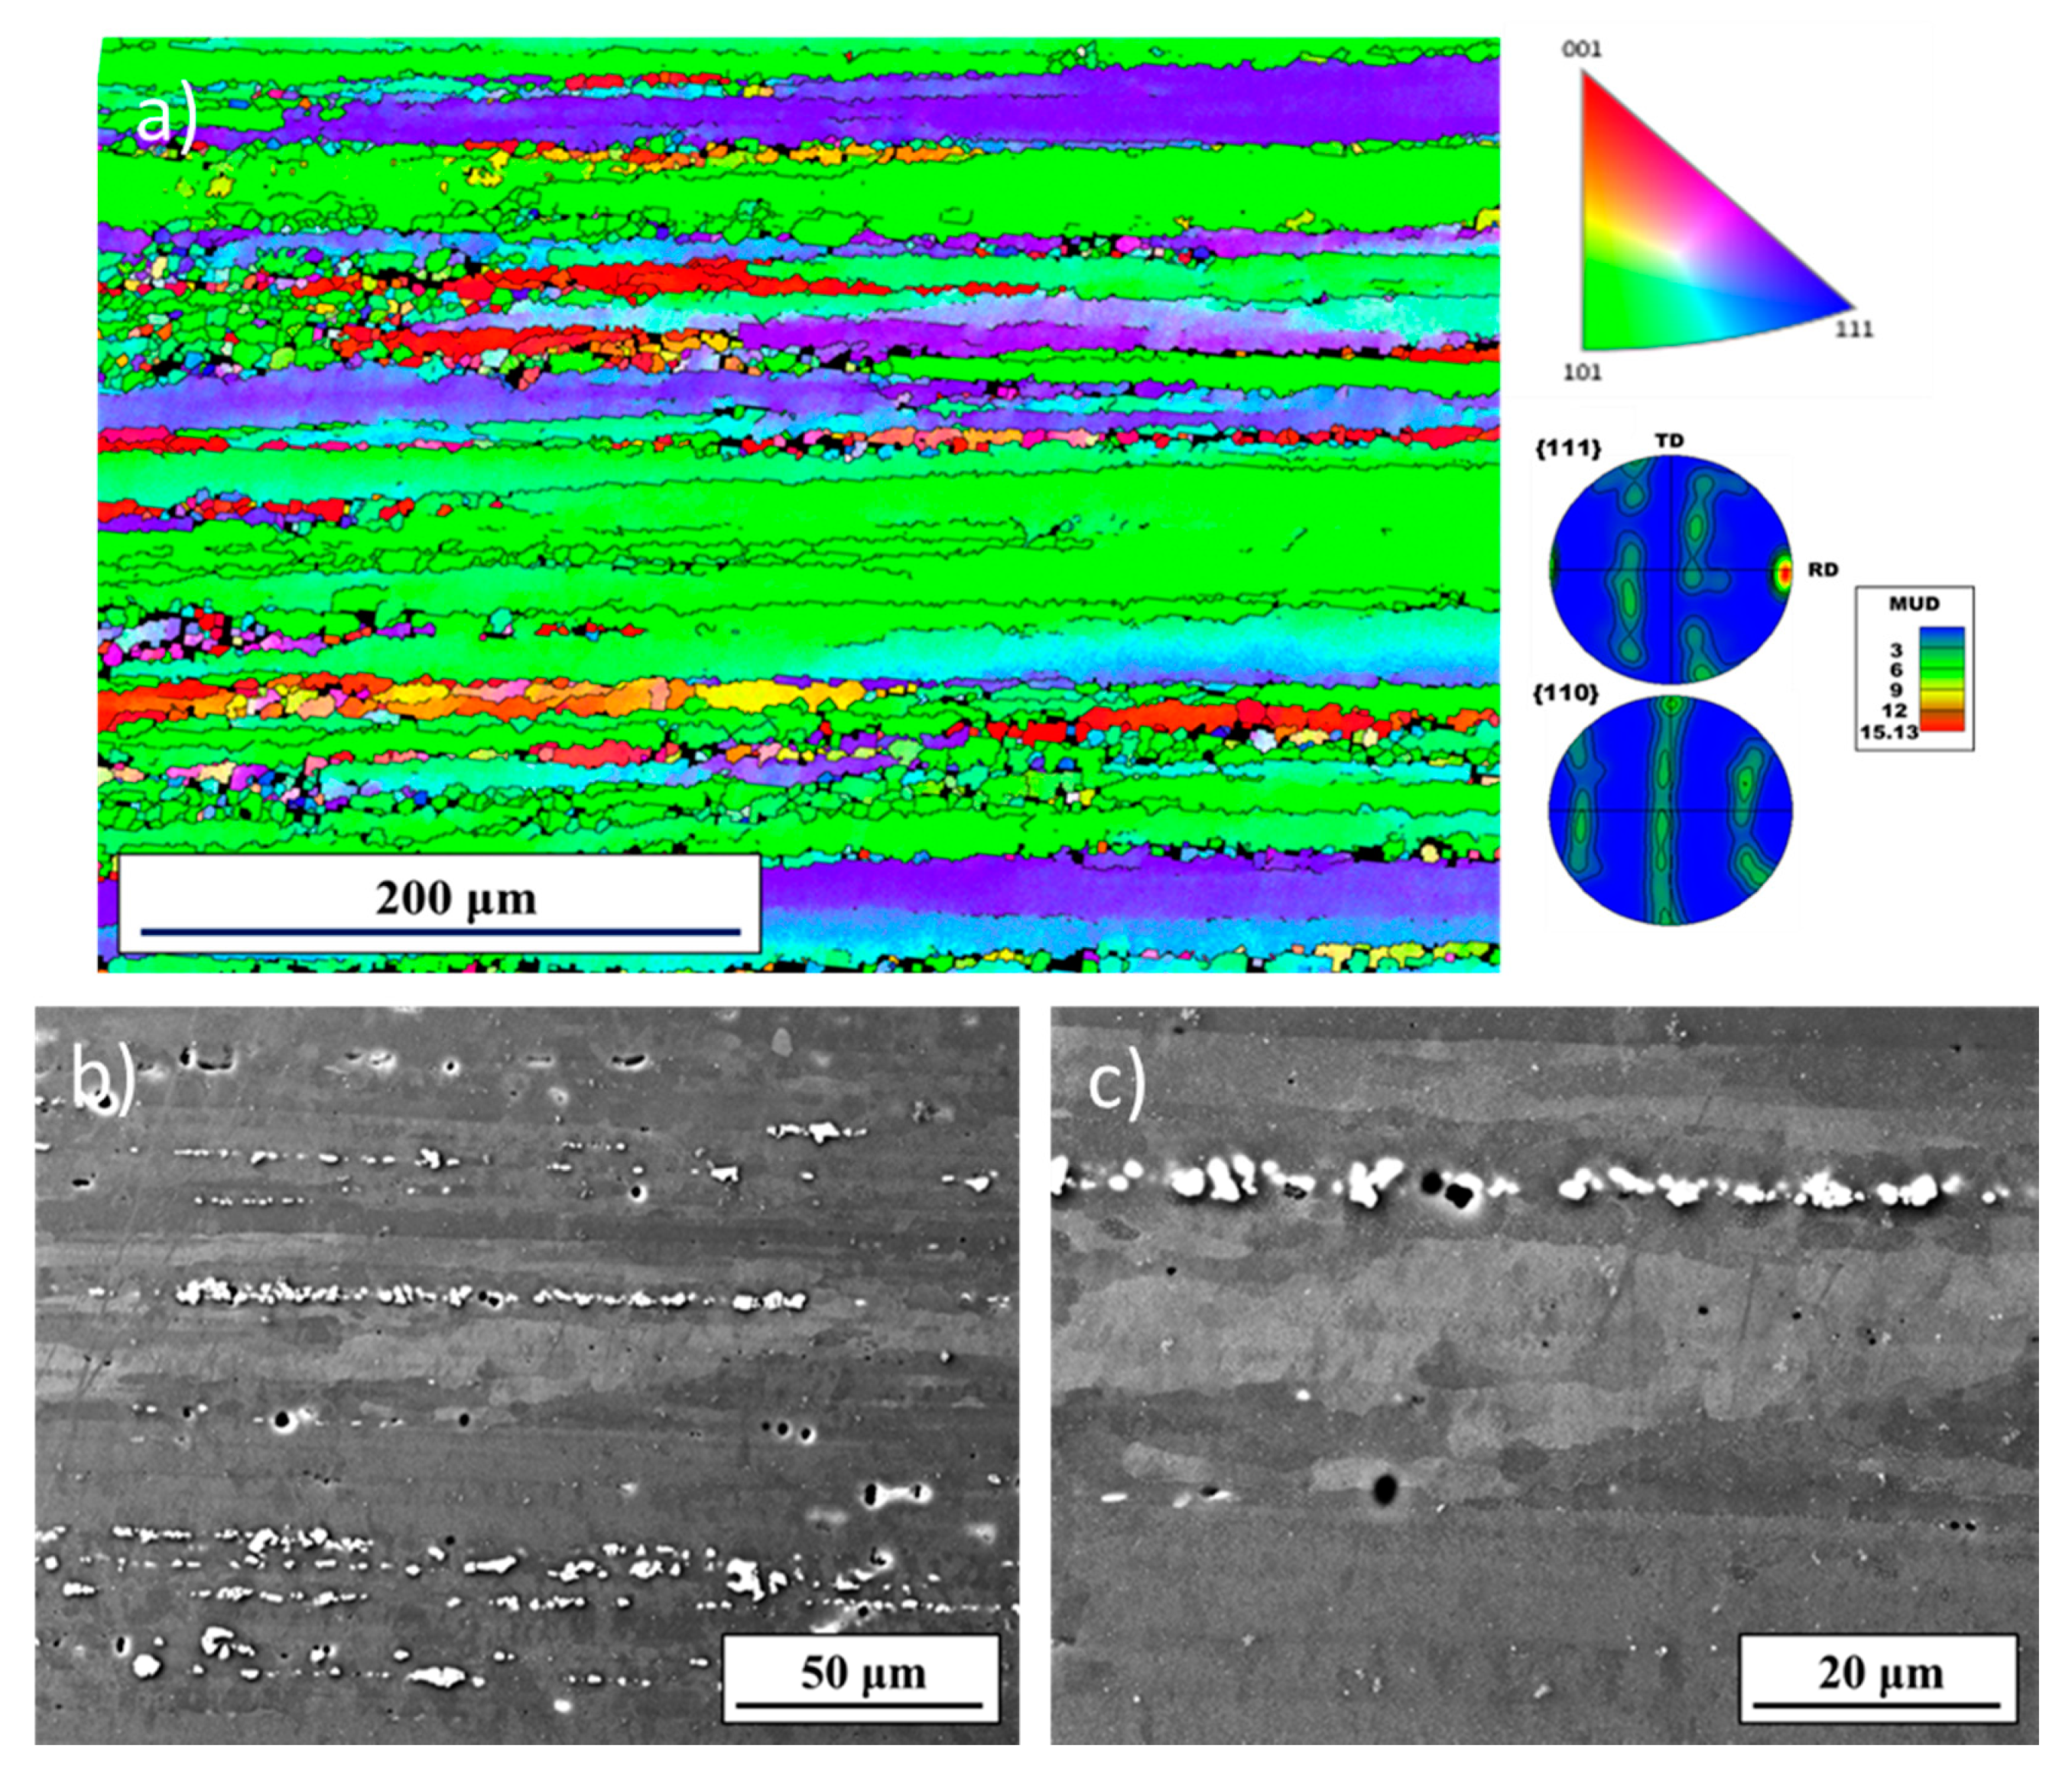
The microstructure of the experimental material was examined using the scanning electron microscopy (SEM): the electron backscatter diffraction method (EBSD) and electron channeling contrast imaging (ECCI). Specimens for the microstructural observation were mechanically ground and polished using diamond suspensions up to the size of 1 μm. In the final step, specimens were polished using colloidal silica. The partially recrystallized microstructure of the experimental material is shown in Figure 1. It consists of the long, partially recrystallized grains, elongated in the extrusion direction, and small intermetallic phases. The material exhibited significant fiber texture, typical for the extruded high strength aluminum alloys [24]. ECCI images revealed developed sub-grain microstructure within the elongated grains. The presence of intermetallic particles was recorded at the grain boundaries and also inside the grains. These particles were aligned in the bands, parallel with the extrusion direction. Based on the literature data, these phases are most likely AlxCuFey, MgZn2, and AlxFeySi types [24,25]. The AW 7075 alloy in T6511 state is mostly strengthened by the coherent η’ particles [26,27,28]. As in this study, no additional heat treatments were applied, and no more attention was paid to the study and characterization of the strengthening particles.
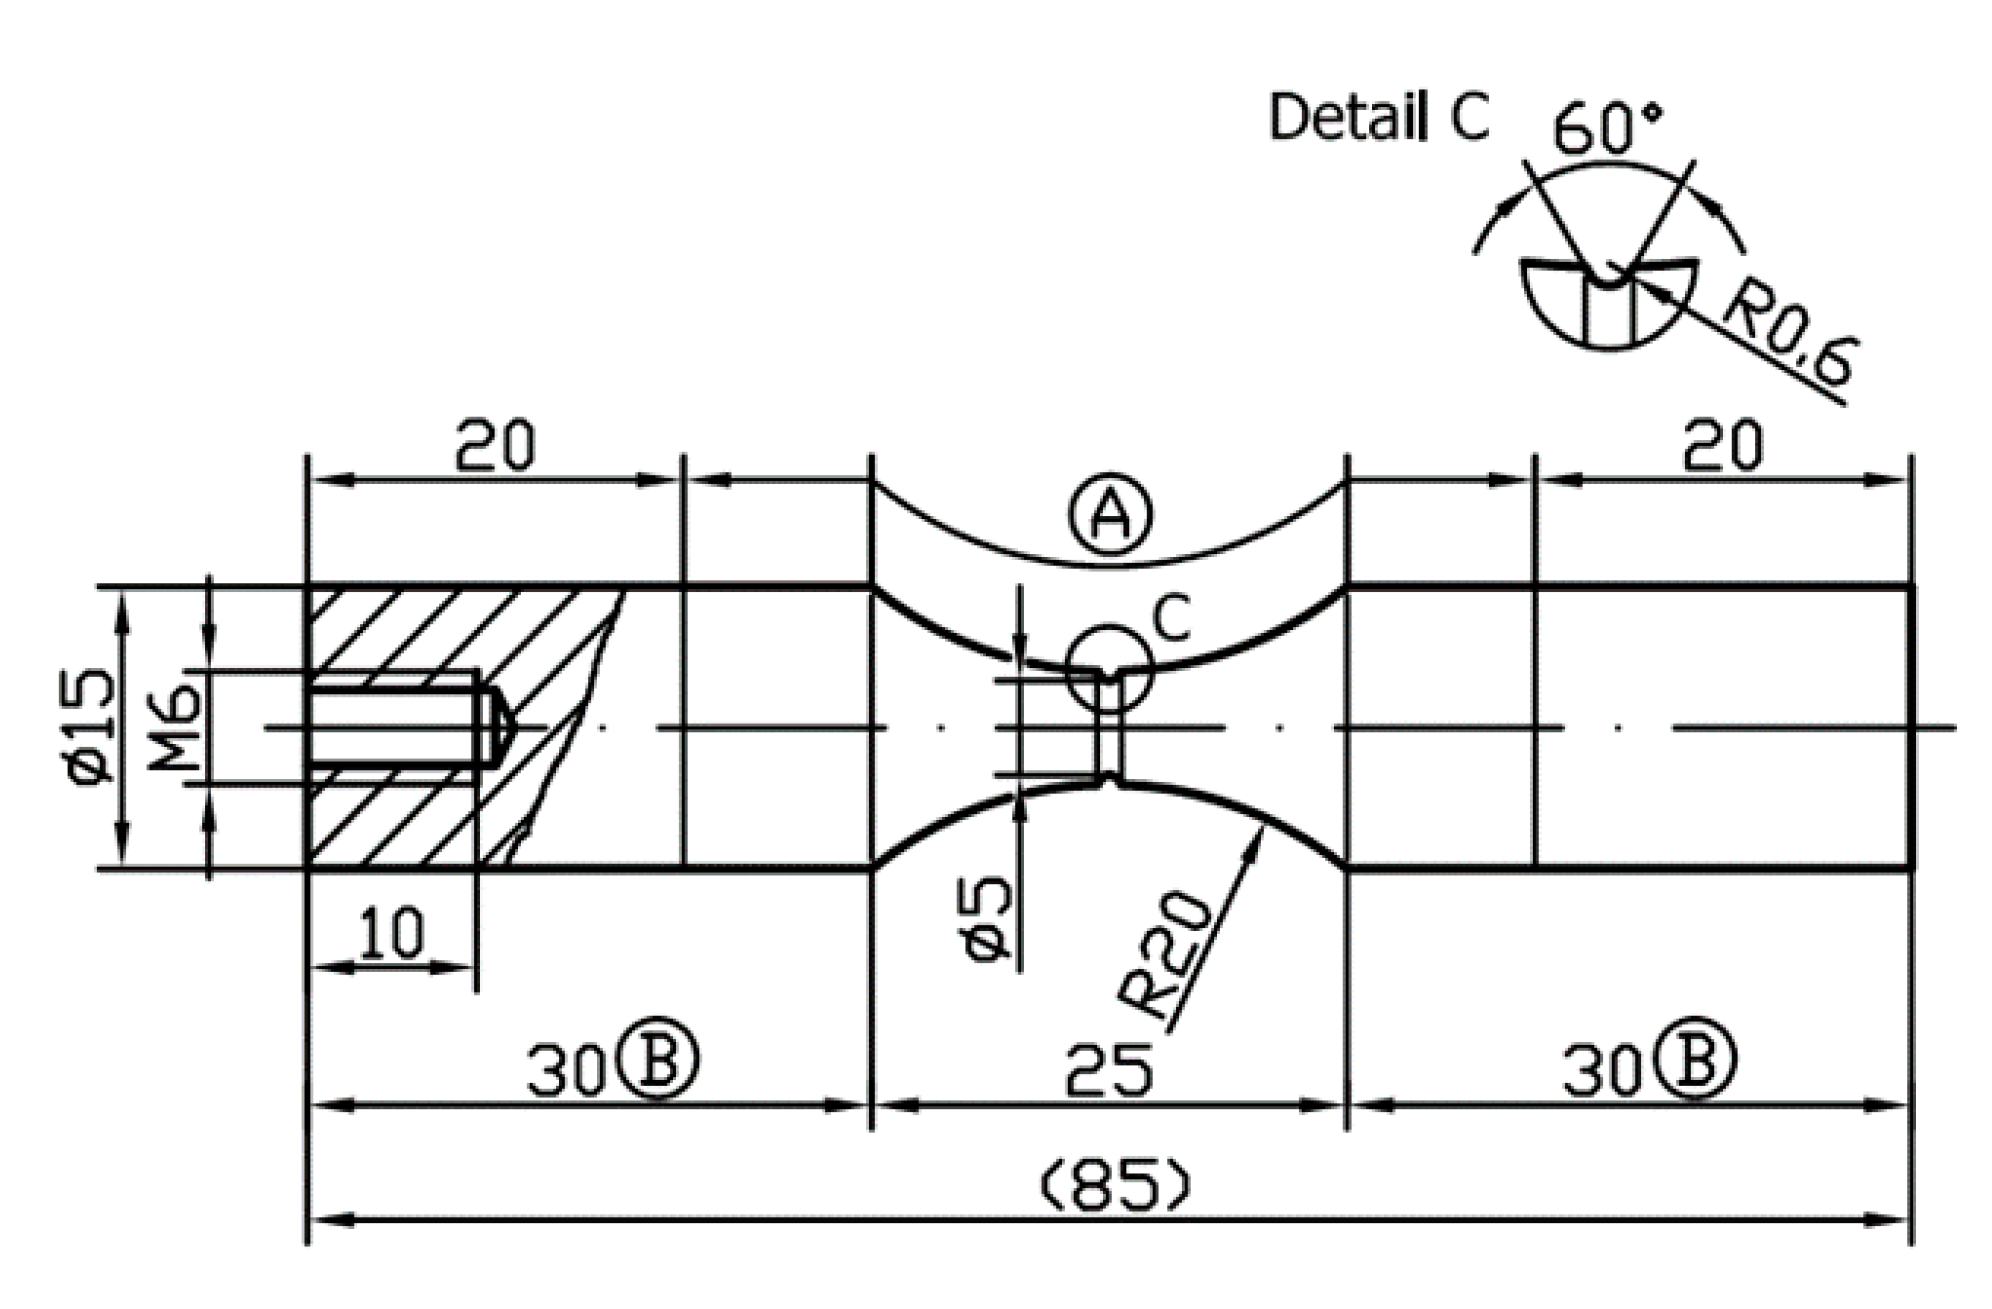
Specimens of the “hourglass” shape (Figure 2) were used for the fatigue tests. Their dimensions were calculated to fulfill the resonance conditions of the fatigue testing system. More information about designing of the specimens for the ultrasonic fatigue testing can be found in [29]. In the middle of the gauge length of the specimens, a U notch with a 0.6 mm tip radius was machined, with the use of a machining tool with a negative shape. This means that during machining of the notch, the only transversal feed was used.
2.2. Surface Treatment
The used surface treatment was severe shot peening with parameters chosen according to works [3,7], where optimization for the best fatigue performance of smooth specimens was performed. The gauge lengths of the specimens were severely shot peened with the following parameters: Almen intensity 9.6 N, coverage 650%. Ceramic beads CEZ 100 were used for the treatment, and they were shot at the incidence angle close to 90° with respect to the specimen axis. During the severe shot peening process, specimens were rotated at the constant speed of 180 rpm to ensure homogeneous coverage around the whole gauge length.
The effect of the severe shot peening on the surface layer character was analyzed by SEM (Tescan LYRA 3, Tescan, Brno, Czech Republic), and the residual stress state was evaluated by the X-ray diffraction measurements . The Proto iXRD device (PROTO Manufacturing Ltd., Oldcastle, ON, Canada) was used for the measurements, using the Cr Kα radiation with an irradiated area of 0.5 mm2. The diffraction signal from {222}α planes was collected at 2θ = 156.9°. The measurements were carried out using the sin2ψ method, with nine inclinations between ±39°. The measurements were carried out in axial (ϕ = 0°) and tangential (ϕ = 90°) directions. To obtain the depth profile of the residual stress distribution, the surface was gradually removed by electrolytic polishing.
2.3. Fatigue Life Analysis
The fatigue testing was carried out using an ultrasonic fatigue testing system (Lasur Sarl, France) operating at the loading frequency close to 20 kHz. The specimens were subjected to the symmetrical tension-compression loading (R = −1). The setup of the ultrasonic fatigue testing device is described in more detail in works [3,7,29,30]. This loading type was considered as one of the most damaging because, during the compression part of the cycle, the superposition of the compression residual stresses with the compression part of the loading cycle can overrun local compression yield strength, resulting in the micro-plastic deformation, relieving the residual stresses. The specimens were loaded at stress levels corresponding to the fatigue lifetimes in the range from 106 to 109 cycles. After reaching 109 cycles without fracture, the tests were terminated. During the tests, the specimens were cooled by the stream of dry air.
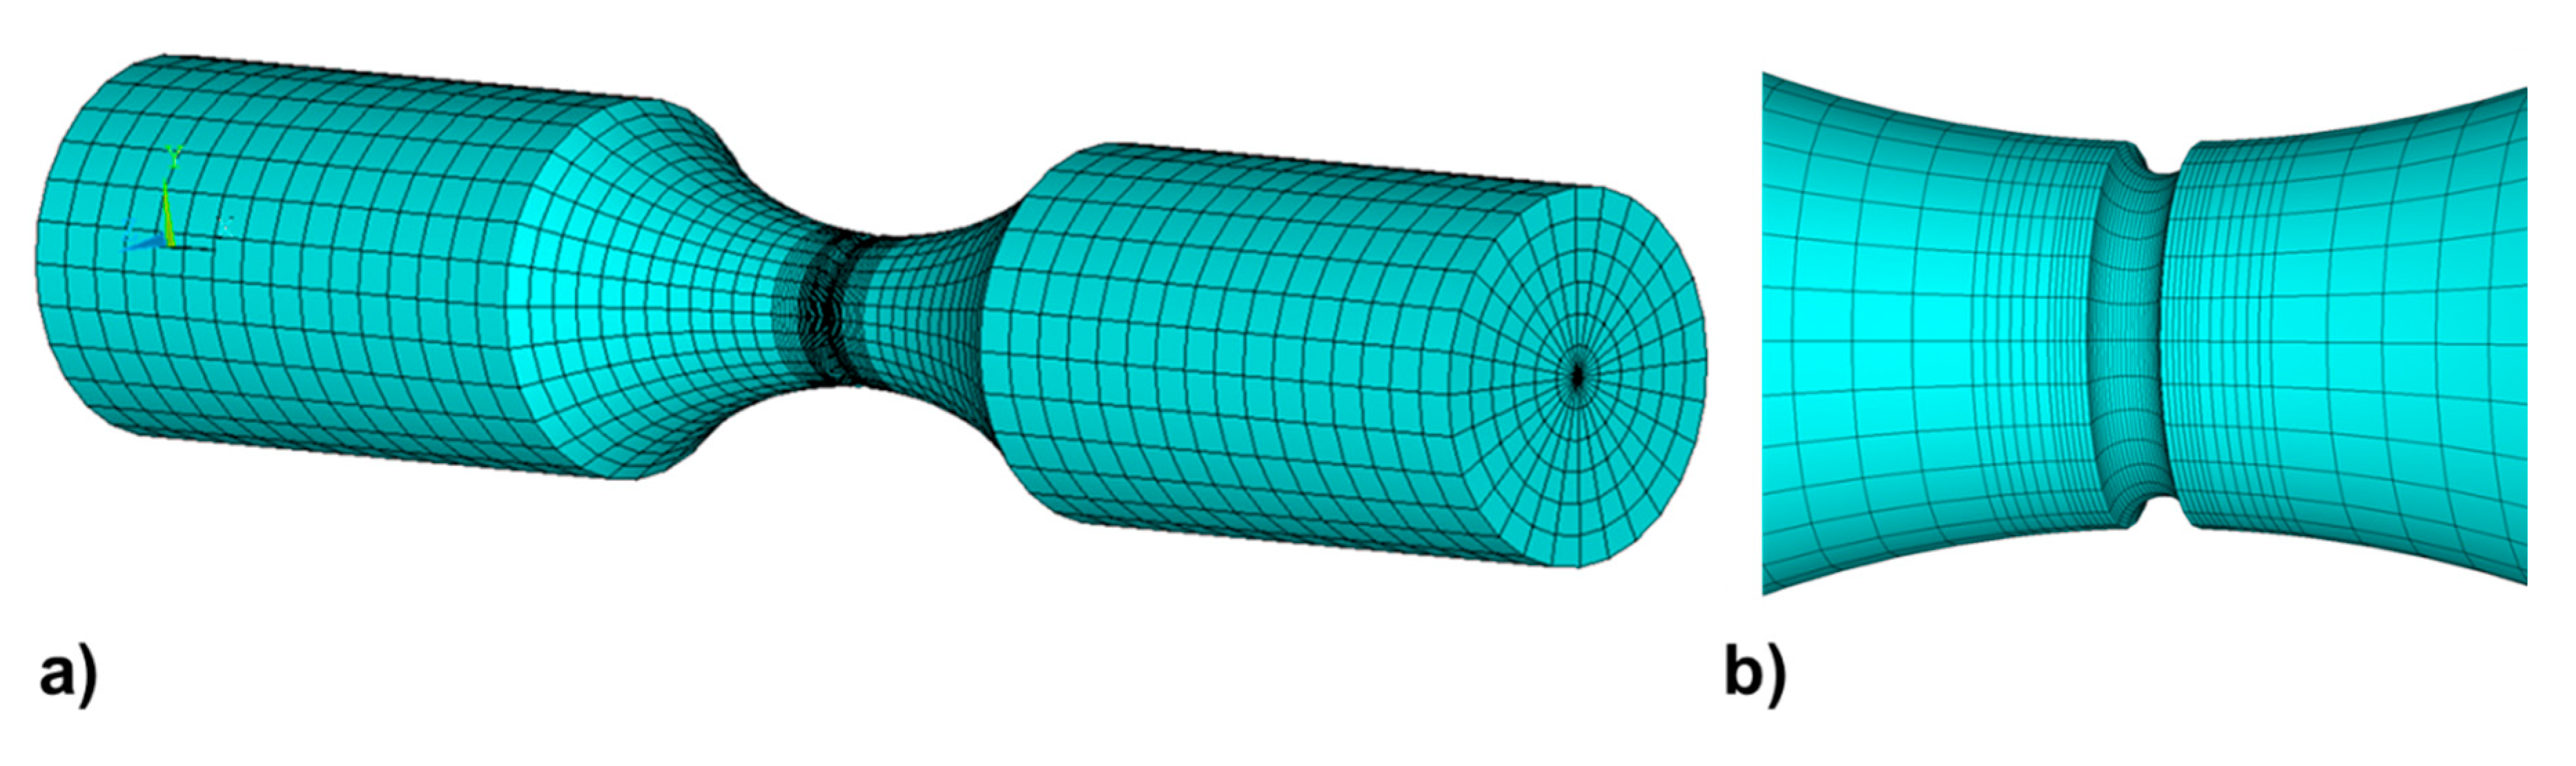
As the fatigue tests carried out on the ultrasonic fatigue testing device were performed in the strain control regime, the actual stress level in the gauge length had to be calculated. For the calculation of the stress level in the conventional (smooth) specimens used for ultrasonic fatigue testing, an analytical solution by Bathias [31] was already developed and is well accepted among other researchers. In the case of the notched specimens, the actual distribution of the stress in the notch vicinity had to be treated using finite element (FE) simulation. The calculations were performed in the ANSYS system (ANSYS, Inc., Canonsburg, PA, USA). The 3D model of the specimen was meshed by the 20-nodes elements SOLID 186. In the regions of the stress concentration, the mesh was refined in order to describe the stress distribution more precisely (see Figure 3). The basic input parameters to the calculations were the dynamic modulus of elasticity Ed = 71.7 GPa, Poisson’s ratio ν = 0.33, and mass density ρ = 2800 kg/m3. The 3D model was prepared for modal and harmonic analysis. Modal analysis was used in order to design the specimen so that its intrinsic frequency of longitudinal vibrations is as close as possible to 20 kHz. The 3D model was important, especially in this step (modal analysis), because it allowed revealing other spatial shapes (not only the longitudinal one) and frequencies of intrinsic vibrations. It was necessary to ensure that other intrinsic vibration modes had their frequencies outside the interval 19.5–20.5 kHz. In the harmonic analysis, cyclic displacement with the amplitude of 20 μm and with the intrinsic frequency 19,995 Hz was applied at one of the ends of the specimen. Note that the actual intrinsic frequency was calculated in the modal analysis. The full method of the harmonic analysis was chosen.
3. Results
3.1. Stress Analysis in the Notch
Harmonic analysis at the intrinsic frequency fn = 19,995 Hz (calculated within the modal analysis) was performed to describe stress concentration in the notch vicinity. Firstly, the basic approximation of the stress concentration at the notch was performed by the equivalent ellipse concept introduced by Murakami [32]. The equivalent ellipse concept estimates the stress concentration factor Kt in the form of the following equation:
where t is the depth of the notch, and r is the radius in the notch root. For our specimen, t = 0.5 mm and r = 0.6 mm. The stress concentration factor calculated according to the equivalent ellipse concept is Kt = 3.2.
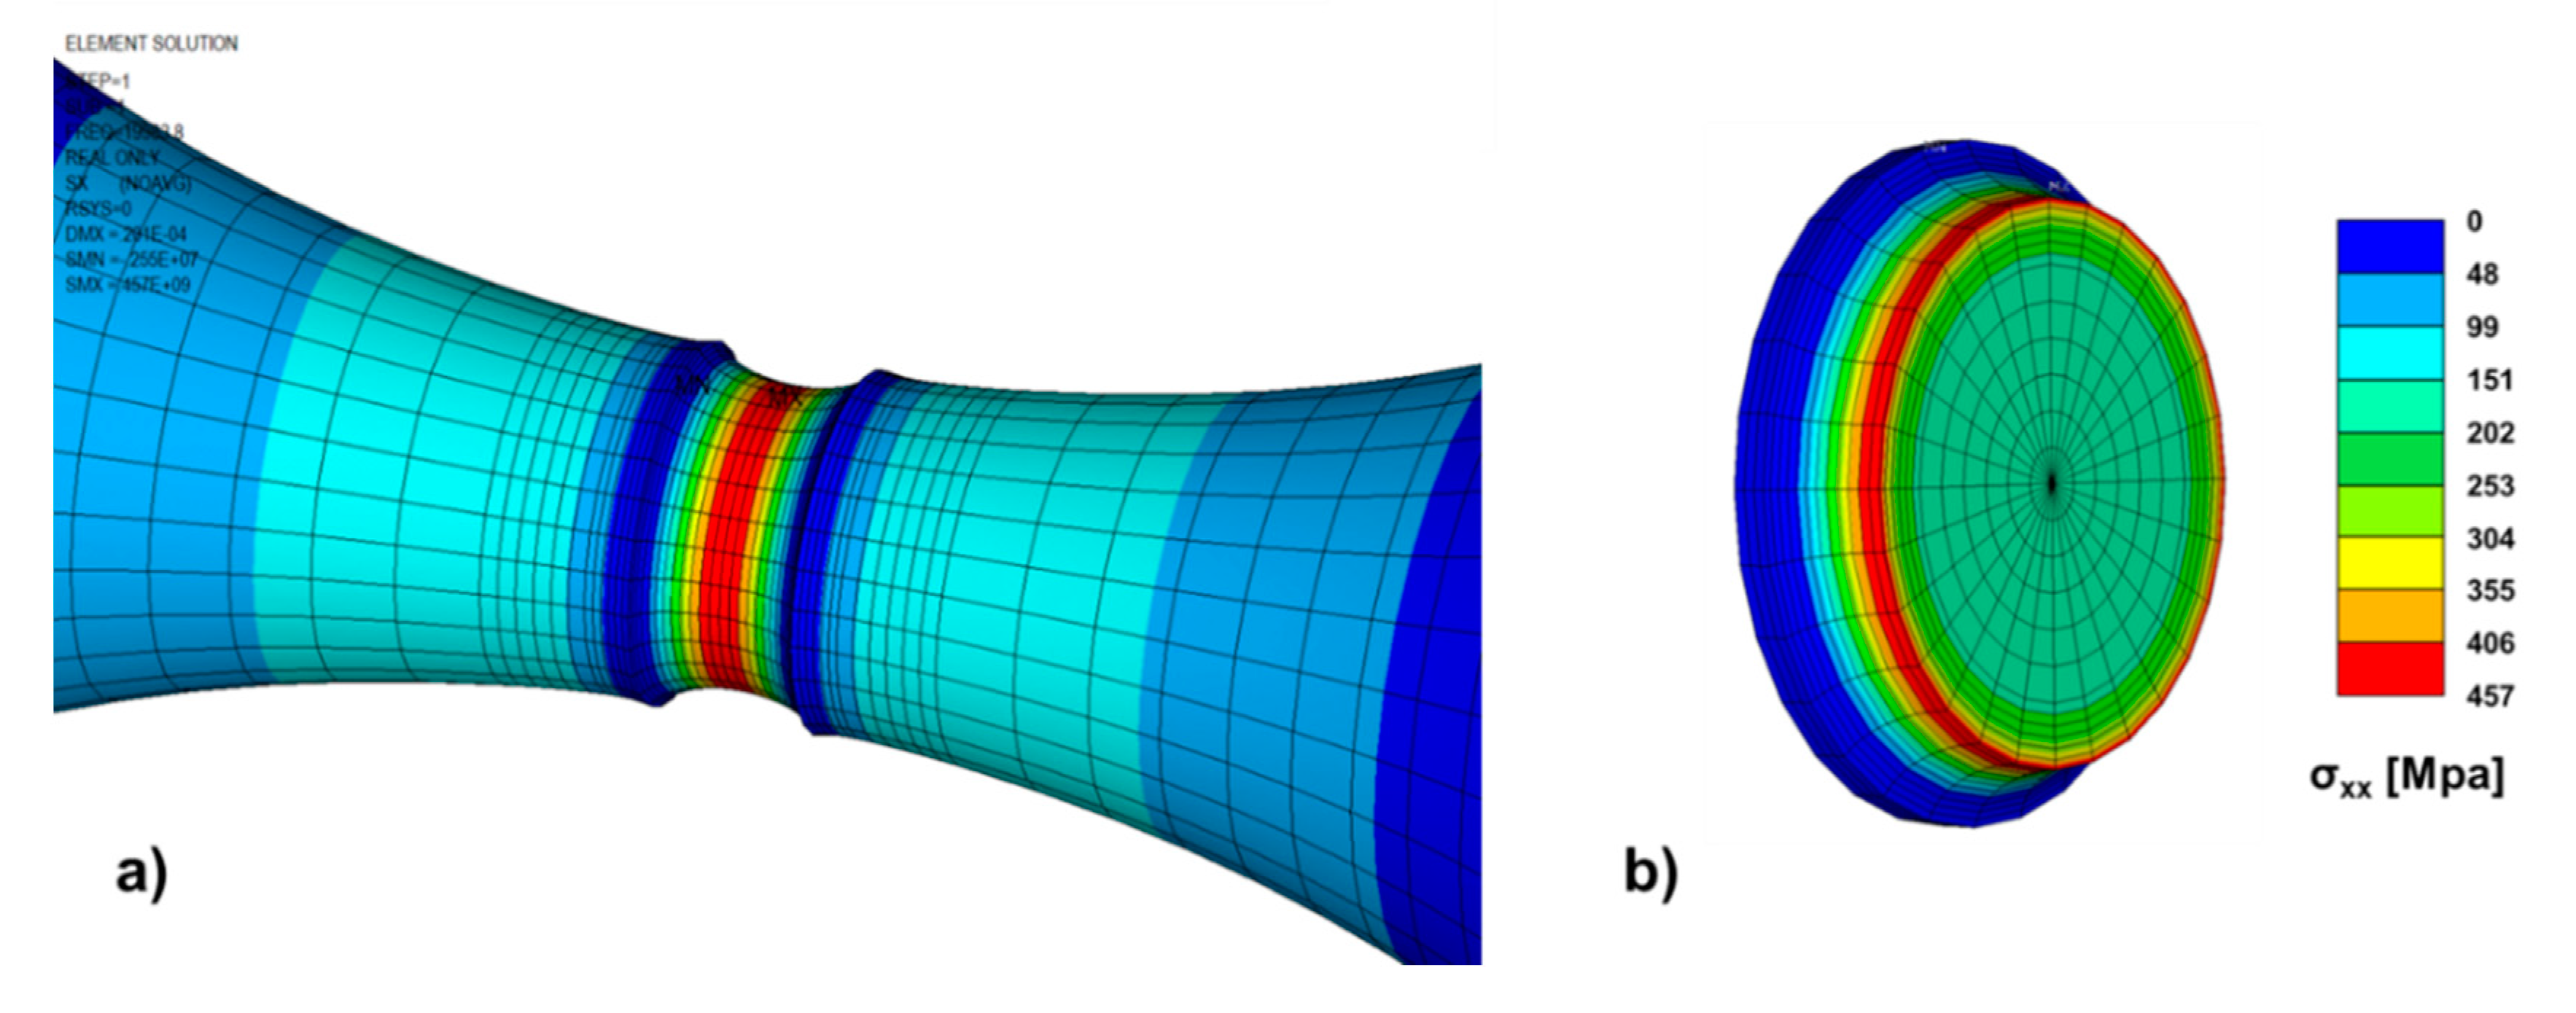
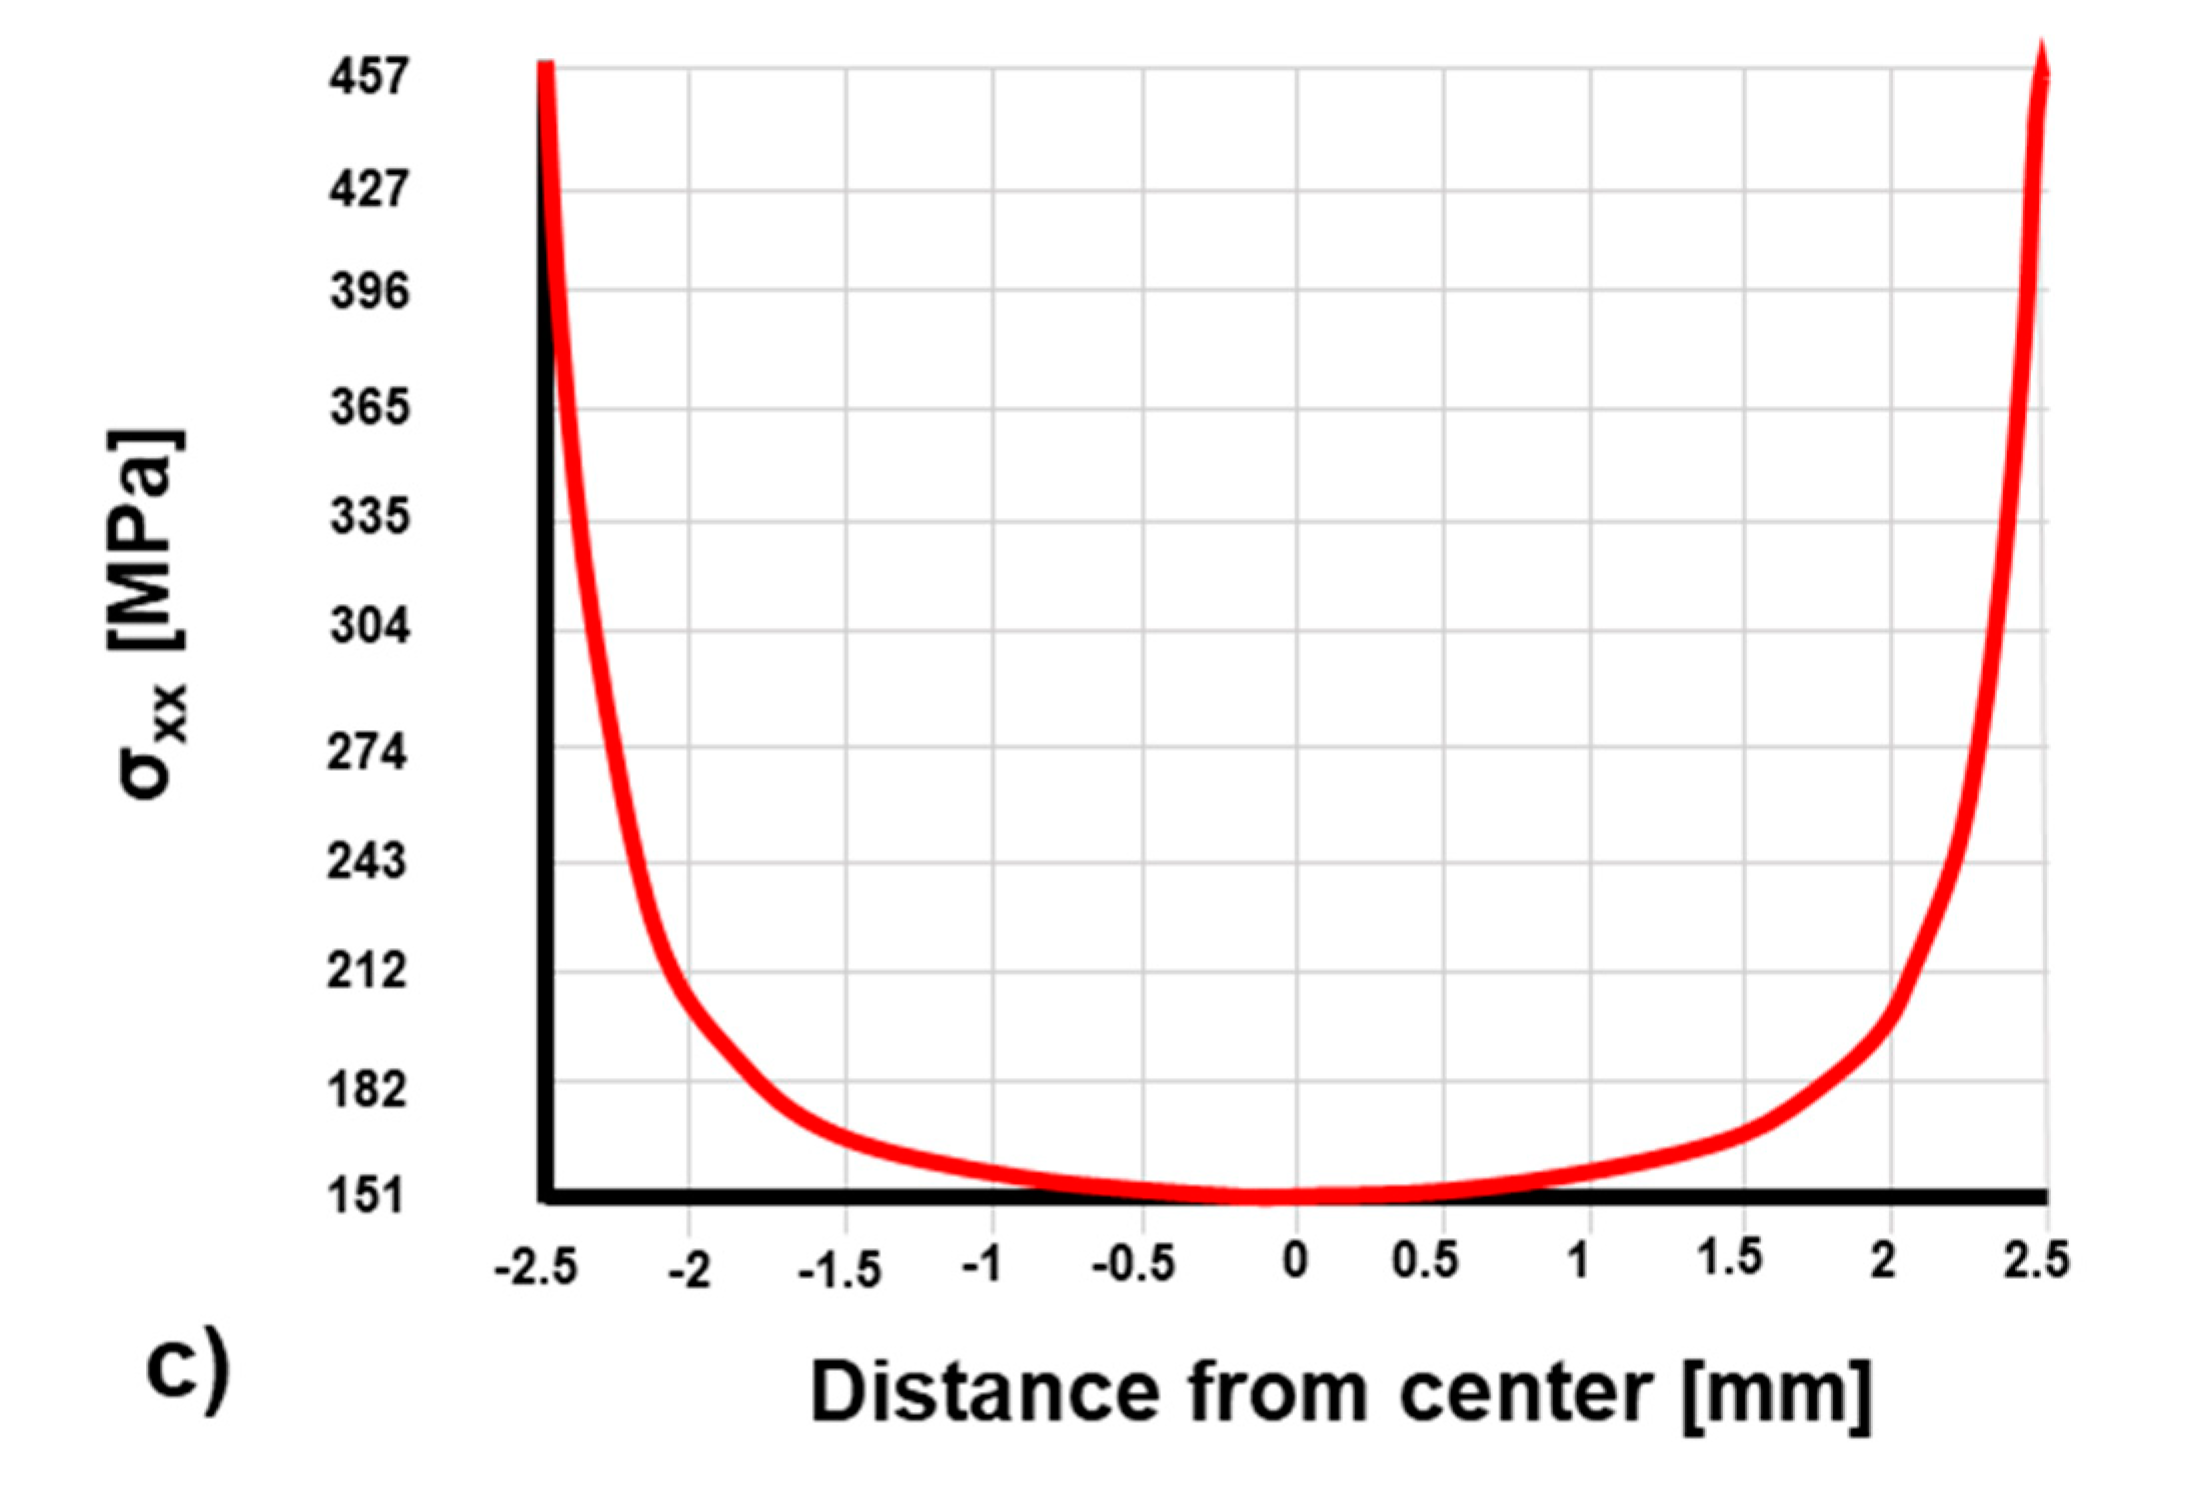
The FE analysis enables us to describe the stress concentration more precisely and in detail. The results ascertained for the harmonic longitudinal tension-compression vibrations with the amplitude of vibrations A = 20 μm of the σxx stress component (direction of the specimen’s axis) are shown in Figure 4. In Figure 4a, the stress concentration in the gauge length of the specimen is apparent. Detail of the stress concentration in the notch is shown in the section in Figure 4b—the highest stress is in the notch root, as expected. The stress distribution across the diameter in the middle of the specimen is shown in Figure 4c. The figure shows that the highest σxx stress in the notch root is 457.32 MPa (for the displacement amplitude of 20 μm). The stress factor Sf expresses the level of stress σxx in the central part of the specimen caused by the displacement amplitude of 1 μm. This means that the maximum stress factor is Sf(max) = 22.866 MPa/μm. The average stress across the diameter is calculated according to equation (2):
The result of the calculation is σxx(avg) = 186.308 MPa (again for the displacement amplitude of 20 μm). Consequently, the average stress factor is Sf(avg) = 9.315 MPa/μm. Finally, the stress concentration factor following from FE analysis is: Kt = σxx(max)/σxx(avg) = 2.455.
When comparing the factors of stress concentration following from analytical solution (Kt = 3.2) and from FE analysis (Kt = 2.455), it is obvious that the analytical solution is more conservative and predicts higher stresses in the notch root. For determination of the stress level in the tested specimens, the stress factor Sf(avg) = 9.315 MPa/μm was used. The Sf(avg) multiplied by the amplitude of loading displacement corresponds to the nominal stress in the cross-section, where failure occurs. In this study, the nominal stress was used, so it is comparable with other works where smooth specimens were tested.
3.2. Effect of Shot Peening on the Surface State
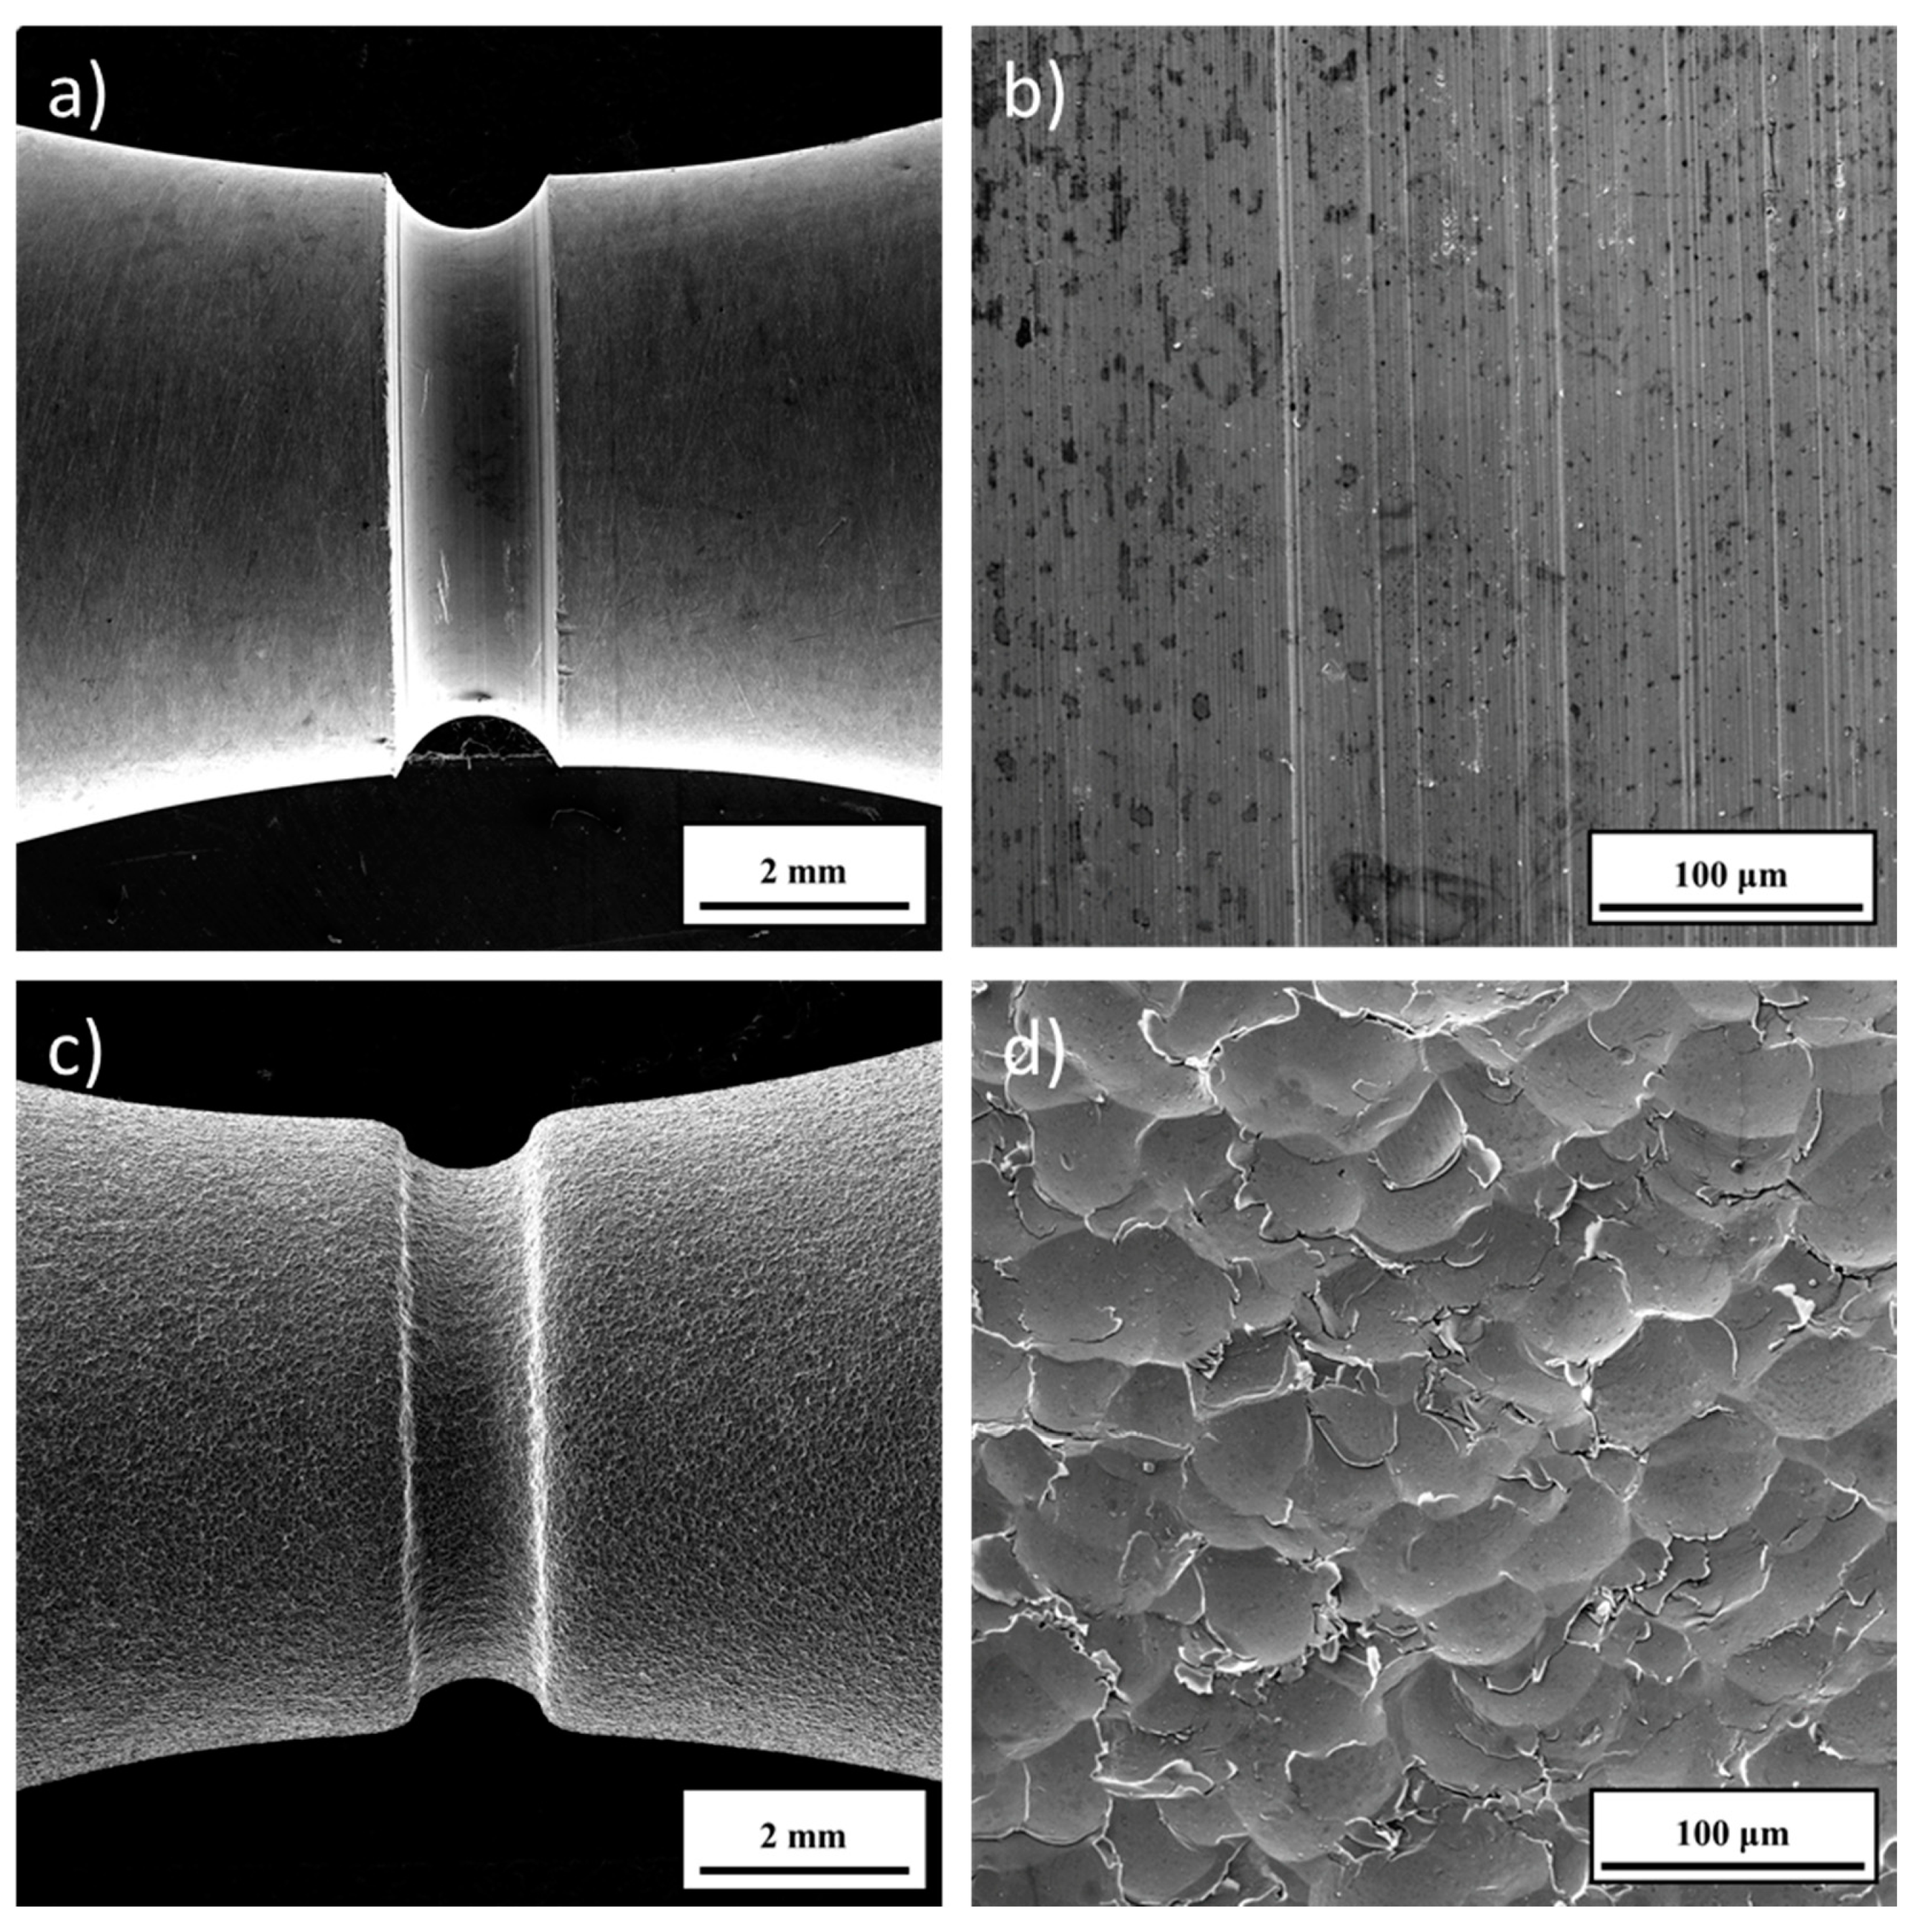
The surface state of the fatigue specimens was examined in terms of three critical factors related to the shot peening process, which are affecting the resulting fatigue properties—surface state, strain hardening, and the residual stresses. The micrographs comparing the surface state of the notched specimens after machining and shot peening are shown in Figure 5. The surface of the not peened (NP) specimens has a smooth character, but the detailed view of the notch root (Figure 5b) reveals the presence of the traces perpendicular to the loading axis, caused by the machining process. Due to their orientation, it can be assumed that they act as preferential crack initiation locations. The surface of the specimens after the severe shot peening (SSP) is shown in Figure 5c,d. After the severe shot peening process, uniform deformation of the surface is achieved, as can be seen from the detailed view of the notch root in Figure 5d.
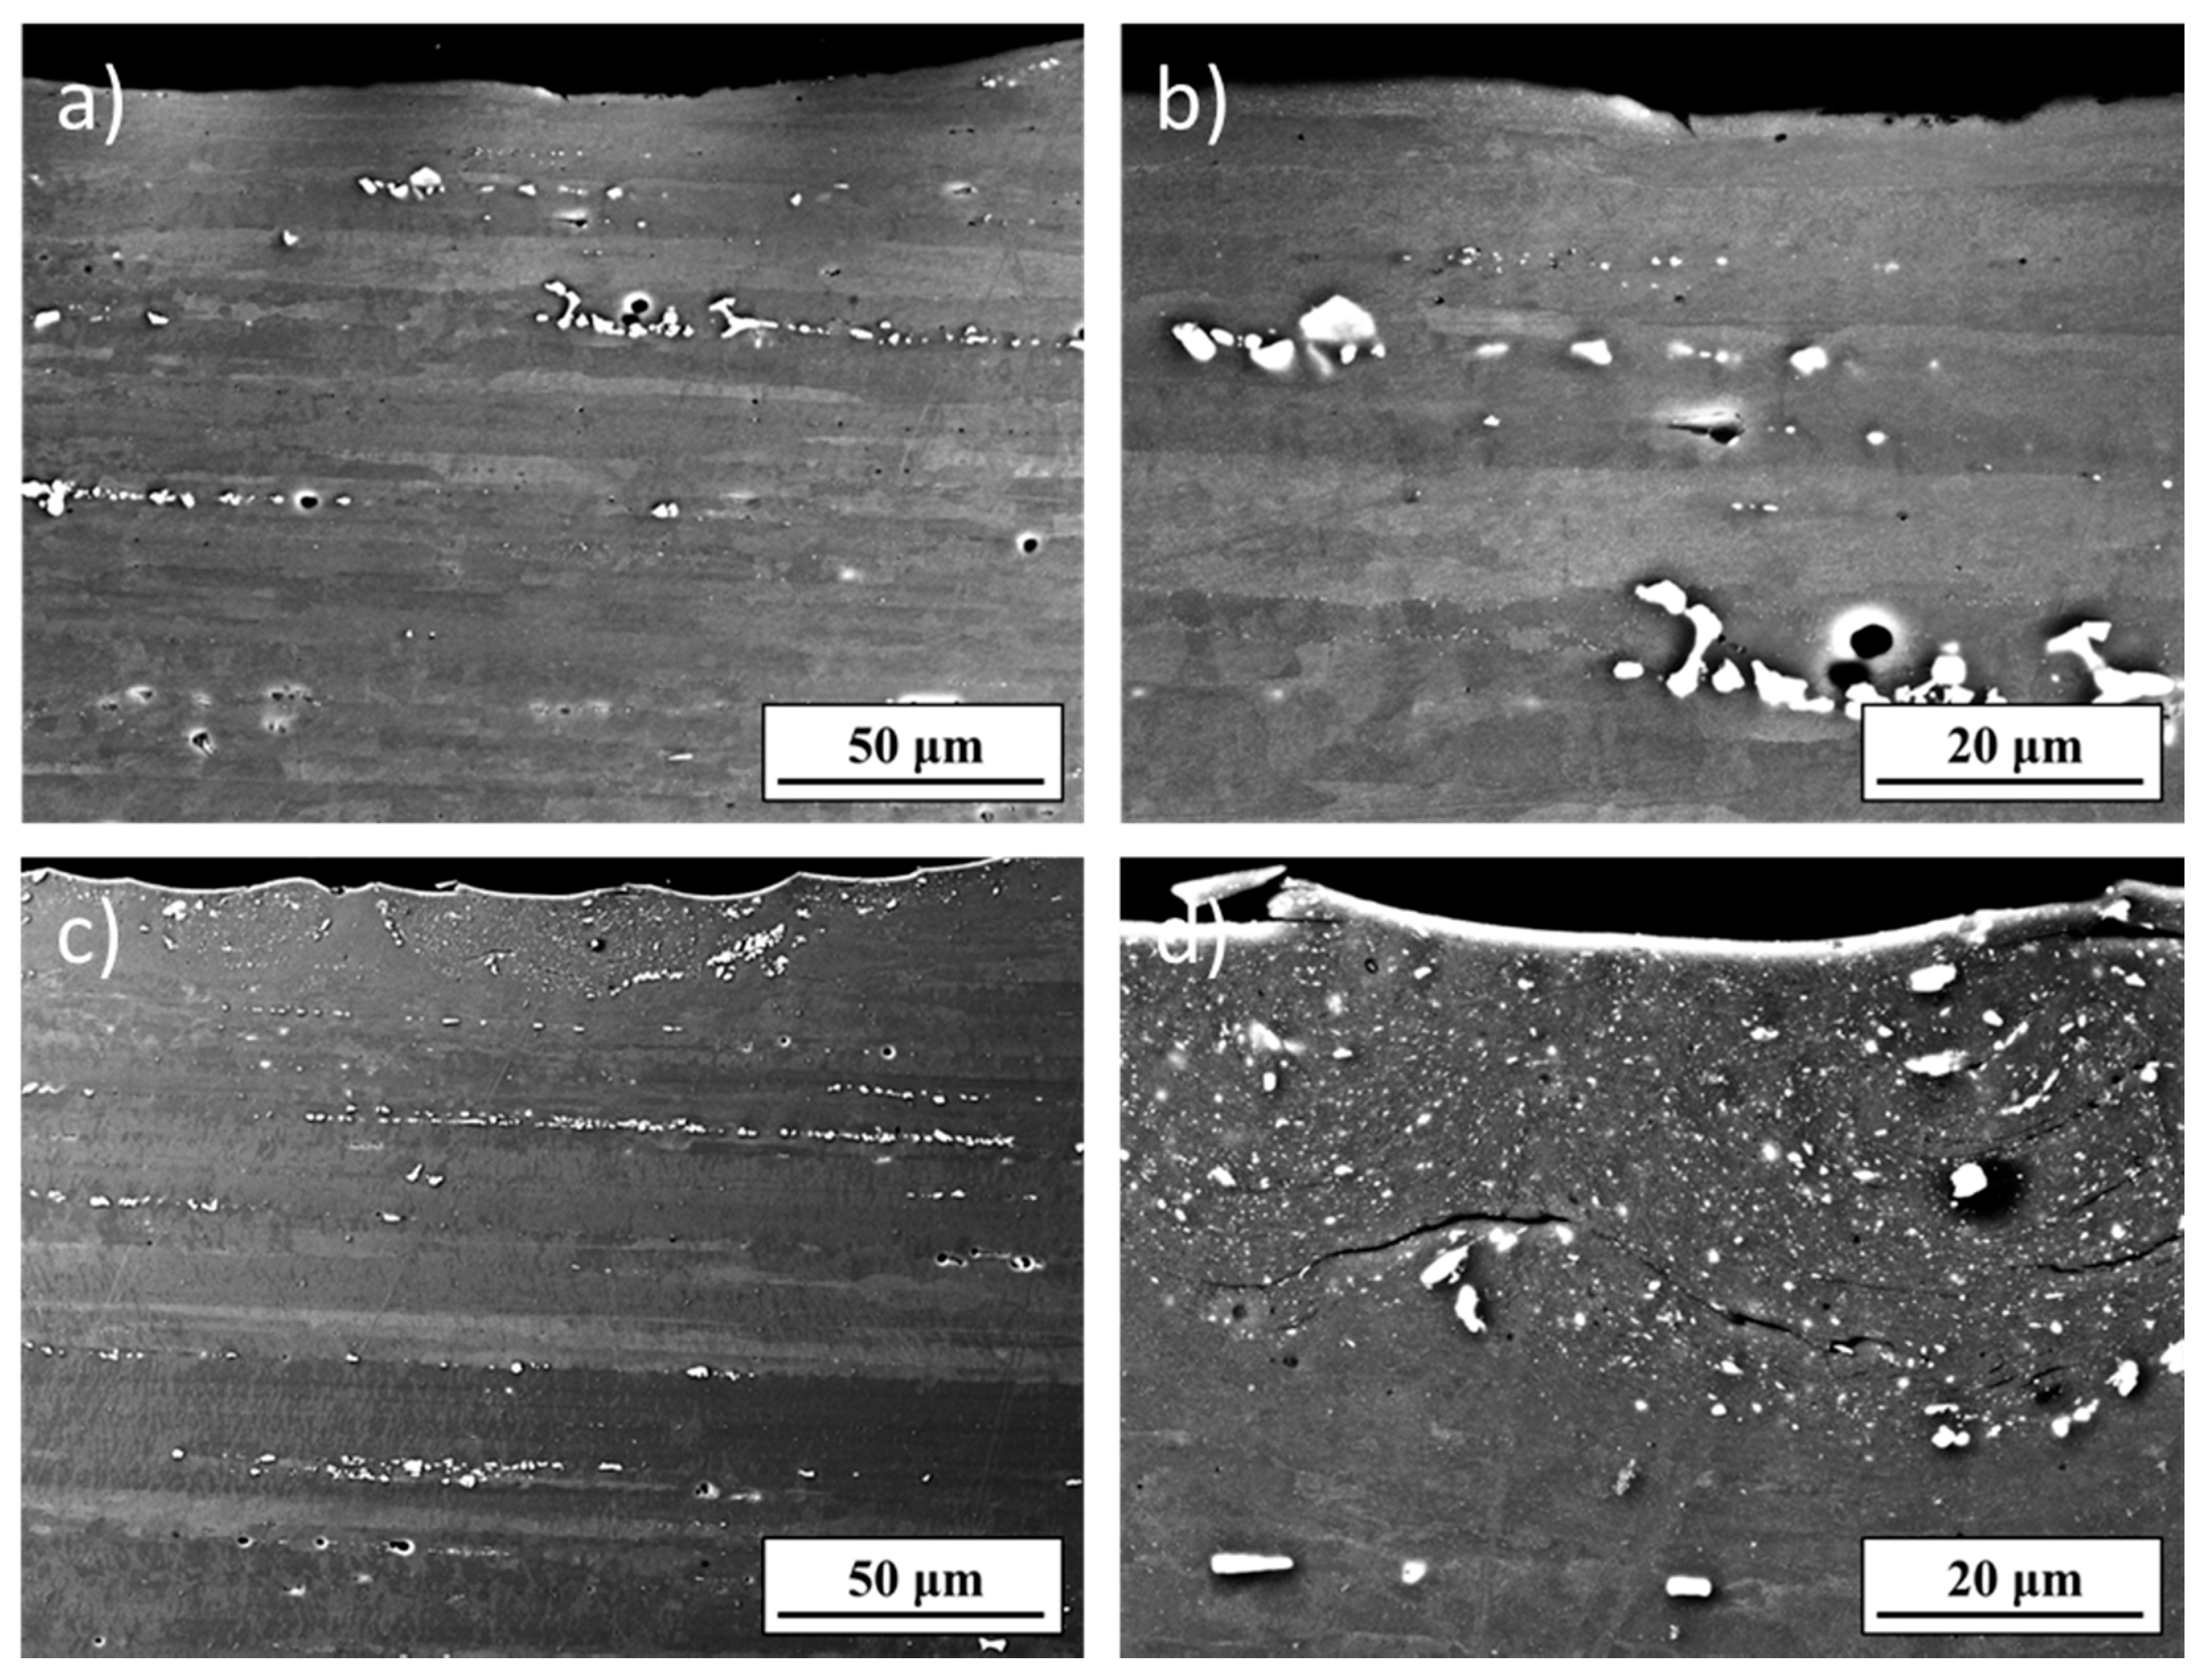
The degree of the strain hardening of the surface layer was examined using SEM and the ECCI technique. Figure 6 shows a comparison of the microstructure in the vicinity of the notch root on the NP and SSP specimens. In the case of the NP specimen, a shallow deformed layer with the maximal thickness of several μm can be seen. This layer is formed due to the machining process, and the level of the deformation is not severe. NP specimen exhibits quite a smooth surface, with occasional occurrence of shallow discontinuities. Significant changes are observed in the specimens after the SSP process (Figure 6c,d). Based on the level of the deformation and on the approximate grain size, the strengthened layer can be divided into two sub-layers. In the near-surface region, a severely deformed layer up to the depth of approximately 20–30 μm is observed, within which the grains are refined below 1 μm. With increasing depth, the degree of grain refinement is decreasing, and in the range of 30–45 μm under the surface, the area with modest grain refinement is observed. In the depths of 50 μm and more, the microstructure is visually unchanged, but it can be assumed that at least a small increase of the dislocation density in this area is created. The surface of the SSP specimens contains shallow discontinuities in higher occurrence than in the case of the NP specimens. A large number of small cracks in the heavily deformed layer were also recorded. These are most likely formed on the grain boundaries of the former elongated grains. Their presence was recorded also in the unbroken (run-out) specimens .
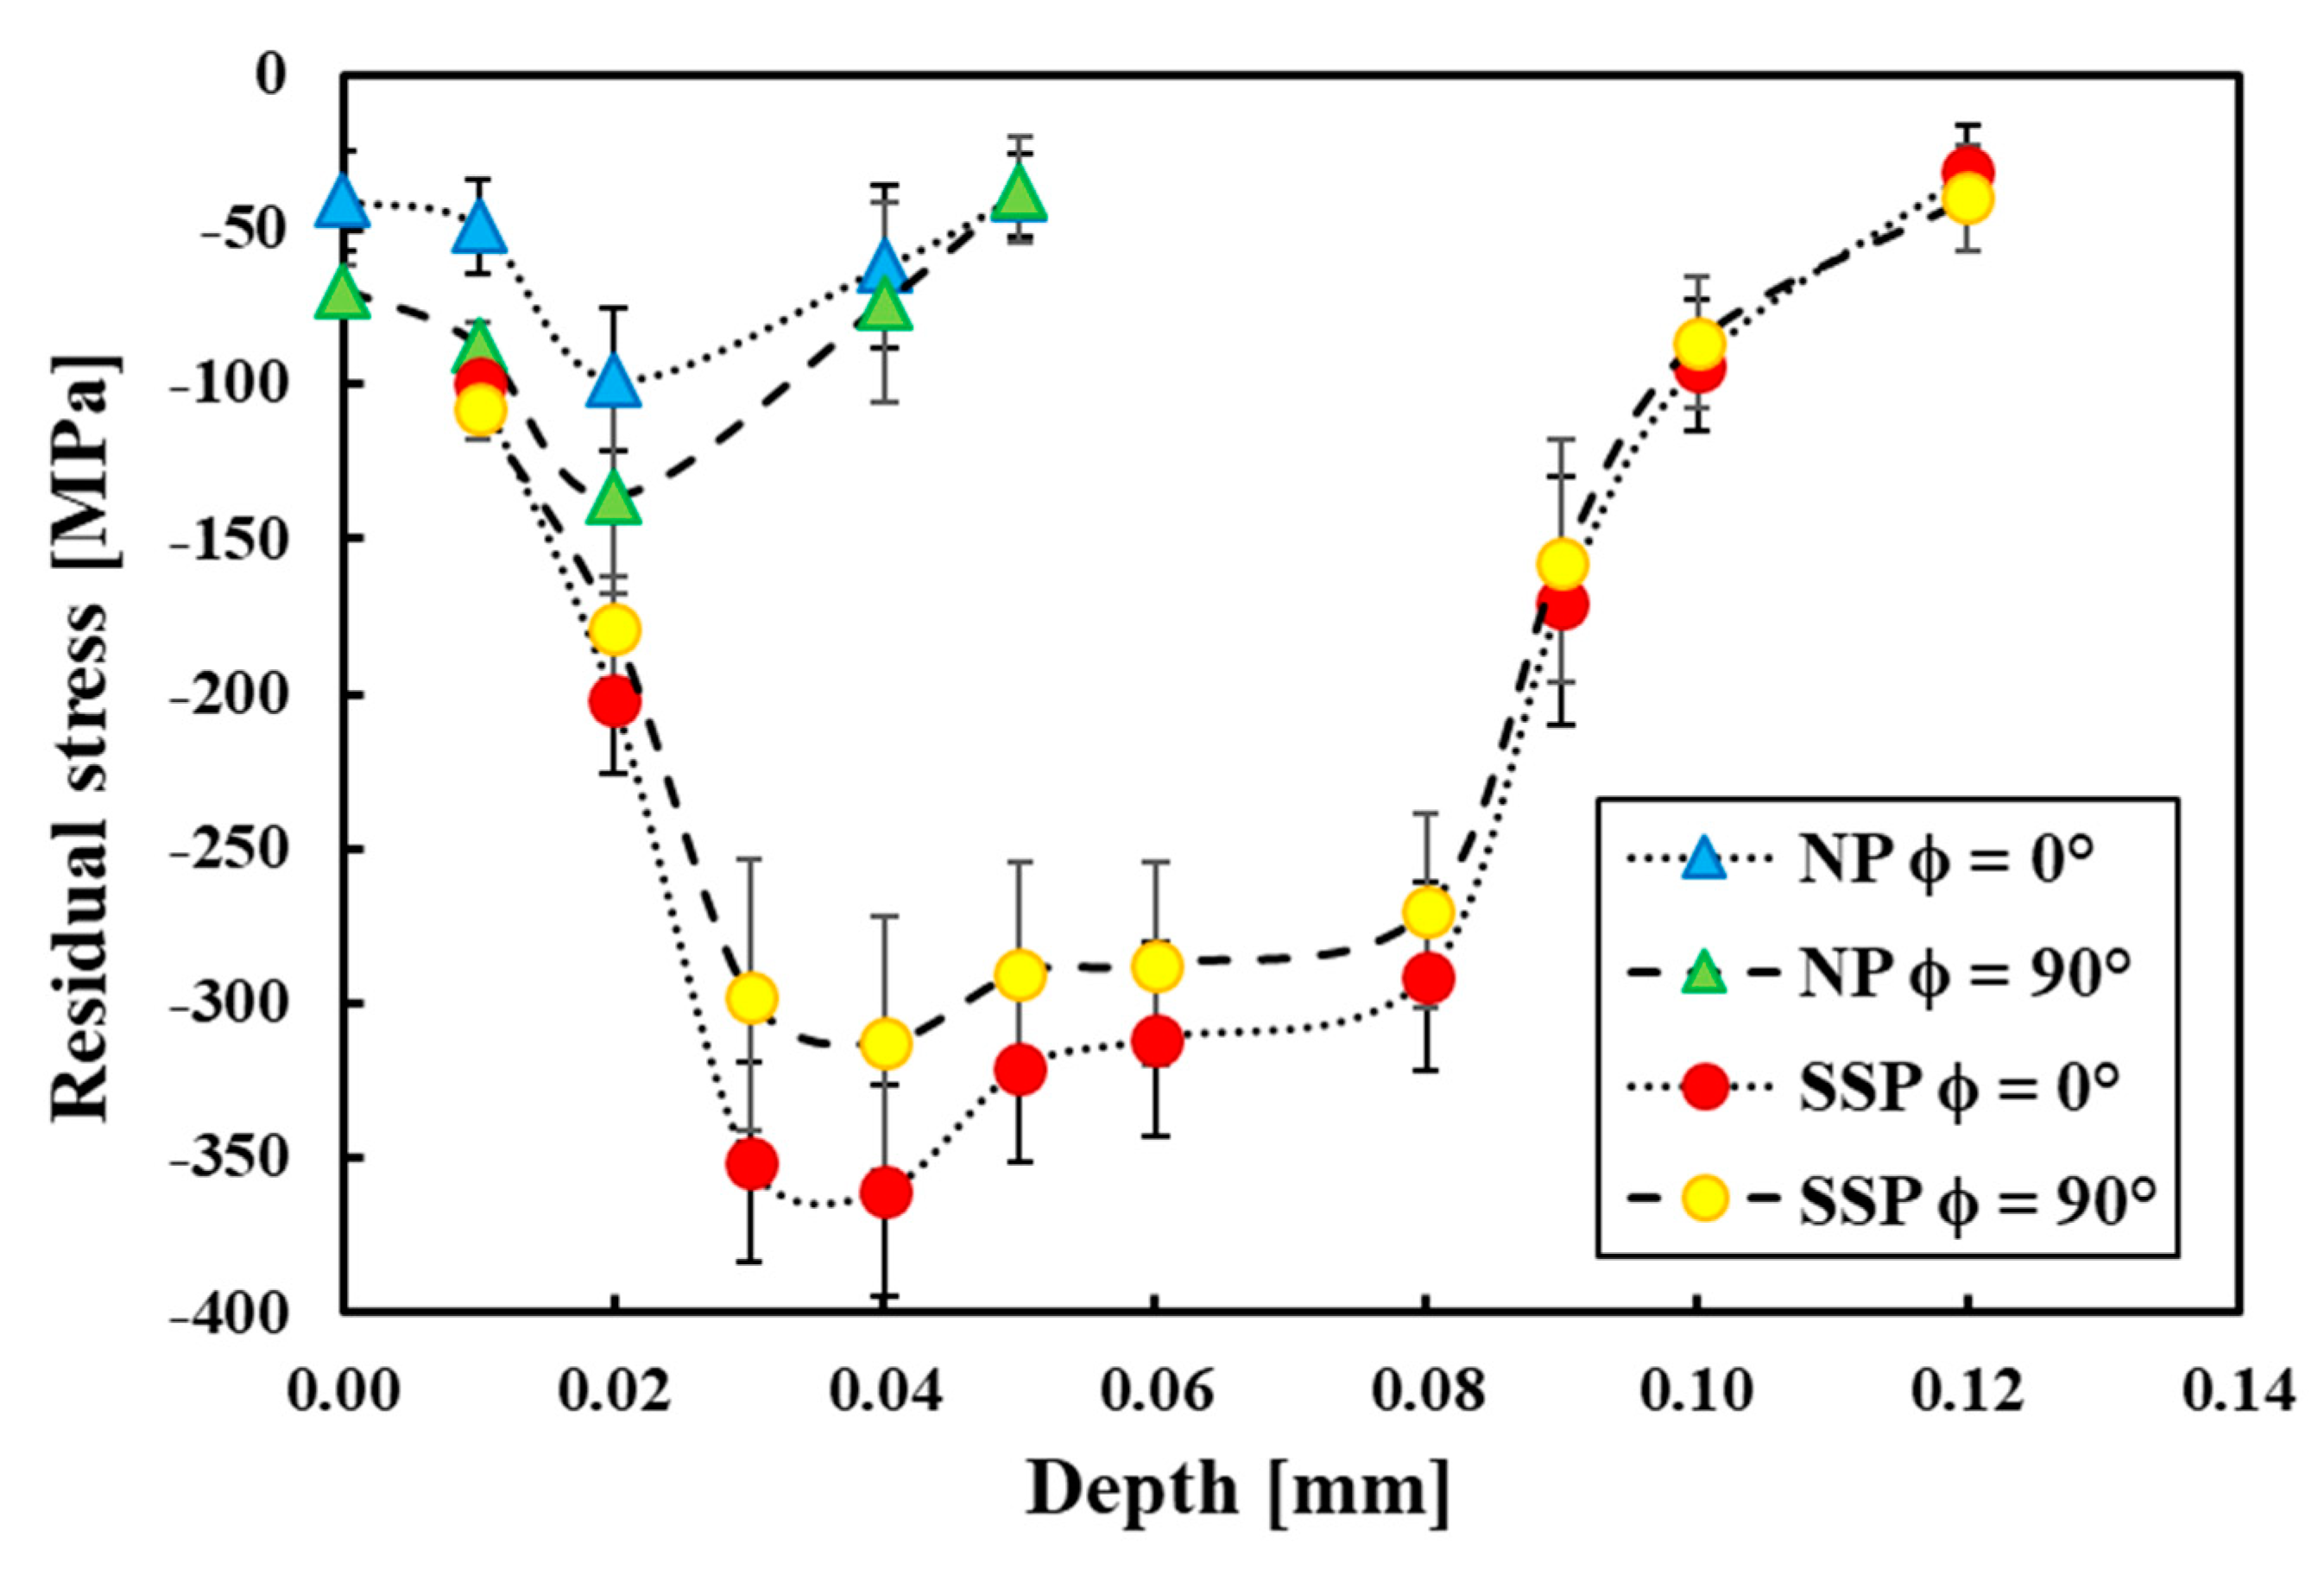
The distribution of the residual stresses in the not peened and severely shot peened specimens is shown in Figure 7. In the case of the NP specimens, the machining process creates a shallow compressive residual stress field, with a peak at 0.02 mm under the surface and maximal value stated between −100 and −150 MPa. With increasing depth, these residual stresses quickly disappear. After severe shot peening, the residual stresses are introduced deeply to the material. The peak of the compressive residual stresses is achieved in depth between 0.03 and 0.04 mm, with values between −300 and −350 MPa, followed by the plateau up to the depth of 0.08 mm, after which a steep decrease of the residual stress level occurs. The residual stress levels in the axial direction (ϕ = 0°) are approximately 50 MPa higher than those in the circumferential direction (ϕ = 90°).
3.3. Fatigue Test Results
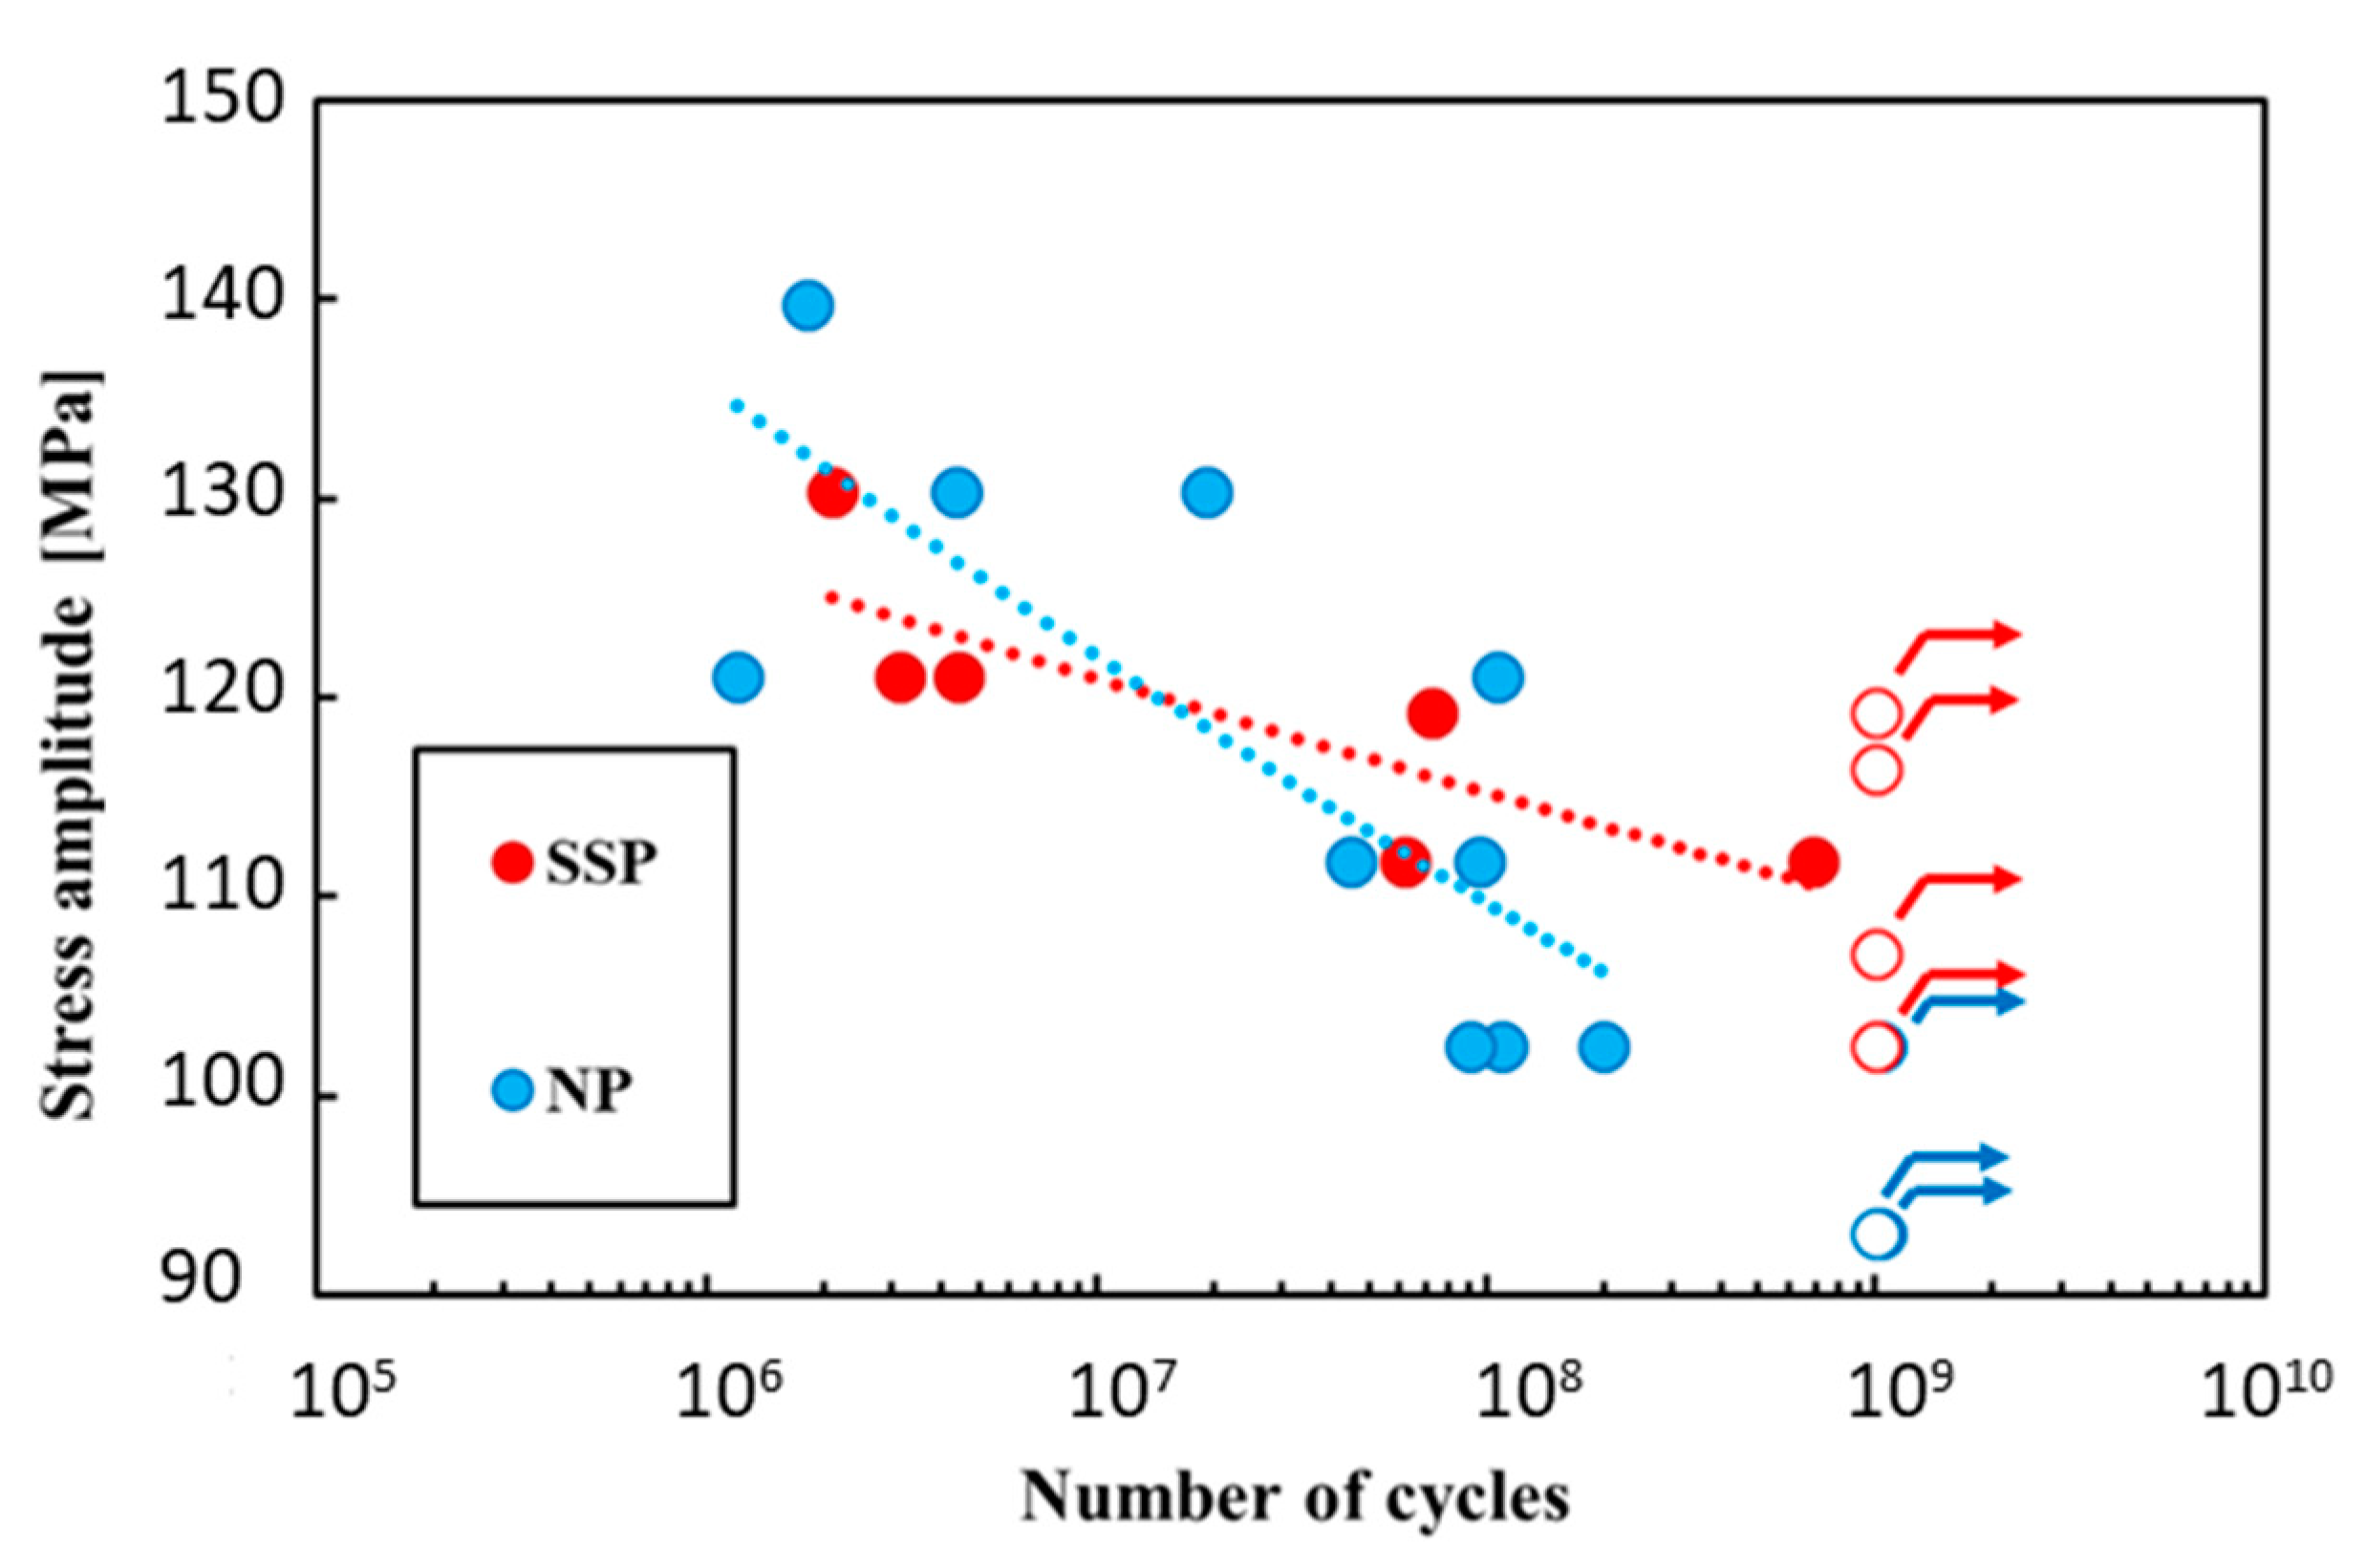
Fatigue test results in the form of S-N curves are shown in Figure 8, and the regression curves were plotted according to the Basquin function with fitting coefficients shown in Table 3. From the results, the low inclination character of the fatigue curves is clearly seen, as in the case of the not peened specimens, the difference in the fatigue strengths for 106 and 109 of loading cycles is less than 40 MPa. This number is even lower when considered severely shot peened specimens (Δσa less than 20 MPa). The fatigue limit (for 109 cycles) for NP specimens was recorded to be 93 MPa. The applied shot peening process is found to be beneficial in terms of the fatigue limit, as, in the case of the SSP specimens, the fatigue limit was recorded to be 107 MPa (an increase of 15%). The regression curves of the NP and SSP specimens are crossing at approximately 107 cycles, revealing that the positive effect of the shot peening process on the fatigue properties of notched specimens is limited only for the very-high cycle region, while for the lower lifetimes (and higher loading amplitudes), the severe shot peening reduces the fatigue strength.
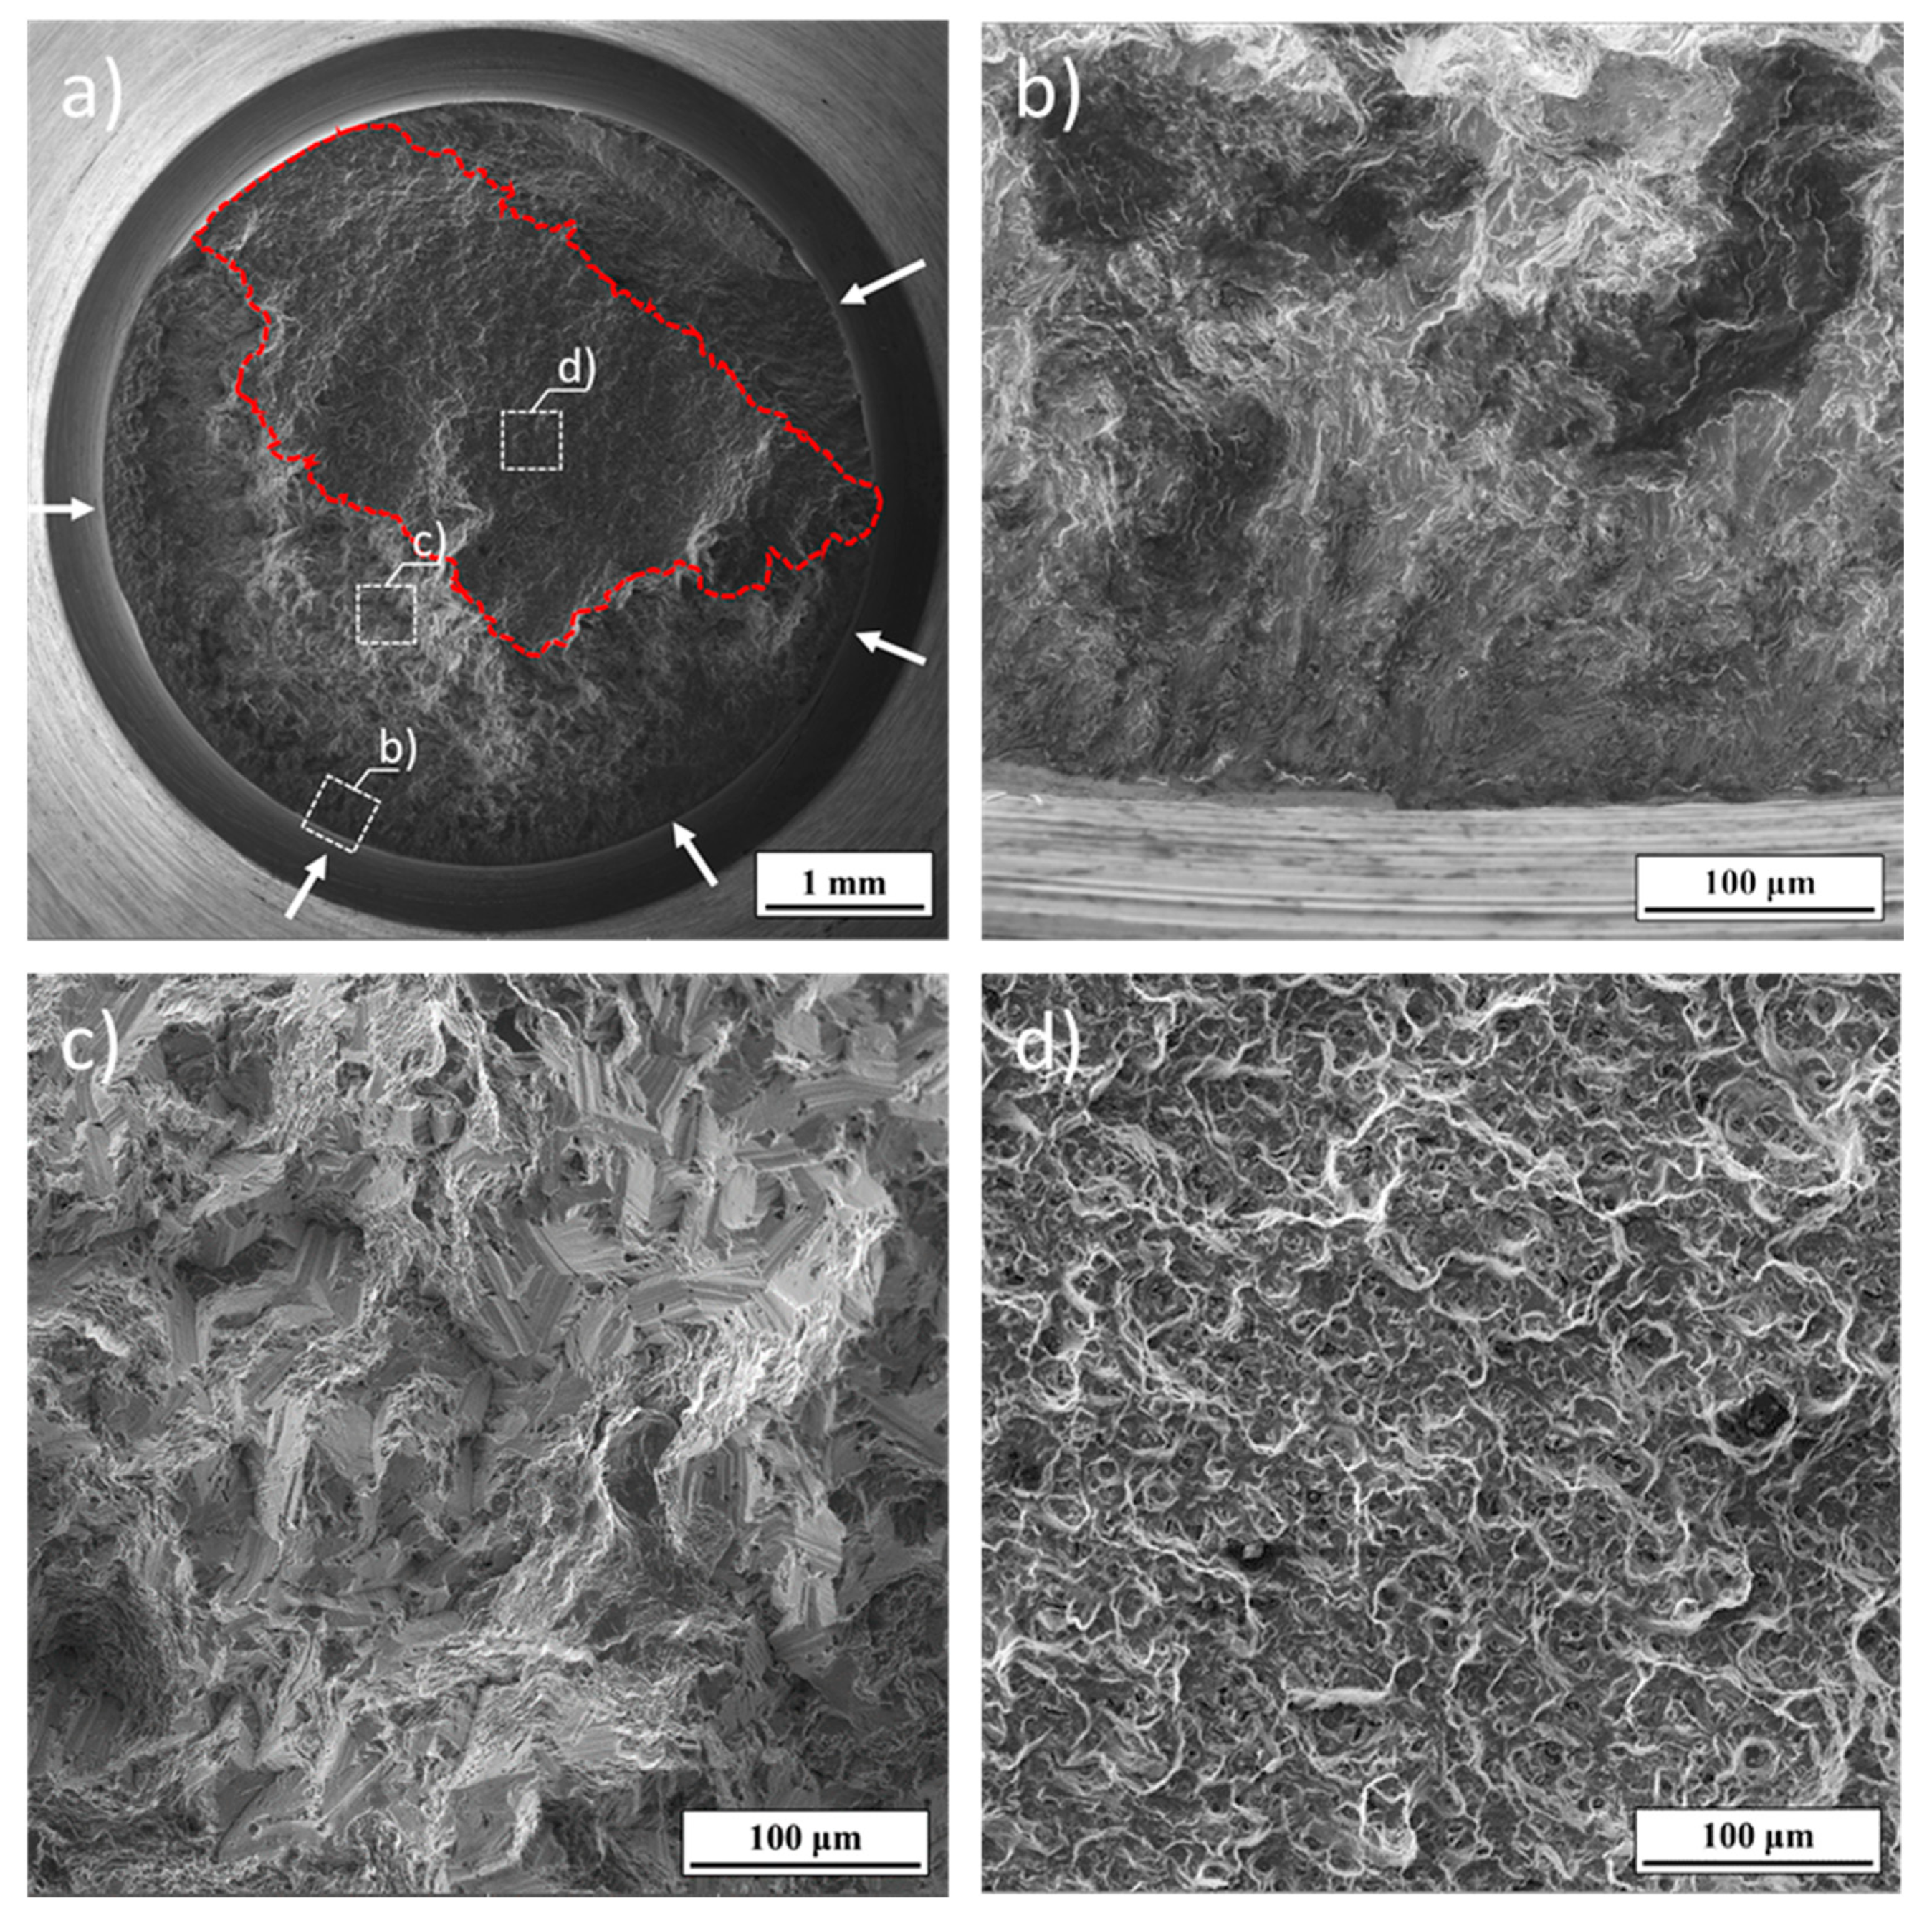
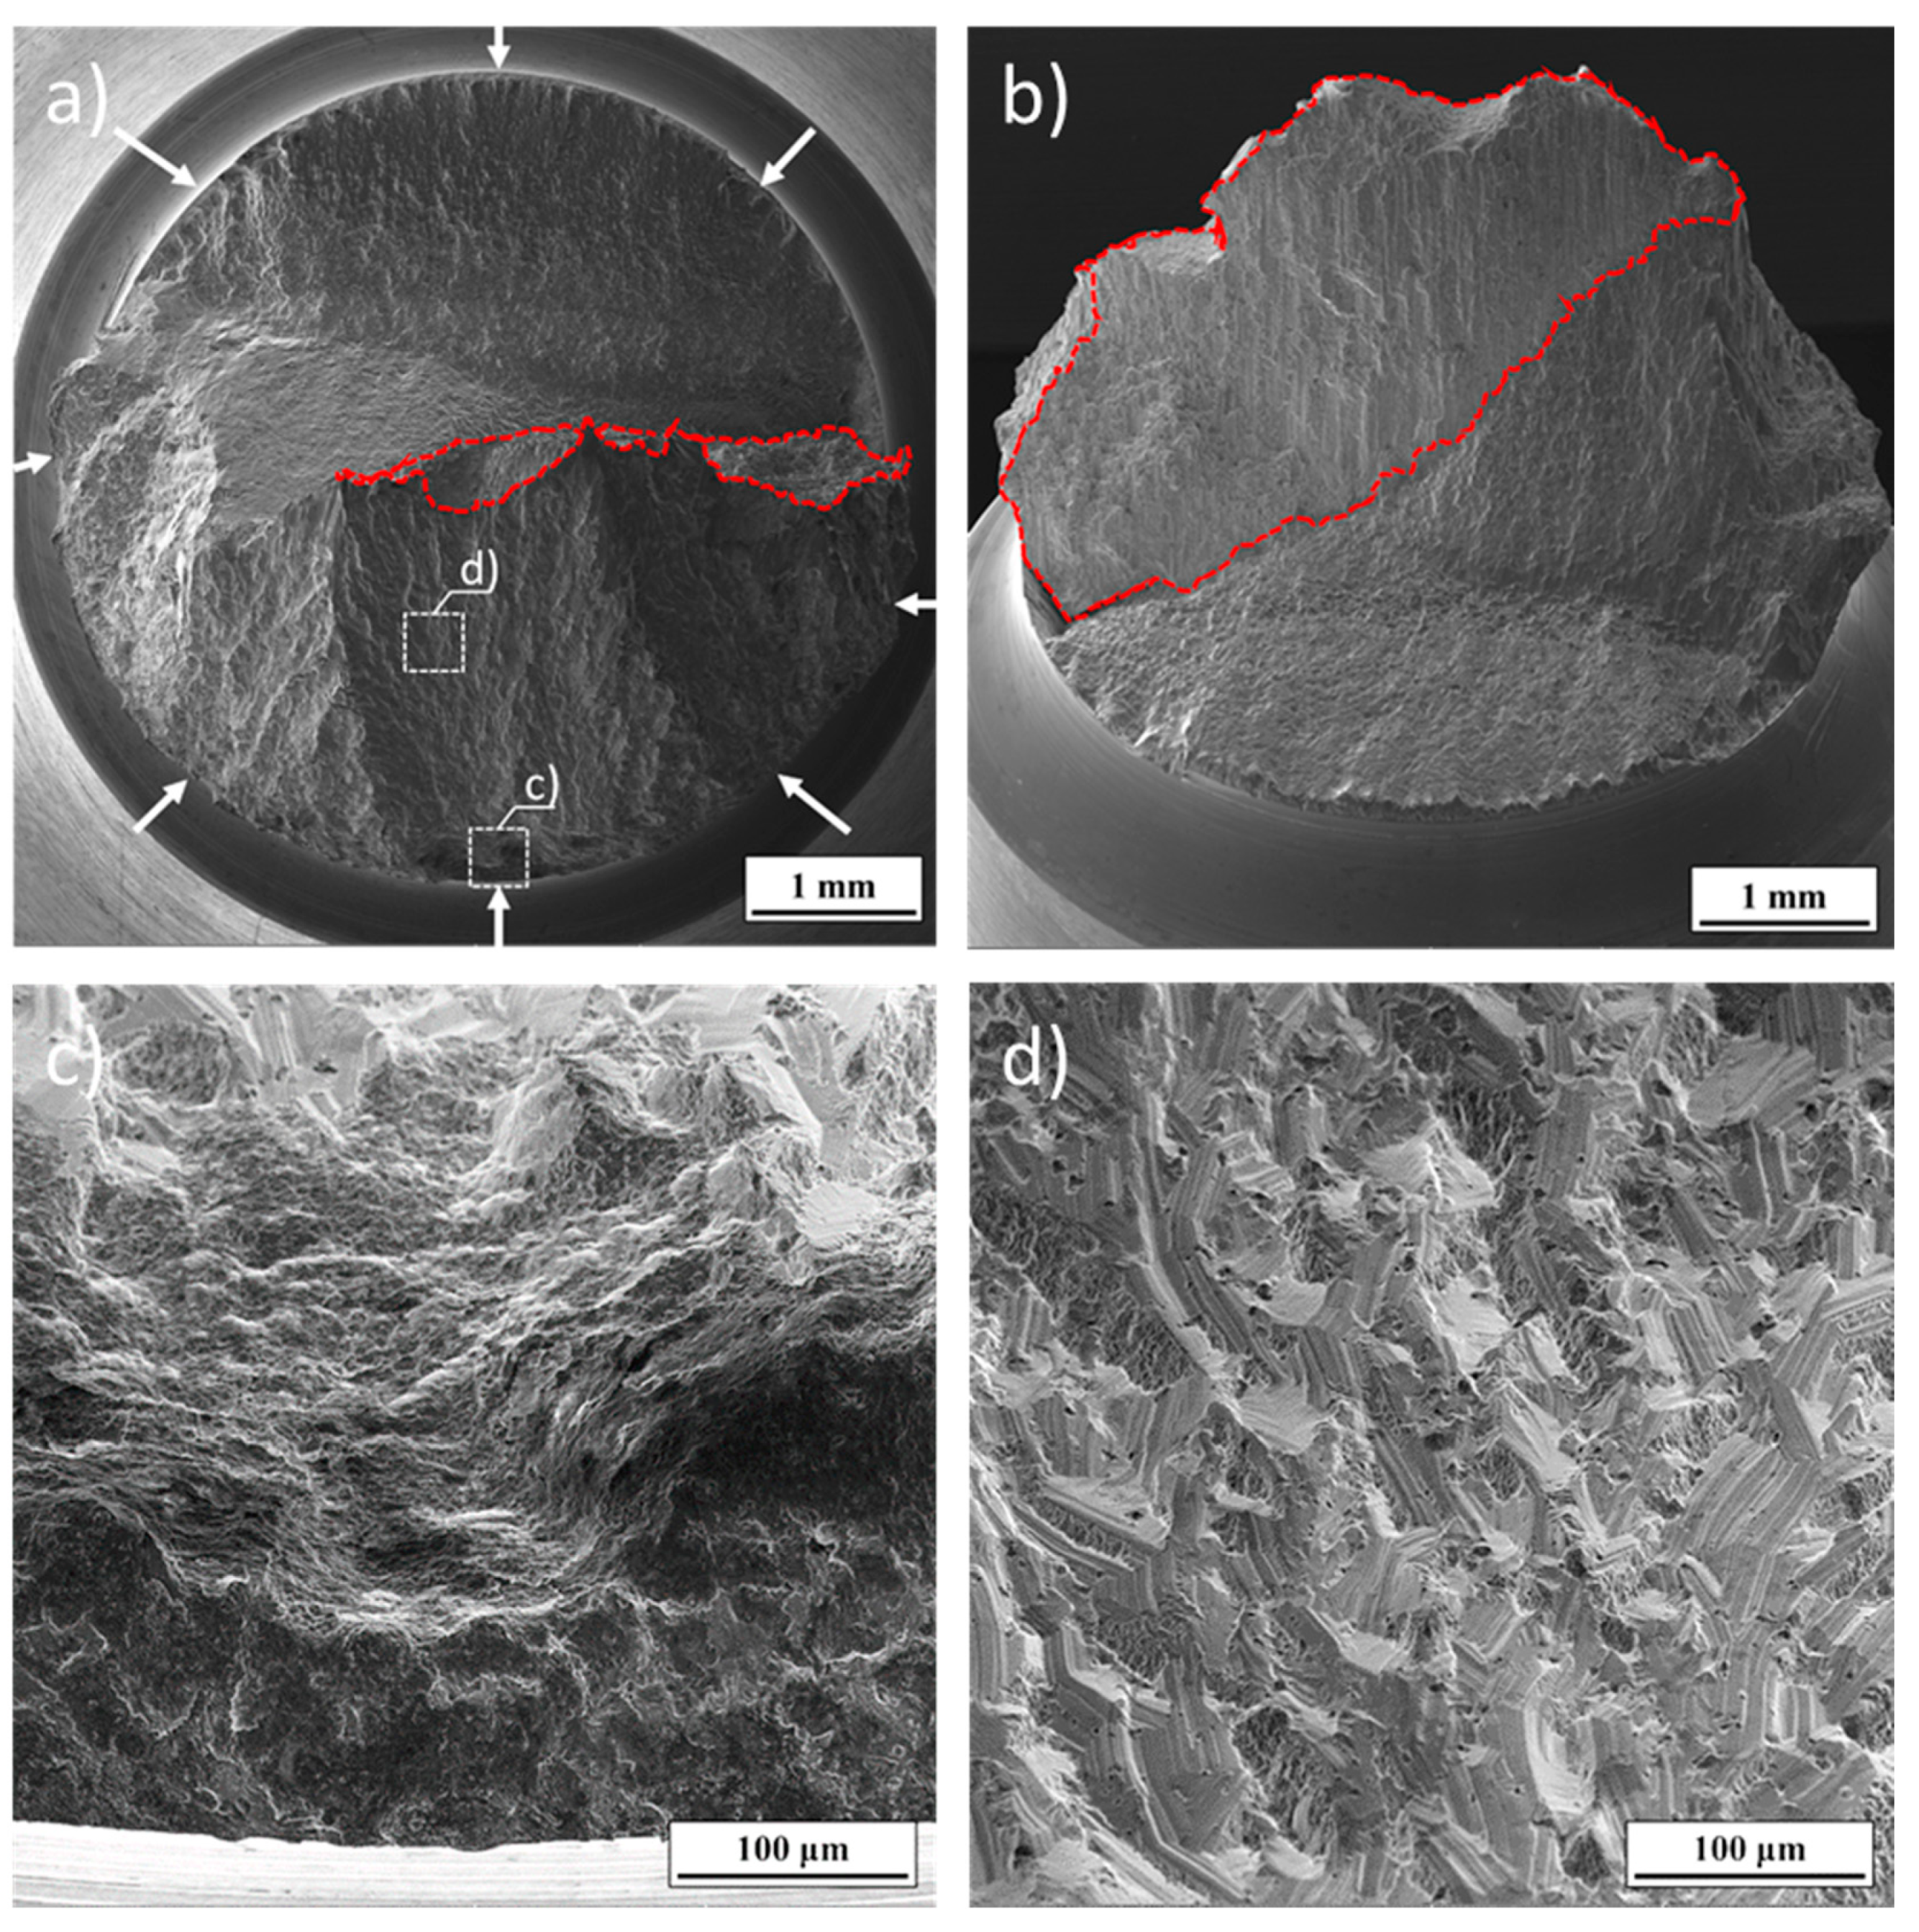
The fracture surfaces of the specimens failed during the fatigue tests were subjected to the fractography analysis. In the NP series, the fracture surfaces of all specimens have a similar character (Figure 9 and Figure 10). Multiple initiation locations (indicated by white arrows in Figure 9a and Figure 10a) are observed on all tested specimens, suggesting strong notch sensitivity of the tested aluminum alloy. The cracks initiate on imperfections on the notch surface, created by the machining process, and in the first stage, they propagate in the perpendicular direction with respect to the loading axis (Figure 9b and Figure 10c). After this stage, the cracks propagate through the transition region, reaching the stable stage of the fatigue crack propagation (Figure 9c and Figure 10d). The fracture surfaces, especially in the regions of the first and second stage of the fatigue crack propagation, exhibit a significant degree of surface wear and oxidation, which prevents the clear distinguishing of individual regions. The area of the stable crack propagation (Figure 9c and Figure 10d) exhibits crystallographic features (facets), which is typical for the wrought precipitation strengthened aluminum alloys. The area of the final fracture shows a transcrystalline character with the dimple morphology (Figure 9d).
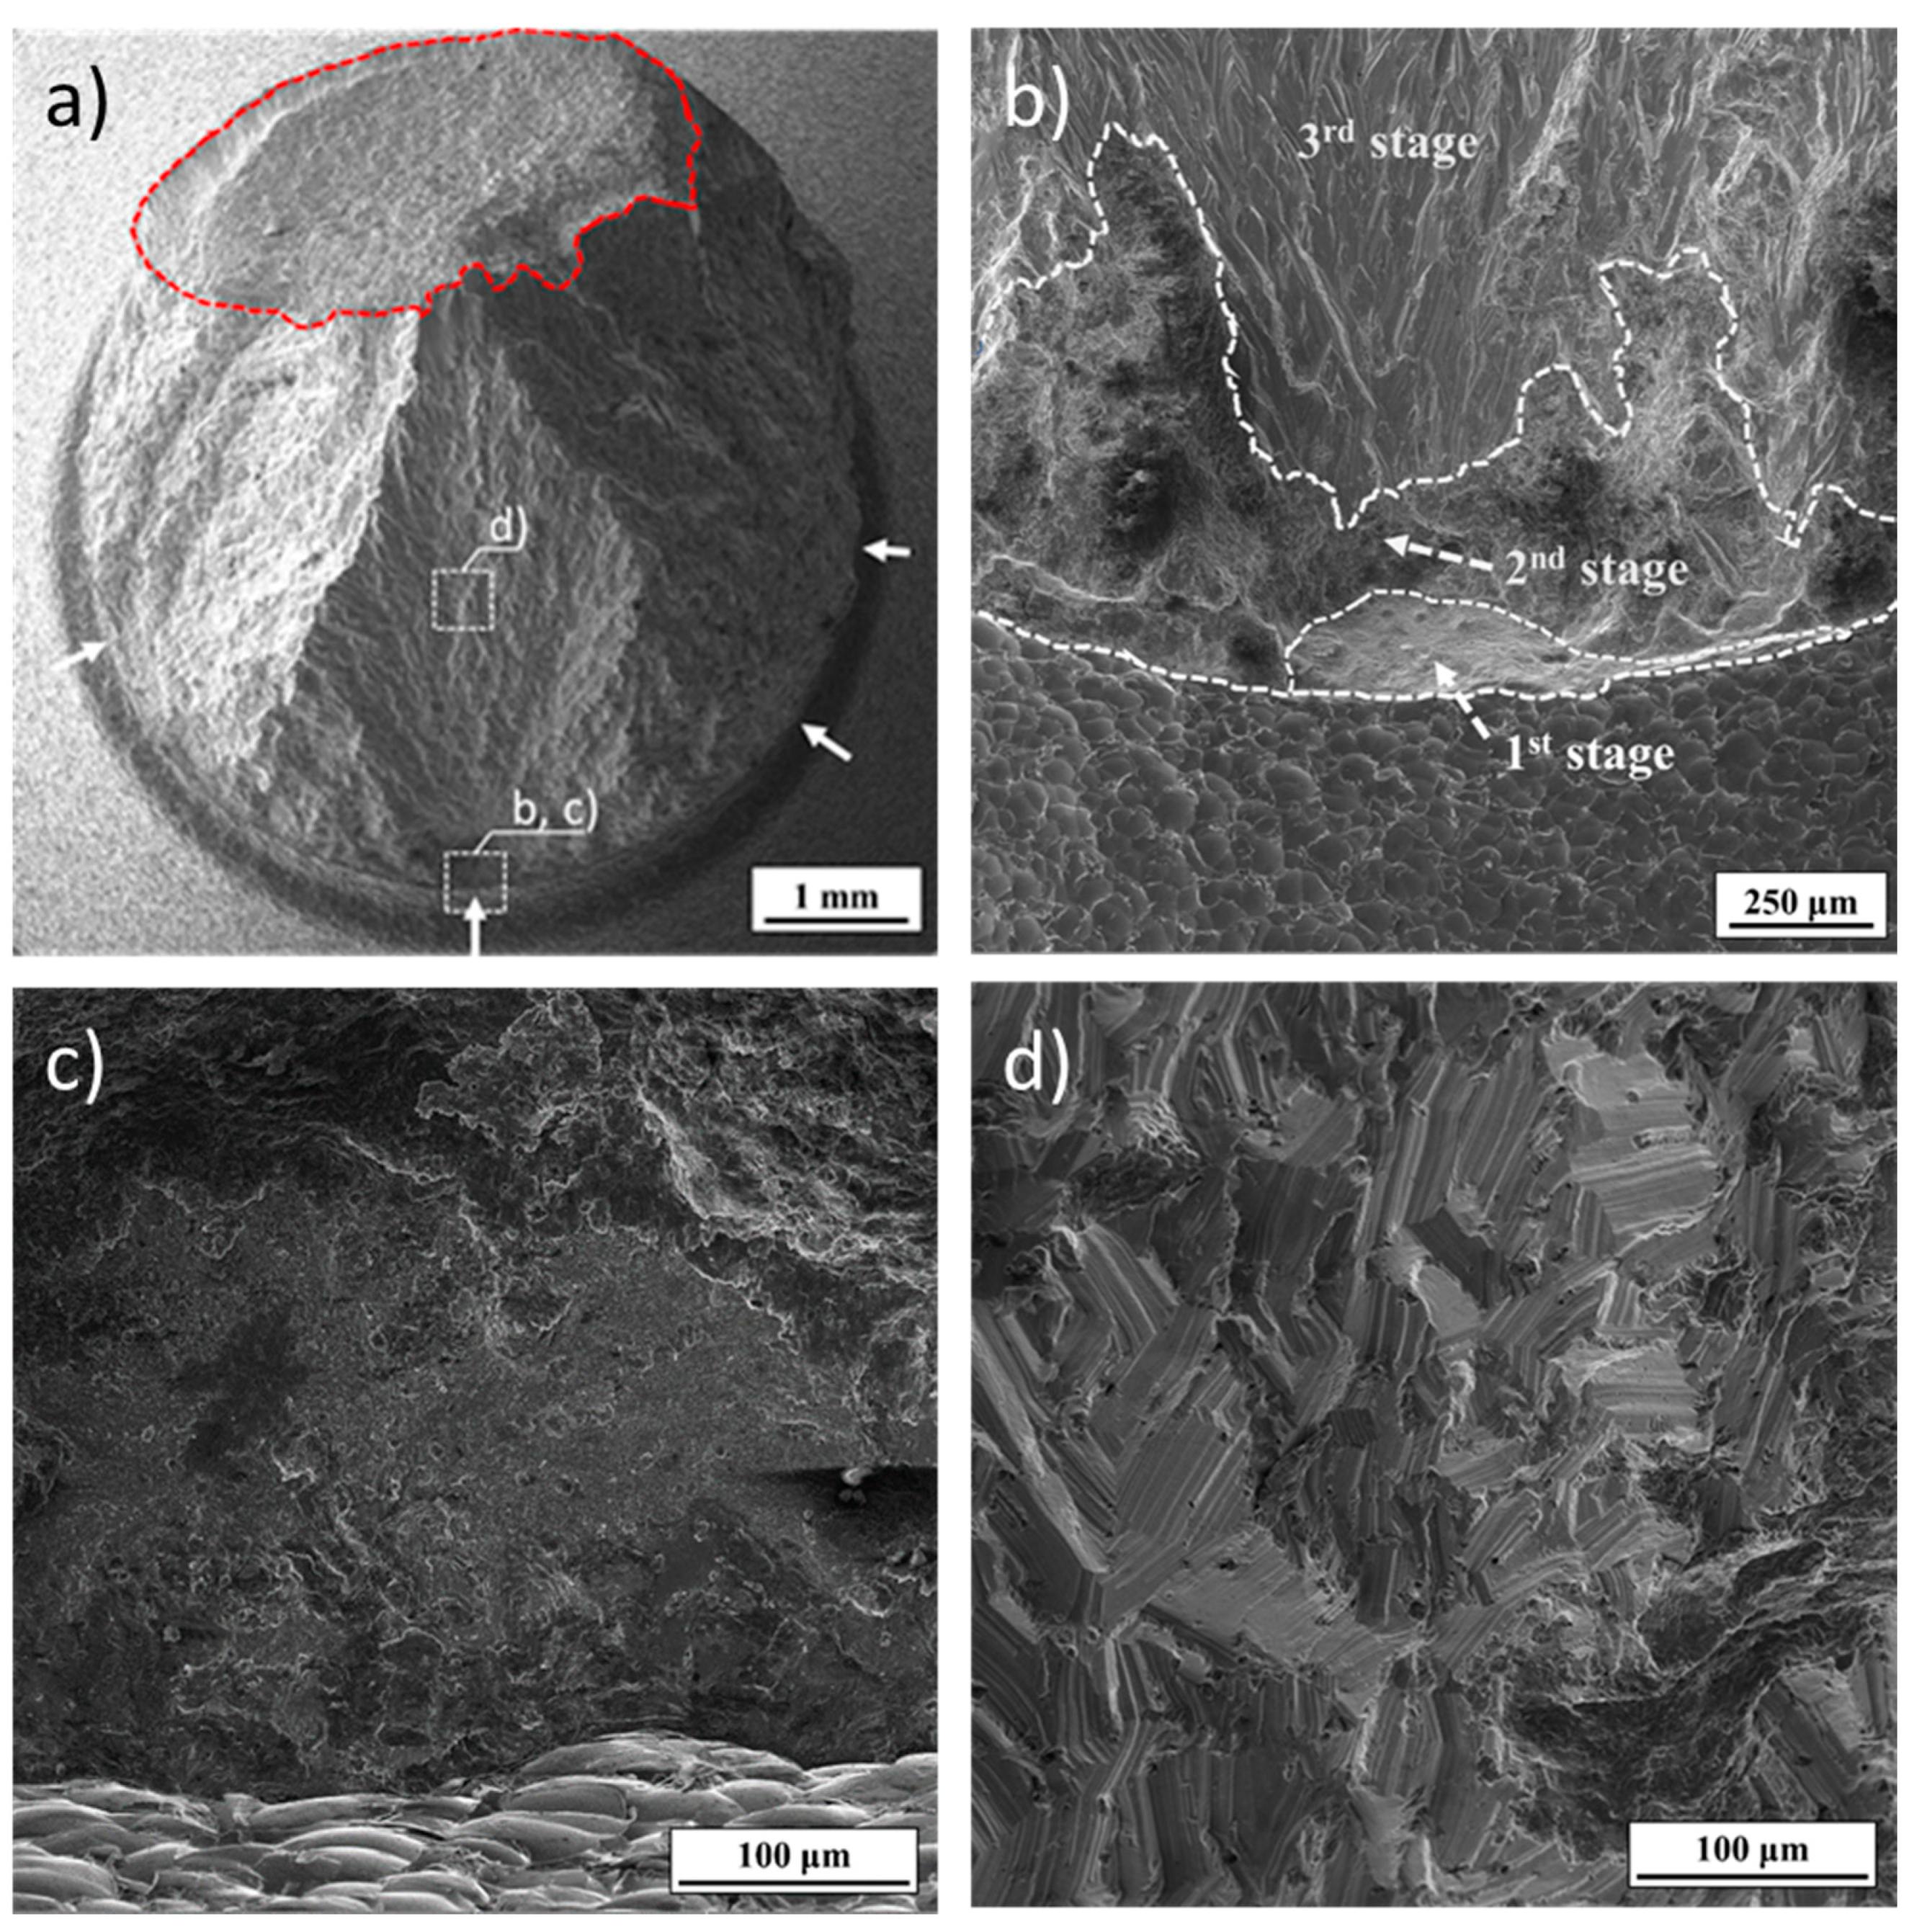
The fracture surfaces of the SSP specimens failed during cyclic loading are shown in Figure 11 and Figure 12. The multiple fatigue crack initiation was recorded on all fractured specimens, including those on the lowest level of the loading stress amplitude. All of the fatigue cracks start to propagate from the surface/near-surface region. Various discontinuities in the strengthened layer, introduced during the severe shot peening process, act as initiation locations for fatigue cracks. The cracks propagate perpendicularly to the loading axis through the strengthened layer. After overcoming of the strengthened layer (1st stage of fatigue crack propagation—FCP, according to a Figure 11b), a short transition region of the fatigue crack propagation was recorded, where the crack propagation starts to deviate from the initial crack plane (2nd stage of fatigue crack propagation according to Figure 11b). This area is characterized by a transcrystalline character and a very rough surface (Figure 11b and Figure 12b). With further crack propagation, the propagation mechanism has changed again, and the cracks continue to propagate by transcrystalline mechanism with a crystallographic manner, producing the characteristic appearance of the fracture surface, consisting of a large number of facets (Figure 11d and Figure 12d). The same appearance of the fracture surfaces was recorded for all severely shot peened specimens, regardless of the loading amplitude, but the number of the initiation sites is reduced with decreasing loading amplitude.
4. Discussion
Based on the recorded fatigue behavior of the NP and SSP specimens, the beneficial effect of the severe shot peening treatment on the notched fatigue properties in the very-high cycle fatigue region is clearly visible. The fatigue limit at 109 cycles is increased from 93 MPa (for NP) to 107 MPa (SSP), which represents an increase of 15%. The analysis of regression curves shows that the beneficial effect of the SSP is recorded for the region beyond 107 loading cycles. On the other hand, for the shorter lifetimes and higher loading amplitudes, the SSP causes worsening of the fatigue properties. According to the regression curve coefficients, the fatigue strength for the 106 cycles is, in the case of the SSP specimens, 7% lower than for the NP specimens. Similar behavior is also observed in other works, in which ultrasonic fatigue testing of NP and SP specimens has been performed [3,33]. In these works, the phenomenon is attributed to a higher residual stress relaxation rate due to higher applied loading amplitudes at a lower number of cycles of interest. Since the elastic residual stresses are mostly resulting from increased dislocation density, the application of dynamic loading causes further slip of the bonded dislocations. In this case, the fatigue properties improvement by the residual stress effect is lost in the first few thousand loading cycles, and only the effect of the grain refined layer takes place [34]. However, the possible positive effect of the grain refined layer is strongly opposed by the negative effect of the increased surface roughness, which causes acceleration of the fatigue crack initiation. Under higher loading, also the fatigue crack propagation increments are higher, so the crack relatively quickly grows through the grain refined layer, and its effect becomes negligible. The fatigue curves of both states exhibit low steep character. Benedetti et al. [12] tested fatigue properties of the same alloy after the shot peening process, applied on the specimens with various notches. They reported a similar low steep character of the fatigue curves. On the other hand, they recorded “knee” behavior, with run-out specimens after approximately 106 cycles for the specimens with a notch with similar and higher stress concentration factor. After the application of the shot peening process, they observed a change in the behavior, and only specimens with the sharpest notch exhibited such behavior. It should be mentioned that completely different specimen shapes and loading modes (four-point bending with R = 0.05) and also different shot peening parameters were used, resulting in the different residual stress profiles and surface texture. This can explain the differences in the observed behavior from the results presented in this study.
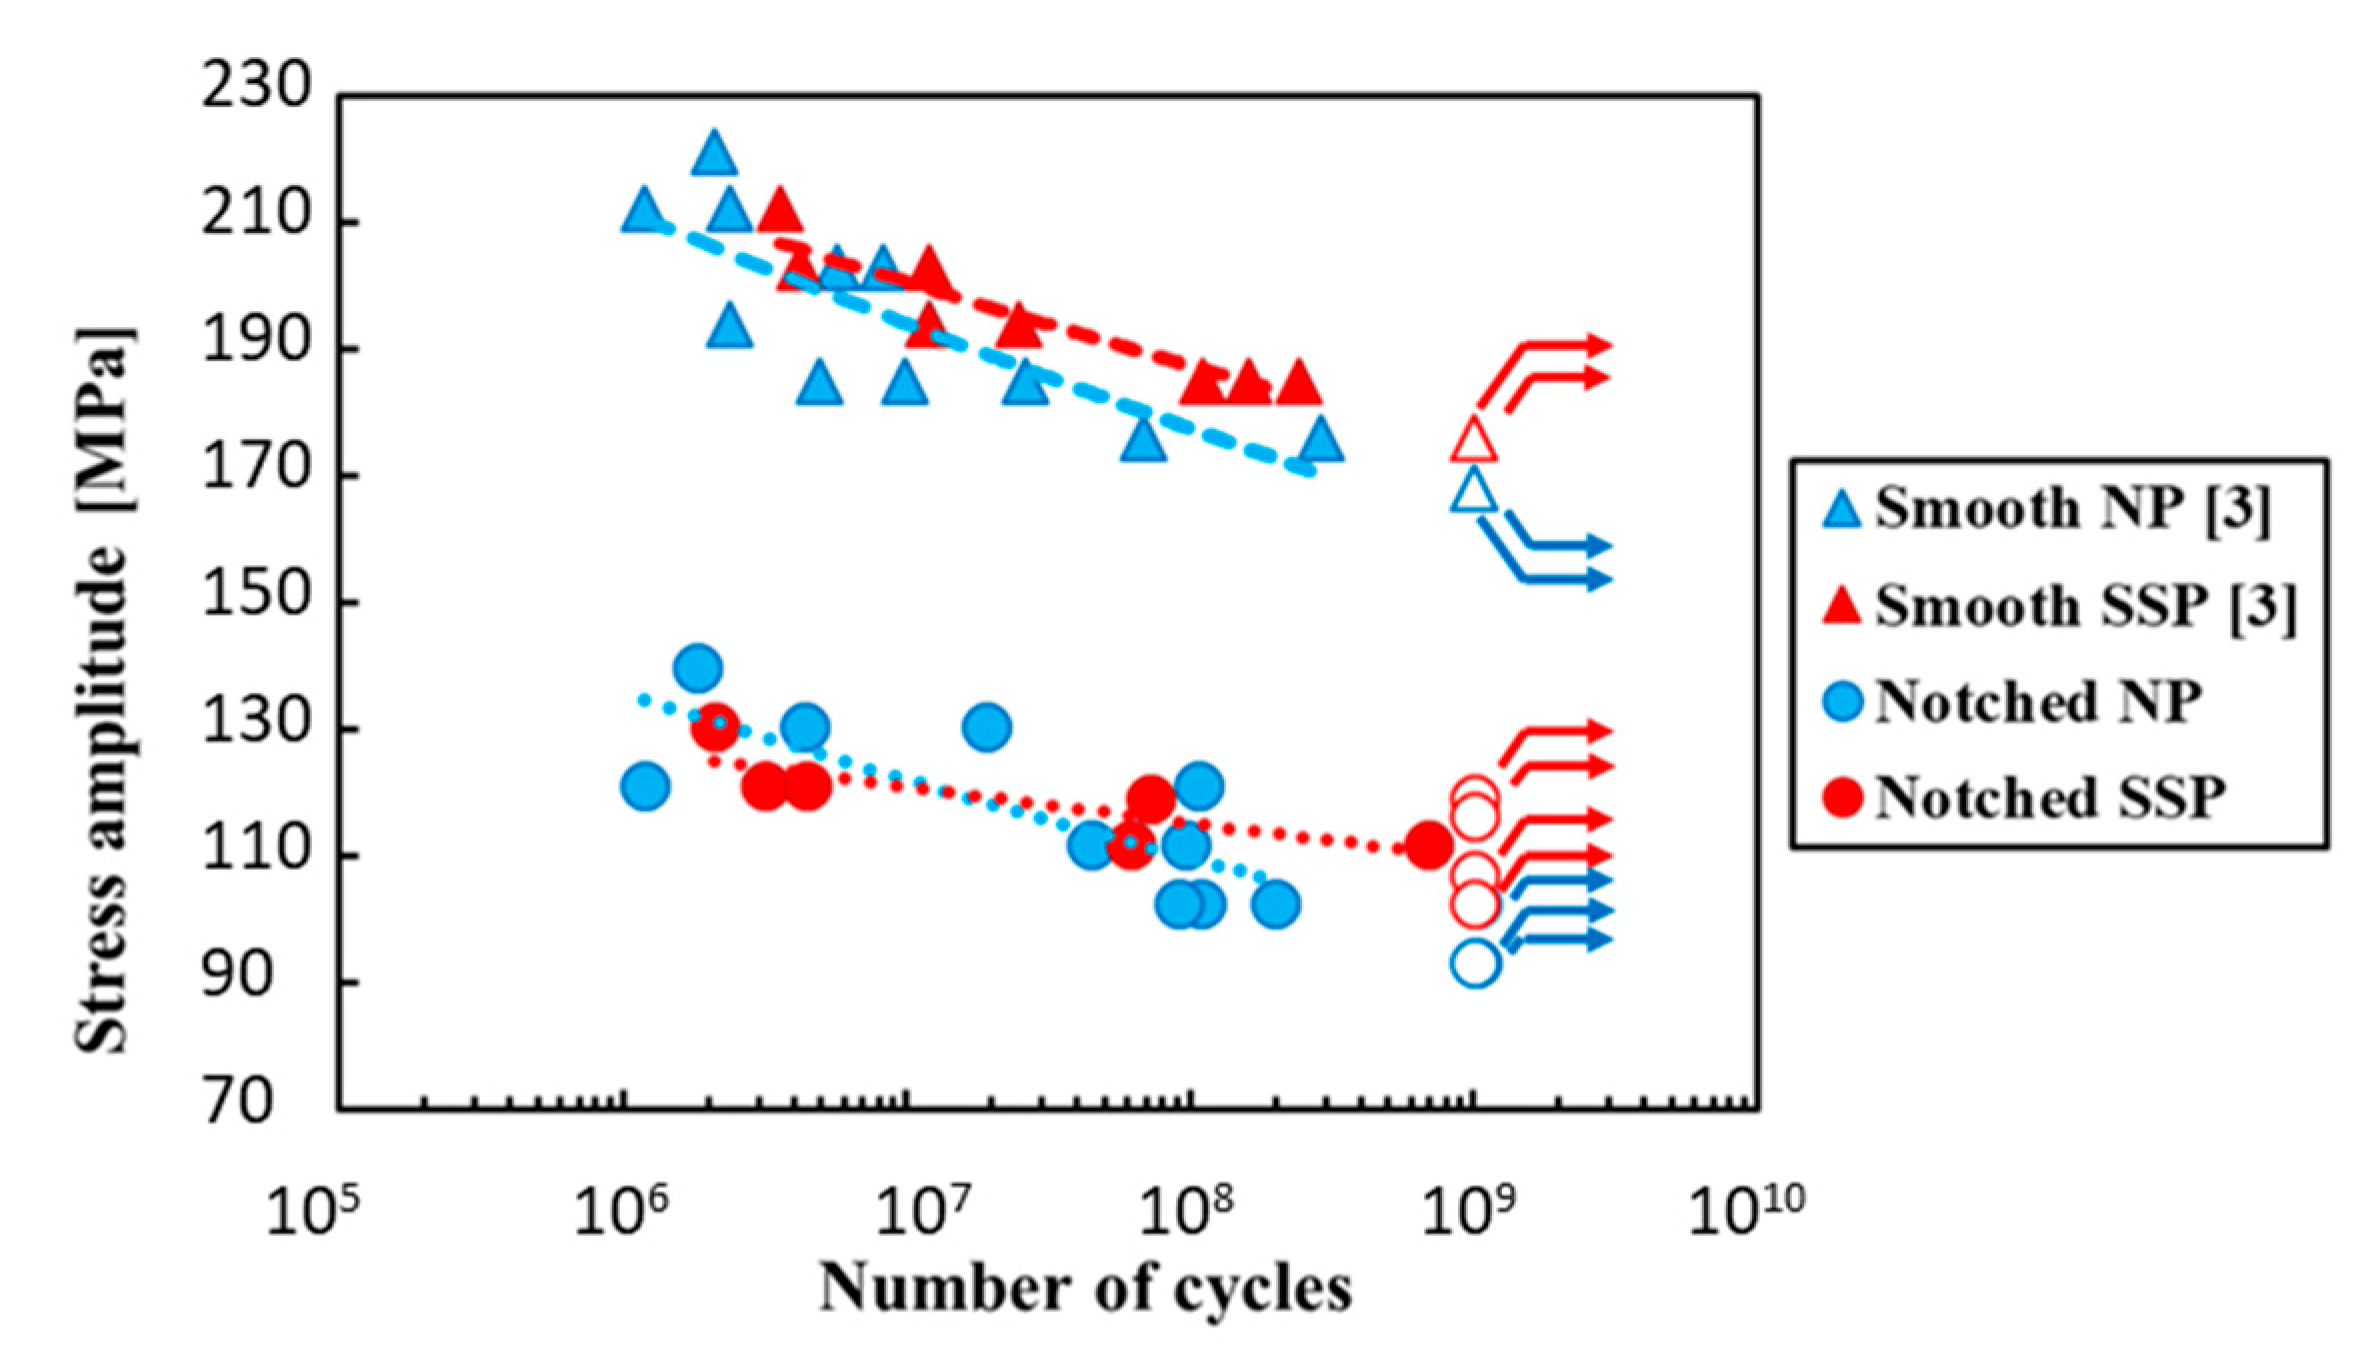
A comparison of the S-N curves of the NP and SSP specimens obtained on the smooth [3] and notched specimens using the same experimental conditions is shown in Figure 13. The results show a similar trend for the NP series, recorded for both notched and smooth specimens. The obvious shift of the S-N curves to lower stress amplitudes due to stress concentration is observed for the notched specimens. A slightly different trend is recorded when the SSP series are compared. In the case of the smooth specimens, the crossing of the Basquin’s fits of the S-N curves is expected at approximately 105 cycles. On the contrary, for the notched specimens, the crossing of the fits of S-N curves is recorded at approximately 107 cycles. This can be attributed to the strong notch sensitivity of the AW 7075 alloy due to its high strength in the artificially aged condition.
According to [1], the surface fatigue crack initiation is usually observed for the not peened specimens from high strength Al alloys in the whole range of the tested fatigue lifetime. In the case of the shot peened specimens, the surface initiation is observed in the medium lifetimes, while for the higher numbers of cycles, the sub-surface fatigue crack initiation is observed. In the presented study, the surface crack initiation dominates for both tested states and in the whole range of the evaluated fatigue lifetime. In NP specimens, the crack initiates from the small local imperfection in the notch root area, caused by the machining process. Multiple fatigue crack initiation implies strong notch sensitivity of an AW 7075 alloy [35]. In the SSP specimens, the crack always initiates from the surface or in the near-surface region (the initiation can occur on the subsurface discontinuities; however, it is impossible to define the exact initiation location). The transversal cross-sections of the run-out specimen in the notch area (Figure 14) show numerous discontinuities in the strain hardened layer. During cyclic loading, these discontinuities can serve as the initiation points in the final fatigue failure.
Parameters determining the fatigue lifetime of the severe shot peened components are loading amplitude, grain size, depth, and amplitude of the residual stress field. In the case of the lower applied loading amplitudes, the compressive residual stresses slow down fatigue crack initiation and short crack propagation from the existing discontinuities in the hardened layer. When the strengthened surface layer is created, the fatigue crack initiation can occur by two basic mechanisms. First, the crack has to be nucleated in the specimen interior under the strengthened surface layer (below the peak of compressive residual stresses)—subsurface fatigue crack initiation. The second type of crack initiation occurs when the continuous cyclic loading causes relaxation of the residual stresses to a level when they no longer restrain the initiation or propagation of a crack from preexisting discontinuities. The occurrence of this mechanism is supported by the stress concentration at the surface caused by the notch, see Figure 4d. As no internal fatigue crack initiation is observed, the residual stresses and their possible relaxation seem to be the critical factors affecting the resulting fatigue properties. This statement also meets the conclusion of other authors [36], who have reported that the induced compressive residual stresses on the surface have only a small effect on the crack nucleation but significantly slow down the crack propagation in the first stages.
5. Conclusions
It was shown that the application of the severe shot peening increased fatigue life in the case of the notched specimens from AW 7075 aluminum alloy.
The positive effect of severe shot peening was recorded for the stress amplitudes corresponding to the fatigue lifetimes in the range 107–109 of loading cycles. The severe shot peening process introduced the compressive residual stress field, which, together with the grain refinement, successfully increased the number of cycles necessary for fatigue crack initiation and also slowed down the propagation of the short cracks.
In the lower ranges of fatigue lifetimes, the application of the severe shot peening resulted in a decrease in fatigue strength. When the higher loading amplitudes were applied, the cyclic loading most likely resulted in early relaxation of the compressive residual stresses, the effect of axial stress concentration was stronger, and the positive effects of severe shot peening were outbalanced by the high roughness and creation of the subsurface discontinuities.
Surface roughness features created by the impact of the shot peening media caused further stress concentration points, which again accelerated fatigue crack initiation in the region of higher loading stresses.
Considering the experimental results, it can be stated that the severe shot peening process can be successfully applied for the increase of fatigue life in case of complexly shaped parts manufactured from the strong notch sensitive AW 7075 aluminum alloy and operated in the very-high cycle region.
Author Contributions
Experiment design and surface treatment, L.T.; fracture surface analysis, M.J., S.F.; residual stress evaluation, D.K.; stress analysis, J.K.; fatigue testing, F.N.; fatigue data evaluation, O.B. All authors have read and agreed to the published version of the manuscript.
Funding
The research was supported by the project of the Ministry of Education, Science, Research, and Sport of the Slovak Republic VEGA grant number 1/0029/18 and the project CEITEC 2020 (grant number LQ1601) with financial support from the Ministry of Education, Youth, and Sports of the Czech Republic under the National Sustainability Programme II.
Conflicts of Interest
The authors declare that there is no conflict of interest.
References
- Benedetti, M.; Fontanari, V.; Bandini, M. Very high-cycle fatigue resistance of shot peened high-strength Aluminium alloys. In Experimental and Applied Mechanics; Springer: New York, NY, USA, 2012; Volume 4, pp. 203–211. [Google Scholar]
- Han, W.Z.; Chen, Y.; Vinogradov, A.; Hutchinson, C.R. Dynamic precipitation during cyclic deformation of an underaged Al-Cu alloy. Mater. Sci. Eng. A 2011, 528, 7410. [Google Scholar] [CrossRef]
- Trško, L.; Guagliano, M.; Bokůvka, O.; Nový, F.; Jambor, M.; Florková, Z. Influence of severe shot peening on the surface state and ultra-high-cycle fatigue behavior of an AW 7075 Aluminum alloy. J. Mater. Eng. Perform. 2017, 26, 2784–2797. [Google Scholar] [CrossRef]
- Luong, H.; Hill, M.R. The effect of laser peening and shot peening on high cycle fatigue in 7050-T7451 aluminum alloy. Mater. Sci. Eng. A 2010, 527, 699–707. [Google Scholar] [CrossRef]
- Lago, J.; Trško, L.; Jambor, M.; Nový, F.; Bokůvka, O.; Mičian, M.; Pastorek, F. Fatigue life improvement of the high strength steel welded joints by ultrasonic impact peening. Metals 2019, 9, 619. [Google Scholar] [CrossRef] [Green Version]
- Ramulu, M.; Kunaporn, S.; Jenkins, M.; Hashish, M.; Hopkins, J. Fatigue Performance of high-pressure waterjet-peened aluminum alloy. J. Press. Vessel Technol. 2002, 124, 118–123. [Google Scholar] [CrossRef]
- Trško, L.; Fintová, S.; Nový, F.; Bokůvka, O.; Jambor, M.; Pastorek, F.; Florková, Z.; Oravcová, M. Study of relation between shot peening parameters and fatigue fracture surface character of an AW 7075 Aluminum alloy. Metals 2018, 8, 111. [Google Scholar] [CrossRef] [Green Version]
- Bagherifard, S.; Beretta, N.; Monti, S.; Riccio, M.; Bandini, M.; Guagliano, M. On the fatigue strength enhancement of additive manufactured AlSi10Mg parts by mechanical and thermal post-processing. Mater. Des. 2018, 145, 28–41. [Google Scholar] [CrossRef]
- Hadzima, B.; Nový, F.; Trško, L.; Pastorek, F.; Jambor, M.; Fintová, S. Shot peening as a pre-treatment to anodic oxidation coating process of AW 6082 aluminum for fatigue life improvement. Int. J. Adv. Manuf. Technol. 2017, 93, 3315–3323. [Google Scholar] [CrossRef]
- Gao, Y.K.; Wu, X.R. Experimental investigation and fatigue life prediction for 7435-T7351 aluminum alloy with and without shot peening-induced residual stresses. Acta Mater. 2011, 59, 3737–3747. [Google Scholar] [CrossRef]
- Benedetti, M.; Fontanari, V.; Bandini, M.; Taylor, D. Multiaxial fatigue resistance of shot peened high-strength aluminum alloys. Int. J. Fatigue 2014, 61, 271–282. [Google Scholar] [CrossRef]
- Benedetti, M.; Fontanari, V.; Winiarski, B.; Withers, P.J.; Allahkarami, M.; Hanan, J.C. Fatigue behavior of shot peened notched specimens: Effect of the residual stress field ahead of the notch root. Procedia Eng. 2015, 109, 80–88. [Google Scholar] [CrossRef] [Green Version]
- González, J.; Bagherifard, S.; Guagliano, M.; Pariente, I.F. Influence of different shot peening treatments on surface state and fatigue behavior of Al 6063 alloy. Eng. Fract. Mech. 2017, 185, 72–81. [Google Scholar] [CrossRef]
- Pandey, V.; Chattopadhyay, K.; Srinivas, N.S.; Singh, V. Role of ultrasonic shot peening on low cycle fatigue behavior of 7075 Aluminium alloy. Int. J. Fatigue 2017, 103, 426–435. [Google Scholar] [CrossRef]
- Oguri, K. Fatigue life enhancement of aluminum alloy for aircraft by Fine Particles Shot Peening (FPSP). J. Mater. Process. Technol. 2011, 211, 1395–1399. [Google Scholar] [CrossRef]
- Benedetti, M.; Fontanari, V.; Bandini, M.; Savio, E. High and very high-cycle plain fatigue resistance of shot peened high-strength aluminum alloys: The role of surface morphology. Int. J. Fatigue 2015, 70, 451–462. [Google Scholar] [CrossRef]
- Berge, C.; Pytell, B.; Trosmann, T. Very high cycle fatigue tests with smooth and notched specimens and screws made of light metal alloys. Int. J. Fatigue 2006, 28, 1640–1646. [Google Scholar] [CrossRef]
- Wang, Q.Y.; Kawagoishi, N.; Chen, Q. Fatigue and fracture behavior of structural Al-alloys up to very long life regimes. Int. J. Fatigue 2006, 28, 1572–1576. [Google Scholar] [CrossRef]
- Benedetti, M.; Fontanari, V.; Scardi, P.; Ricardo, C.A.; Bandini, M. Reverse bending fatigue of shot-peened 7075-T651 aluminium alloys: The role of residual stress relaxation. Int. J. Fatigue 2009, 31, 1225–1236. [Google Scholar] [CrossRef]
- Benedetti, M.; Fontanari, V.; Bandini, M. A simplified and fast method to predict plain and notch fatigue of shot peened high-strength Aluminium alloys under reverse bending. Surf. Coat. Technol. 2014, 243, 2–9. [Google Scholar] [CrossRef]
- Zhao, X.; Sun, Z.; Xu, D.; Liu, Y. Local fatigue strength evaluation of shot peened 40Cr notched steel. Metals 2018, 8, 681. [Google Scholar] [CrossRef] [Green Version]
- Miková, K.; Bagherifard, S.; Bokuvka, O.; Guagliano, M.; Trško, L. Fatigue behavior of X70 microalloyed steel after severe shot peening. Int. J. Fatigue 2013, 55, 33–42. [Google Scholar] [CrossRef]
- Polmear, I. Light Alloys-From Traditional Alloys to Nanocrystals; Butterworth-Heinemann: Oxford, UK, 2006; p. 416. [Google Scholar]
- Chen, L.; Chen, G.; Tang, J.; Zhao, G.; Zhang, C. Evolution of grain structure, micro-texture and second phase during porthole die extrusion of Al-Zn-Mg alloy. Mater. Charact. 2019, 158, 109953. [Google Scholar] [CrossRef]
- Ayer, R.; Koo, J.Y.; Steeds, J.W.; Park, B.K. Microanalytical Study of the Heterogeneous Phases in Commercial Al-Zn-Mg-Cu Alloys. Metall. Trans. A 1985, 16A, 1925–1936. [Google Scholar] [CrossRef]
- Löffler, H.; Kovács, I.; Lendvai, J. Review: Decomposition processes in Al-Zn-Mg alloys. J. Mater. Sci. 1983, 18, 2215–2240. [Google Scholar] [CrossRef]
- Park, J.K.; Ardell, A.J. Precipitate microstructure of peak-aged 7075 Al. Scr. Metall. 1988, 22, 1115–1119. [Google Scholar] [CrossRef]
- Li, J.F.; Peng, Z.W.; Li, C.X.; Jia, Z.Q.; Chen, W.J.; Zheng, Z.Q. Mechanical properties, corrosion behavior and microstructure of 7075 aluminum alloy with various aging treatments. Trans. Nonferrous Met. Soc. China 2008, 18, 755–762. [Google Scholar] [CrossRef]
- Trško, L.; Nový, F.; Bokůvka, O.; Jambor, M. Ultrasonic Fatigue Testing in the Tension-Compression Mode. J. Vis. Exp. 2018, 133, e57007. [Google Scholar] [CrossRef] [PubMed]
- Bokůvka, O.; Jambor, M.; Hrček, S.; Šteininger, J.; Trško, L. Design of Shaft Respecting the Fatigue Limit for Ultra-High Number of Cycles. Period. Polytech. Trasp. Eng. 2018, 47, 6–12. [Google Scholar] [CrossRef]
- Bathias, C.; Paris, P.C. Gigacycle Fatigue in Mechanical Practice; CRC Press: Boca Raton, FL, USA, 2004; ISBN 978-0203020-609. [Google Scholar]
- Murakami, Y. Theory of Elasticity and Stress Concentration; John Wiley & Sons, Ltd.: Hoboken, NJ, USA, 2017; ISBN 9781119274094. [Google Scholar]
- Trško, L.; Bokůvka, O.; Nový, F.; Guagliano, M. Effect of severe shot peening on ultra-high-cycle fatigue of a low-alloy steel. Mater. Des. 2014, 57, 103–113. [Google Scholar] [CrossRef]
- Trško, L.; Guagliano, M.; Lukáč, P.; Bokůvka, O.; Nový, F. Effects of severe shot peening on the surface state of AW 7075 Al alloy. Kov. Mater. Met. Mater. 2015, 53, 239–243. [Google Scholar]
- Whaley, R.E. Fatigue and static strength of notched and unnotched aluminum-alloy and steel specimens. Exp. Mech. 1962, 2, 329–334. [Google Scholar] [CrossRef]
- Fathallah, R.; Laamouri, A.; Sidhom, H.; Braham, C. High cycle fatigue behavior prediction of shot-peened parts. Int. J. Fatigue 2004, 26, 1053–1067. [Google Scholar] [CrossRef]
Figure 1.
The microstructure of the experimental material in the as-delivered state, longitudinal section, (a) Electron backscatter diffraction method (EBSD) inverse pole figures (IPF) map with corresponding pole figures; (b,c) Electron channeling contrast imaging (ECCI) images, showing sub-grain structure.

Figure 2.
Drawing of the notched fatigue specimen. Specimen’s dimensions are provided in mm.

Figure 3.
(a) The 3D model of the notched ultrasonic fatigue specimen; (b) detail of the element’s distribution in the vicinity of the notch.
Figure 3.
(a) The 3D model of the notched ultrasonic fatigue specimen; (b) detail of the element’s distribution in the vicinity of the notch.

Figure 4.
Analysis of the stress distribution throughout the cross-section under the notch. The amplitude of displacements A = 20 μm. (a) stress concentration in the gauge length of the specimen, (b) detail of the stress concentration in the notch, and (c) stress distribution across the diameter in the middle of the specimen.


Figure 5.
SEM micrographs, showing the surface of the notch area of the not peened (a,b) and severe shot peened specimens (c,d).
Figure 5.
SEM micrographs, showing the surface of the notch area of the not peened (a,b) and severe shot peened specimens (c,d).

Figure 6.
ECCI images of the near surface region; (a,b) NP (not peened) specimen; (c,d) SSP (severe shot peening) specimen.
Figure 6.
ECCI images of the near surface region; (a,b) NP (not peened) specimen; (c,d) SSP (severe shot peening) specimen.

Figure 7.
The residual stress profile measured in the notch of not peened (NP) and severe shot peened (SSP) specimens.
Figure 7.
The residual stress profile measured in the notch of not peened (NP) and severe shot peened (SSP) specimens.

Figure 8.
The results of the fatigue tests of the notched specimens; open symbols with arrows represent the run-outs.
Figure 8.
The results of the fatigue tests of the notched specimens; open symbols with arrows represent the run-outs.

Figure 9.
Fracture surface of the NP specimen fractured at σa = 102 MPa, Nf = 1.06 × 10⁸. (a) overall view, the dashed red line encloses the area of final fracture; (b) area of the fatigue crack initiation and propagation; (c) detailed view of the area of stable fatigue crack propagation; (d) area of the final fracture.

Figure 10.
Fracture surface of the NP specimen, fractured at σa = 130 MPa, Nf = 2.1 × 10⁶. (a,b) overall view, the dashed red line encloses the area of final fracture; (c) area of the fatigue crack initiation and propagation; (d) detailed view of the area of stable fatigue crack propagation.
Figure 10.
Fracture surface of the NP specimen, fractured at σa = 130 MPa, Nf = 2.1 × 10⁶. (a,b) overall view, the dashed red line encloses the area of final fracture; (c) area of the fatigue crack initiation and propagation; (d) detailed view of the area of stable fatigue crack propagation.

Figure 11.
Fracture surface of the severely shot peened specimen fractured at σa = 112 MPa, Nf = 6.91 × 10⁸. (a) overall view, the dashed red line encloses the area of final fracture; (b) area of the fatigue crack initiation and propagation; (c) detailed view of the initiation site; (d) detailed view of the area of stable fatigue crack propagation.

Figure 12.
The fracture surface of the SSP specimen, broken at σa = 130 MPa, Nf = 2.1 × 10⁶. (a) overall view, the dashed red line encloses the area of final fracture; (b) area of the fatigue crack initiation and propagation; (c) the initiation site with clearly visible deformed layer; (d) area of stable fatigue crack propagation.

Figure 13.
The comparison of the fatigue properties of AW 7075 alloy after severe shot peening—notched and smooth (reproduced from [3], with permission from Springer Nature, 2017) specimens.
Figure 13.
The comparison of the fatigue properties of AW 7075 alloy after severe shot peening—notched and smooth (reproduced from [3], with permission from Springer Nature, 2017) specimens.

Figure 14.
Transversal section of the run-out SSP specimen in the notch area, showing the presence of the discontinuities in the hardened layer (ECCI). (a) discontinuities in the hardened layer and (b) detail of hardened layer.
Figure 14.
Transversal section of the run-out SSP specimen in the notch area, showing the presence of the discontinuities in the hardened layer (ECCI). (a) discontinuities in the hardened layer and (b) detail of hardened layer.


Table 1.
Nominal chemical composition of the experimental material in wt. %.
| Al | Zn | Mg | Cu | Cr | Fe |
|---|---|---|---|---|---|
| 87.1–91.4 | 5.1–6.1 | 2.1–2.9 | 1.2–2 | 0.18–0.28 | max. 0.5 |
| Mn | Si | Ti | Ti + Zr | Other-each | Other-total |
| max. 0.3 | max. 0.4 | max. 0.2 | max. 0.25 | max. 0.05 | max. 0.15 |
Table 2.
Basic mechanical properties of the experimental material [7].
Table 2.
Basic mechanical properties of the experimental material [7].
| UTS (MPa) | Elongation (%) | Reduction of area (%) | Hardness (HV10) |
|---|---|---|---|
| 631 | 4.9 | 15.7 | 175 |
Table 3.
Regression curve coefficients.
| Regression Coefficients | Fatigue Strengths Calculated Based on the Regression Coefficient | |||||
|---|---|---|---|---|---|---|
| Specimen | Coefficient of Fatigue Toughness σF (MPa) | Exponent of Fatigue Life Curve b | Number of Cycles | NP | SSP | Difference (SSP vs. NP) (%) |
| (MPa) | ||||||
| NP | 257.9 | −0.046 | 106 | 136 | 127 | −6.62 |
| 107 | 123 | 121 | −1.63 | |||
| SSP | 170.15 | −0.021 | 108 | 111 | 116 | +4.50 |
| 109 | 99 | 110 | +11.11 | |||
© 2020 by the authors. Licensee MDPI, Basel, Switzerland. This article is an open access article distributed under the terms and conditions of the Creative Commons Attribution (CC BY) license (http://creativecommons.org/licenses/by/4.0/).
Share and Cite
MDPI and ACS Style
Jambor, M.; Trško, L.; Klusák, J.; Fintová, S.; Kajánek, D.; Nový, F.; Bokůvka, O. Effect of Severe Shot Peening on the Very-High Cycle Notch Fatigue of an AW 7075 Alloy. Metals 2020, 10, 1262. https://doi.org/10.3390/met10091262
AMA Style
Jambor M, Trško L, Klusák J, Fintová S, Kajánek D, Nový F, Bokůvka O. Effect of Severe Shot Peening on the Very-High Cycle Notch Fatigue of an AW 7075 Alloy. Metals. 2020; 10(9):1262. https://doi.org/10.3390/met10091262
Chicago/Turabian StyleJambor, Michal, Libor Trško, Jan Klusák, Stanislava Fintová, Daniel Kajánek, František Nový, and Otakar Bokůvka. 2020. "Effect of Severe Shot Peening on the Very-High Cycle Notch Fatigue of an AW 7075 Alloy" Metals 10, no. 9: 1262. https://doi.org/10.3390/met10091262
Note that from the first issue of 2016, this journal uses article numbers instead of page numbers. See further details here.