
Singlet Oxygen In Vivo: It Is All about Intensity


1
Photobiophysics, Institute of Physics, Humboldt University of Berlin, Newtonstr. 15, 12489 Berlin, Germany
2
Laboratory of Microbiology and Oncology, Faculty of Pharmaceutical Sciences, Sojo University, Kumamoto 860-0082, Japan
3
School of Pharmacy, Queen’s University Belfast, 97 Lisburn Road, Belfast BT9 7BL, UK
4
Institute of Macromolecular Chemistry, Czech Academy of Sciences, Heyrovkého nám. 2, 16206 Prague, Czech Republic
*
Author to whom correspondence should be addressed.
J. Pers. Med. 2022, 12(6), 891; https://doi.org/10.3390/jpm12060891
Submission received: 21 April 2022
/
Revised: 25 May 2022
/
Accepted: 25 May 2022
/
Published: 28 May 2022
(This article belongs to the Special Issue EPR Effect-Based Cancer Targeted Therapy: Commemorative Issue in Honor of Professor Hiroshi Maeda)
Abstract
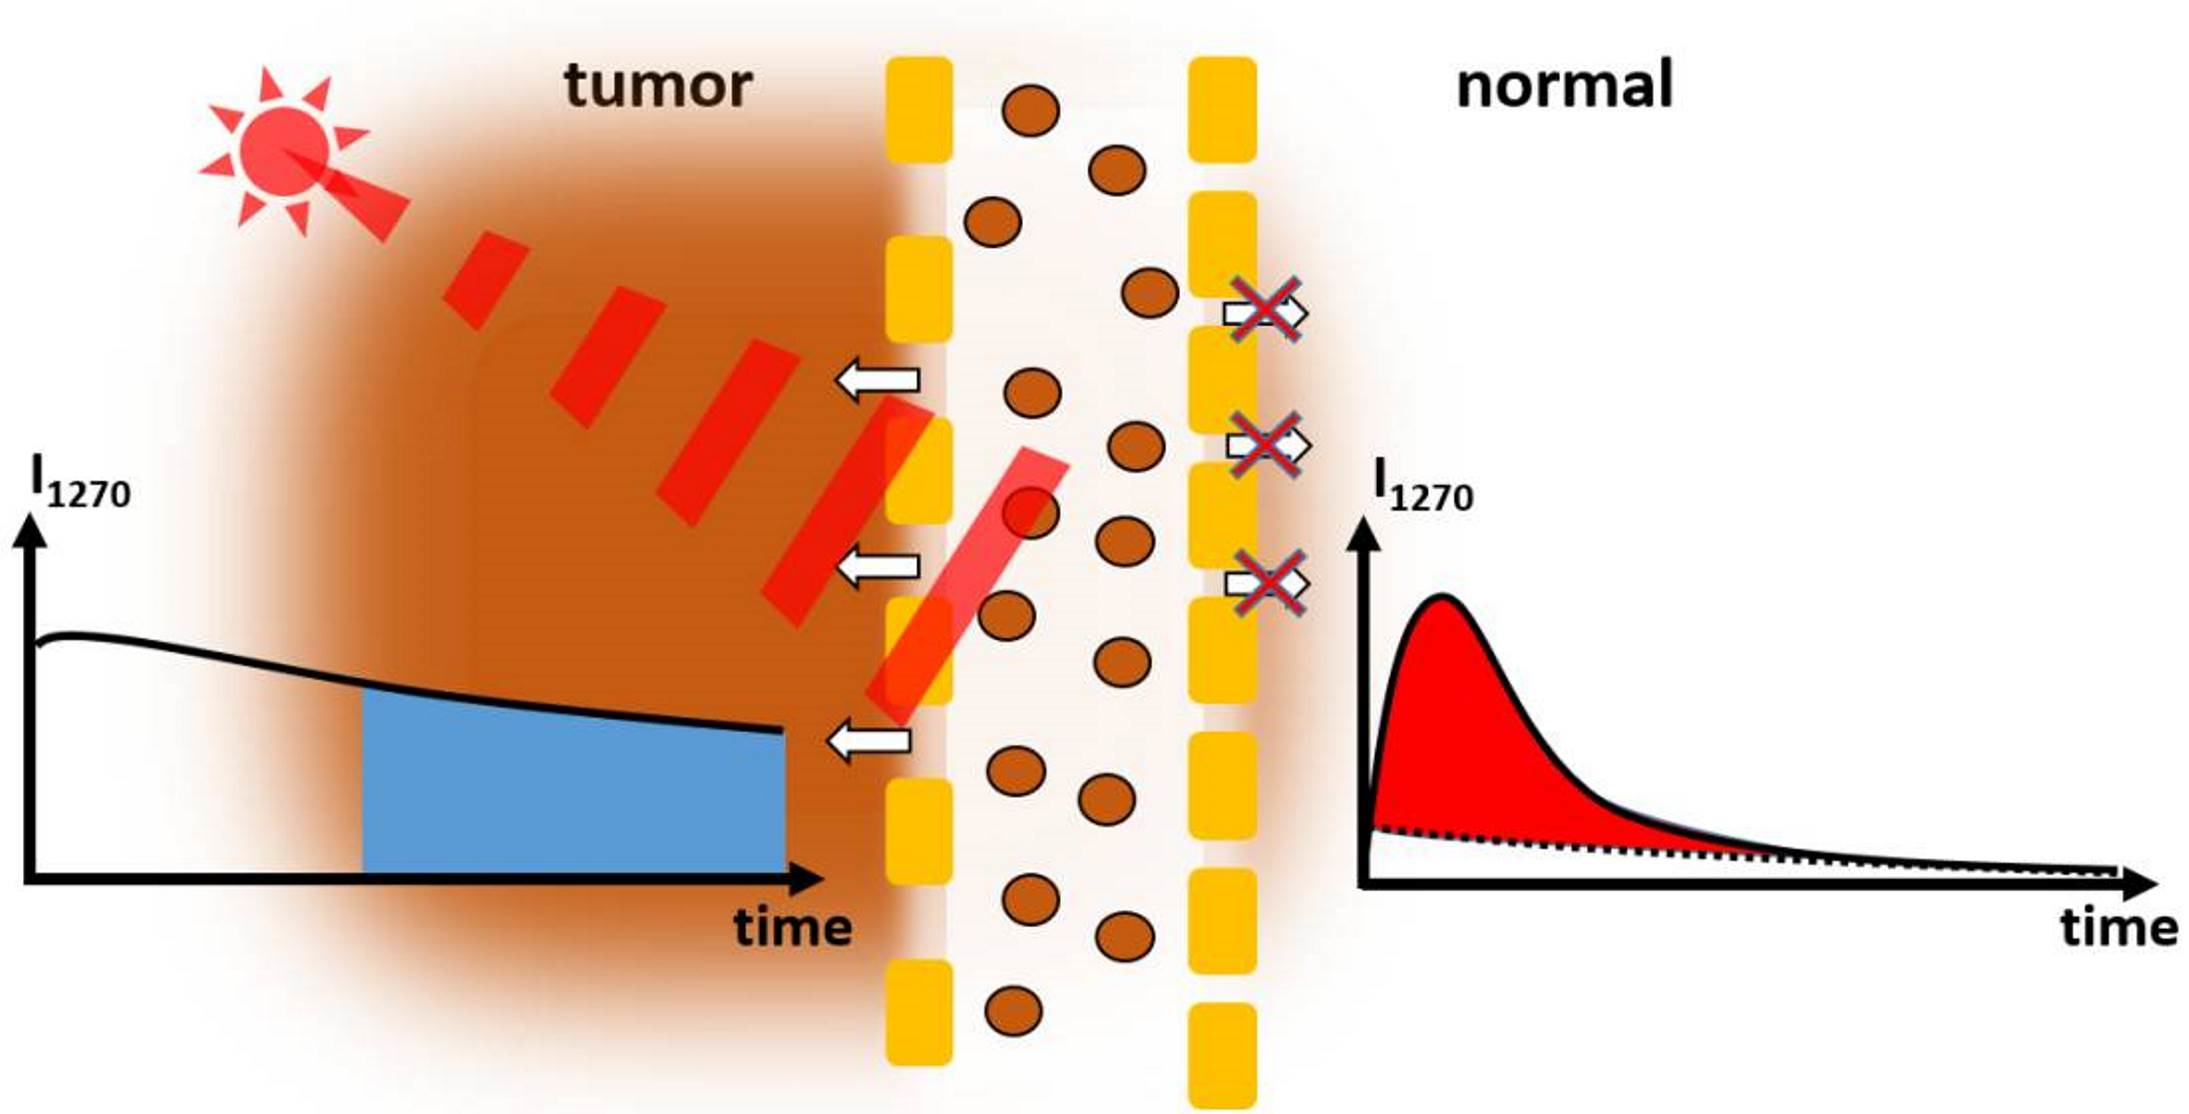
:The presented work addresses the influence of illumination intensity on the amount and locations of singlet oxygen generation in tumor tissue. We used time-resolved optical detection at the typical emission wavelength around 1270 nm and at 1200 nm where there is no singlet oxygen phosphorescence to determine the phosphorescence kinetics. The discussed data comprise in vivo measurements in tumor-laden HET-CAM and mice. The results show that illumination that is too intense is a major issue, affecting many PDT treatments and all singlet oxygen measurements in vivo so far. In such cases, photosensitization and oxygen consumption exceed oxygen supply, limiting singlet oxygen generation to the blood vessels and walls, while photosensitizers in the surrounding tissue will likely not participate. Being a limitation for the treatment, on one hand, on the other, this finding offers a new method for tumor diagnosis when using photosensitizers exploiting the EPR effect. In contrast to high-intensity PDT, some papers reported successful treatment with nanoparticular drugs using much lower illumination intensity. The question of whether, with such illumination, singlet oxygen is indeed generated in areas apart from vessels and walls, is addressed by numerical analysis. In addition, we discuss how to perform measurements at such low intensities.

1. Introduction
Singlet oxygen (1O2), the main mediator of photodynamic therapy (PDT), results from the interaction of a photosensitizer (PS) light—usually within the visible spectrum—and molecular oxygen. These three components are harmless individually, but in combination, they result in the formation of 1O2 and other reactive oxygen species [1,2,3]. Excitation of a PS results in a certain percentage in intersystem crossing to long-living triplet excited states with an energy little above that of 1O2. The PS can transfer its energy via Dexter transfer by colliding with molecular oxygen resulting in the generation of 1O2.
Due to its high reactivity, the lifetime of 1O2 in biological environments is rather short, predicted to be in the order of 40 ns [4,5] and confirmed to be shorter than 400 ns by direct observation [6,7]. Therefore, 1O2 has a maximum action radius of about 20 nm in biological environments, and consequently, in the classical sense of PDT, photosensitization affects only the cell where the PS is located. While being true in the sense of oxidation of cellular components, in tissue photosensitization in one cell also affects neighboring cells in terms of oxygen shortage [8,9,10]; the reason is simple: it is the high probability for chemical reactions of the 1O2 with cellular components, which finally causes cytotoxicity. Such reactions result in the consumption of both quenching components (resulting in cell death) and molecular oxygen. Since diffusion and solubility of oxygen in tissue [11] are much higher than in vessel walls [12], local lack of oxygen is compensated by diffusion from neighboring cells first, reducing the oxygen content there as well. Strictly spoken, partial pressure (pO2) is defined for gas mixtures; however, Henry’s Law relates the amount of solved oxygen to the resulting pO2 if there would be an atmosphere touching it, thus defining the partition coefficient. We prefer to use the pO2 throughout the system, as it makes the description more consistent.
While the pO2 in tumor tissue is in the range of 0.02 atm already because of the high metabolism of the cells, the local pO2 further drops with photosensitization. Depending on the amount of photosensitization this may soon result in local anoxia (pO2 < 0.001 atm).
It is exactly this PDT-induced anoxia that is in this paper’s center of interest. Recently, we reported the observation of this effect using the very weak yet characteristic phosphorescence of 1O2 in living mice [8]; exactly these results are finally the validation of our demand to rely on direct time-resolved spectroscopic supervision to observe 1O2. Even though this method comes along with some technical issues, the 1O2 phosphorescence correlates directly to the amount of existent 1O2; this is not the case for other related emissions, such as PS fluorescence.
As mentioned previously, in biological material, the vast majority of the generated 1O2 undergoes chemical reactions with cellular components; consequently, extravasated PS may fluoresce and phosphoresce while not generating any 1O2 due to the very low local pO2 caused by the photosensitization of the PS under investigation.
Former ideas to observe the impact of the local pO2 on the 1O2 generation pointed towards supervision of the ratio between PS fluorescence and phosphorescence intensities [13]; however, in very heterogeneous environments (as they occur in vivo), the reliability of steady-state observations is strongly limited. Due to the small action radius of 1O2, not every single illuminated PS necessarily contributes to the treatment impact. Biological material is highly structured and the detection volume cannot be reduced at will; therefore, signals observed in vivo will originate from PSs in a variety of very different environments, impossible to distinguish without at least some sort of temporal resolution. Among other questions, we aim to investigate the extent to which simple gating can cover this requirement in some cases.
Our group reported the first time-resolved 1O2 phosphorescence detection in a tumor in vivo through the skin of mice after systemic injection of the drug (in this case, chlorin e6 loaded PAMAM dendrimers) in 2016 [14]. In 2019, spatially resolved measurements of a HET-CAM model with implanted 3D-grown tumor cells [15] were published. The authors suggest a simplified method to analyze the data by just summing up certain time domains after excitation, which already gave very impressive insight into the sample under investigation. We will improve this - what we call - robust data analysis and apply it to new results gained after systemic injection of a polymer-PS conjugate into Sarcoma-bearing mice.
2. Materials and Methods
The PS-copolymer: The semitelechelic polymer precursor poly(HPMA)-NH-BOC was prepared by reversible addition–fragmentation chain transfer (RAFT) polymerization of HPMA (1.0 g, 6.98 mmol) in tert-butanol in the presence of tert-butyl N-[2-[(4-cyano-4-ethylsulfanylcarbothioylsulfanyl-pentanoyl)amino]ethyl] carbamate and 2,2′-azobis(4-methoxy-2,4-dimethylvaleronitrile) at 30 °C for 72 h.
The polymer precursor was isolated by precipitation in ethyl acetate, collected by filtration, washed with ethyl acetate and diethyl ether, and dried in a vacuum. The terminating trithiocarbonate group was removed as described by Perrier [16]. The BOC protecting group was removed by heating the poly(HPMA)-NH-BOC dissolved in distilled water (10 wt%/v) in a sealed ampoule at 150 °C for 1 h; then, the semitelechelic precursor poly(HPMA)-NH2 was obtained by lyophilization. The weight average molecular weight of the polymer precursor was Mw = 11,000 g/mol, the dispersity Đ = 1.05 and the polymer functionality of NH2 groups was 0.95. The polymer conjugate with pyroPheophorbide-a (pPheo) was prepared by reaction of semitelechelic poly(HPMA)-NH2 (400 mg) dissolved in 2.3 mL of DMSO with the pentafluorophenyl ester of pPheo (35 mg) in 2.1 mL dichloromethane.
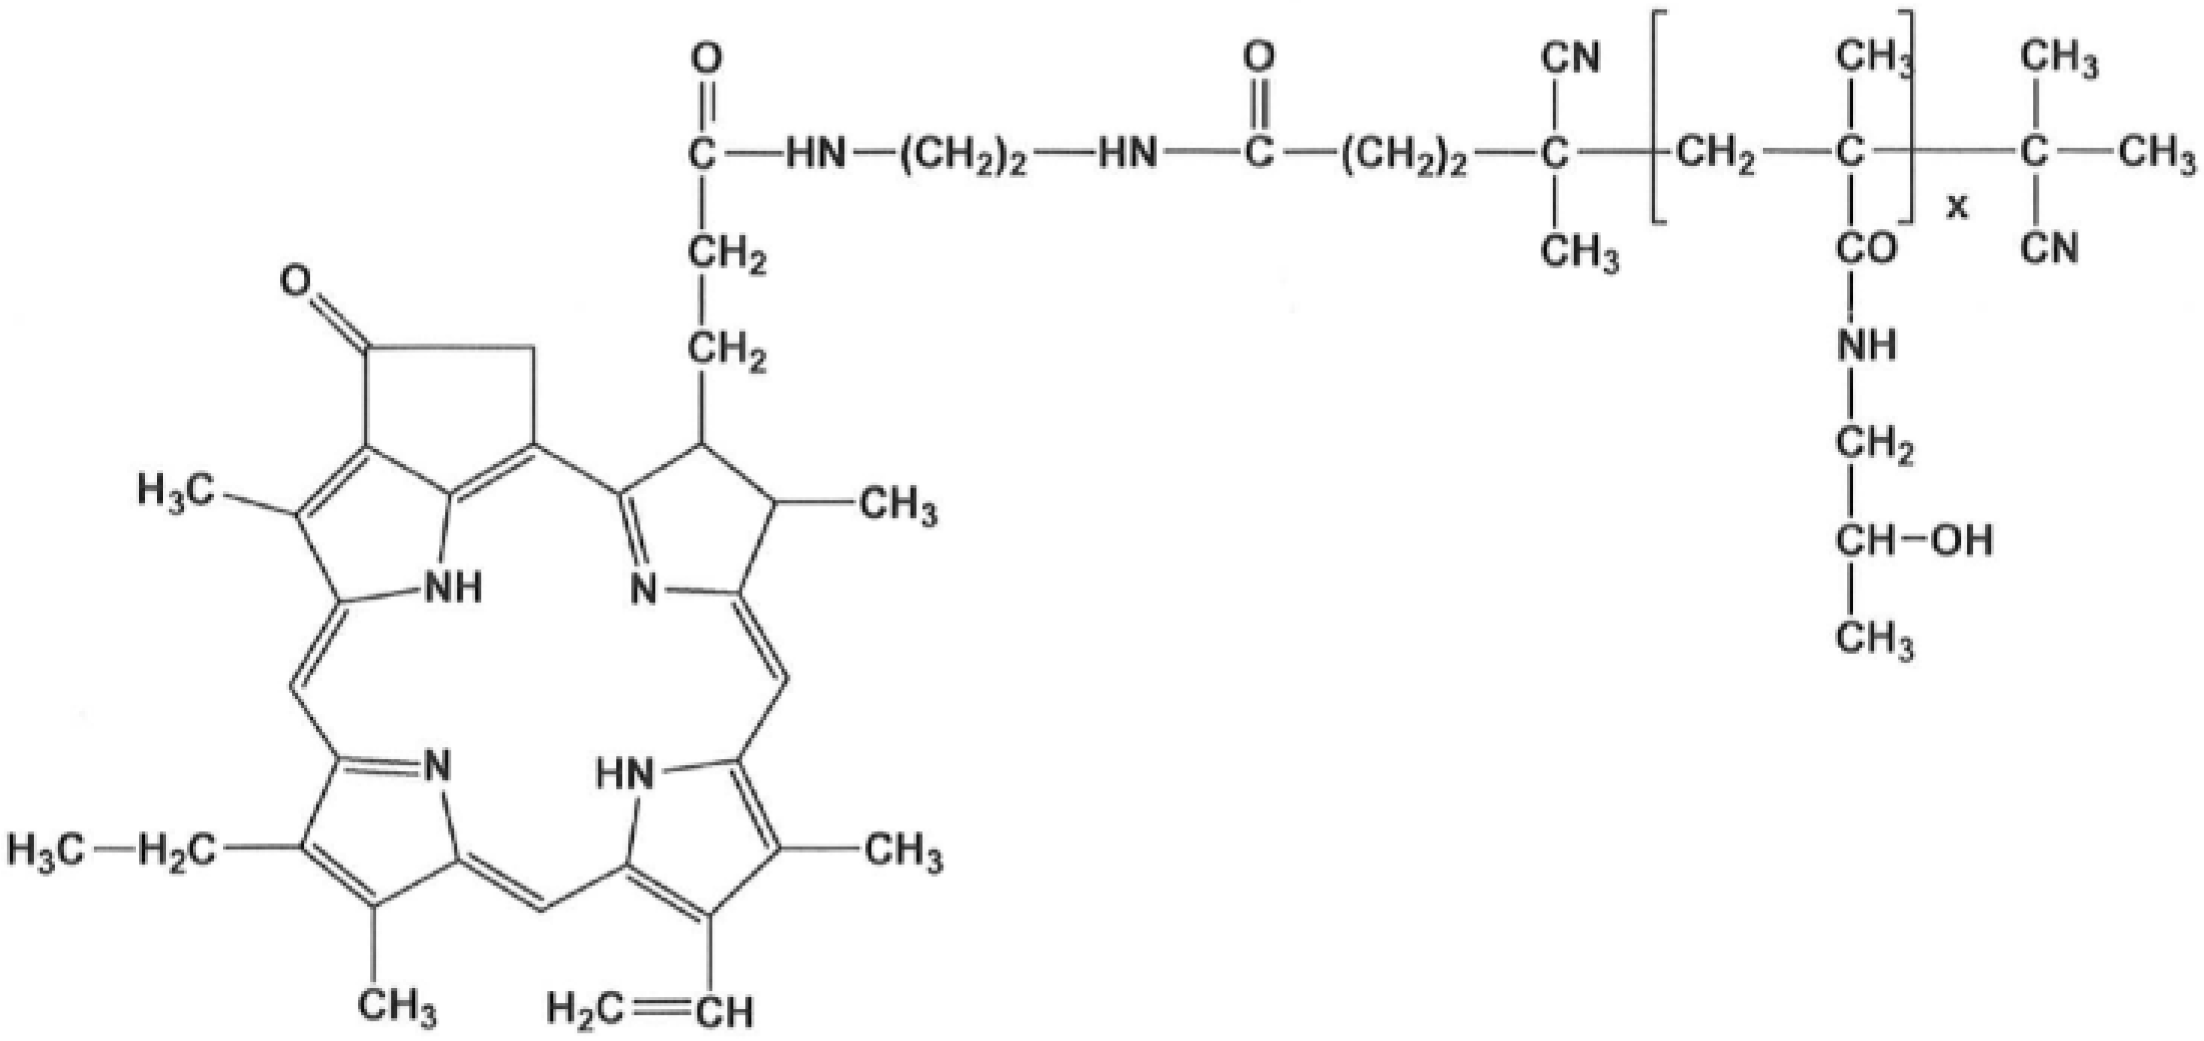
The reaction mixture was stirred for 24 h and was then purified on a chromatography column (Sephadex LH-20, Cytiva, Uppsala, Sweden) in methanol; 350 mg of the final product (Figure 1) was obtained after precipitation in diethyl ether. The content of pPheo in the polymer conjugate was 3.0 wt%.
This polymer conjugate exploits the so-called EPR (enhanced permeability and retention) effect, although the weight average molecular weight (~11,500 g/mol) is below the commonly known mass limit of ~40 kg/mol for the preferential accumulation in tumors. PolyHPMA-pPheo forms quite stable micellar structures, resulting in a bigger hydrodynamic size of the compound, big enough for the EPR effect. Using the Zetasizer Ultra (Malvern Panalytical, Malvern, UK) with its narrow-band filter around 635 nm to cut off PS fluorescence, a hydrodynamic diameter of around 20 nm was determined. The EPR effect results from differences in the structure of tumor capillaries versus those in normal tissues, the pathological properties of tumor blood vessels (high permeability), and the limited lymphatic drainage in solid tumors [17,18].
Phosphorescence detection: 1O2 phosphorescence and surrounding NIR luminescence in vivo were recorded with a TCMPC NIR detection system (SHB Analytics, Berlin, Germany) with fiber adapter and the NIR-PMT H10330-45 (Hamamatsu, Hamamatsu, Japan). The transmission of the two optics used in this work centers around 1200 and 1270 nm with a spectral half-width of ~40 nm. For exact data on their wavelength discrimination, see [8]. When we compare measurements at the different spectral ranges in one spot, they are identical in terms of transmission multiplied by the spectral sensitivity of the detector. A laser diode Red 65X (Necsel, Cypress, USA) driven by a custom-built controller, emits pulses (FWHM 240 ns–12 kHz) at around 658 nm with an average intensity of 7 mW. The measurement duration was 30 s. The three-furcated quartz fiber (Ceram Optec, Bonn, Germany) used for these measurements consists of one excitation fiber, three fibers for simultaneous fluorescence supervision with a C10083CA fiber spectrometer (Hamamatsu, Hamamatsu, Japan), and 127 single cores (185 μm) to transport the phosphorescence signal. All fibers merge in a single sealed tip to position it directly at the place of interest, while illumination and observation volumes automatically coincide.
Experiments in HET-CAM: For the experiments with tumor cell-cluster bearing HET-CAM Pfitzner et al. used the same detection system, but Foslip (Biolitec, Jena, Germany) as PS/carrier and illumination at 651 nm with 10 mW average intensity. These data have been recorded using 2D scanning, thus allowing for differentiation of the less structured HET-CAM surface. Details of the experiment can be found in Ref. [15], and we thank the authors for supplying the raw data for further analysis.
Experiments in mice: Six-week-old ddY mice from SLC Inc., Shizuoka, Japan, were kept in standard condition with water and murine chow ad libitum. Mouse sarcoma S180 cells, grown in the peritoneal cavities of ddY mice as an ascetic form were implanted subcutaneously (2∙106) in the dorsal skin of ddY mice to establish mouse S180 tumor models with a diameter of 6 to 8 mm after 7–10 days.
PolyHPMA-pPheo of 10 mg/kg (pPheo equivalent) dissolved in physiological saline (0.2 mL) was injected into the tail vein. Most results were gained 24 h after injection of polyHPMA-pPheo. Only for the comparison of signals from different origins, we use measurement data taken another 24 h after the first measurements at the now necrotic tumor.
Apart from anesthesia with isoflurane and shaving at the areas of interest, the animals did not experience any further treatment.
3. Results and Discussion
Figure 2 shows the results of measurements at three different spots of the same mouse 48 h after injection of the drug and 24 h after the first measurement at one tumor (the mouse was bearing two tumors). Illumination with around 1.5 J led to necrosis in the tumor after 24 h, covering the central part and about half the volume of the tumor.
While the PS fluorescence was the brightest in the necrotic tumor, there was no 1O2 phosphorescence detectable (Figure 2 bottom). The kinetics determined at 1270 nm, the characteristic wavelength of 1O2 phosphorescence, is identical to that determined at 1200 nm, where we only record the PS phosphorescence. The higher intensity at 1200 nm corresponds to the wavelength dependence of the PS phosphorescence (maximum at 932 nm [19]).
The kinetics determined at the normal tumor (Figure 2 middle) also show an intensive slow decaying signal, indicating anoxia. The signal comprises mainly PS phosphorescence of the extravasated drug [8]. In addition, in the first few µs after excitation (grey area) one can see that a weak 1O2 phosphorescence is also visible here; these signals from the tumor are very similar to those published previously [20].
In the healthy tissue, a very clear 1O2 signal and nearly no PS phosphorescence (Figure 2 top) are visible. The same is true for PS fluorescence (Figure 2 right). The kinetics can be described with the typical double exponential model using rise and decay times of 1.0 ± 0.2 µs and 7.5 ± 1.0 µs, and are thus closer to typical values for 1O2 luminescence in blood [21].
As an outcome, we can clearly distinguish healthy tissue from tumors and necrotic tumors. In both the latter cases, there is extravasated PS, resulting in very low pO2 upon illumination and, thus, mainly PS phosphorescence instead of 1O2 luminescence.
To answer the question of whether our assignment of the signal components is correct, a measurement with comparable detection but a higher selectivity is required, which allows us to distinguish between blood vessels, tumor tissue, and the rest; indeed, Pfitzner et al. [15] did such a measurement. We wanted to test whether our simple model with mainly three signal components (1O2 phosphorescence from the blood, PS phosphorescence from extravasated drug, and the ever-present short-time artifact in such measurements) would stand the test.
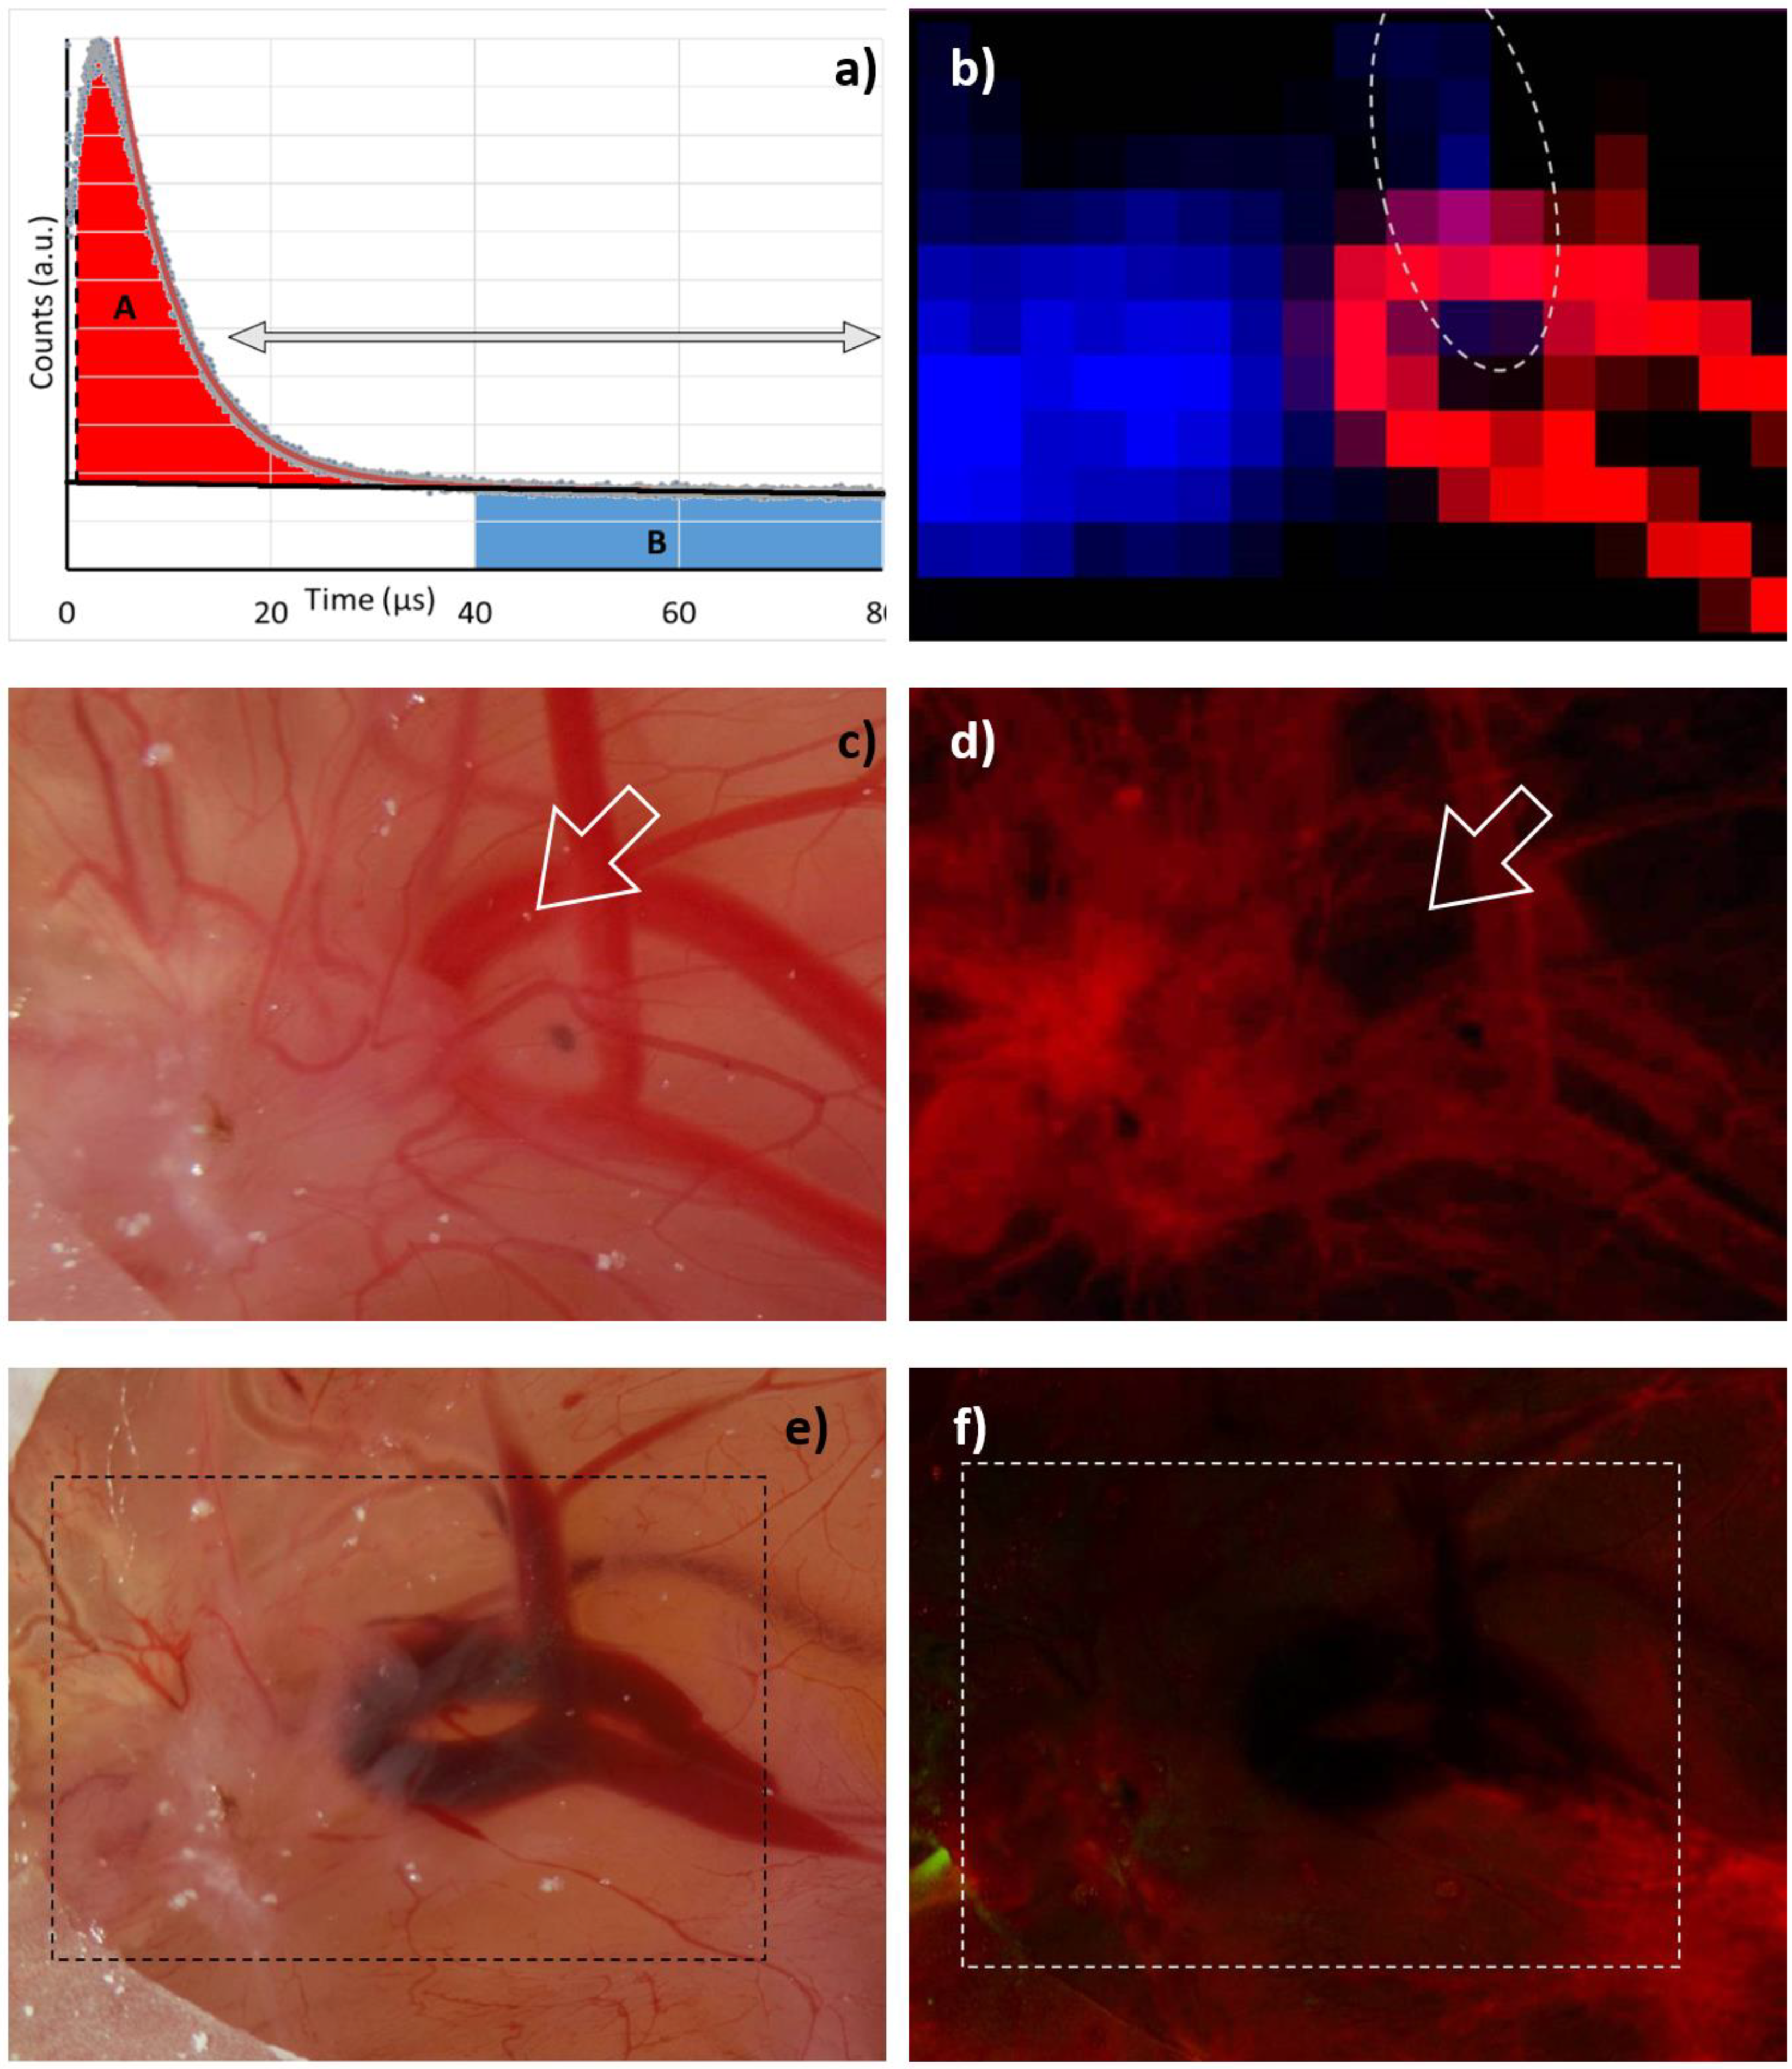
Our “robust data analysis” works as follows: Step 1 is a tail-fit starting at 15 µs and comprising two exponentially decaying signal components. The two decay times then represent the falling flank of the 1O2 phosphorescence in the blood and the long decaying signal of extravasated PS. Of course, any 1O2 phosphorescence originating outside the vessels would decay with the same long decay time, but as shown later, at the excitation intensities as we apply them so far, the vast majority of the signal is PS phosphorescence. In step 2, we subtract both the determined slow decaying signal component (monoexponential) and the background from the signal and integrate the resulting signal, omitting the first 1 µs. The result corresponds to the red area marked with A in Figure 3a. In step 3, we integrate the background-corrected signal, starting at a time when the 1O2 phosphorescence coming from the blood decayed. We chose 40 µs as a start point, hence being more than 5 times the PS triplet decay time in blood. The result corresponds to the blue area marked with B in Figure 3a.
Applying this procedure to the 2D phosphorescence data of the HET-CAM model carrying the implanted 3D tumor gives impressively clear results (Figure 3b). While 1O2 phosphorescence originates nearly exclusively from the blood vessels, the PS phosphorescence clearly indicates extravasated PS in areas suffering from anoxia, which coincide with the tumor; however, there is one small area outside the tumor, where both signals are present. The most likely explanation is a slight rupture of a blood vessel causing a certain leakage and thus PS extravasation. The fluorescence image (Figure 3d) supports this assumption and was taken right after the image shown in Figure 3c. Exactly at the point of interest, the blood vessel is fluorescing less than expected. After measurement, when all illuminated vessels face some rupture (Figure 3e), they all are darker in the fluorescence image (Figure 3f).
We may thus conclude that we find evidence to suggest that PS phosphorescence in tissue is nearly exclusively originating from extravasated PSs under local anoxia caused by their own photosensitizing activity. If this conclusion holds for tumors in mice, we have found a promising new method for tumor diagnostics.
We made a first “scanning” experiment in a sarcoma mouse model, with “scanning” set in quotations marks as it was performed by placing the fiber tip manually at 11 spots along a line crossing the tumor at the back of the mouse. The black dots in Figure 4 indicate the detection spots in the mouse image/fluorescence overlay in the background. They also represent the abscissa for the results of classical fitting of the determined data and the robust data analysis. The results for the quantitative evaluation of the 1O2 phosphorescence are nearly identical for both methods. Again, despite the fact that much more PS is located in the tumor, the 1O2 generation of these molecules is low; however, their phosphorescence allows reliable identification of tumors. Even better, for such a purpose there is no real need for time-resolution, gated detection is sufficient. All data in Figure 4 are corrected for thermal background, which for a typical measurement under the given conditions was Poisson-distributed noise with an average of 14 ± 0.5 counts per channel.
On the one hand, we found that EPR-based PS might potentially act as sensor molecules for a new kind of tumor diagnosis; however, on the other hand, one particular question arises: is it possible to detect 1O2 phosphorescence from the tumor tissue at all or will 1O2 always be limited to the blood vessels and their walls?
Most illumination intensities suggested for commercial PDT drugs (e.g., 100 mW/cm² for Foscan, according to the leaflet) are much higher than those we used for our measurements. One might speculate that most of such treatments cause destruction of the tumor vessels, which would certainly also have an impact on tumor development. This is, of course, a valid treatment strategy, but it should be intended.
It is worth noting that the group of Prof. Maeda reported a complete cure of a DBMA-induced rat breast cancer model in vivo using HPMA polymers loaded with Zn Protoporphyrin [22]. One injection and three illumination sessions with broadband light were able to eradicate the tumors. One interesting detail in this study is the very weak absorption of ZnPP in the wavelength region, which can penetrate the skin. Furthermore, the illumination with broad spectral range light results in only a very small part of the total light intensity actually exciting the PS. Correcting for the PS absorption, the effective excitation intensity was about 25 times lower than during our measurements. Of course, the illumination time was long enough to deliver a sufficient light dose; nevertheless, it would be interesting if 1O2 phosphorescence detection is possible at such intensities. In that context, two more questions arise: (1) Can we arrange a measurement with such low excitation intensity? (2) Will it be possible to detect 1O2 phosphorescence originating really from inside the tumor tissue? Fortunately, there is an answer to both questions:
- (1)
- In this work, we used the standard version of the H10330-45 PMT. There is a modified version available (SHB Analytics GmbH) with about three times higher etendue, while in the meantime, the quantum efficiency of the NIR-PMTs increased. Altogether, this allows a factor of 5 improvement in detection sensitivity; however, the solution for the remaining problem is the pulsed time-resolved detection. In the end, our detection consists of 360,000 excitation pulses. The SNR of the measurement remains unchanged, independent of the time duration between two pulses, which allows a free scaling of intensity, but at the cost of a long measurement duration.
- (2)
- Based on the Krogh tumor model that we justified in [8], we calculated signal kinetics that corresponds to differnt illumination intensities. The model comprises a blood vessel of 50 µm diameter, surrounded by 15 µm vessel wall and a further 45 µm of tumor tissue. The required parameters for oxygen diffusion and solubility, as well as the corresponding references, are summarized in Table 1. To keep the model simple, we fix pO2 = 0.12 atm in the vessel up to a radius of 20 μm, based on values reported in [23]; therefore, it has little influence that we approximate the diffusion coefficient of blood with the one of water.
Calculating the oxygen solubility of blood is difficult. Chistmas et. al. [28] reported the oxygen solubility in plasma to be comparable to that in water, but in reality, erythrocytes increase this value; however, this parameter only influences the simulation at the blood/vessel wall interface. It is certain that the value is bigger than that of the vessel wall. Regardless, lower oxygen diffusion and solubility in the wall are the most limiting factors for oxygen transport. For this simulation, we chose the solubility in blood to be comparable to that in tissue; this estimation comes with a big error margin, but the variation of this value by 50% in each direction had no recognizable impact on the results. Furthermore, we estimate the PS concentration in the tissue as 20 µM, the absorption cross-section at the excitation wavelength as 1.5∙10−16 cm2, and the 1O2 quantum yield in cells as 0.25 [8], so at about 50% of that in solution.
To adapt the simulation to other PSs, use a comparable product of photon flux density, absorption cross-section, concentration, and 1O2 quantum yield. As an example, a PS with half the singlet oxygen quantum yield gives the same results at twice the illumination intensity.
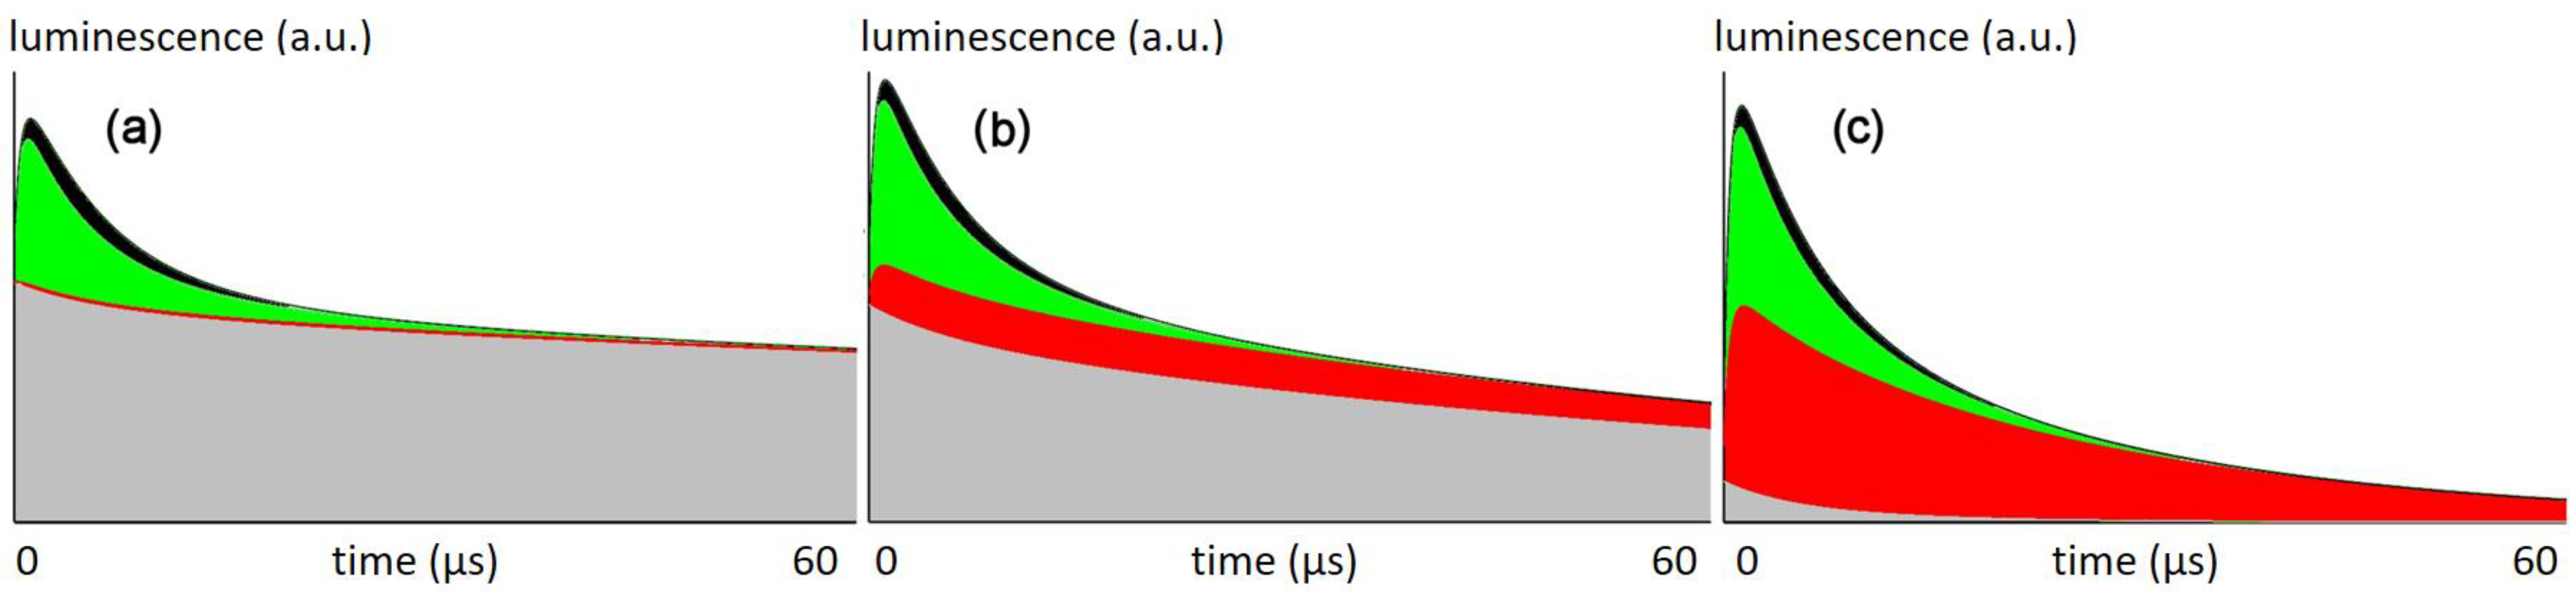
Finally, we assume 80% of the generated 1O2 to react with cellular components [7] and the drug concentration in blood to be at 10% of that in the tissue. This is a reasonable assumption because the drug clears from the blood but not from the tissue, resulting in this or a similar ratio at a certain time after injection. Figure 5 shows the calculated signal kinetics for excitation with 66 mW/cm² (the intensity used in this work), 6.6 mW/cm², and 0.66 mW/cm².
Assuming that all signal at 1270 nm is either PS phosphorescence or 1O2 phosphorescence, the local pO2 determines the corresponding triplet decaytime τT of the PS and thus the signal kinetics at each spot:
γ and ρ are constants, but proportional to the radiative rate constants of 1O2 and PS phosphorescence. Parameters such as setup geometry and sensitivity also affect these values, but since we only want to analyze the signal composition here, we only need the ratio of ρ/γ, which we may estimate as 6 ± 1 from measurements in various solutions and suspensions under varying pO2. The index 0 indicates a triplet decay time in the absence of oxygen. We set τΔ = 0.4 µs in the tissue, which is the values we found for this PS in cells in vitro [7]. For signal components originating in blood, we assume them to follow the kinetics found in blood before (1.5 and 7 µs) [21].
For a given illumination intensity, the simulation calculates the pO2 in concentric rings with the vessel being in the center. For each of these rings, the corresponding kinetics contribute to the overall signal, taking the volume of each ring as well as its PS concentration into account. Figure 5 shows the sum signal, separated into the share from different origins.
At the intensities that used so far, the 1O2 signal is originating nearly exclusively from the vessel wall, which explains their severe damage after illumination (Figure 3). According to the model, there is no 1O2 generated in the tumor tissue.
At lower intensities, similar to those applied by the Maeda group in the aforementioned study, the model shows 1O2 generation in the tissue, which may be the explanation of why these experiments were successful in curing the tumors. Further reduction of the illumination intensity finally results in a superior amount of the signal originating from the tumor tissue.
4. Conclusions
We could demonstrate with experiments in tumor-laden HET-CAM and mice, that photosensitization following high illumination intensities results in anoxia in all regions with extravasated PS, hence in a best-case scenario, the tumor tissue. In such regions, oxygen is exclusively available in the bloodstream and the vessel wall. High intensities in this context means just a few mW/cm², depending on the extinction, concentration and singlet oxygen quantum yield of the PS in the tissue. The bottleneck for photosensitization is the oxygen supply. Several consequences arise from this finding. On one hand, induced anoxia in combination with an EPR-based PS offers a promising new diagnostic tool for tumor detection with high contrast. On the other hand, one may assume that most practiced PDT treatments affect the blood vessels of the tumor only.
While at such high illumination intensities 1O2 phosphorescence detection and analysis is now possible, the more interesting cases are those with lower illumination that avoid anoxia; however, we could show that such measurements are useful and technically possible. We will follow up on these ideas in the near future.
Author Contributions
S.H. did measurements, data analysis, simulations and wrote most of the text. V.Š. and T.E. perfomed and described the synthesis of the polymeric drug. R.I. and J.F. prepared, handled and described the in vivo mouse model. All authors have read and agreed to the published version of the manuscript.
Funding
Steffen Hackbarth thanks the Brigitte and Konstanze Wegener Foundation for continued support. Vladimír Šubr and Tomáš Etrych thank the Academy of Sciences of Czech Republic (grant No. JSPS-22-01).
Institutional Review Board Statement
All animal procedures were performed in accordance with the Guidelines for Care and Use of Laboratory Animals of Sojo University, Kumamoto and approved by the Animal Ethics Committee of Sojo University, Kumamoto (No. 2020-P-009, approved date, 1 April 2021).
Acknowledgments
Our deepest respect for Hiroshi Maeda, a unique expert in the field of drug targeting. A long-term friend and supporter has left us. Much of the work reported here would not have been possible without his support.
Conflicts of Interest
Steffen Hackbarth is co-founder and shareholder of the university spin-off SHB Analytics GmbH.
References
- Röder, B. Photodynamic Therapy. In Encyclopedia Analytical Chemistry; Meyers, R.A., Ed.; John Wiley & Sons Ltd.: Chichester, UK, 2000; pp. 302–320. [Google Scholar]
- Van Straten, D.; Mashayekhi, V.; de Bruijm, H.S.; Oliveira, S.; Robinson, D.J. Oncologic Photodynamic Therapy: Basic Principles, Current Clinical Status and Future Directions. Cancers 2017, 9, 19. [Google Scholar] [CrossRef]
- Kwiatkowski, S.; Knap, B.; Przystupski, D.; Saczko, J.; Kędzierska, E.; Knap-Czop, K.; Kotlińska, J.; Michel, O.; Kotowski, K.; Kulbacka, J. Photodynamic therapy-mechanisms, photosensitizers and combinations. Biomed. Pharmacother. 2018, 106, 1098–1107. [Google Scholar] [CrossRef] [PubMed]
- Moan, J.; Berg, K. The photodegradation of porphyrins in cells can be used to estimate the lifetime of singlet oxygen. Photochem. Photobiol. 1991, 53, 549–553. [Google Scholar] [CrossRef] [PubMed]
- Dysart, J.S.; Patterson, M.S. Characterization of Photofrin photobleaching for singlet oxygen dose estimation during photodynamic therapy of MLL cells in vitro. Phys. Med. Biol. 2005, 50, 2597–2616. [Google Scholar] [CrossRef] [PubMed]
- Schlothauer, J.C.; Hackbarth, S.; Jäger, L.; Drobniewski, K.; Patel, H.; Gorun, S.M.; Röder, B. Time-resolved singlet oxygen luminescence detection under photodynamic therapy relevant conditions: Comparison of ex vivo application of two photosensitizer formulations. J. Biomed. Opt. 2012, 17, 115005. [Google Scholar] [CrossRef]
- Hackbarth, S.; Schlothauer, J.; Preuß, A.; Ludwig, C.; Röder, B. Time resolved sub-cellular singlet oxygen detection-ensemble measurements versus single cell experiments. Laser Phys. Lett. 2012, 9, 474–480. [Google Scholar] [CrossRef]
- Hackbarth, S.; Islam, W.; Fang, J.; Subr, V.; Röder, B.; Etrych, T.; Maeda, H. Singlet oxygen phosphorescence detection in vivo identifies PDT-induced anoxia in solid tumors. Photochem. Photobiol. Sci. 2019, 18, 1304–1314. [Google Scholar] [CrossRef]
- Liu, B.; Farrell, T.J.; Patterson, M.S. A dynamic model for ALA-PDT of skin: Simulation of temporal and spatial distributions of ground-state oxygen, photosensitizer and singlet oxygen. Phys. Med. Biol. 2010, 55, 5913–5932. [Google Scholar] [CrossRef]
- Zhu, T.C.; Kim, M.M.; Liang, X.; Finlay, J.C.; Busch, T.M. In vivo singlet oxygen threshold doses for PDT. Photonics Lasers Med. 2015, 4, 59–71. [Google Scholar] [CrossRef]
- Dutta, A.; Popel, A.S. A Theoretical Analysis of Intracellular Oxygen Diffusion. J. Theor. Biol. 1995, 176, 433–445. [Google Scholar] [CrossRef]
- Sasaki, N.; Horinouchi, H.; Ushiyama, A.; Minamitani, H. A New Method for Measuring the Oxygen Diffusion Constant and Oxygen Consumption Rate of Arteriolar Walls. Keio J. Med. 2012, 61, 57–65. [Google Scholar] [CrossRef] [PubMed] [Green Version]
- Sterenborg, H.J.C.M.; de Wolf, J.W.; Koning, M.; Kruijt, B.; van den Heuvel, A.; Robinson, D.J. Phosphorescence-Fluorescence ratio imaging for monitoring the oxygen status during photodynamic therapy. Opt. Express 2004, 12, 1873–1878. [Google Scholar] [CrossRef] [PubMed] [Green Version]
- Pfitzner, M.; Schlothauer, J.C.; Bastien, E.; Hackbarth, S.; Bezdetnaya, L.; Lassalle, H.-P.; Röder, B. Prospects of in vivo singlet oxygen luminescence monitoring: Kinetics at different locations on living mice. Photodiagn. Photodyn. Ther. 2016, 14, 204–210. [Google Scholar] [CrossRef] [PubMed]
- Pfitzner, M.; Preuss, A.; Röder, B. A new level of in vivo singlet molecular oxygen luminescence measurements. Photodiagn. Photodyn. Ther. 2020, 29, 101613. [Google Scholar] [CrossRef]
- Perrier, S.; Takolpuckdee, P.; Mars, C.A. Reversible Addition−Fragmentation Chain Transfer Polymerization: End Group Modification for Functionalized Polymers and Chain Transfer Agent Recovery. Macromolecules 2005, 38, 2033–2036. [Google Scholar] [CrossRef]
- Maeda, H.; Sawa, T.; Konno, T. Mechanism of tumor-targeted delivery of macromolecular drugs, including the EPR effect in solid tumor and clinical overview of the prototype polymeric drug SMANCS. J. Control Release 2001, 74, 47–61. [Google Scholar] [CrossRef]
- Fang, J.; Nakamura, H.; Maeda, H. The EPR effect: Unique features of tumor blood vessels for drug delivery, factors involved, and limitations and augmentation of the effect. Adv. Drug Delivery Rev. 2011, 63, 136–151. [Google Scholar] [CrossRef]
- Krasnovski, A.A., Jr.; Neverov, K.V.; Egorov, S.Y.; Roeder, B.; Levald, T. Photophysical studies of pheophorbide a and pheophytin a. Phosphorescence and photosensitized singlet oxygen luminescence. J. Photochem. Photobiol. B Biol. 1990, 5, 245–254. [Google Scholar] [CrossRef]
- Fang, J.; Šubr, V.; Islam, W.; Hackbarth, S.; lIslam, R.; Etrych, T.; Ulbrich, K.; Maeda, H. N-(2-hydroxypropyl)methacrylamide polymer conjugated pyropheophorbide-a, a promising tumor-targeted theranostic probe for photodynamic therapy and imaging. Eur. J. Pharm. Biopharm. 2018, 130, 165–176. [Google Scholar] [CrossRef]
- Looft, A.; Pfitzner, M.; Preuß, A.; Röder, B. In vivo singlet molecular oxygen measurements: Sensitive to changes in oxygen saturation during PDT. Photodiagn. Photodyn. Ther. 2018, 23, 325–330. [Google Scholar] [CrossRef]
- Fang, J.; Liao, L.; Yin, H.; Nakamura, H.; Subr, V.; Ulbrich, K.; Maeda, H. Photodynamic therapy and imaging based on tumor-targeted nanoprobe, polymer-conjugated zinc protoporphyrin. Future Sci. OA 2015, 1, FSO4. [Google Scholar] [CrossRef] [PubMed] [Green Version]
- Collins, J.-A.; Rudenski, A.; Gibson, J.; Howard, L.; O’Driscoll, R. Relating oxygen partial pressure, saturation and content: The haemoglobin-oxygen dissociation curve. Breathe 2015, 11, 194–201. [Google Scholar] [CrossRef] [PubMed] [Green Version]
- Liu, C.Y.; Eskin, S.G.; Hellums, J.D. The oxygen permeability of cultured endothelial cell monolayers. Adv. Exp. Med. Biol. 1994, 345, 723–730. [Google Scholar] [CrossRef] [PubMed]
- Bentley, T.B.; Pittmann, R.N. Influence of temperature on oxygen diffusion in hamster retractor muscle. Am. J. Physiol. 1997, 272, H1106–H1112. [Google Scholar] [CrossRef]
- Vadapalli, A.; Pittman, R.N.; Popel, A.S. Estimating oxygen transport resistance of the microvascular wall. Am. J. Physiol. Heart Circ. Physiol. 2000, 279, 657–671. [Google Scholar] [CrossRef] [Green Version]
- Wagner, B.A.; Venkataraman, S.; Buettner, G.R. The rate of oxygen utilization by cells. Free Radic. Biol. Med. 2011, 51, 700–712. [Google Scholar] [CrossRef] [Green Version]
- Christmas, K.M.; Bassingthwaighte, J.B. Equations for O2 and CO2 solubilities in saline and plasma: Combining temperature and density dependences. J. Appl. Physiol. 1985, 122, 1313–1320. [Google Scholar] [CrossRef] [Green Version]
Figure 1.
The semitelechelic polyHPMA-pPheo conjugate was used for the experiments in mice.

Figure 2.
Phosphorescence kinetics in vivo recorded for healthy tissue including a typical fit (top), at a tumor (middle) and at a necrotic tumor (bottom) for wavelengths around 1200 nm (green) and 1270 nm (red). Detection spots are indicated in the fluorescence image overlay of the mouse with a cutoff at 30% of maximum intensity (right).

Figure 3.
(a) Robust data analysis based on a double exponential decay fit (red curve) within the time range indicated by the arrows (15–80 µs). The longer decay time from this fit is considered to be the lifetime of PS phosphorescence in tissue (black). The relative 1O2 intensity is determined from the difference between signal and PS phosphorescence (light red marked area - A) omitting the first 1 µs. Relative PS phosphorescence intensity is determined from the blue marked area (B) from 40 to 80 µs. (b) 2D plot of A (red) and B (blue) as determined at gritted positions across the HET-CAM area. Values below 10% of the corresponding maximum value are black. Photograph and fluorescence image of the investigated area before (c,d) and after (e,f) measurement.

Figure 4.
Results of measurements at 11 spots (black dots) along a line across the mouse skin, crossing the tumor. The overlay with the fluorescence image of the mouse indicates the exact locations. PS phosphorescence intensity was determined by summing up the signal in the range of 40–80 µs after laser pulse, corrected for background (blue). Relative 1O2 intensity is shown for two ways to analyze the data: the amplitude of the 1O2 component determined by fitting of the kinetics (green) and robust data analysis as explained in the text (red). For detection spots 6 and 11 the determined phosphorescence kinetics are shown on the right (indicated by the arrows), where red and blue areas are again the graphical representation of the values determined by the robust data analysis.

Figure 5.
Simulated data for the phosphorescence kinetics in tumors for illumination intensities of (a) 66 mW/cm², (b) 6.6 mW/cm² and (c) 0.66 mW/cm² based on the simulation parameters mentioned in the text and Table 1. Graphs show the calculated luminescence signals for the first 60 µs after excitation pulse, the arbitrary units used here will scale with illumination intensity. Colors indicate signal contributions according to origin and type: 1O2 in blood (black), 1O2 in vessel wall (green), 1O2 in surrounding tissue (red) and total PS phosphorescence (grey).


Publisher’s Note: MDPI stays neutral with regard to jurisdictional claims in published maps and institutional affiliations. |
© 2022 by the authors. Licensee MDPI, Basel, Switzerland. This article is an open access article distributed under the terms and conditions of the Creative Commons Attribution (CC BY) license (https://creativecommons.org/licenses/by/4.0/).
Share and Cite
MDPI and ACS Style
Hackbarth, S.; Islam, R.; Šubr, V.; Etrych, T.; Fang, J. Singlet Oxygen In Vivo: It Is All about Intensity. J. Pers. Med. 2022, 12, 891. https://doi.org/10.3390/jpm12060891
AMA Style
Hackbarth S, Islam R, Šubr V, Etrych T, Fang J. Singlet Oxygen In Vivo: It Is All about Intensity. Journal of Personalized Medicine. 2022; 12(6):891. https://doi.org/10.3390/jpm12060891
Chicago/Turabian StyleHackbarth, Steffen, Rayhanul Islam, Vladimír Šubr, Tomáš Etrych, and Jun Fang. 2022. "Singlet Oxygen In Vivo: It Is All about Intensity" Journal of Personalized Medicine 12, no. 6: 891. https://doi.org/10.3390/jpm12060891
Note that from the first issue of 2016, this journal uses article numbers instead of page numbers. See further details here.