Article

Mineralogical, Geochemical and Geotechnical Study of BCV 2017 Bentonite—The Initial State and the State following Thermal Treatment at 200 °C

1
Czech Geological Survey, Geologická 6, 15200 Prague, Czech Republic
2
Czech Radioactive Waste Repository Authority (SÚRAO), Dlážděná 6, 11000 Prague 1, Czech Republic
3
Faculty of Civil Engineering, Czech Technical University, Thakurova 7, 16629 Prague 6, Czech Republic
4
Faculty of Science, Charles University, Albertov 6, 12843 Prague 2, Czech Republic
5
Institute of Geonics, Academy of Sciences of the Czech Republic, Studentská 1768, 70800 Ostrava-Poruba, Czech Republic
6
Hainan Institute of Zhejiang University, Sanya 572025, China
7
Ocean College, Zhejiang University, Zhoushan 316021, China
*
Author to whom correspondence should be addressed.
Minerals 2021, 11(8), 871; https://doi.org/10.3390/min11080871
Submission received: 30 June 2021 / Revised: 5 August 2021 / Accepted: 7 August 2021 / Published: 12 August 2021

Abstract

:
Bentonites are considered to be the most suitable materials for the multibarrier system of high-level radioactive waste repositories. Since BCV bentonite has been proved to be an ideal representative of Czech Ca-Mg bentonites in this respect, it has been included in the Czech Radioactive Waste Repository Authority (SÚRAO) buffer and backfill R&D programme. Detailed knowledge of processes in the material induced by thermal loading provides invaluable assistance regarding the evolution of the material under repository conditions. Samples of both original BCV 2017 bentonite and the same material thermally treated at 200 °C were characterised by means of chemical analysis, powder X-ray diffraction, infrared spectroscopy, thermal analysis, cation exchange capacity, specific surface area (BET) measurements, the determination of the swell index, the liquid limit, the swelling pressure and water retention curves. The smectite in BCV 2017 bentonite comprises Ca-Mg montmorillonite with a significant degree of Fe3+ substitution in the octahedral sheet. Two main transformation processes were observed following heating at 200 °C over 27 months, the first of which comprised the dehydration of the montmorillonite and the subsequent reduction of the 001 basal distance from 14.5 Å (the original BCV 2017) to 9.8 Å, thus indicating the absence of water molecules in the interlayer space. The second concerned the dehydration and partial dehydroxylation of goethite. With the exception of the dehydration of the interlayer space, the PXRD and FTIR study revealed the crystallochemical stability of the montmorillonite in BCV 2017 bentonite under the selected experimental conditions. The geotechnical tests indicated no major changes in the mechanical properties of the thermally treated BCV 2017 bentonite, as demonstrated by the similar swelling pressure values. However, the variation in the swell index and the gradual increase in the liquid limit with the wetting time indicated a lower hydration rate. The retention curves consistently showed the lower retention capacity of the thermally treated samples, thus indicating the incomplete re-hydration of the thermally treated BCV 2017 exposed to air humidity and the difference in its behaviour compared to the material exposed to liquid water.

1. Introduction

Bentonites are considered to be the most suitable materials for the multibarrier system of high-level radioactive waste (HLRW) repositories [1,2,3,4]. The favourable behaviour of bentonites is mainly influenced by the presence of smectites having unique physical and physico-chemical properties [3,5]. The stability of smectites is a key factor for all concepts that consider the use of bentonites in the engineered barriers of nuclear waste repositories [3]. The physico-chemical properties of smectites can be deteriorated by interaction with groundwater coming from the surrounding rock mass and by the heat generated from the radioactive decay of the waste [5,6,7,8,9].
The Czech deep geological repository concept is based on the use of bentonites and montmorillonite-rich clays of Czech origin as the buffer and backfill materials. Research work has been conducted to date primarily with respect to four Czech bentonites, each of which is of the calcium/magnesium (Ca/Mg) type. The first bentonite to be tested was extracted from the Rokle deposit, followed by industrially processed B75 bentonite, BAM—a mixture of Rokle, Stránce and Černý vrch bentonites and BCV—bentonite from the Černý vrch deposit.
Following the pilot characterisation of the various types of bentonites and montmorillonite-rich clays, experiments focused on the construction and operation of physical models of the buffer (Mock-Up-CZ and Mock-up Josef). The Mock-Up-CZ experiment comprised a physical model that followed the KBS-3V arrangement using Czech Rokle bentonite in the form of compressed blocks. A heater enabled the heating of the bentonite layer to a maximum of 95 °C. This physical model conducted in a laboratory environment was artificially saturated with synthetic granitic water. A detailed description of the experiment and the results can be found in [10].
The Mock-up Josef experiment [11] was installed in the real rock environment of the Josef Underground Research Laboratory. The project continues to provide valuable information on the behaviour of B75 bentonite that has been subjected to continuous loading in a similar way to that anticipated under deep geological repository conditions. The dismantling of this project is planned for 2022.
The BCV 2017 bentonite considered in this study comprises an industrially processed (dried and milled) bentonite extracted from the Černý vrch deposit and processed at the Keramost Ltd. Obrnice plant, Most, Czech Republic.
BCV bentonite was first subjected to testing in 2017 [12]. The basic characteristics of this material have been summarised in [13]. BCV bentonite is currently being used in the HotBENT full-scale experiment [14], the Interaction physical in situ models experiment underway at the Bukov underground research facility [15], the BEACON European project [16] and the Engineering barrier 200C project [17].
The Czech Radioactive Waste Repository Authority (SÚRAO) anticipates that this material will be subjected to extensive testing in a number of upcoming research projects and demonstration and full-scale experiments aimed at determining the bentonite to be used in the future Czech deep geological repository for used nuclear fuel.
Most concepts currently consider temperatures up to 100 °C to prevent water boiling and to prevent possible changes in the bentonite which could lead to decreased performance. The aim of presented research is to investigate the potential for increasing the temperature limit of the bentonite buffer. This could lead to significant cost savings due to increased disposal capacity. Moreover, it has the potential to enhance the safety margin in case of emergency events.
This paper presents a laboratory experiment based on the long-term heating of BCV 2017 bentonite at 200 °C. Special attention was drawn to investigate what changes in terms of impact on the barrier performance will happen at temperatures up to 200 °C. Even if there are mineralogical changes happening, it does not mean that material is losing its required properties (such as sealing or retention action) to perform its function fully (or in reduce manner). It is important to note that an increase in temperature up to 200 °C affects only a very small part of the barrier. A detailed description of the various properties affected by thermal treatment will provide invaluable assistance regarding the evolution of the material under repository conditions.

2. Materials and Methods
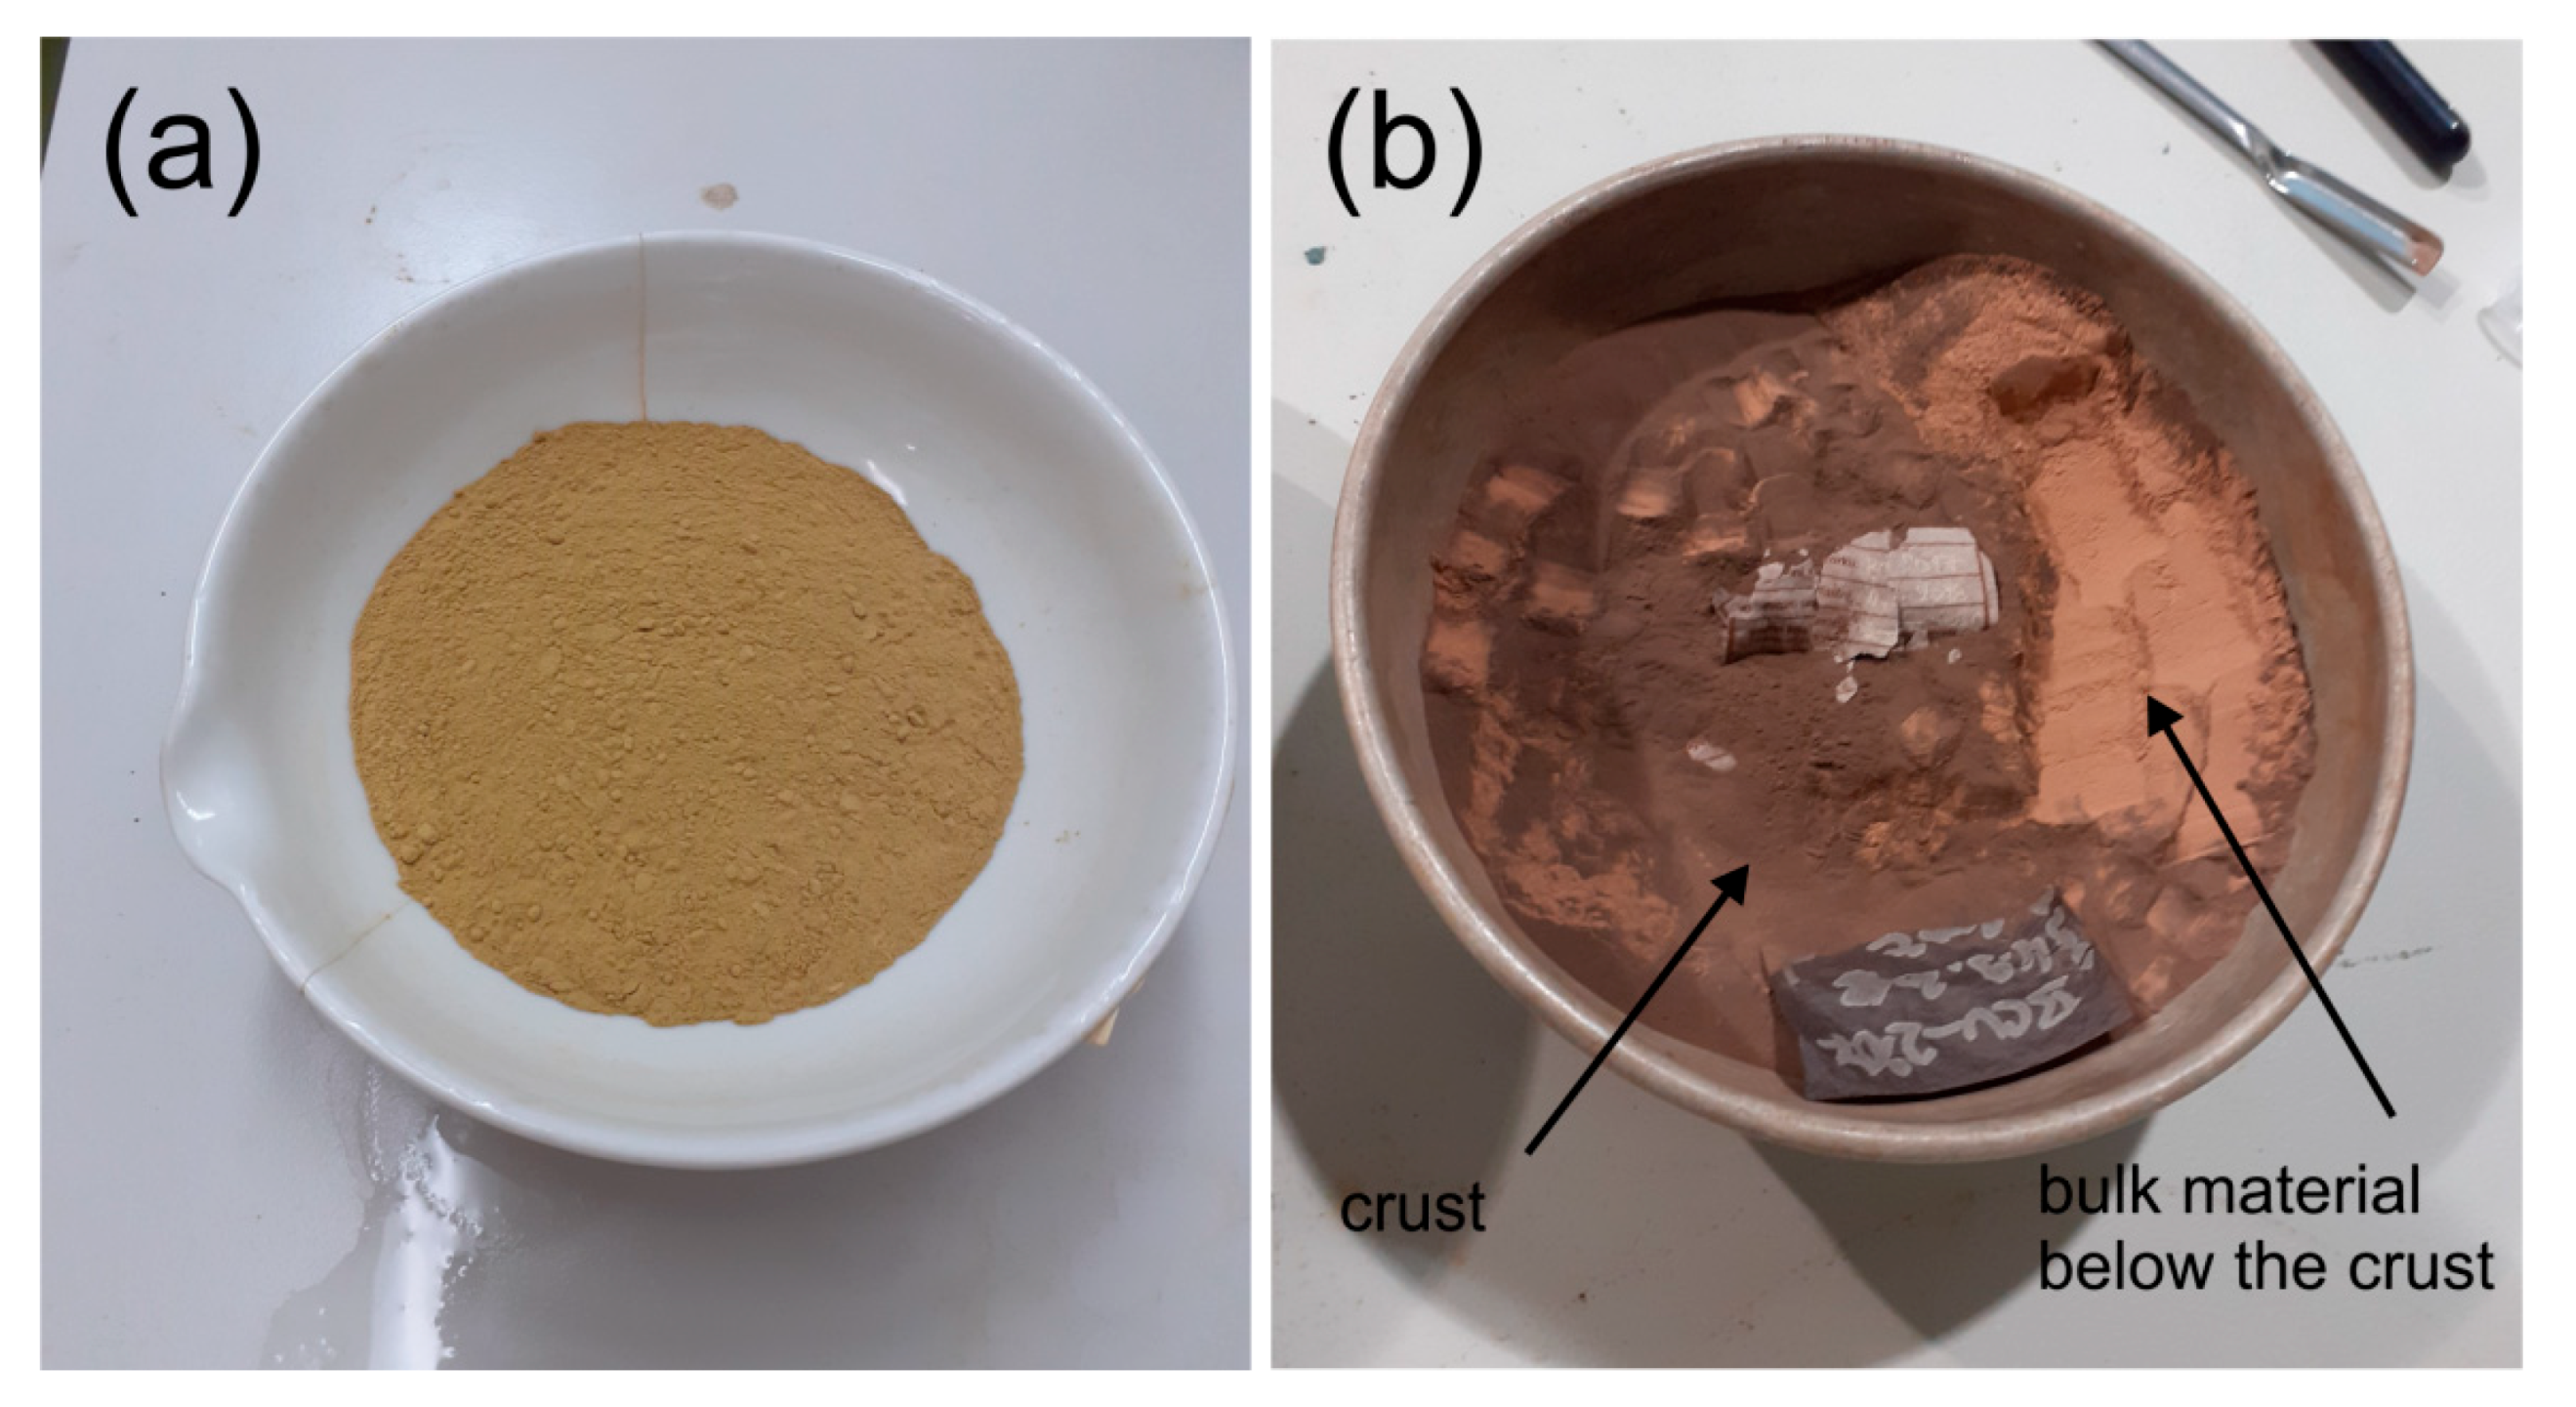
2.1. Material

The subject of this study comprised BCV 2017 bentonite (denoted “original BCV 2017”) and the same material subjected to heating at 200 °C for 12, 15 and 27 months (“thermally-treated BCV 2017”).

2.2. Analytical Techniques

The chemical and mineralogical composition of the experimental material (before and after heating at 200 °C) was studied via the powder X-ray diffraction (PXRD), infrared spectroscopy (FTIR), cation exchange capacity (CEC), thermal analysis and specific surface area measurement (BET). Selected geotechnical characteristics including the swell index, liquid limit, swelling pressure and water retention curves were subsequently determined.

2.2.1. Chemical Analysis and Powder X-ray Diffraction (PXRD)

The chemical composition of the original and thermally treated BCV 2017 bentonite was determined via standard wet chemistry in the laboratories of the Czech Geological Survey, Prague. The material was not subjected to any form of treatment prior to analysis except for drying at room temperature and grinding by McCrone mill. The chemical composition of solid samples was determined by standard techniques for silicate analysis summarized by Dempírová et al. [18]. SiO2, Al2O3 and FeO were determined by titration. TiO2, Fe2O3, MgO, MnO, CaO, Na2O and K2O were analysed by atomic absorption spectrometry (AAS) after decomposition of silicate matrix in a mixture of HF, HNO3 and H2SO4. P2O5 was measured photometrically. Carbonate carbon was measured by infrared spectroscopy as CO2 evolved from the sample by its reaction with orthophosphoric acid. C and S were determined by infrared spectroscopy after heating of the sample to 1350–1450 °C. The humidity (H2O) was quantified as a loss in weight by drying at 110 °C until a constant mass of the sample was reached. For determination of the structural water (H2O+), the sample is heated at 1050 °C until a constant mass was reached. The H2O+ content was calculated by subtracting of volatile components (CO2, C, S) from the weight loss obtained by heating at 1050 °C. The relative 2σ uncertainties did not exceed 1% (SiO2), 2% (FeO), 5% (Al2O3, K2O, Na2O), 7% (TiO2, MnO, CaO), 6% (MgO) and 10% (Fe2O3, P2O5) [18].
The mineralogical composition of the original and the thermally treated BCV 2017 bentonite was studied via powder X-ray diffraction (PXRD) analysis. The diffraction data were collected in a Bragg–Brentano reflection geometry on a Bruker D8 diffractometer equipped with a LynxEye XE detector. CoKα radiation and a 10 mm variable divergence slit were applied. The data were collected in the angular range 4–80° of 2Θ, with a 0.015° step size and a time of 5 s per step. The semiquantitative phase analysis was conducted by means of the Rietveld method applying the BGMN program with Profex 4.0 [19] as the graphical user interface. The models of the crystal structures used in the refinement were taken from the Profex 4.0 program internal database. The amorphous phase content was not quantified.

2.2.2. Infrared Spectroscopy

The infrared (IR) spectra of both the original and the thermally treated BCV 2017 material were recorded on a Nicolet 6700 FTIR spectrometer (Thermo Scientific, Waltham, MA, USA) equipped with a DTGS/KBr detector. Two IR spectroscopy techniques were used for the evaluation of the structural changes in the BCV 2017 due to long-term heating at 200 °C, i.e., the pressed bromide (KBr) pellet and the attenuated total reflection (ATR) methods. Samples of 2 and 0.5 mg were homogenised in an agate mortar with 200 mg of optically pure KBr for the recording of the optimal spectra in the 4000–3000 cm−1 and 4000–400 cm−1 regions, respectively. A total of 64 scans were taken with a resolution of 4 cm−1 for each spectrum. Prior to measurement, the KBr disks intended for the spectral region of 4000–3000 cm−1 were heated at 150 °C for 24 h so as to eliminate the effect of surface-bound water. The reflective ATR technique was included in the experimental study since it allows for the direct measurement of powdered samples. The ATR spectra were collected using a single-reflective ATR accessory/Smart Orbit Diamond Crystal/ in the absorbance mode. A total of 32 scans were taken in the range 4000–400 cm−1 with a spectral resolution of 4 cm−1 for each spectrum. The final IR spectra were adjusted by means of ATR correction.

2.2.3. Cation Exchange Capacity (CEC)

The cation exchange capacity was determined using the Cu(II)-triethylenetetramine method according to [20]. Thus, 250 mg of the sample was mixed with 10 mL of 0.01 M of Cu(II)-triethylenetetramine. The samples were shaken for at least 30 min and then centrifuged at 3000 rpm for 10 min. A volume of 3 mL of the supernatant was then transferred into cuvettes and the concentration of the Cu(II) complex was measured via spectrophotometry. The solution absorbance was measured at 577 nm. The amount of the copper complex adsorbed was calculated from the concentration differences. The proportion of the main exchangeable cations (Na+, K+, Ca2+, Mg2+) was analysed in the supernatant solution by means of atomic absorption (Cu, Mg) and atomic emission (Ca, Na, K) spectroscopy.

2.2.4. Thermal Analysis Measurement

Simultaneous thermal analysis (TG-DTA) combined with evolved gas analysis (EGA) was employed for the study of the bentonite samples. The TG-DTA analysis was conducted using a Setsys Evolution device (Setaram, Caluire, France) coupled with an Omnistar Mass Spectrometer (Pfeiffer, Asslar, Germany). The experiments were performed within a temperature range of 20 °C to 1000 °C in an air atmosphere with a flow rate of 20 mL·min−1. The heating rate was 10 K·min−1. The evolved gases CO2 and H2O were monitored by means of the Mass Spectrometer.

2.2.5. Specific Surface Area (BET)

The specific surface area and the distributions of the volume mesopores were measured using a 3Flex analyser (Micromeritics, Norcross, GA, USA) employing the gas sorption technique (the adsorption of nitrogen). The adsorption isotherms were fitted applying the Brunauer–Emmett–Teller (BET) method for the specific surface area.

2.2.6. Saturation of Thermally Treated BCV 2017 from the Aqueous Phase

The ability of certain 2:1 phyllosilicates, including smectites, to incorporate interlayer water molecules and the subsequent change in basal spacing has been studied extensively in the past (e.g., [21,22,23,24] and references therein). In order to demonstrate the ability of montmorillonite to incorporate water molecules following long-term heating at 200 °C, experiments were performed involving direct saturation from the aqueous phase. One gram of thermally treated BCV 2017 was added to 25 mL of demineralised water and mixed during the experiment. The bentonite reacted with the water in a beaker covered with foil for 44 days at a temperature of 21 °C. As the sample incorporated water, it was necessary to add demineralised water regularly up to the initial level. The bentonite material was analysed after 7, 14, 22, 30, 44 and 54 days of saturation by means of PXRD. Qualitative descriptions were compiled, i.e., on the position (d001) and full width at half maximum (FWHM) of the 001 montmorillonite reflection for the characterisation of the smectite hydration.

2.2.7. Swell Index

The determination of the swell index (SI, mL/2 g) was performed according to the ASTM D5890—11 Standard Test Method for the Swell Index of the Clay Mineral Component of Geosynthetic Clay Liners [25]. The resulting value indicated a volume of 2 g of dried material following one day of free swelling (24 h).
The tests involved the dispersion of approx. 2 g samples of dry bentonite in 100 mL graduated cylinders in increments of 0.1 mL. The material was added at intervals of at least 10 min so as to allow for full hydration and the settlement of the clay at the bottom of the cylinder. The process continued until the entire 2 g samples had been added to the cylinders. The samples were then covered and protected from disturbance for a period of 16–24 h, following which the levels of the settled and swollen clay were recorded to the nearest 0.5 mL. The final volumes relating to 2 g of the dry material were then calculated. Five samples/cylinders were processed at a time so as to allow for the calculation of the average values. Some of the samples have been left additional time (up to 10 days) in dispersion in order to evaluate influence of longer saturation time.

2.2.8. Liquid Limit

The liquid limit (wL; %) comprises the water content at which a soil changes from the liquid to the plastic state. The determination of the liquid limit was performed via the fall cone method according to standard ČSN EN ISO 17892-12 [26]. A cone with a tip angle of 30° and a mass of 80 g was used for testing purposes. In this case, the liquid limit equalled the water content at a penetration (depth) of 20 mm.
Distilled water was used for the wetting of the samples before and during the tests. The bentonite samples were carefully mixed and patiently kneaded with water so as to attain an initial penetration of 15 mm (according to the standard) and maintained in this state for 24 h. More water was then added, and the sample kneaded so as to once more attain 15mm penetration prior to the commencement of the testing process.

2.2.9. Swelling Pressure

The swelling pressure was measured in a constant volume cell apparatus that allows for the combination of the investigation of both the water permeability and the total pressure. The cells were designed for bottom-up saturation and the continuous monitoring of the evolution of total pressure. The tops and bottoms of the samples were fitted with sintered steel permeable plates so as to prevent the leaching (“mobilisation”) of the material. The piston and force sensor for the measurement of the total (or swelling) pressure of the bentonite are positioned between the upper flange of the chamber and the upper surface of the sample. Force sensors were connected to a central data logger.
The bentonite BCV 2017 was uniaxially compacted into the hollow steel cylinders that formed the central part of the cell. Distilled water was used as the saturation medium. The test continued until the flow and the total pressure stabilised. The water pressure source was subsequently disconnected so as to allow for the determination of the swelling pressure.

2.2.10. Water Retention Curves

The water retention curves were determined by means of the commonly used vapour equilibrium method [27]. The relative humidity in the closed containers was investigated via the application of eight different saturated salt solutions [28] and was found to vary in the range 12.0–97.6%. The unique relationship between the imposed relative humidity and total suction is given by Kelvin’s law. Samples with three differing initial dry densities (1.27, 1.60 and 1.90 g/cm3) were prepared from bentonite powder by means of static uniaxial compaction under controlled loading. The compacted samples were carefully cut into pieces with irregular dimensions and typical volumes of 2–5 cm3 and placed in vessels containing the various salt solutions. Three sets of samples were tested. The first set was prepared from original BCV 2017 bentonite with its natural water content of 11%. The second set was prepared in the same way; however, the pieces of compacted bentonite had been subjected to one year of thermal loading at 200 °C. The third set of samples was compacted from thermally treated powder (1 year, 200 °C). The heated powder used for the latter set of samples was equilibrated at a relative humidity of 43% (i.e., the standard laboratory environment) prior to compaction so as to replicate the compaction conditions of the first two sets of samples.

3. Results and Discussion

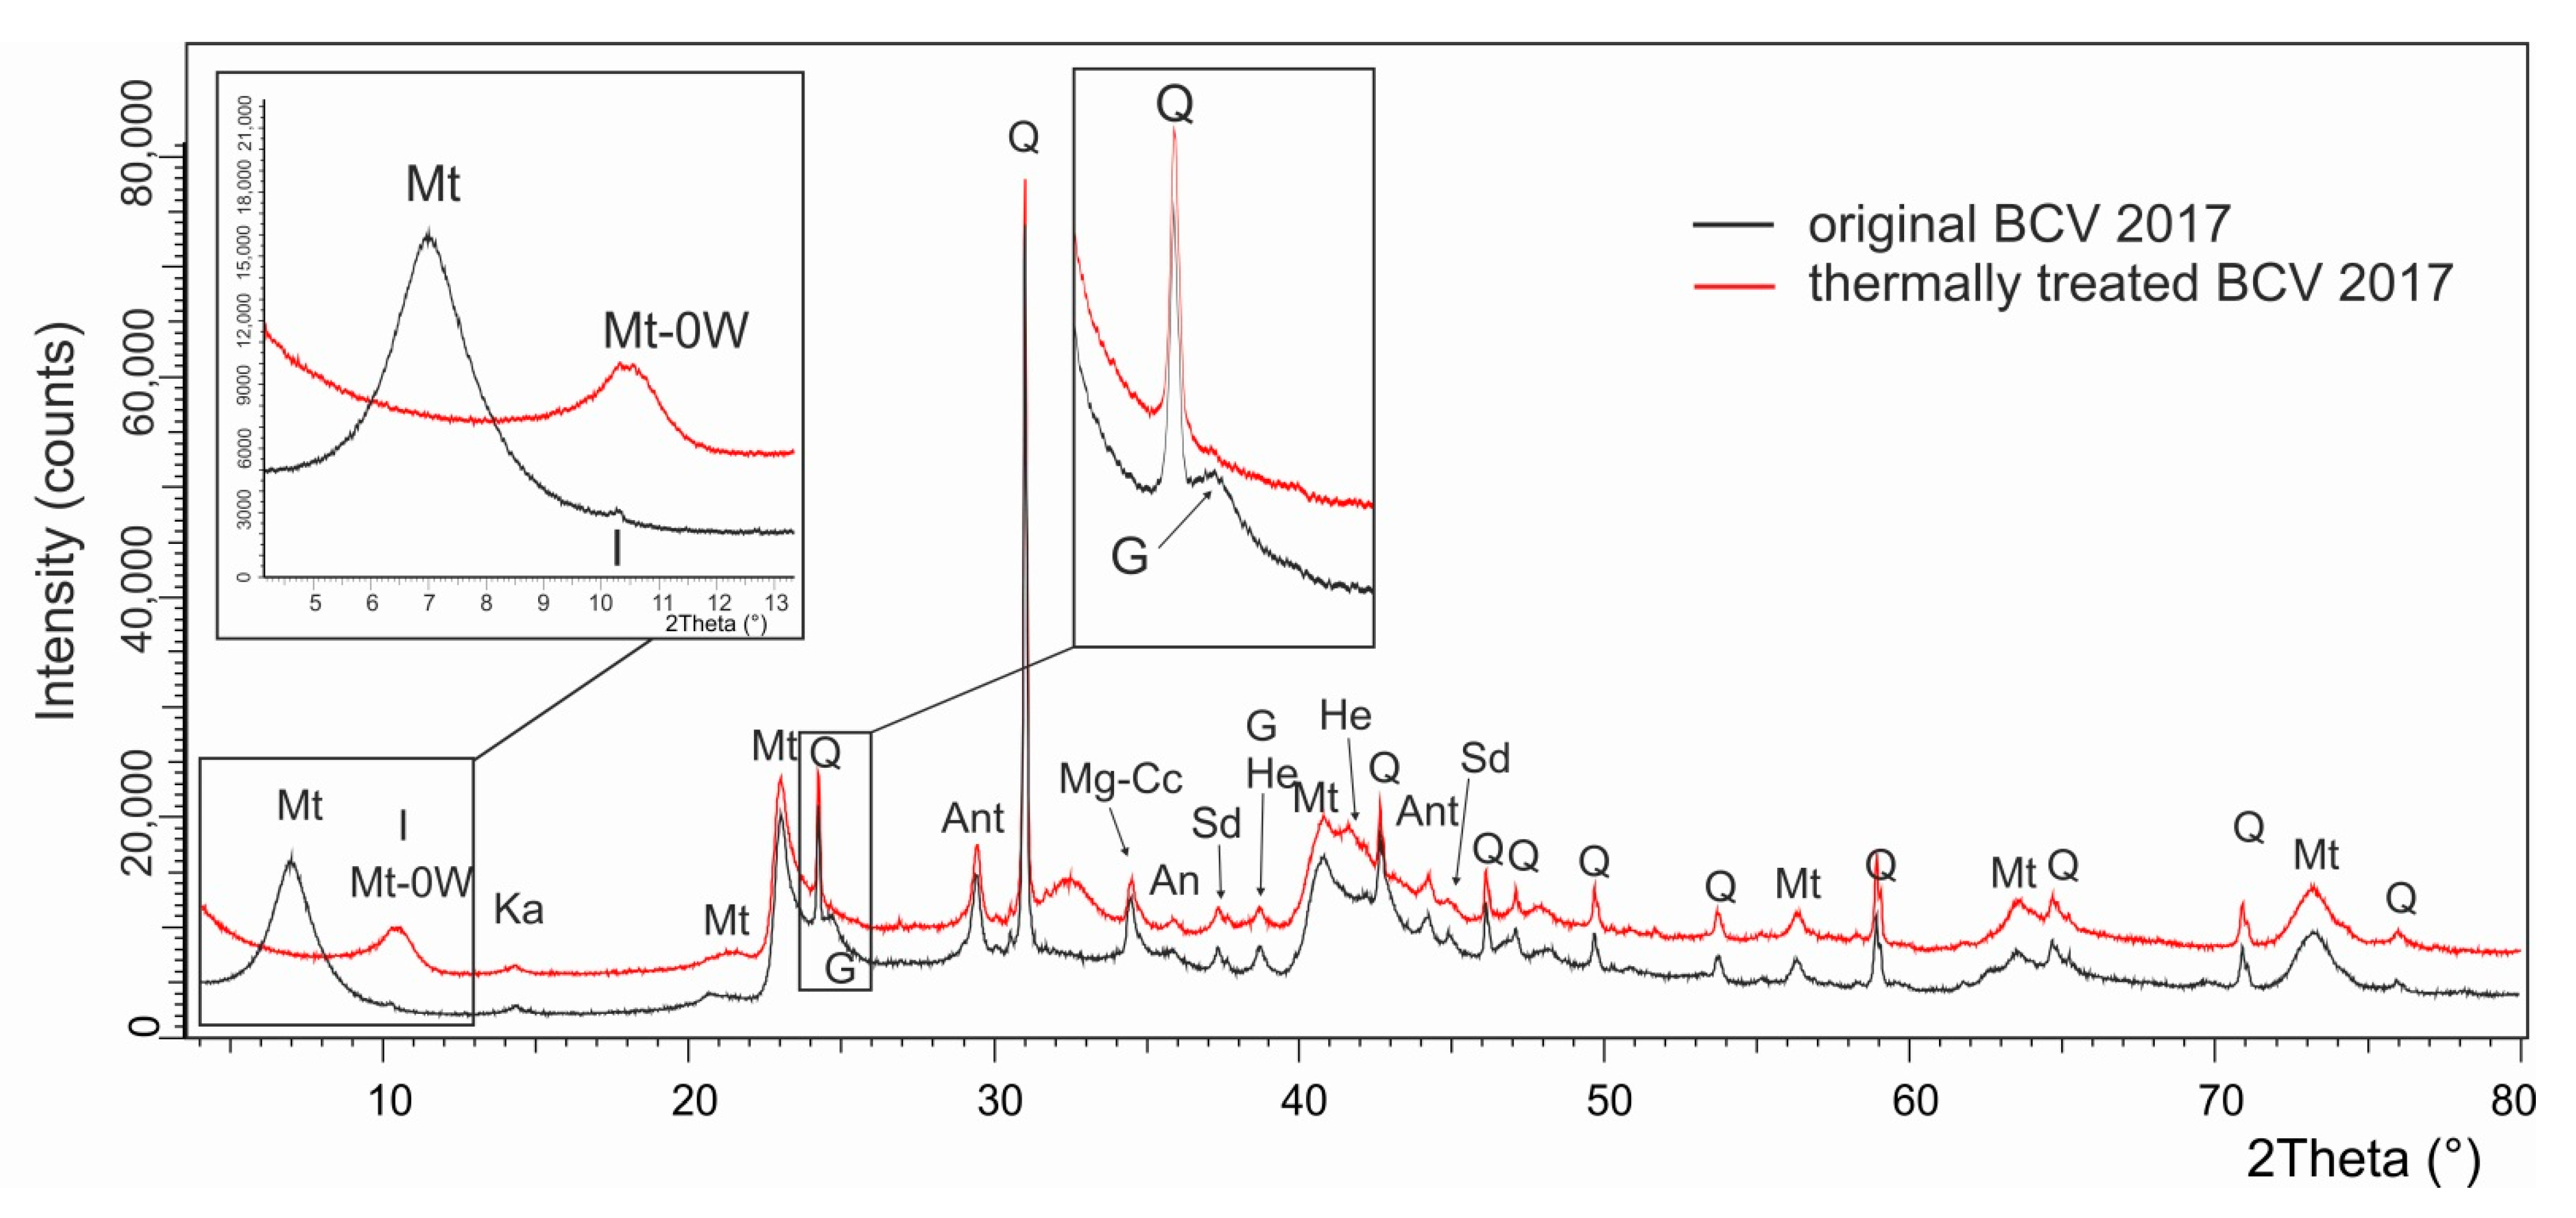
3.1. Chemical and Mineralogical Composition of BCV 2017

A comparison of the chemical compositions of the original and thermally treated bentonite BCV 2017 (27 months at 200 °C) is provided in Table 1. The results indicate a relatively high content of Fe2O3, e.g., in comparison with that of Bentonite 75 (5.57 wt.% [29]). The chemical composition of the original and thermally treated materials were found to be similar, with the exception of the differing hydration water contents (H2O), which was a direct consequence of the heating of the material at 200 °C. As indicated by the PXRD study (see below), the heating of the material at 200 °C resulted in the complete dehydration of the interlayer space of the montmorillonite and its structural collapse to the 9.8 Å structure. Hence, the H2O content of thermally treated material is significantly lower than that for the original one.
The lower structural water content (H2O+) in the thermally treated material was related to the transformation of goethite to hematite which occurred during the long-term heating of the material at 200 °C.
The mineralogical composition of the original BCV 2017 consists of clay minerals—montmorillonite, kaolinite and illite. Among non-clay minerals, quartz, goethite, Mg-bearing calcite, siderite, anatase and ankerite were detected. Since the smectite hydration state is characterised by the evolution of (001) basal-spacing (d001) under variable relative humidity [23,24,30,31,32], a variation was observed in the d-value of the (001) basal spacing between 14.1 and 14.7 Å depending on the relative humidity (RH) in the laboratory. For an RH of 40%, the 001 reflection appeared at 14.5 Å. The usual hydration state of smectite has been described in terms of three-layer types that evince differing layer thicknesses that correspond to the common hydration states for smectites: dehydrated layers (0W, d001 = 9.7–10.2 Å), monohydrated layers (1W, d001 = 11.6–12.9 Å) and bihydrated layers (2W, d001 = 14.9–15.7 Å) [32]. The d001 value of 14.5 Å observed for montmorillonite in the BCV 2017 is an intermediate value between those basal spacing corresponding to the discrete 1W and 2W hydration states. Consequently, it indicates presence of high amount of bihydrated layers (2W) and a small amount of monohydrated layers (1W) in the montmorillonite structure at an RH of 40%.
The mineralogical compositions of the original and the thermally treated BCV are shown in Table 2, while Figure 1 provides a comparison of the powder X-ray diffraction patterns (PXRD). The PXRD pattern reflects two main changes in the samples of the thermally treated BCV 2017 compared to the original material. It is clear from Figure 1 that the most remarkable change concerned the shift in the (001) montmorillonite reflection from 14.5 to 9.8 Å for the material subjected to heating accompanied by an intensity decrease. This basal spacing corresponds to dehydrated montmorillonite, i.e., montmorillonite without the presence of water molecules in the interlayer. A second feature observed in the PXRD patterns is disappearance of goethite in the material subjected to heating and its dehydration to hematite according to the equation:
2 α-FeOOH → α-Fe2O3 + H2O
The newly formed hematite exhibits broad peaks in its PXRD pattern which indicate that this phase is present as micro to nano-domains. Ruan et al. [33] described the formation of hematite from goethite at 240 °C and the further development of the hematite structure from 250° to 300 °C. De Faria and Lopes [34] and Gonzáles et al. [35] indicated a temperature interval of 260–280 °C for this dehydration process. Conversely, Walter et al. [36] observed the dependence of the goethite-hematite transformation temperature on the particle size and determined a transformation temperature of 191.7 °C for small goethite particles (with a BET specific surface of 149 m2·g−1) according to high-temperature XRD measurements. It is worth noting that a temperature of 250 °C was observed for the goethite-hematite transformation by the thermal analysis (see below) of an original BCV 2017 sample. However, the long-term heating of BCV 2017 at 200 °C over 27 months was sufficient to lead to the dehydration of goethite.
An apparent consequence of this reaction comprises a change in the colour of the sample following long-term heating. Original BCV 2017 is yellow-coloured while heated BCV 2017 exhibits a pale brown colour with red shading (Figure 2).
It is interesting to note that a thin dark crust formed over the bulk of the BCV 2017 during heating at 200 °C (Figure 2). The crust exhibited a dark brown colour and was apparently coarser than the bulk material (Figure 3). From the mineralogical point of view, the crust appeared to be identical to the bulk of the thermally treated material; the PXRD study revealed no notable differences between the crust and the bulk material. Its formation was most likely related to the sinte ring process that acted upon the surface layer of the BCV 2017 sample during heating. Similar observations were made concerning a raw bentonite material extracted from the Rokle deposit (Kadaň, Chomutov District Czech Rep.) following heating at elevated temperatures (up to 500 °C) [37]. Data from silicate analysis and XRD data are available in Supplementary Material (Silicate analysis, XRD data).

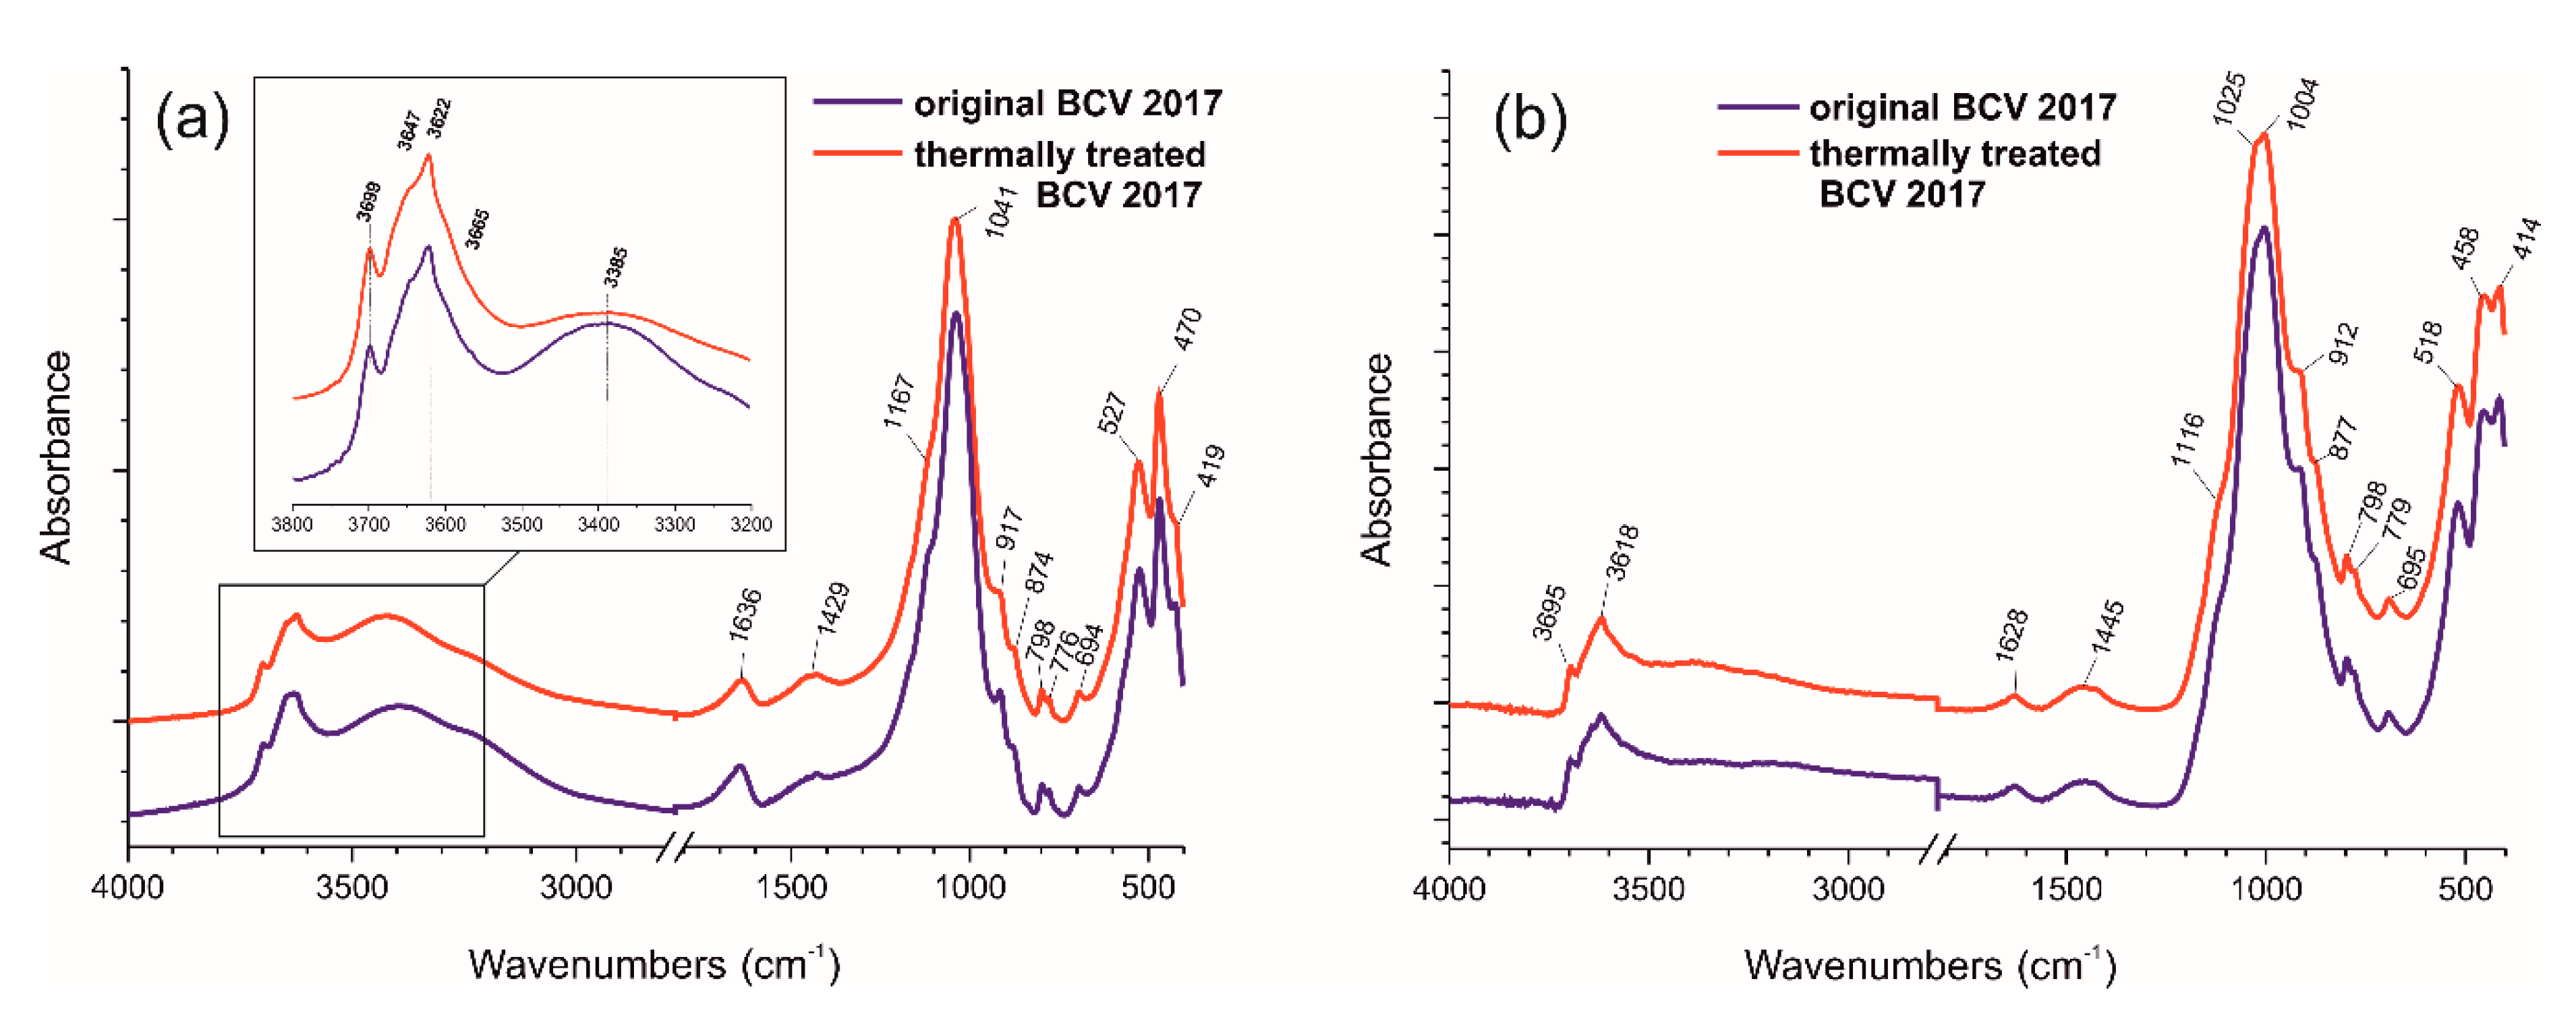
3.2. Infrared Spectroscopy (IR)

The IR spectra of the original and the thermally treated BCV 2017 (200 °C) bentonite samples measured via the KBr pellet and ATR techniques are shown in Figure 4a,b. The IR spectroscopy confirmed the presence of montmorillonite as the dominant mineral phase in both bentonite samples. In addition to montmorillonite, kaolinite, a quartz admixture and traces of carbonates were also detected in the samples. A detailed list of the spectral bands that correspond to the montmorillonite and other minerals present in the original and thermally treated BCV 2017 are listed in Table 3. The assignment of the bands was performed according to [38,39,40,41]. The OH deformation band at around 874 cm−1 (AlFeOH) in all the types of IR spectra of both samples indicates the significant substitution of octahedral Al+3 by Fe+3 in the montmorillonite structure. Other features in the spectra that are common to dioctahedral montmorillonites include a Si–O stretching band at around 1037 cm−1 and Al–O–Si and Si–O–Si deformations at around 524 and 469 cm−1, respectively. It is clear from Figure 4 that the IR spectra of the original and thermally treated materials are very similar; the intensities of the absorption bands and their positions remained virtually unchanged. Subsequently, the IR spectroscopic study also proved the crystallochemical stability of the montmorillonite in BCV 2017 bentonite under selected experimental conditions. As was indicated by the PXRD study, the main mineralogical change in the thermally treated compared to the original material comprised the dehydration of the interlayer water in the montmorillonite and the subsequent reduction of the d001 spacing to 9.8 Å. Unlike the PXRD and TG/DTA thermal analysis, conventional IR spectroscopy did not directly reveal the dehydration of the interlayer. Montmorillonites could contain water in several forms: interlayer water that form part of hydration envelopes of interlayer cations, adsorbed water surrounding the outside surface of montmorillonite, free water in voids between soil particles and hydroxyl water [38,42,43]. The overlap of the bands originating from the structural OH groups and the OH groups from the adsorbed and interlayer water in the stretching vibrations region (3700–3000 cm−1) complicated the detection of the dehydration of the interlayer by conventional IR approach.

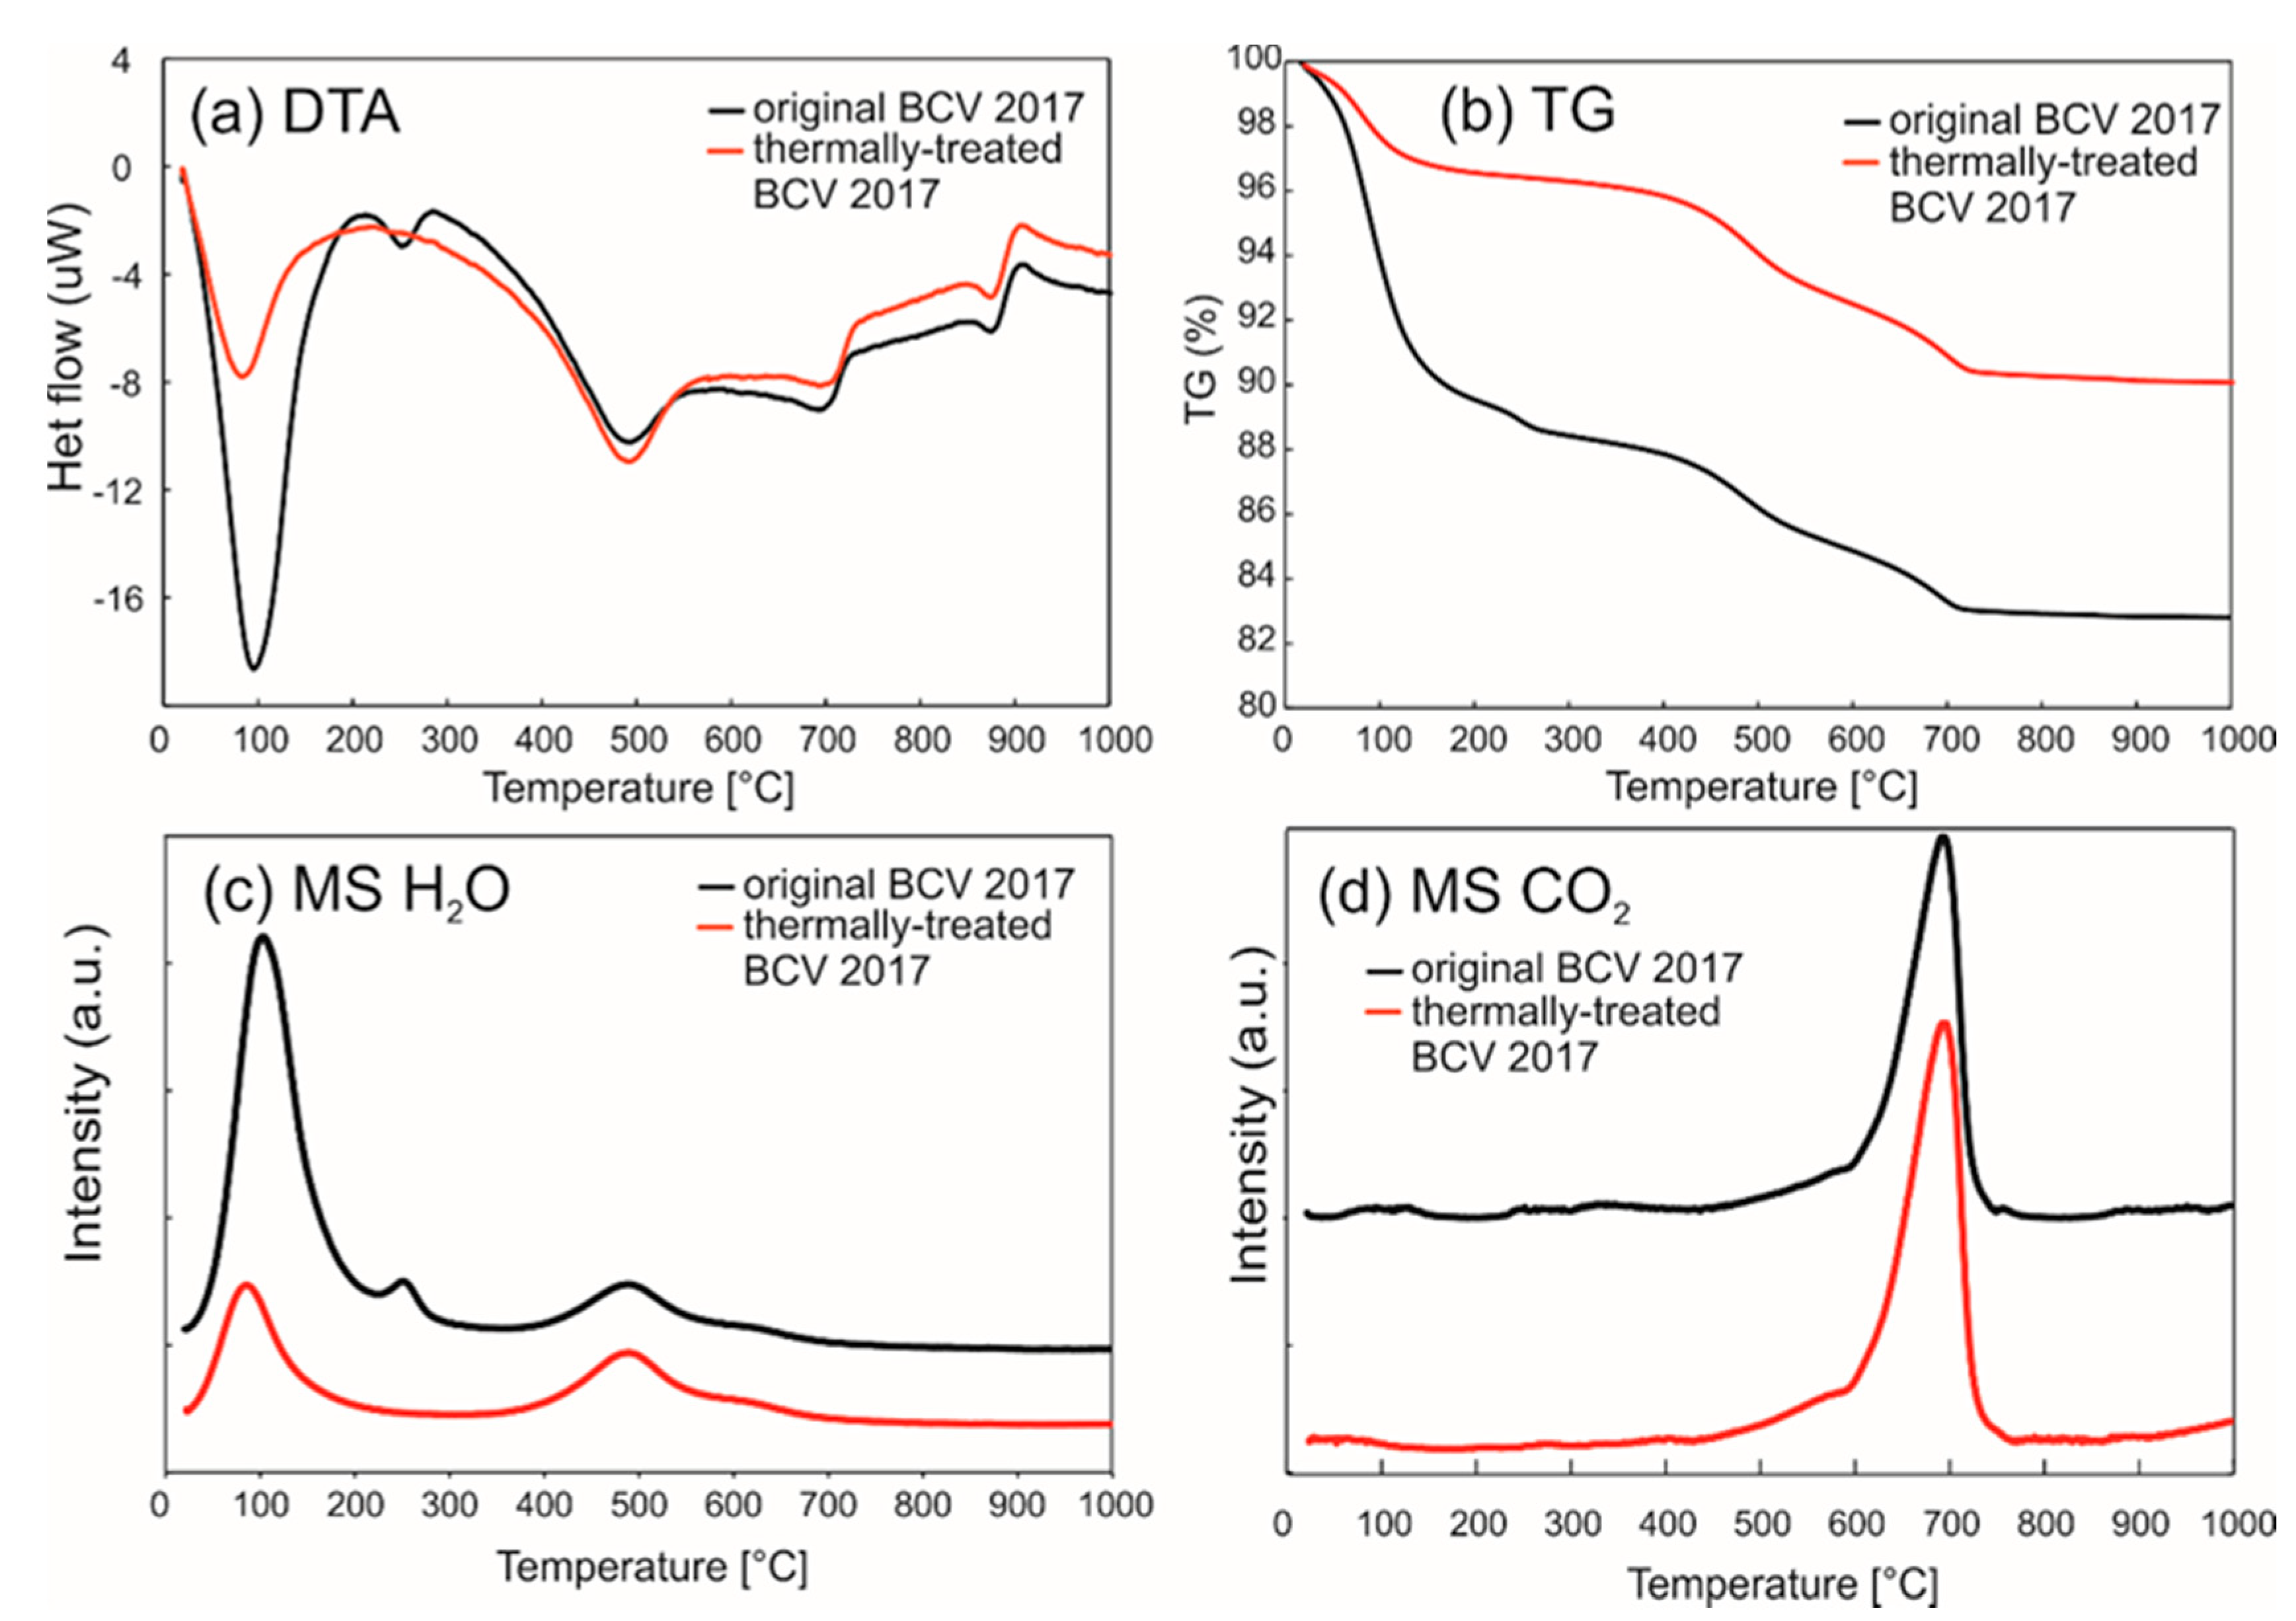
3.3. Thermal Analysis

The differential thermal analysis (DTA) and thermogravimetric analysis (TG) curves together with the mass spectroscopy signals for CO2 and water molecules for the original and the thermally treated (200 °C, 27 months) BCV 2017 bentonite are shown in Figure 5. It is clear from the Figure 5 that five and six main reactions were observed for the thermally treated and the original BCV 2017, respectively. The first endothermal reaction occurred in the temperature range 30–200 °C, with an endothermic peak centred at 100 °C and resulting mass losses of 10.4 and 3.4 wt.% for the original and the thermally treated BCV 2017 samples, respectively. Concerning the original material, this reaction corresponded to the dehydration of the external surface, the pores and the interlayer space in the montmorillonite [44,45]. According to our PXRD study, the montmorillonite in the thermally treated BCV 2017 shows d001 position 9.8 Å, which indicates a state in which no water molecules are present in the interlayer ([32] and references therein), while the original material contained monohydrated and bihydrated water layers in the interlayer space. Consequently, the reaction in the thermally treated material includes dehydration of the external surface and pores, which resulted in a significant weight loss during the reaction. A second endothermic reaction, which was observed only for the original material, occurred at around 250 °C and represented the dehydroxylation of the goethite to hematite according to Equation (1). This thermal effect was absent in the thermally treated BCV 2017 since the goethite had already been transformed into hematite during the 27 months of heating. The long-term heating of the material at 200 °C resulted in the transformation of the goethite to hematite at a temperature lower than the 250 °C indicated by the thermal analysis. This can be explained by the fact that the thermal analysis experiment is highly dynamic, and the detected temperature of a process taking place in the sample is also dependent on the heating rate during the experiment. The long-time experiment is close to the equilibrium conditions. The equilibrium temperature could be found by thermal analysis performed at a (virtual) heating rate zero K·min−1, which is impossible.
The third endothermic reaction, observed for both the original and the thermally treated BCV between 450 and 550 °C, corresponded to the dehydroxylation of the montmorillonite structure. According to Drits et al. [46,47], trans-vacant smectites have dehydroxylation temperatures of between 500 and 550 °C, while cis-vacant variants have a dehydroxylation temperature of around 700 °C. This suggests that the trans-vacant montmorillonite configuration prevails in BCV 2017 bentonite. This is in agreement with the observed Fe3+ substitution in the octahedral sheet in montmorillonite as confirmed by the IR spectroscopy, since this substitution on the octahedral sheets of the dioctahedral phyllosilicates prefers to form trans-vacant forms [48,49,50,51]. The fourth endothermic reaction, with a peak at around 700 °C and related significant release of CO2 visible for both samples, indicated the decomposition of the Mg-Ca carbonate [52]. The fifth endothermic reaction, with a peak at approximately 880 °C, was related to the disappearance of the layered structure of the montmorillonite in both types of BCV 2017 samples [53]. This reaction was accompanied by a negligible loss of weight. The sixth exothermic effect that occurred in the range 890–920 °C was associated with the development of high-temperature phases including spinel and affected both the original and the thermally treated BCV 2017 samples. Thermal analysis data are provided in Supplementary Materials (thermal analysis data).

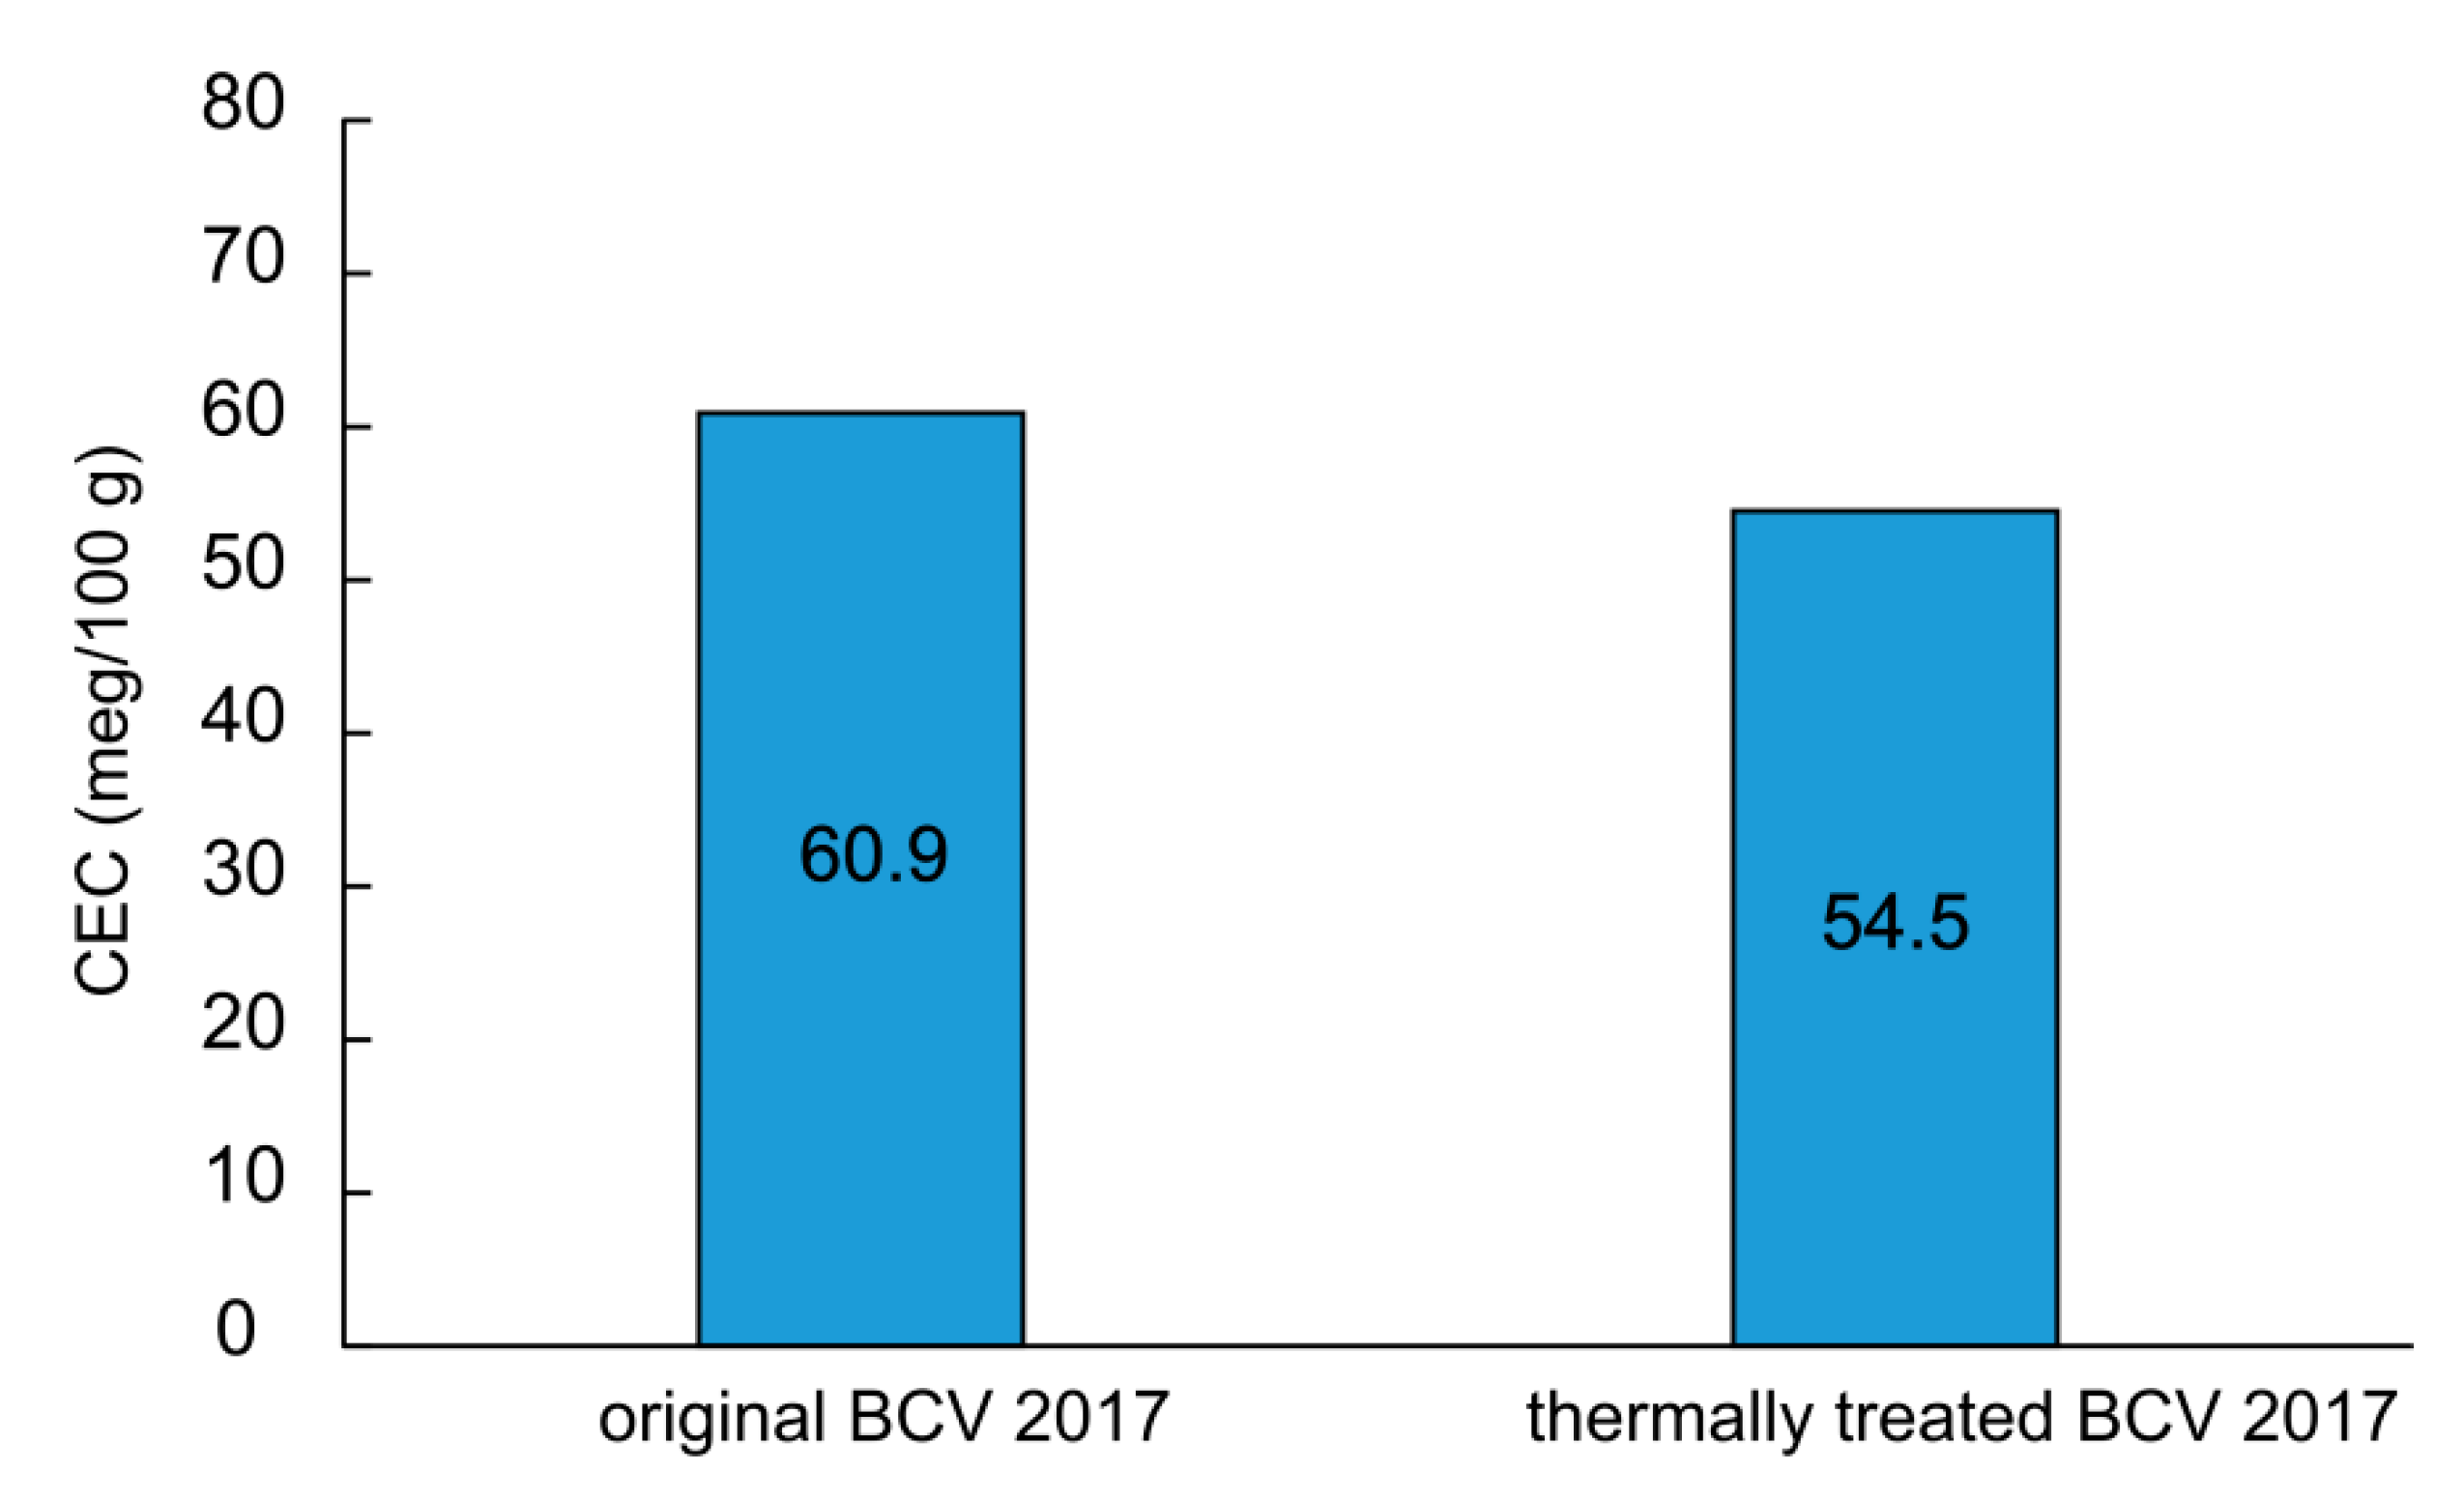
3.4. Cation Exchange Capacity (CEC)

The interlayer cations in the montmorillonite in the original BCV 2017 consist mainly of Mg2+ (38.7 meg/100 g) and Ca2+ (19.9 meg/100 g), with some minor amounts of Na+ (7.2 meg/100 g) and K+ (2.1 meg/100 g). The CEC values determined for the original and the thermally treated materials are shown in Figure 6. Accordingly, the smectite type in BCV 2017 bentonite can be characterized as Ca-Mg montmorillonite. The CEC values decreased from an initial value of 60.9 meg/100 g to 54.5 meg/100 g following thermal treatment. It is assumed that the change in the CEC values before and after thermal treatment was related to the collapse of the interlayer structure avoiding further cation replacements.

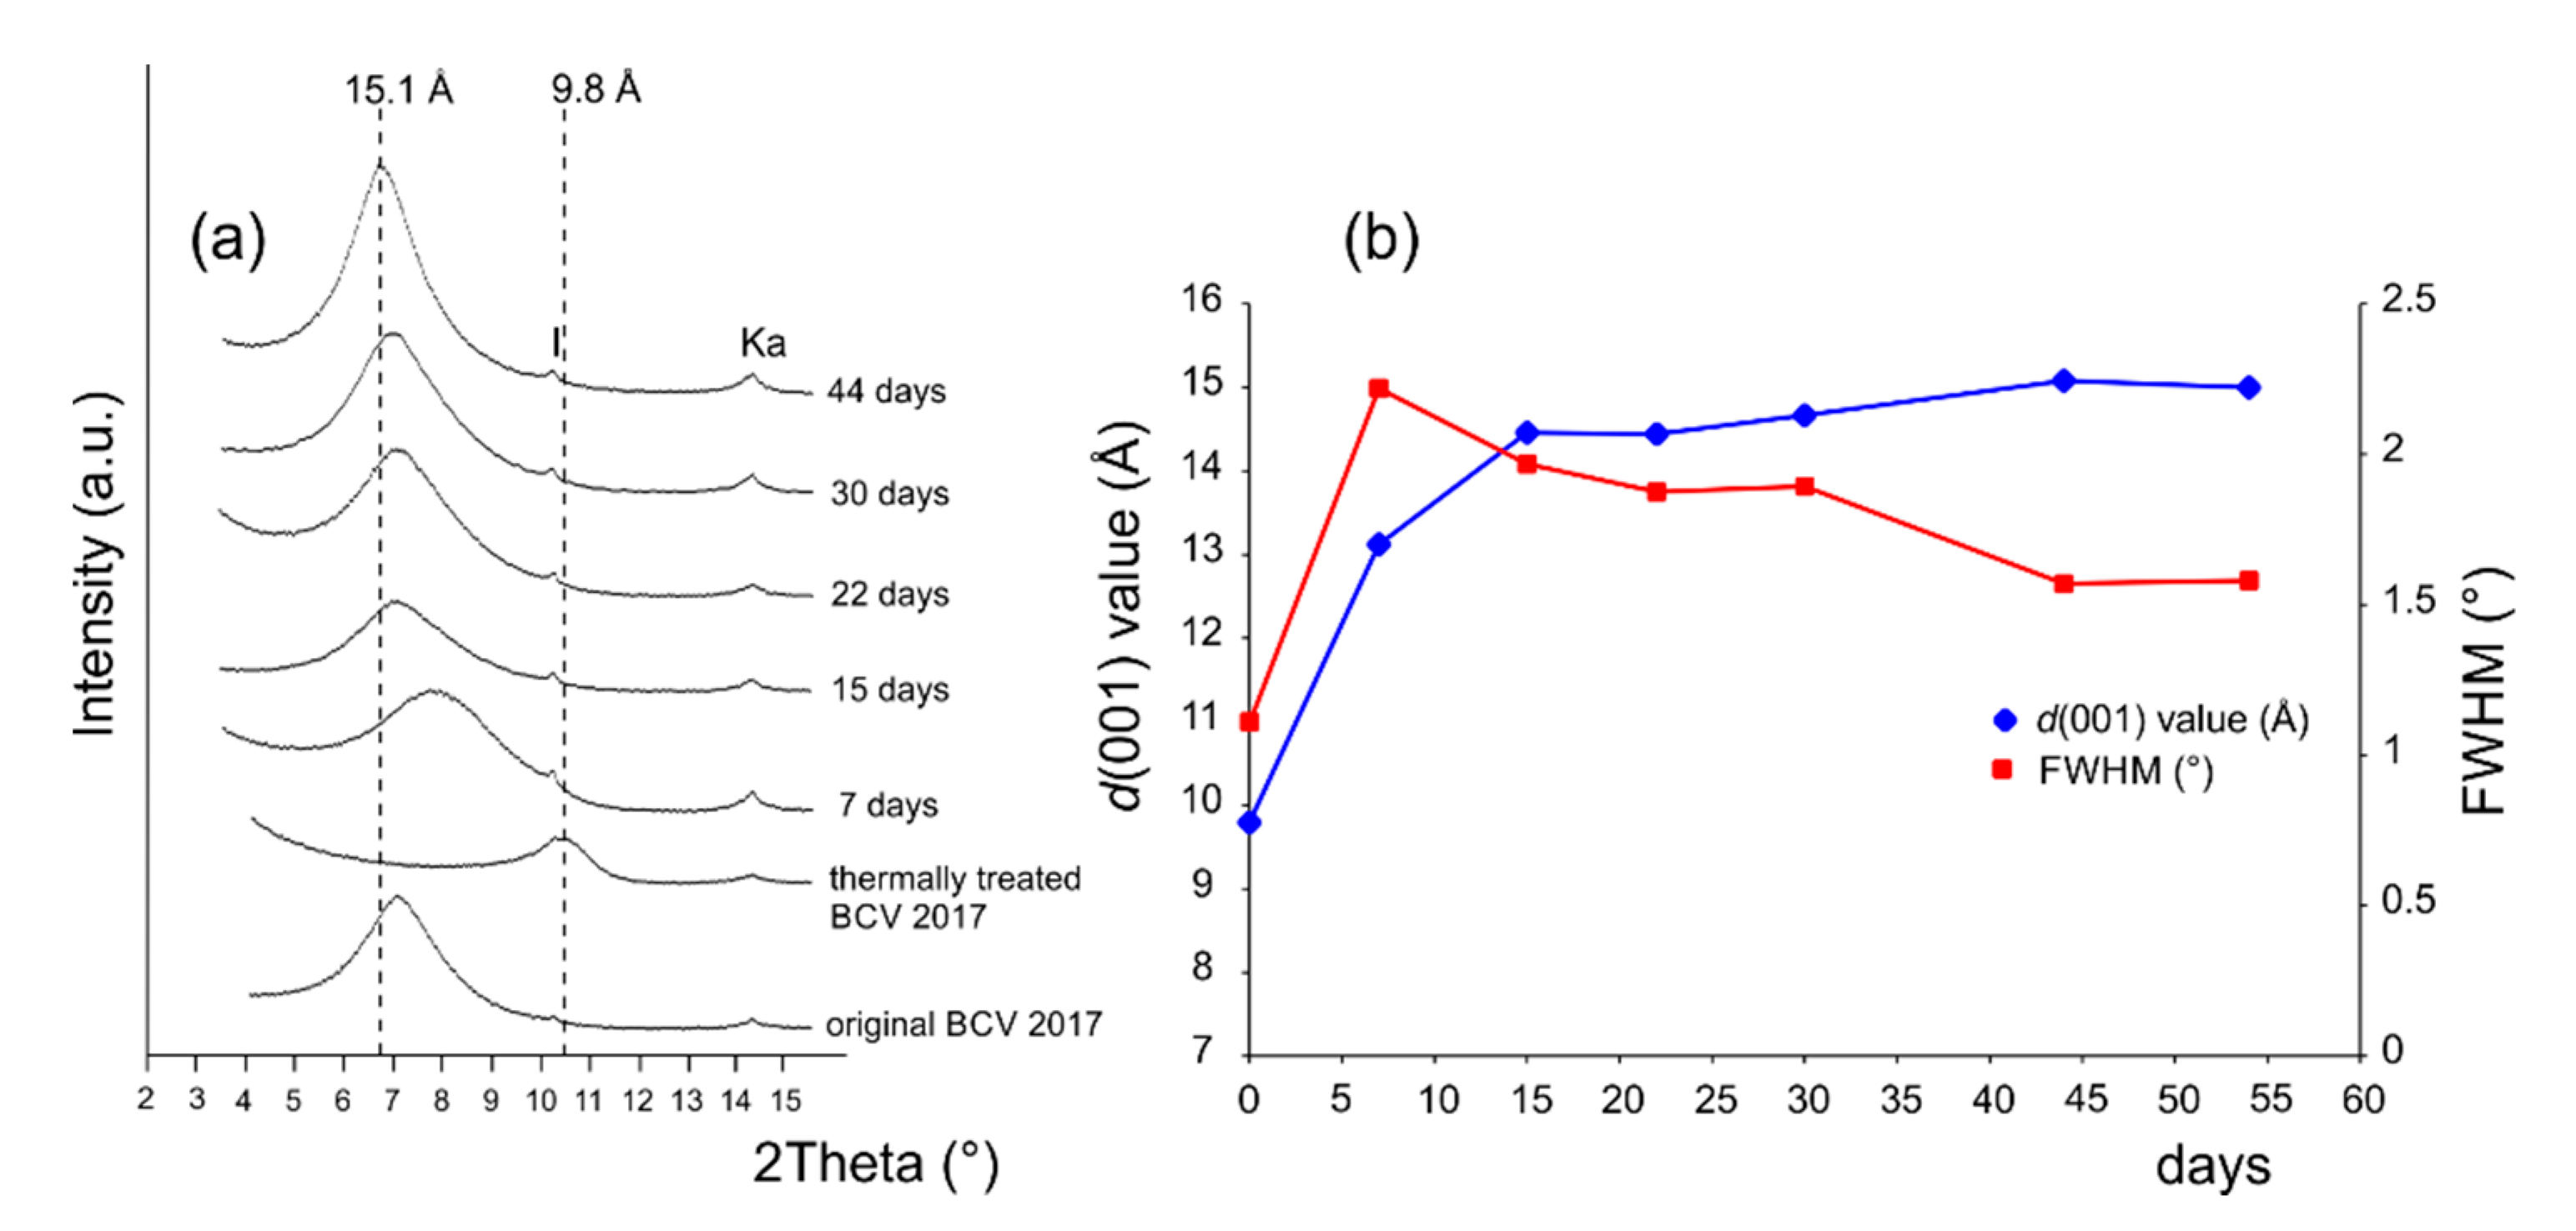
3.5. Saturation of Thermally Treated BCV 2017 from the Aqueous Phase

Figure 7a,b shows the evolution of the PXRD 001 profiles of the montmorillonite in the thermally treated BCV 2017 during saturation from the aqueous phase of the sample a function of the saturation time. The values of basal spacing (d001) together with the full width at half maximum (FWHM) of the 001 reflection are presented in Figure 7. The montmorillonite in the thermally treated BCV 2017 showed the d001 value of 9.8 Å, which corresponds to the hydration state without the presence of water molecules in the interlayer (0W) [32]. After 7 days of saturation in water, the montmorillonite evinced the d001 value of 13.12 Å, which indicated the intermediate hydration state, i.e., between the 1W and 2W discrete hydration states. In accordance with a study by Ferrage et al. [31], the heterogeneity of the hydration state led to the interstratification of the various different layer types, which produced increased FWHM value of 2.22° 2θ compared to an FWHM value of 1.11° 2θ for the thermally treated material. After 15 days of saturation, the 001 reflection appeared at 14.45 Å, thus indicating the increasing proportion of the 2W layers in the montmorillonite structure; the FWHM value decreased to 1.96° 2θ. After 30 days of saturation, a slight shift in the position of the 001 reflection to 14.66 Å was observed followed by a slight decrease in the FWHM value to 1.89° 2θ. After 44 days, the 001 position was observed to occur at 15.1 Å and the FWHM was seen to have further decreased to 1.57° 2θ, thus indicating bihydrated layers (2W) within the montmorillonite structure. No notable further changes in the 001 profile were observed by PXRD after 54 days of saturation.
As is evident from Figure 7, relatively broad and often asymmetric peaks occurred in the PXRD during saturation with no apparent indication of homogenous stepwise hydration. In accordance with Holmboe et al. [54] and Ferrage et al. [32], the evolution of hydration exhibits a somewhat heterogeneous character that indicates the coexistence of different layer types (1W and 2W) in the interlayer space. It is interesting to note that the saturation of the thermally treated BCV 2017 for 44 days resulted in montmorillonite with bihydrated layers (2W) in the crystal structure. Conversely, the same thermally treated material placed at under standard room conditions (~40% RH, 21 °C) evinced different saturation behaviour. The PXRD patterns exhibited broad and diffuse 001 profiles that indicated significantly slower hydration than that induced via saturation from the liquid water. The behaviour also depended on the relative humidity, a topic that will form the subject of a separate study.

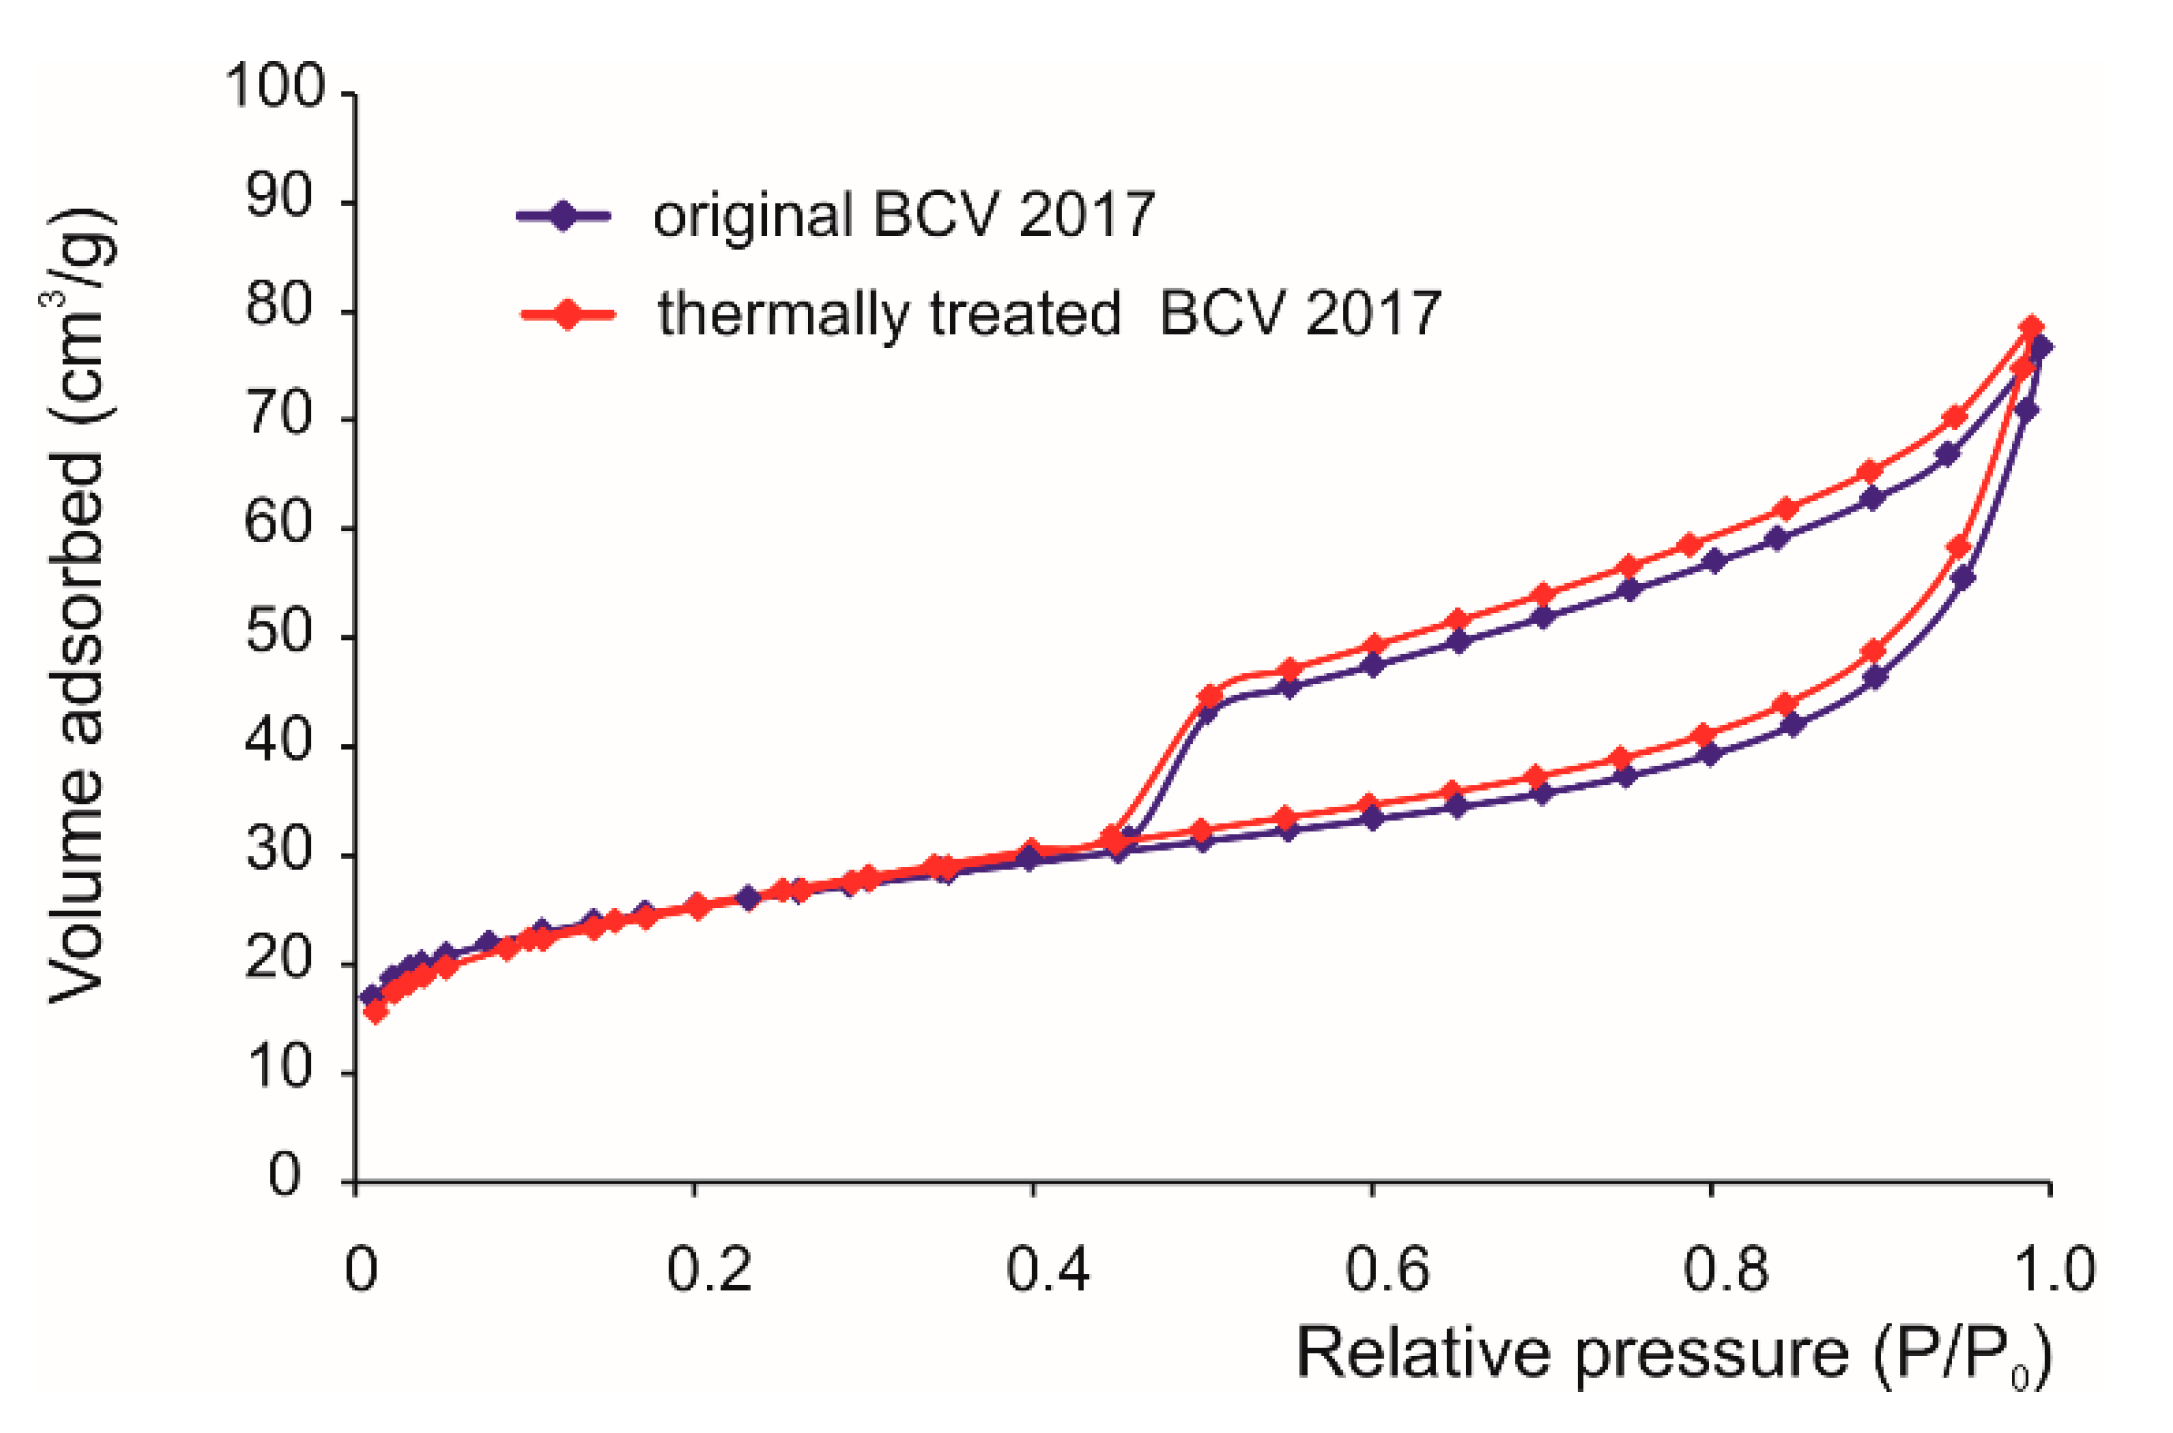
3.6. Specific Surface Area (BET)

The original BCV 2017 material is characterized by a BET-N2 specific area of 91 m2/g, which falls within the broad distribution of BET-N2 specific area values for Ca-Mg-dominated bentonites, which range from 50 to 130 m2/g [55]. A slightly decreased value of 89 m2/g was determined for the thermally treated material. BET-N2 values are known to depend on the exchangeable cation population [56], the microporosity and the accessible areas of the interlayer [55]. Lang et al. [57] noted that the removal of absorbed water during heating provides new adsorptive sites for N2 molecules. Conversely, the dehydration of the interlayer space induces a decrease in the interlayer space. Consequently, changes in the specific surface area values depend on the competing effects of the dehydration of the external surface and the interlayer space. With respect to the thermally treated BCV 2017, the reduction of the interlayer space is most likely compensated for by the creation of new sites for N2 molecules as a consequence of the removal of the absorbed water. Thus, the BET-N2 specific surface area values were observed to be very similar for the original and the thermally treated materials.
The isotherms determined for the original and the thermally treated BCV 2017 are displayed in Figure 8. Both samples exhibit the type IV isotherm according to the IUAPC classification with noticeable H4-type hysteresis loops that are characteristic of slit-shaped pores. These findings suggest that both BCV 2017 samples comprise mesoporous materials with the limited contribution of microporosity. The micropore volumes, estimated from the t-plot method, are 0.0143 and 0.0093 cm3/g for the original and the thermally treated material. These values represent 13.4% and 8.6% of the total pore volume (up to 40.31 nm). The total pore volume values (up to 40.31 nm), obtained from the N2 adsorption isotherm, are 0.1065 and 0.1085 cm3/g, respectively.

3.7. Swell Index and Liquid Limit

Swell index tests were performed on the original and the thermally treated materials (200 °C; 15 and 27 months). Two types of samples were investigated in the case of 27 months, i.e., a “bulk” sample that represented most of the volume of the treated material and a top surface layer that comprised the thin dark crust that formed on the surface of the bentonite BCV 2017 during thermal treatment (see Figure 2 and Figure 3). The results are presented in Table 4; although a certain decrease (approx. 25%) is evident due to the thermal treatment, no differences were detected between the bulk material and the crust thermally treated for 27 months. The results indicate a reduction in the free swelling ability following treatment; however, it is important to bear in mind the short duration (24 h) of the testing process. To address that issue, some of the samples were left in cylinder up to 10 days in total in order to observe if an additional swelling occurs over time (see values with @ in Table 4 denoting time from test start). The treated samples exhibit delayed start of additional swelling. This indicates that some of the swelling capacity may be recuperated over time.
The liquid limit was determined for the original and the thermally treated materials (200 °C; 15 months; Table 4). In the case of the treated sample, an additional 10-day wetting test was also performed. Bentonite samples are usually wetted for 24 h prior to the determination of the liquid limit. As the result showed lower value for thermally treated material, and indication of slower resaturation was discussed (see Section 3.5), total time of 10 days was used for wetting before liquid limit test. Water was added each day and the samples kneaded so as to maintain the water content at 15 mm penetration. The visual observation revealed that a significantly higher amount of water was required than usual. The results indicate a lower (immediate) water adsorption ability following thermal treatment, with a partial resaturation ability when a time of 10 days was allowed.

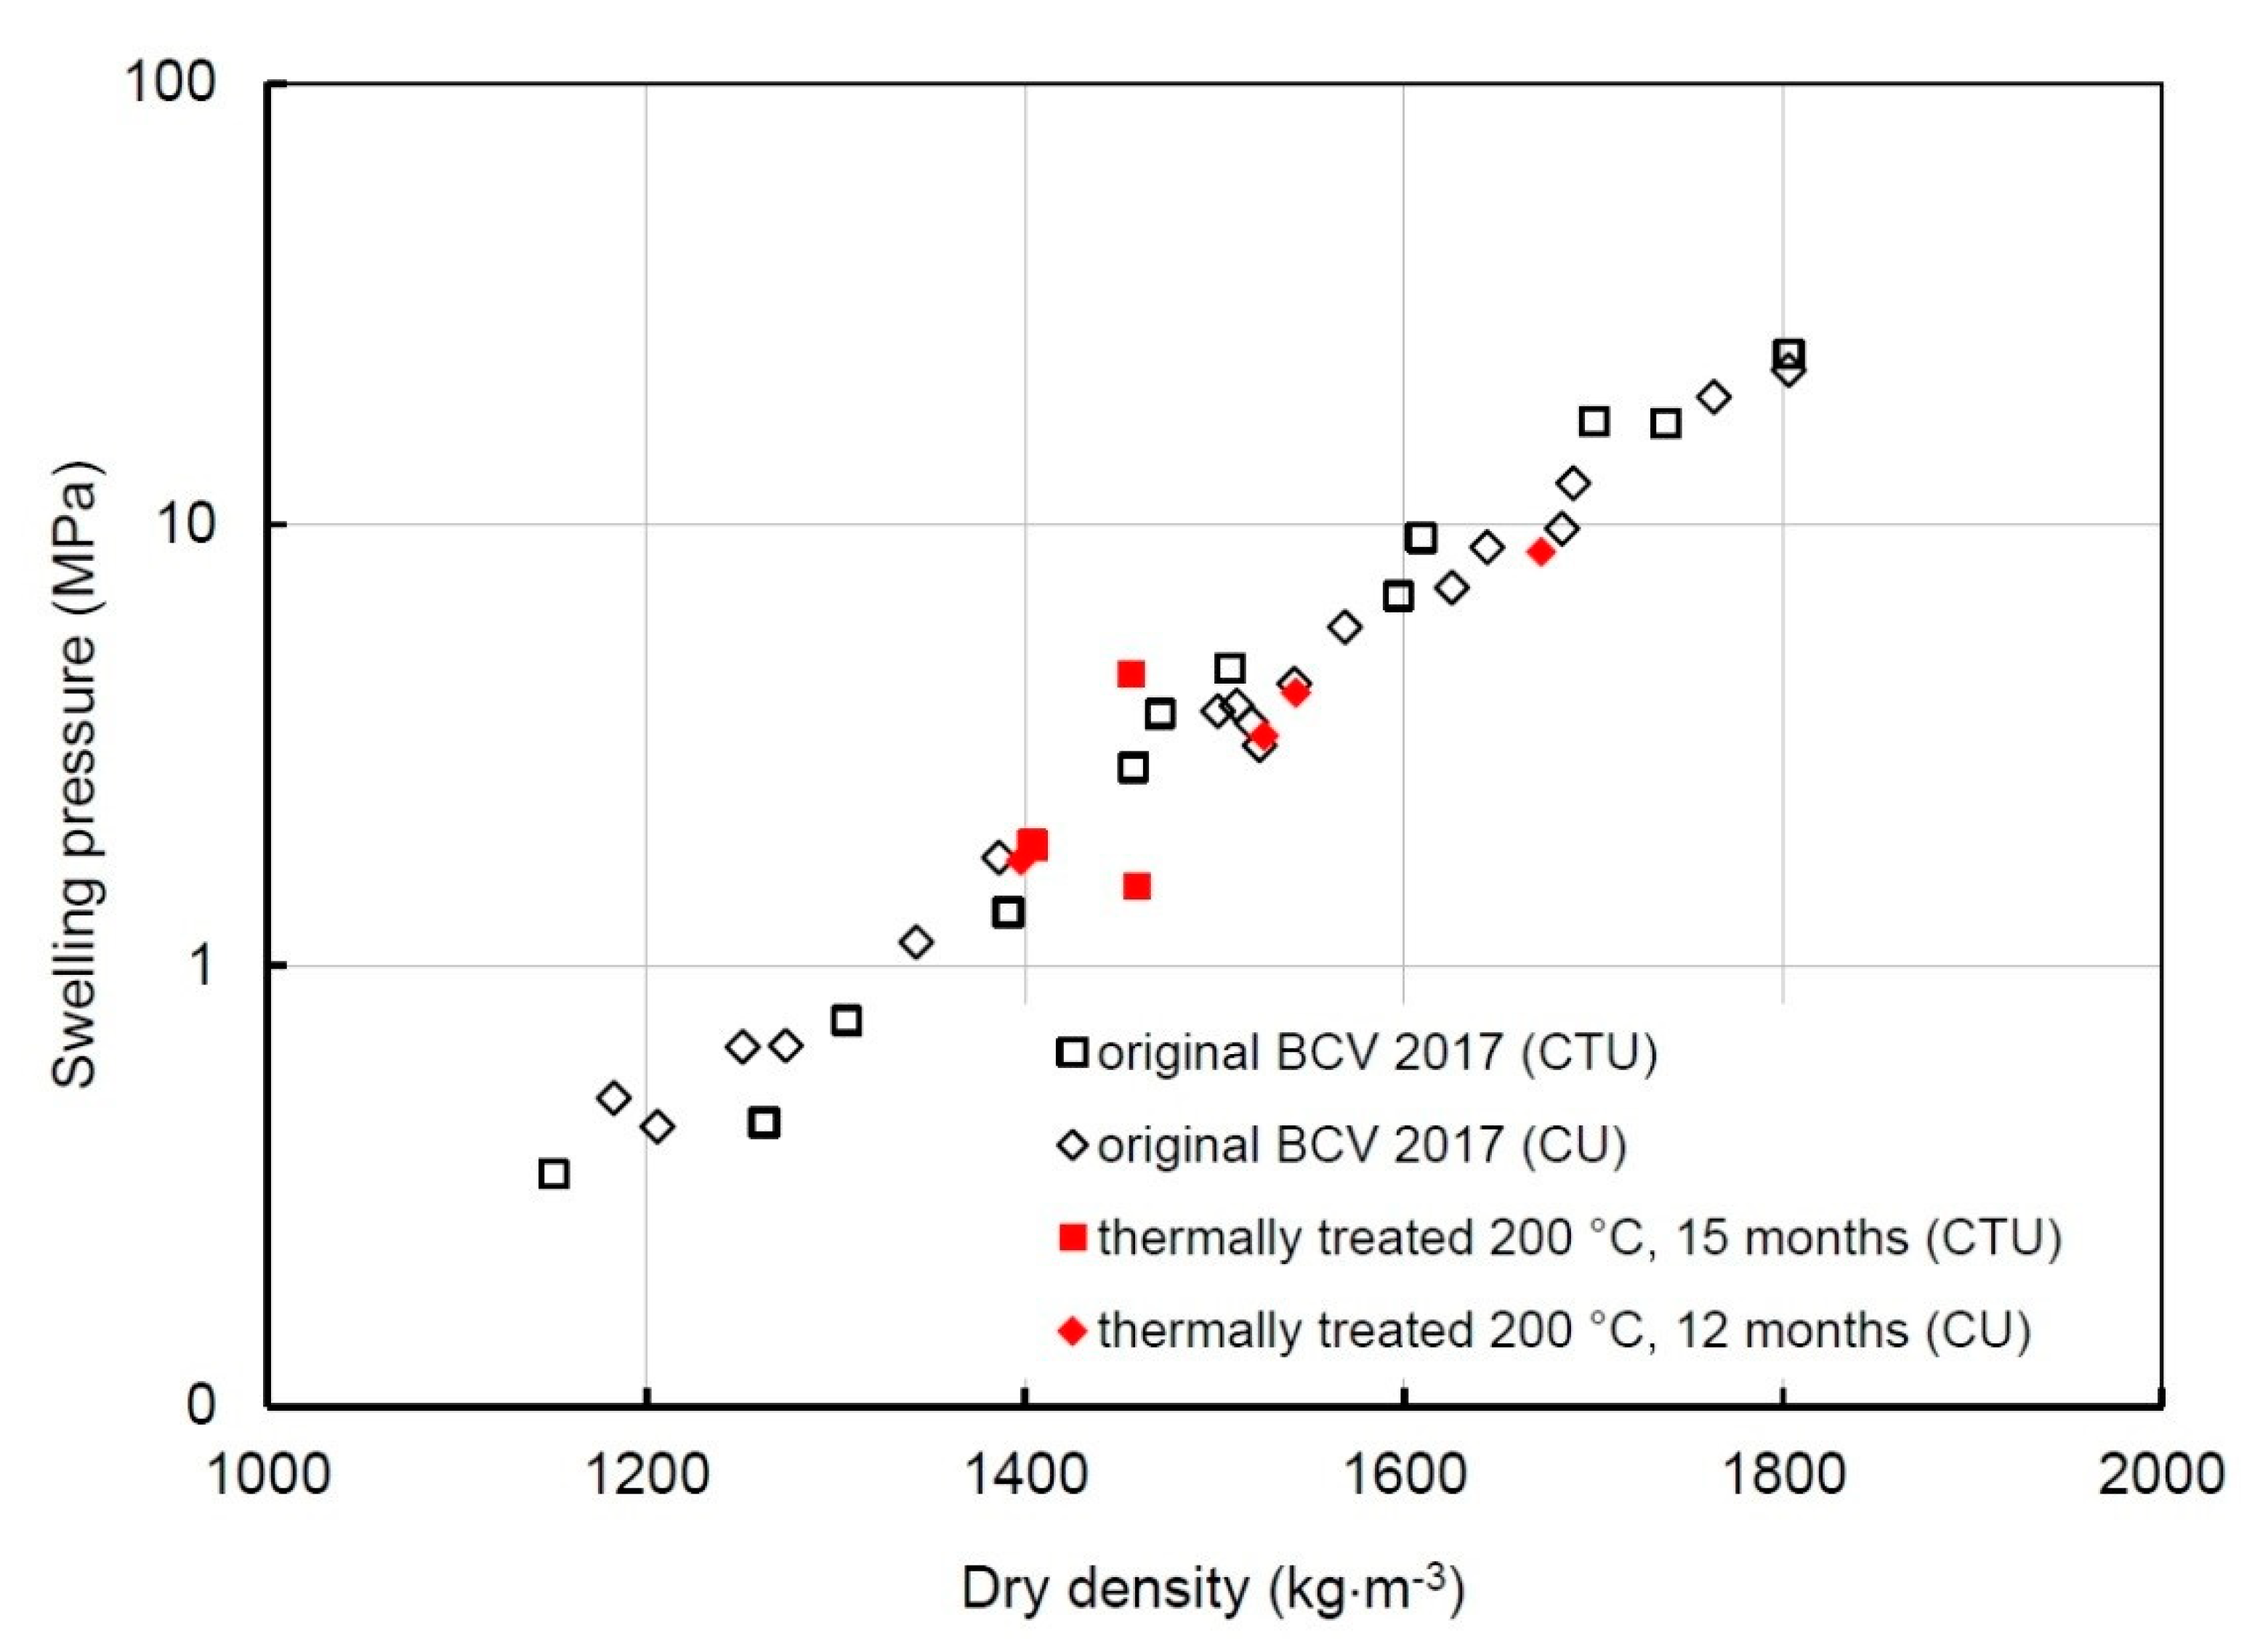
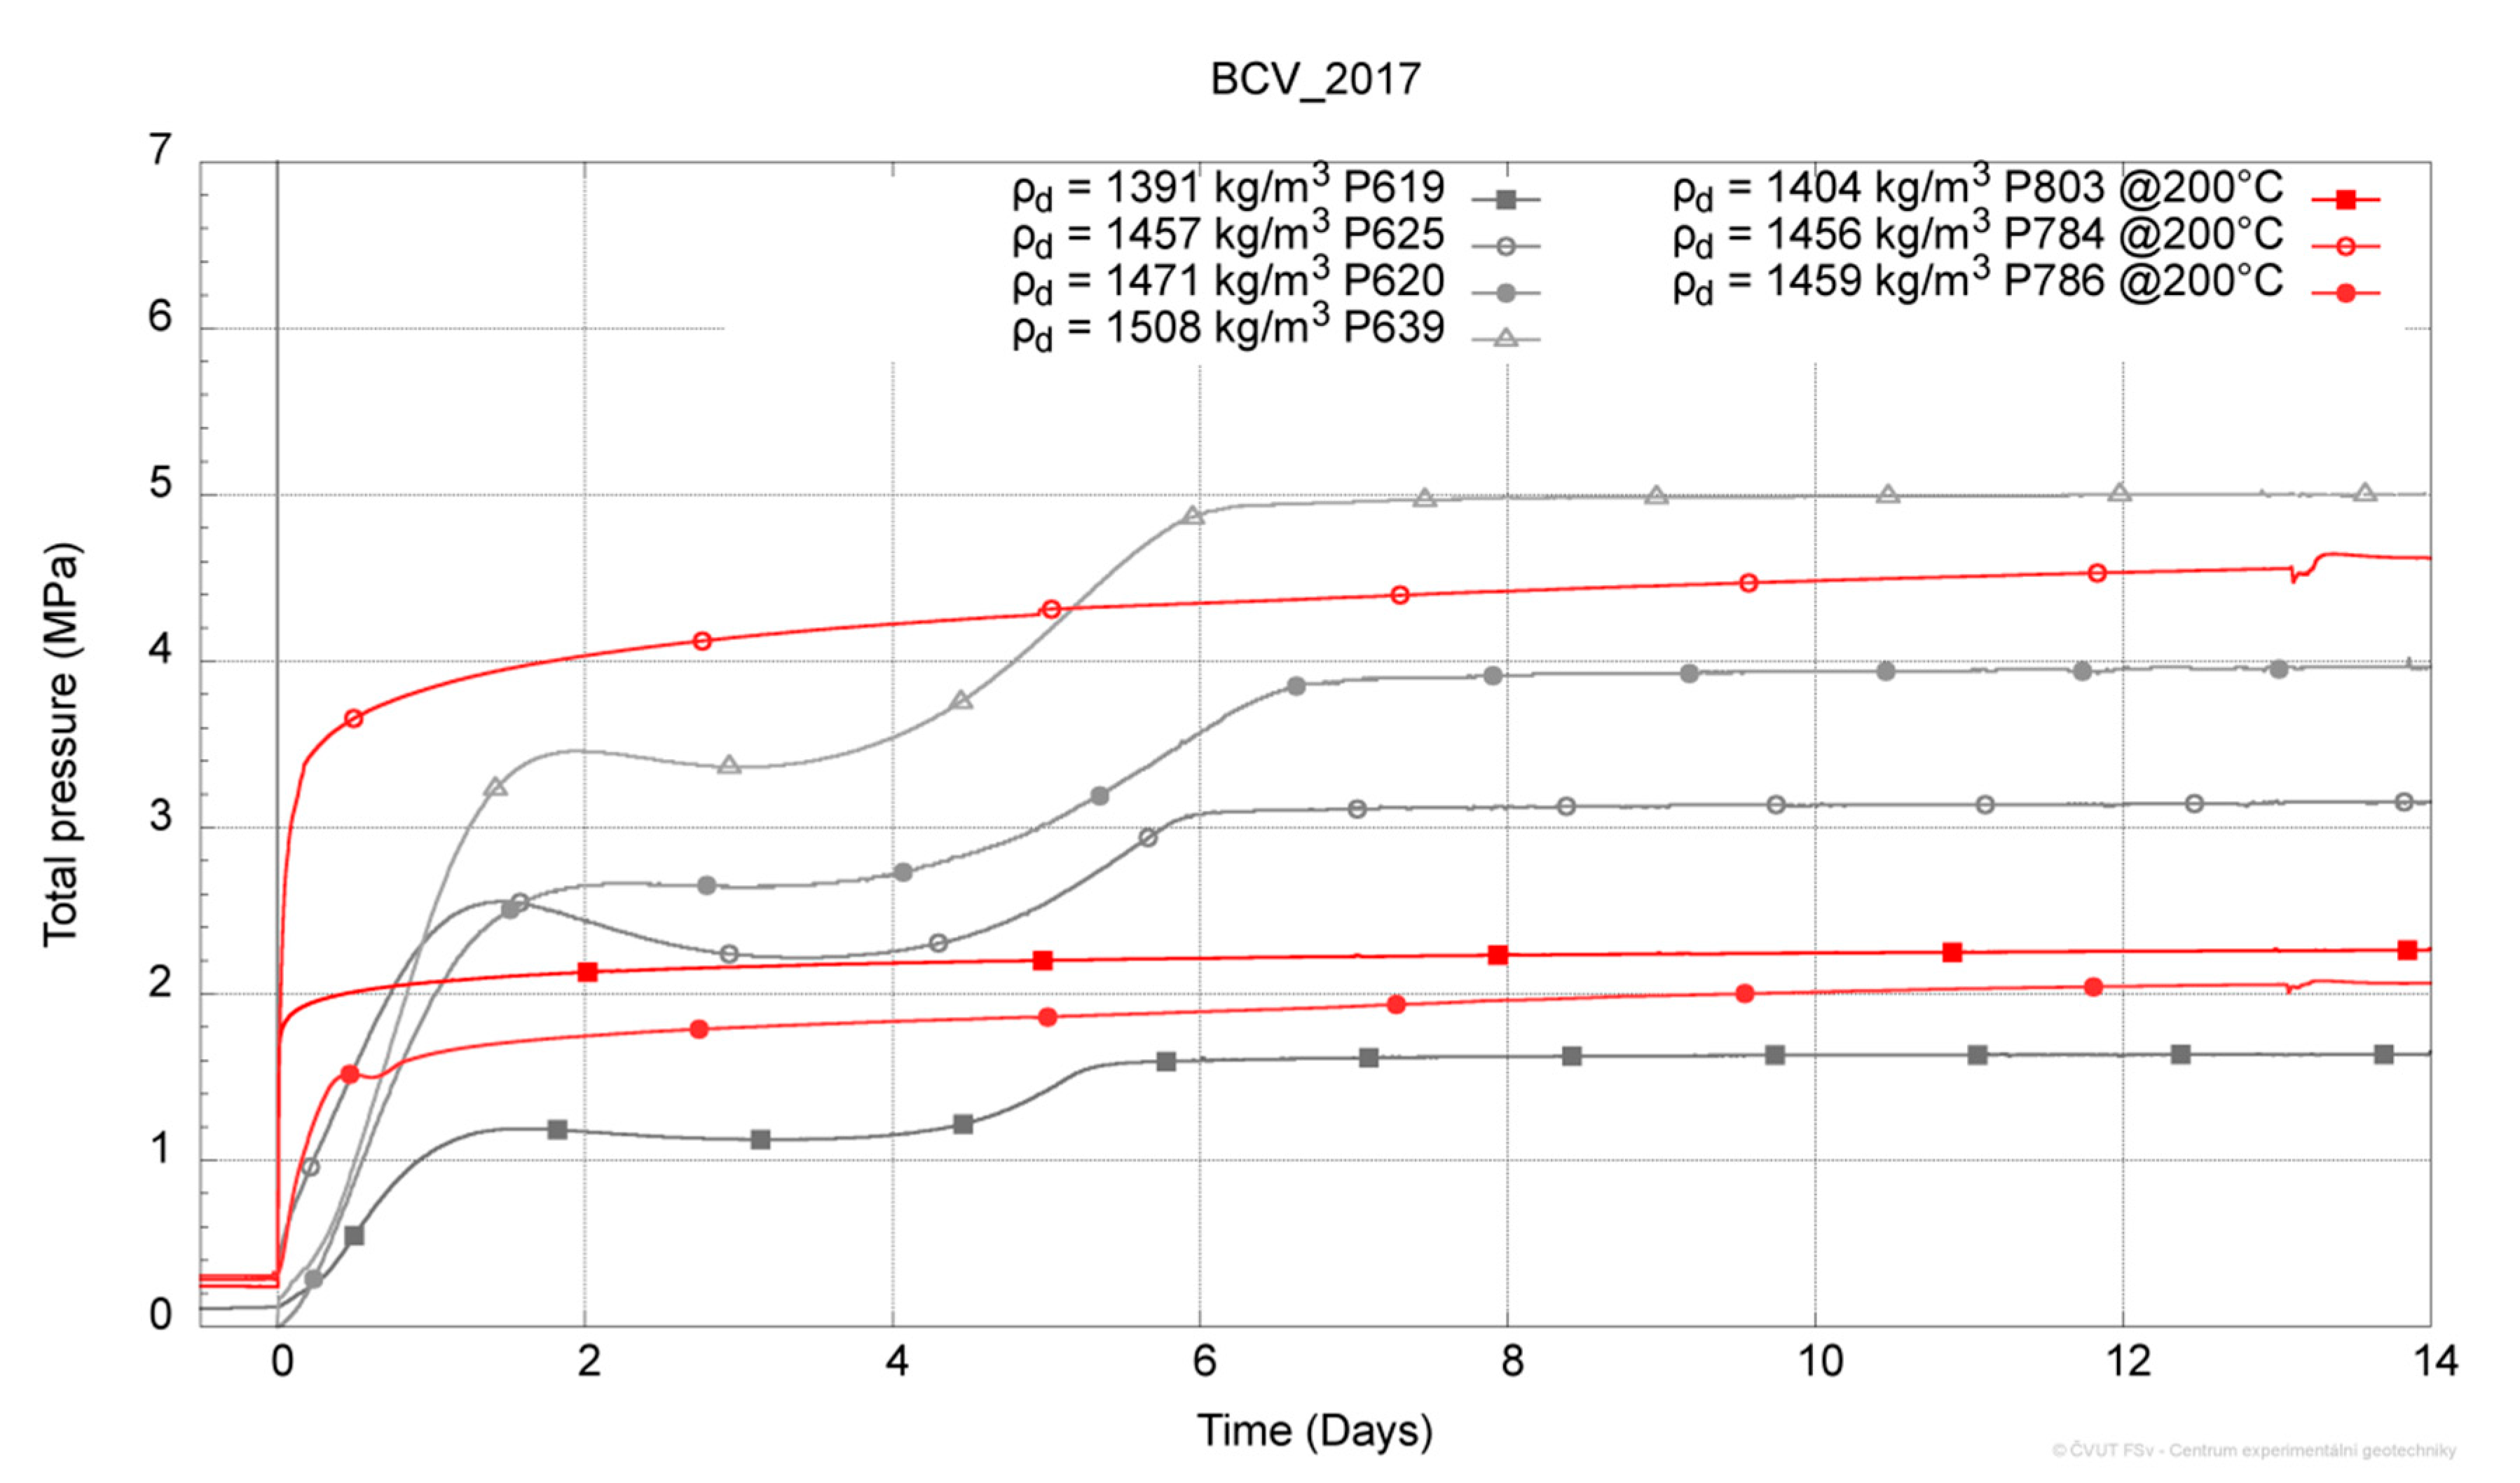
3.8. Swelling Pressure

The swelling pressure results for the original and the thermally treated BCV 2017 (200 °C; 15 month) are presented in Figure 9. The data concerning the original BCV 2017 material were taken from [13,16], H2020 Beacon project [16], IE Bukov [15,58]. Even though the results were determined by two independent laboratories, i.e., at the Charles University (CU) and the Czech Technical University (CTU), they are consistent with each other, which suggests that the measurements are not biased due to some hidden experimental problems. Figure 9 presents three results for the thermally treated material (red squares).
The results for the thermally treated material do not indicate a significant shift from the original material; however, the scatter of the results appears to be more extensive.
A further consideration concerns the evolution of (total) pressure following the commencement of saturation. Samples with dry densities of approx. 1400–1500 kg·m−3 were selected for comparison purposes. Figure 10 clearly indicates the significantly more rapid process with respect to the treated material, i.e., approx. two days was sufficient to attain at least 90% of the final total pressure. The original material required approx. 3 times longer (6 days) to attain the same pressure level. The temporary “sagging” of the pressure was absent during the early phase of the saturation of the thermally treated samples.
The potential slower water adsorption due to thermal treatment may have been the reason of the higher level of permeability of the sample at the beginning of the test; the probable consequence comprises the more uniform and more rapid saturation throughout the whole of the volume of the thermally treated sample.

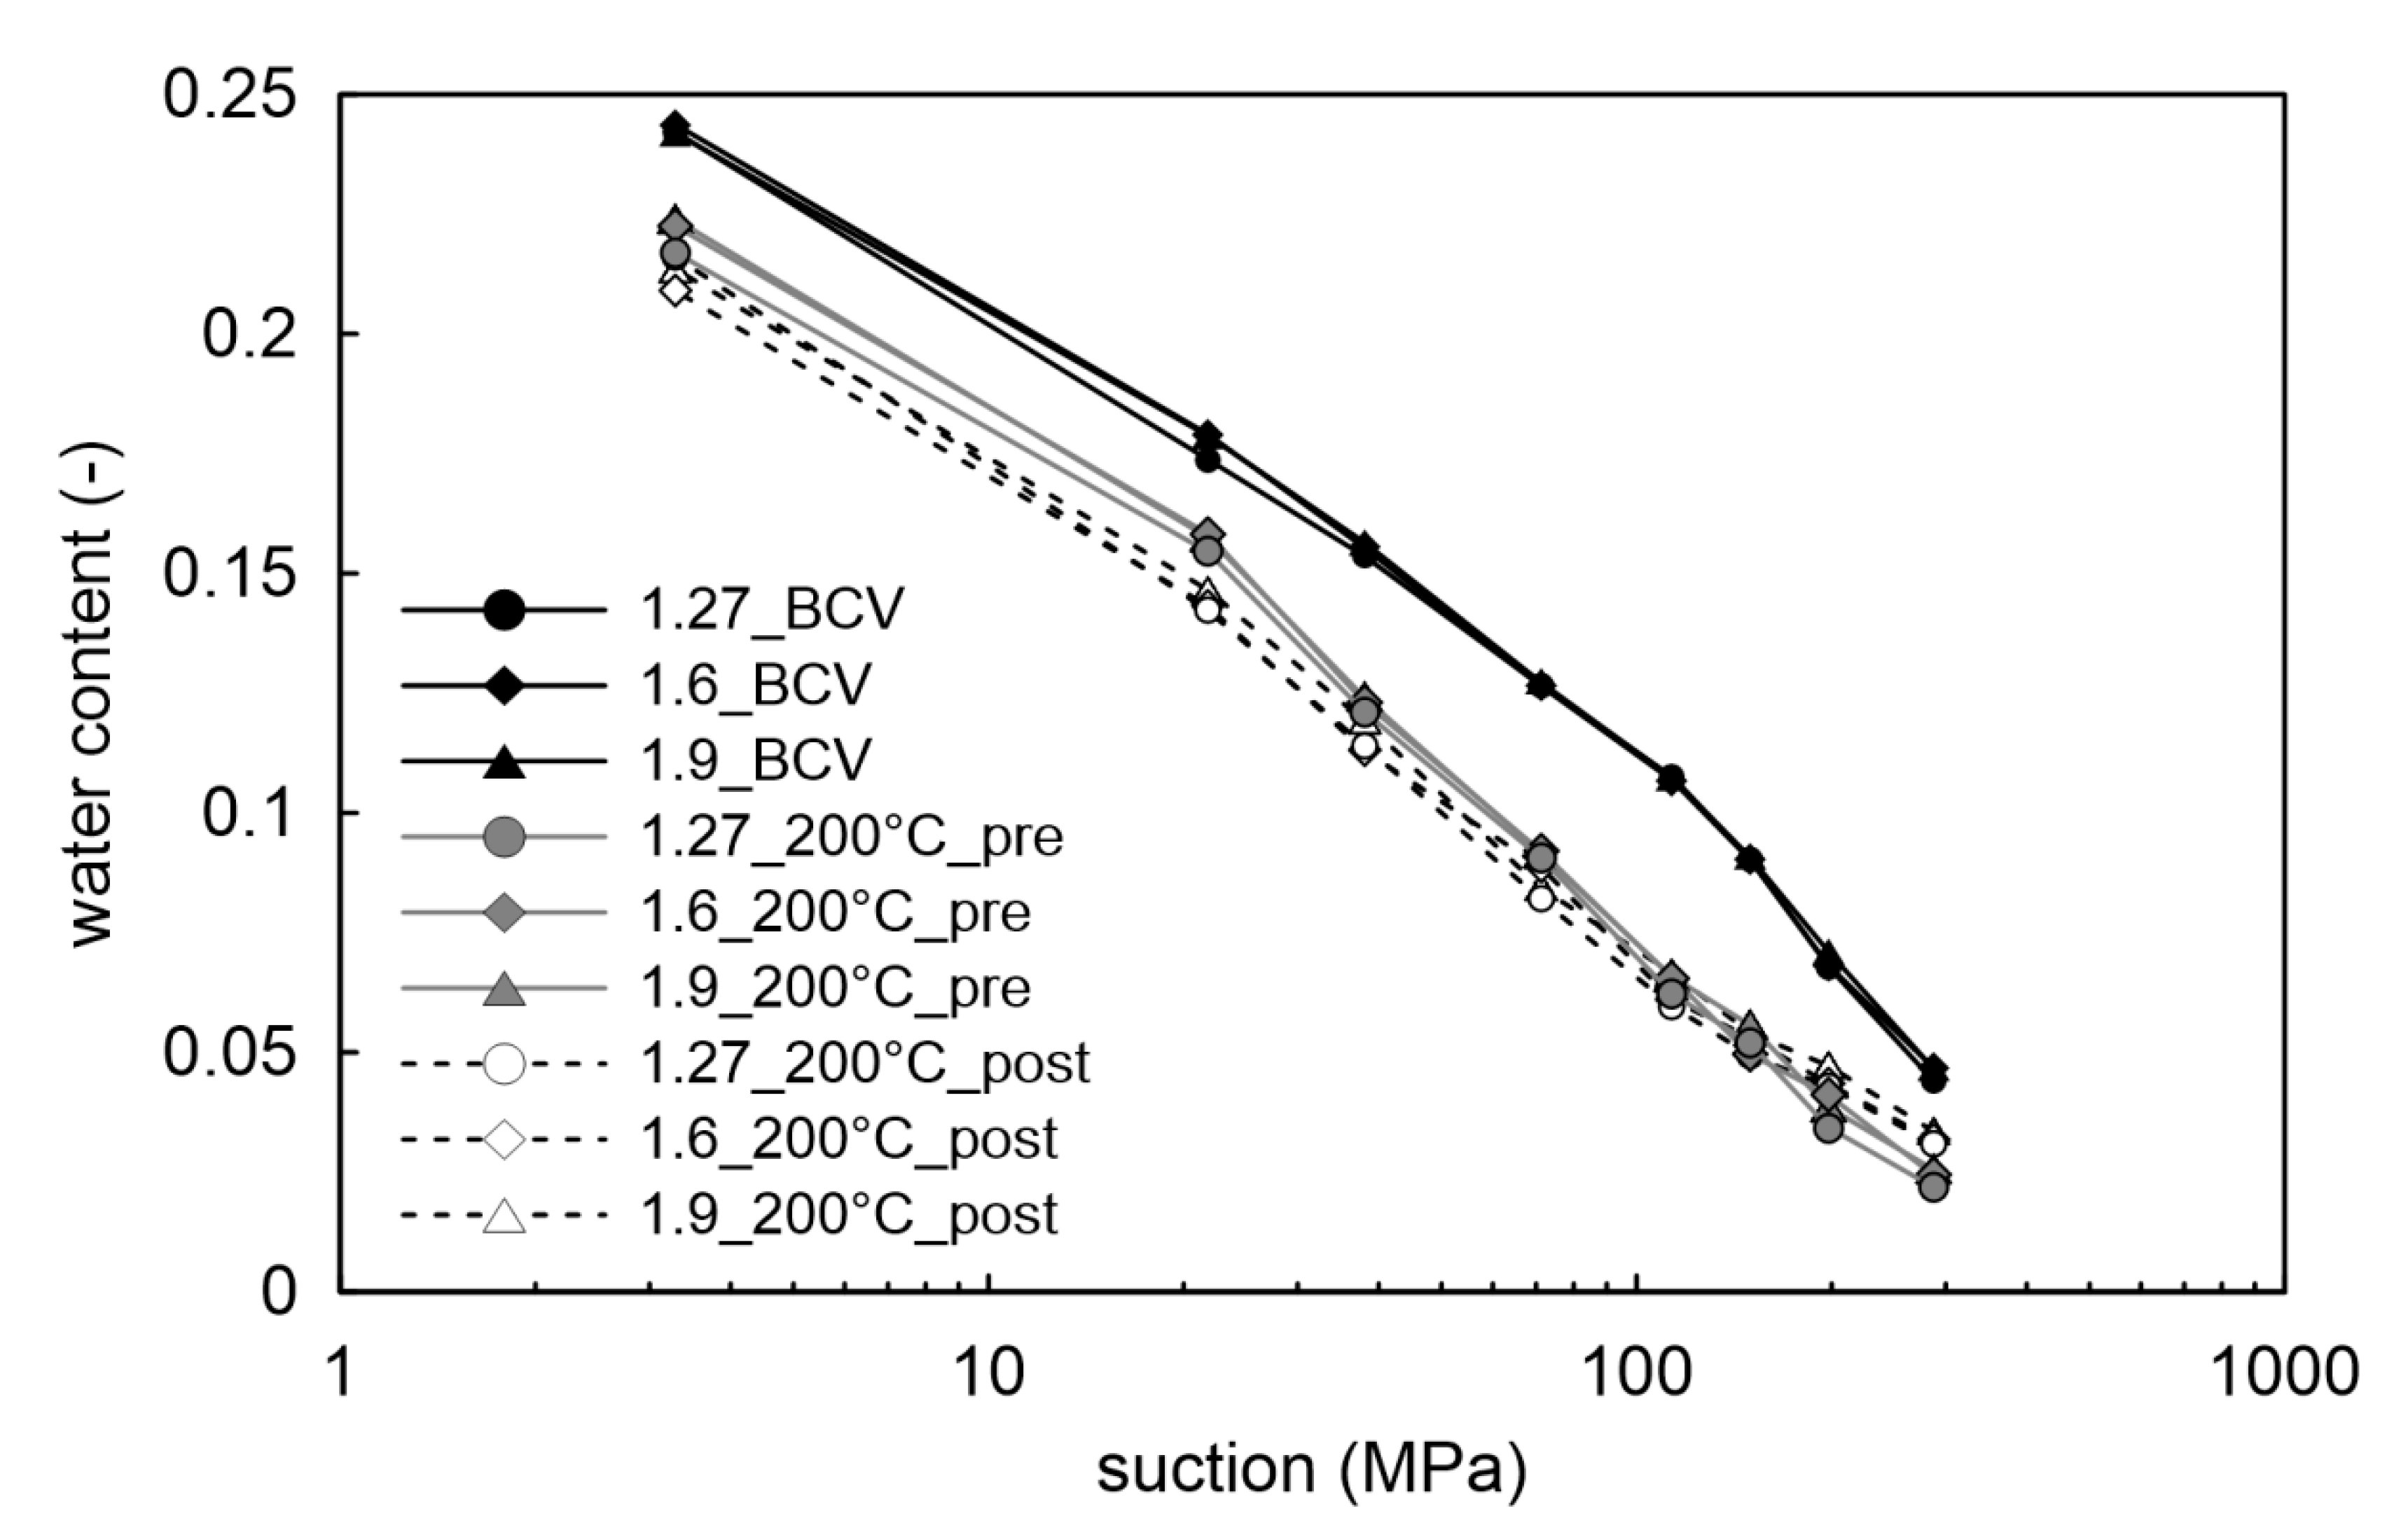
3.9. Water Retention Curves

Figure 11 provides a summary of three sets of water retention curves. It reveals the negligible effect of the initial density on the water content, which can be explained by the double porosity structure typical for bentonites [59,60]. At high suctions, water is concentrated predominantly in micropores inside the aggregates, which are not significantly influenced by compaction [61].
The results clearly demonstrate the lower retention capacity of the thermally treated samples than that of the original BCV 2017 bentonite. The reduction was approximately constant over the whole of the suction range (3–287 MPa), which corresponds to relative humidities of 12–98%. Only a small difference was observed between the samples compacted before and after thermal treatment. Results are compiled in Supplementary Materials (data water retention curves).
The results indicate that thermally treated bentonite BCV 2017 fully rehydrates when it is exposed to free water (Figure 7) and its mechanical behaviour is reaching similar values compared to original BCV 2017 bentonite as demonstrated by swelling pressures (Figure 9) or overall trend in liquid limit determination (Table 4). On the other hand, when exposed to air humidity, re-hydration process is only partial and takes significantly longer time (Section 3.5, Figure 10). This behaviour is very likely related to the irreversible collapse of the interlayer structure of some smectite crystallites after heating.

4. Conclusions

Both the original BCV 2017 bentonite and the material thermally treated at 200 °C were characterised via chemical, mineralogical and thermal analysis, infrared spectroscopy, the specific area (BET), the swell index, the liquid limit, the swelling pressure and water retention curves. The results of the various methods were subsequently quantitatively analysed and compared, which led to the following main conclusions:
(i)
The original BCV 2017 bentonite contains around 69.7 wt.% of montmorillonite, which is characterised by Fe3+ substitution in the octahedral sheet and Mg and Ca prevailing cations in the interlayer space.
(ii)
The BCV 2017 bentonite underwent two main transformation processes following thermal treatment at 200 °C over 27 months. The first transformation process comprised the dehydration of the smectite (i.e., the removal of the interlayer water) and a reduction in the 001 basal spacing from 14.5 Å (the original BCV 2017) to 9.8 Å following thermal treatment, which indicated the absence of water molecules in the interlayer space. The second reaction concerned the -dehydroxylation of goethite to hematite, which was related to the apparent change in the colour of the samples from yellow to pale brown with red shading.
(iii)
The PXRD and IR spectroscopic study revealed the crystallochemical stability of the montmorillonite in the BCV 2017 bentonite under selected experimental conditions. With the exception of the dehydration of the interlayer space, no deterioration occurred in the montmorillonite crystal structure during the experiment.
(iv)
Heating at 200 °C was found to have little effect on the BET-N2 specific area. The isotherms determined for the original and the thermally treated BCV 2017 were of the IV type with H4 hysteresis loops that indicated that both types of BCV 2017 samples comprise mesoporous materials with the limited contribution of microporosity.
(v)
The saturation of the thermally treated BCV 2017 (i.e., with a d001 of 9.8 Å, 0W) from the aqueous phase resulted in montmorillonite with bihydrated layers (2W) in the interlayer space with a d001 spacing of 15.1 Å.
(vi)
The geotechnical tests indicated no major changes in the mechanical properties of the thermally treated BCV 2017 bentonite as demonstrated by their similar swelling pressure values. However, the variation in the swell index and the gradual increase in the liquid limit over the wetting time indicated a lower hydration rate.
(vii)
The retention curves consistently pointed to the lower retention capacity of the thermally treated samples, which indicated the incomplete re-hydration of the thermally treated bentonite exposed to air humidity and a difference in the behaviour of the material compared to the bentonite exposed to liquid water.
Despite indications of slower resaturation of BCV 2017 bentonite after thermal treatment followed by higher level of permeability during saturation phase, swelling ability remained unchanged which forms important result for the overall buffer function. The heating at 200 °C causes dehydration of the interlayer water from the montmorillonite structure; however, the thermally treated BCV 2017 bentonite fully rehydrates when it is exposed to free water. The complex multidisciplinary dataset describing behaviour of BCV, a suitable representative of Czech Ca-Mg bentonites, is an important milestone towards potential usage of higher temperatures in the deep repository. The results indicate that temperature limit of 200 °C could be feasible.

Supplementary Materials

The following are available online at https://www.mdpi.com/article/10.3390/min11080871/s1, PXRD data of original and thermally treated BCV 2017, thermal analysis data, silicate analysis data, retention curves data, specific surface measurements data (BET), protocols from liquid limits and swell index determination.

Author Contributions

Conceptualisation F.L., I.H., J.S., R.V., J.N. and D.M.; investigation F.L., J.S., R.V., J.N., M.Č., M.K., F.P., L.V. and H.S.; writing—original draft preparation F.L., I.H., J.S., R.V. and J.N. All authors have read and agreed to the published version of the manuscript.

Funding

This study was supported by the Engineered barrier 200C project (no. TK01030031) awarded by the Technology Agency of the Czech Republic. The fifth and eleventh authors were supported by project no. TK01010063 awarded by the Technology Agency of the Czech Republic.

Acknowledgments

The authors would like to thank M. Lhotka (UCT Prague) for the specific surface measurements, J. Havlín (UCT Prague) for the thermal analysis measurements, K. Černochová (CTU Prague) for swell index and swelling pressure measurements and D. Nádherná (CTU Prague) for liquid limit measurements.

Conflicts of Interest

The authors declare no conflict of interest.

References

  1. NAGRA. Project “Gewähr 1985”, Feasibility and Safety Studies for Final Disposal of Radioactive Wastes in Switzerland; Nagra: Wettingen, Switzerland, 1985. [Google Scholar]
  2. SKB Swedish Nuclear Fuel and Waste Management Company. Treatment and Final Disposal of Nuclear Waste: Programme for Encapsulation Deep Geologic Disposal, and Research, Development and Demonstration; RD&D Programme 95; SKB Swedish Nuclear Fuel and Waste Management Company: Stockholm, Sweden, 1995. [Google Scholar]
  3. Pusch, R. Transport of radionuclides in smectite clay. In Environmental Interactions of Clays; Parker, A., Rae, J.E., Eds.; Springer: Berlin/Heidelberg, Germany, 1998; pp. 7–35. [Google Scholar]
  4. Savage, D.; Lind, A.; Arthur, R.C. Review of the Properties and Uses of Bentonite as a Buffer and Backfill Material; SKI Report 99:9; Swedish Nuclear Fuel and Waste Management Company: Stockholm, Sweden, 1999. [Google Scholar]
  5. Borrelli, R.A.; Thivent, O.; Ahn, J. Parametric studies on confinement of radionuclides in the excavated damaged zone due to bentonite type and temperature change. Phys. Chem. Earth 2013, 65, 32–41. [Google Scholar] [CrossRef]
  6. Pusch, R.; Kasbohm, J.; Pacovsky, J.; Cechova, Z. Are all smectite clays suitable as “buffers”? Phys. Chem. Earth 2007, 32, 116–122. [Google Scholar] [CrossRef]
  7. Villar, M.V.; Lloret, A. Influence of temperature on the hydro-mechanical behaviourof a compacted bentonite. Appl. Clay Sci. 2004, 26, 337–350. [Google Scholar] [CrossRef]
  8. Ye, W.M.; Zhang, Y.W.; Chen, B.; Zheng, Z.J.; Chen, Y.G.; Cui, Y.J. Investigation on compression behaviour of highly compacted GMZ01 bentonite with suction and temperature control. Nucl. Eng. Des. 2012, 252, 11–18. [Google Scholar] [CrossRef]
  9. Ye, W.M.; Zheng, Z.J.; Chen, B.; Chen, Y.G.; Cui, Y.J.; Wang, J. Effects of pH and temperature on the swelling pressure and hydraulic conductivity of compacted GMZ01 bentonite. Appl. Clay Sci. 2014, 101, 192–198. [Google Scholar] [CrossRef]
  10. Svoboda, J.; Vašíček, R. Preliminary geotechnical results from the Mock-Up-CZ experiment. Appl. Clay Sci. 2010, 47, 139–146. [Google Scholar] [CrossRef]
  11. Šťástka, J. Mock-up Josef Demonstration Experiment. Tunel 2014, 23, 65–73. [Google Scholar]
  12. Červinka, R.; Vašíček, R.; Večerník, P.; Kašpar, V. Complete Characterization of Bentonite BCV Technical Report SÚRAO TZ419/2019; SÚRAO: Prague, Czech Republic, 2018.
  13. Hausmannová, L.; Hanusová, I.; Dohnálková, M. Summary of the Research of Czech Bentonites for Use in the Deep Geological Repository—Up to 2018; Technical Report SÚRAO 309/2018/ENG; SÚRAO: Prague, Czech Republic, 2018.
  14. Kober, F.; Vomvoris, S.; Finsterle, S. HotBENT—High Temperature Buffer Experiment: Preliminary Design Study—Overview of Results; Arbeitsbericht NAB17-29; Nagra: Wettingen, Switzerland, 2018. [Google Scholar]
  15. Svoboda, J.; Vašíček, R.; Smutek, J.; Hausmannová, L.; Franěk, J.; Rukavičková, L.; Večerník, P. Interaction Experiment at the Bukov URF. In Proceedings of the 4th International Conference entitled “Underground Construction Prague 2019”, Prague, Czech Republic, 3–5 June 2019. [Google Scholar]
  16. Baryla, P.; Bernachy-Barbe, F.; Bosch, J.; Campos, G.; Carbonell, B.; Daniels, K.; Ferrari, A.; Guillot, W.; Gutiérrez-Álvarez, C.; Harrington, J.; et al. Bentonite Mechanical Evolution-Experimental Work for the Support of Model Development and Validation; Technical Report D4.1/2, Euratom Research and Training Programme, No. 745942; European Union: Maastricht, The Netherlands, 2019. [Google Scholar]
  17. Svoboda, J.; Vašíček, R.; Šťástka, J.; Kruis, J.; Krejčí, T.; Mašín, D.; Najser, J.; Franěk, J.; Rukavičková, L.; Laufek, F.; et al. TK01030031-Engineered Barrier 200C-Annual Report; CTU: Prague, Czech Republic, 2020. [Google Scholar]
  18. Dempírová, L.; Šikl, J.; Kašičková, R.; Zoulková, V.; Kříbek, B. The evaluation of precision and relative error of the main components of silicate analyses in Central Laboratory of the Czech Geological Survey. Zpr. Geol. Výzk. V Roce 2009, 2010, 326–330. (In Czech) [Google Scholar]
  19. Döbelin, N.; Kleeberg, R. Profex: A graphical user interface for the Rietveld refinement program BGMN. J. Appl. Crystallogr. 2015, 48, 1573–1580. [Google Scholar] [CrossRef] [Green Version]
  20. Ammann, L.; Bergaya, F.; Lagaly, G. Determination of the cation Exchange capacity of clays with copper complexes revisited. Clay Miner. 2005, 40, 441–453. [Google Scholar] [CrossRef]
  21. Nagelschmidt, G. On the lattice shrinkage and structure of montmorillonite. Z. Krist. 1936, 93, 481–487. [Google Scholar] [CrossRef]
  22. Bradley, W.F.; Grim, R.E.; Clark, G.F. A study of the behavior of montmorillonite upon wetting. Z. Krist. 1937, 97, 216–222. [Google Scholar]
  23. Méring, J.; Glaeser, R. Sur le rôle de la valence des cations échangeables dans la montmorillonite. Bull. Soc. Fr. Minéral. Cristallogr. 1954, 77, 519–530. [Google Scholar] [CrossRef]
  24. Ferrage, E.; Lanson, B.; Malikova, N.; Plançon, A.; Sakharov, B.A.; Drits, V.A. New insights on the distribution of interlayer water in bi-hydrated smectite from X-ray diffraction profile modeling of 00l reflections. Chem. Mater. 2005, 17, 3499–3512. [Google Scholar] [CrossRef] [Green Version]
  25. ASTM International. ASTM D5890-11th Standard Test Method for Swell Index of Clay Mineral Component of Geosynthetic Clay Liners; ASTM International: West Conshohocken, PA, USA, 2011; 7p. [Google Scholar]
  26. ČSN EN ISO 17892-12: Determination of Consistency Limits; ISO: Geneva, Switzerland, 2018.
  27. Delage, P.; Howat, M.D.; Cui, Y.J. The relationship between suction and swelling properties in a heavily compacted unsaturated clay. Eng. Geol. 1998, 50, 31–48. [Google Scholar] [CrossRef]
  28. OIML. The Scale of Relative Humidity (RH) of Air Certified Against Saturated Salt Solutions; The International Organization of Legal Metrology: Paris, France, 1996. [Google Scholar]
  29. Filipská, P.; Zeman, J.; Všijanský, D.; Honty, M.; Škoda, R. Key processes of long-term bentonite-water interaction at 90 °C: Mineralogical and chemical transformations. Appl. Clay Sci. 2017, 150, 234–243. [Google Scholar] [CrossRef]
  30. Harward, M.E.; Brindley, G.W. Swelling properties of synthetic smectites in relation to lattice substitutions. Clays Clay Miner. 1965, 13, 209–222. [Google Scholar] [CrossRef]
  31. Ferrage, E.; Lanson, B.; Sakharov, B.A.; Drits, V.A. Investigation of smectite hydration properties by modelling of X-ray diffraction profiles. Part Montmorillonite hydration properties. Am. Mineral. 2005, 90, 1358–1374. [Google Scholar]
  32. Ferrage, E.; Kirk, C.A.; Cressey, G.; Cuadross, J. Dehydration of Ca-montmorillonite at the crystal scale. Part 2 Mechanism and kinetics. Am. Mineral. 2007, 92, 1007–1017. [Google Scholar] [CrossRef]
  33. Ruan, H.D.; Frost, R.L.; Kloprogge, J.T. The behavior of hydroxyl units of synthetic goethite and its dehydroxylated producthematite. Spectrochim. Acta A 2001, 57, 2575–2586. [Google Scholar] [CrossRef]
  34. De Faria, D.L.A.; Lopes, F.N. Heated goethite and natural hematite: Can Raman spectroscopy be used to differentiate them? Vib. Spectrosc. 2007, 45, 117–121. [Google Scholar] [CrossRef]
  35. González, G.; Sagarzazu, A.; Villalba, R. Study of the mechano-chemical transformation of goethite to hematite by TEM and XRD. Mater. Res. Bull. 2000, 35, 2295–2308. [Google Scholar] [CrossRef]
  36. Walter, D.; Buxbaum, G.; Laqua, W. The mechanism of the thermal transformation from goethite to hematite. J. Therm. Anal. Calorim. 2001, 63, 733–748. [Google Scholar] [CrossRef]
  37. Přikryl, R.; Hanus, R.; Kolaříková, I.; Vejsada, J.A. Verification of Substitution of Bentonites by Montmorillonitic Clays; Technical Report SÚRAO 10/2002/Wol.; Posiva Oy: Eurajoki, Finland, 2004. [Google Scholar]
  38. Russel, J.D.; Fraser, A.R. Infrared methods. In Clay Mineralogy Spectroscopic and Chemical Determinative Methods; Wilson, M.J., Ed.; Chapman & Hall: London, UK, 1994; pp. 11–67. [Google Scholar]
  39. Madejová, J.; Komadel, P. Baseline studies of the clay minerals society source clays: Infrared spectroscopy. Clays Clay Min. 2001, 49, 410–432. [Google Scholar] [CrossRef]
  40. Vaculíková, L.; Plevová, E.; Ritz, M. Characterization of montmorillonites by infrared and Raman spectroscopy for preparation of polymer-clay nanocomposites. J. Nanosci. Nanotechnol. 2019, 19, 2775–2781. [Google Scholar] [CrossRef]
  41. Stríček, I.; Šucha, V.; Uhlík, P.; Madejová, J.; Galko, I. Mineral stability of Fe-rich bentonite in the Mock-UP-CZ experiment. Geol. Carpathica 2009, 60, 431–436. [Google Scholar] [CrossRef] [Green Version]
  42. Velde, B. Introduction to Clay Minerals: Chemistry, Origins, Uses and Environmental Significance; Chapman & Hall: London, UK, 1992. [Google Scholar]
  43. Wang, H.; Shirakawabe, T.; Komine, H.; Ito, D.; Gotoh, T.; Ichikawa, Y.; Chen, Q. Movement of water in compacted bentonite and its relation with swelling pressure. Can. Geotech. J. 2020, 57, 921–932. [Google Scholar] [CrossRef]
  44. Guggenheim, S.; Van Groos, A.K. Baseline studies of the clay minerals society source clays: Thermal analysis. Clay Clay Miner. 2001, 49, 433–443. [Google Scholar] [CrossRef]
  45. Tajeddine, L.; Gailhanou, H.; Blanc, P.; Lassin, A.; Gaboreau, S.; Vieillard, P. Hydration–dehydration behavior and thermodynamics of MX-80 montmorillonite studied using thermal analysis. Thermochim. Acta 2015, 604, 83–93. [Google Scholar] [CrossRef]
  46. Drits, V.A.; Besson, G.; Muller, F. An improved model for structural transformations of heat-treated aluminous dioctahedral 2:1 layer silicates. Clays Clay Miner. 1995, 43, 718–731. [Google Scholar] [CrossRef]
  47. Drits, V.A.; Lindgreen, H.; Salyn, A.L.; Ylagan, R.; McCarty, D.K. Semiquantitative determination of trans-vacant and cis-vacant 2:1 layers in illites and illite-smectites by thermal analysis and X-ray diffraction. Am. Mineral. 1998, 83, 1188–1198. [Google Scholar] [CrossRef]
  48. Drits, V.A.; McCarty, D.K.; Zviagina, B.B. Crystalchemical factors responsible for the distribution of octahedral cations over trans- and cis-sites in dioctahedral 2:1 layer silicates. Clays Clay Miner. 2006, 54, 131–152. [Google Scholar] [CrossRef]
  49. Wolters, F.; Lagaly, G.; Kahr, G.; Nüesch, R.; Emmerich, K. A comprehensive characterization of dioctahedral smectites. Clays Clay Miner. 2009, 57, 115–133. [Google Scholar] [CrossRef]
  50. Kaufhold, S.; Kremleva, A.; Krüger, S.; Roesch, N.; Emmerich, K.; Dohrmann, R. Crystal-chemical composition of dioctahedral smectites: An energy-based assessment of empirical relations. ACS Earth Space Chem. 2017, 1, 629–636. [Google Scholar] [CrossRef]
  51. Wang, X.; Li, Y.; Wang, H. Structural Characterization of Octahedral Sheet in Dioctahedral Smectites by Thermal Analysis. Minerals 2020, 10, 347. [Google Scholar] [CrossRef]
  52. Karathanasis, A.D. Thermal Analysis of Soil Minerals. In Methods of Soil Analysis Part 5; Ulery, A.L., Dree, L.R., Eds.; Soil Science Society of America, Inc.: Medison, WI, USA, 2008; pp. 117–160. [Google Scholar]
  53. Číčel, B.; Krantz, G. Mechanism of montmorillonite structure degradation by percussive grinding. Clay Miner. 1981, 16, 151–162. [Google Scholar] [CrossRef]
  54. Holmboe, M.; Wold, S.; Jonsson, M. Porosity investigation of compacted bentonite using XRD profile modeling. J. Contam. Hydrol. 2012, 128, 19–32. [Google Scholar] [CrossRef] [PubMed]
  55. Kaufhold, S.; Dohrmann, R.; Klinkenberg, M.; Siegesmund, S.; Ufer, K. N2-BET specific surface area of bentonites. J. Colloid Interface Sci. 2010, 349, 275–282. [Google Scholar] [CrossRef]
  56. Rutherford, D.W.; Chiou, C.T.; Eberl, D.D. Effects of exchanged cation on the microporosity of montmorillonite. Clay Clay Miner. 1997, 45, 534–543. [Google Scholar] [CrossRef]
  57. Lang, L.Z.; Xiang, W.; Huang, W.; Cui, D.S.; Schanz, T. An experimental study on oven-drying methods for laboratory determination of water content of a calcium-rich bentonite. Appl. Clay Sci. 2017, 150, 153–162. [Google Scholar] [CrossRef]
  58. Svoboda, J.; Vašíček, R.; Pacovská, D.; Šťástka, J.; Franěk, J.; Rukavičková, L.; Večerník, P.; Červika, R.; Nahodilová, R.; Laufek, F.; et al. Interakční Experiment-Přípravné a Podpůrné Práce [Research Report]; SÚRAO: Prague, Czech Republic, 2019.
  59. Romero, E.; Della Vecchia, G.; Jommi, C. An insight into the water retention properties of compacted clayey soils. Géotechnique 2011, 61, 313–328. [Google Scholar] [CrossRef]
  60. Mašín, D.; Khalili, N. Swelling phenomena and effective stress in compacted expansive clays. Can. Geotech. J. 2016, 53, 134–147. [Google Scholar] [CrossRef] [Green Version]
  61. Sun, H.; Mašín, D.; Najser, J.; Neděla, V.; Navrátilová, E. Bentonite microstructure and saturation evolution in wetting–drying cycles evaluated using ESEM, MIP and WRC measurements. Géotechnique 2018, 69, 713–726. [Google Scholar] [CrossRef]
Figure 1. Comparison of the PXRD patterns of the original and thermally treated (200 °C) BCV 2017 (CoKα radiation). The left inset illustrates the change in the 001 reflection of montmorillonite following thermal treatment; the right inset illustrates the disappearance of the goethite reflection following heating. (Mt = montmorillonite, Mt-0W = dehydrated montmorillonite, Ka = kaolinite, Q = quartz, I = illite, Ant = anatase, G = goethite, He = hematite, Mg-Cc = Mg-calcite, Sd = siderite, An = ankerite).
Minerals 11 00871 g001
Figure 2. Comparison of (a) original and (b) thermally treated BCV 2017 at 200 °C. Note the presence of a thin dark crust on the surface of the thermally treated material.
Minerals 11 00871 g002
Figure 3. Microscopic images of thermally treated BCV 2017: (a,b) a crust that formed on the surface of the sample; (c,d) bulk material. Note the difference in grain size between the crust and bulk material.
Minerals 11 00871 g003
Figure 4. Infrared spectra of the original and the thermally treated BCV 2017 obtained via the (a) KBr pellet and (b) the ATR techniques.
Minerals 11 00871 g004
Figure 5. Comparison of (a) DTA, (b) TG curves and mass spectroscopy signals for (c) water and (d) carbon dioxide for the original and the thermally treated BCV 2017.
Minerals 11 00871 g005
Figure 6. Cation exchange capacity (CEC) of the original and the thermally treated BCV 2017.
Minerals 11 00871 g006
Figure 7. Evolution of (a) the PXRD profile, (b) the d and FWHM of the 001 montmorillonite reflection for the thermally treated BCV 2017 sample during saturation from the aqueous phase (CoKα radiation). The days indicate the duration of saturation. I: illite, Ka: kaolinite.
Minerals 11 00871 g007
Figure 8. Absorption and desorption isotherms for original and thermally treated bentonite BCV 2017.
Minerals 11 00871 g008
Figure 9. Dependency of swelling pressure on dry density—the original BCV 2017 material in black and the thermally treated material in red. Results were obtained by laboratories at Charles University (CU) and Czech Technical University (CTU).
Minerals 11 00871 g009
Figure 10. Evolution of the swelling pressure—the original material (black) and the thermally treated (red) materials; dry density of approx. 1400–1500 kg·m−3.
Minerals 11 00871 g010
Figure 11. Water retention curves determined for three sets of samples of BCV 2017. The samples compacted before thermal treatment are marked “pre”, while the samples compacted after thermal loading are marked “post”.
Minerals 11 00871 g011
Table 1. Chemical composition of the original and the thermally treated bentonite BCV 2017.
Wt.%Original BCV 2017Thermally Treated BCV 2017
SiO251.8652.39
TiO22.342.60
Al2O315.5615.13
Fe2O311.4113.69
FeO0.140.10
MgO2.823.01
MnO0.200.24
CaO2.832.99
Na2O0.370.41
K2O1.020.95
P2O50.510.53
F0.120.10
CO21.681.60
C0.170.11
S<0.0100.02
H2O+9.066.34
Total100.09100.22
H2O9.231.48
Table 2. Semiquantitative PXRD phase analysis of the original and the thermally treated BCV 2017 bentonite (in wt.%).
Wt.%Original BCV 2017Thermally Treated BCV 2017 (200 °C)
Anatase2.32.6
Quartz11.411.8
Montmorillonite69.770.7 *
Mg-calcite3.73.3
Goethite3.1n.d.
Hematiten.d.1.7
Kaolinite5.05.5
Ankerite0.60.6
Siderite0.50.4
Illite3.73.4
* Corresponds to dehydrated montmorillonite (0W). n.d. not detected.
Table 3. Positions of the absorption bands (cm−1) in the IR spectra of the original and the thermally treated (200 °C) samples of BCV 2017 acquired via the by KBr and ATR measuring techniques, and their assignments.
Assignment of the Spectral BandsOriginal BCV 2017Thermally Treated BCV 2017
KBrATRKBrATR
Kaolinite (minor phase)
OH stretching of the inner-surface hydroxyl groups
3698 *36953699 *3695
Kaolinite (minor phase)
OH stretching of the inner-surface hydroxyl groups
3647 *36433647 *-
OH stretching of the structural hydroxyl groups3623 *36183622 *3618
Chlorite (admixture)3565 *---
OH stretching of the adsorbed water molecules3385 *-3385 *-
OH deformation of the adsorbed water molecules1646162616361628
Carbonates (minor phases)1424145414291445
Quartz (admixture)1170-1167-
Si−O stretching (longitudinal mode)1118111611161116
In plane Si−O stretching1037102210411025
In plane Si−O stretching-1004-1004
Al−Al−OH deformation912916917912
Al−Fe−OH deformation877875874877
Quartz (minor phase)798798798798
Quartz (minor phase)776779776779
Quartz (minor phase)695692694695
Al−O−Si deformation524518527518
Si−O−Si deformation469453470458
Si−O deformation422416420414
* KBr pellet prepared from 2.0 mg of the sample with a 200 mg/KBr pellet heated overnight at 150 °C. - not observed.
Table 4. Swell index and liquid limit of the BCV 2017.
TreatmentSwell Index SI (mL/2g)Liquid Limit wL (%)
original7.5@1d (7.12.2020)
8.3@1d, 8.8@2d, 9.3@7d, 9.4@10d (14.6.2021)
130%;
139% [3,4]
200 °C; 15 months5.5@1d, 5.5@2d, 5.6@7d, 6.5@10d (bulk, 14.6.2021)111% (wetted 24 h);
118% (wetted 10 days)
200 °C; 27 months5.7@1d (bulk)
5.8@1d (top layer)
x
x not measured, @ time from test start.
Publisher’s Note: MDPI stays neutral with regard to jurisdictional claims in published maps and institutional affiliations.

