Article

Chiroptical Properties and Conformation of Four Lasiocepsin-Related Antimicrobial Peptides: Structural Role of Disulfide Bridges

1
Faculty of Mathematics and Physics, Charles University, Ke Karlovu 5, 121 16 Prague 2, Czech Republic
2
Institute of Organic Chemistry and Biochemistry AS CR v.v.i., Fleming Square 2, 166 10 Prague 6, Czech Republic
3
BioTools, Inc., 17546 Bee Line Highway, Jupiter, FL 33548, USA
*
Authors to whom correspondence should be addressed.
Symmetry 2020, 12(5), 812; https://doi.org/10.3390/sym12050812
Submission received: 17 April 2020 / Revised: 1 May 2020 / Accepted: 7 May 2020 / Published: 13 May 2020
(This article belongs to the Special Issue Symmetric and Asymmetric Structure in Drug Design and Biomolecules)

Abstract

:
We report an investigation of the role of disulfide bridges in the 27-residue antimicrobial peptide lasiocepsin (I) containing two disulfide groups (Cys8–Cys25, Cys17–Cys27) and three its analogs lacking one (II, III) or both (IV) native disulfides. Selective alternate incorporation of one or both disulfide bridges influences symmetry, conformation and biological properties of these peptides as demonstrated in their chiroptical (particularly Raman) properties. The effect of modifying the disulfide bridge pattern on the peptide secondary structure is investigated in water and in the presence of 2,2,2-trifluoroethanol and sodium dodecyl sulphate. A combination of experimental electronic and vibrational chiroptical data shows that both disulfide groups are necessary for stabilizing lasiocepsin secondary structure. While the Cys8–Cys25 disulfide group is important for sustaining lasiocepsin tertiary structure and maintaining its biological activity, the Cys17–Cys27 disulfide bridge has a supporting function consisting in reducing peptide flexibility.

1. Introduction

Lasiocepsin (I, see Figure 1, Table 1), a 27-residue peptide exhibiting substantial antibacterial and antifungal activities, has been discovered in the venom of eusocial bee Lasioglossum laticeps [1]. It is active against both Gram-positive and Gram-negative bacteria, exhibits antifungal activity against Candida albicans, and shows no hemolytic activity against human erythrocytes [1]. Lasiocepsin belongs to a large and structurally rather diverse family of antimicrobial peptides (AMPs), which are assumed to form the first natural defensive mechanism of practically all living organisms against wide spectrum of infections [2,3,4,5,6]. AMPs are in focus of scientific interest, because, compared to common antibiotics, they are less specific and evolution of bacterial resistance is typically rather limited [7]. These circumstances bring potential for the development of novel drugs and, consequently, AMPs are the subject of intense investigation concerning their structures, activities and mechanisms of action [3,4,8,9,10,11,12,13,14,15]. Short AMPs (10–20 amino acid residues) are typically unfolded in aqueous solution. When in contact with microbial cell membranes or with membrane-mimicking environments, they usually adopt, at least partially, α-helical conformation (often with amphipathic sides). Antimicrobial action then involves interaction of sides of these α-helical segments with either anionic membrane surfaces (cationic sides) or with lipophilic membrane interior (non-polar hydrophobic sides). These interactions then allow for bacterial cell disruption [4,11,16,17].
Unlike short AMPs, I adopts a well-defined secondary structure high in α-helical content already in neat aqueous solution (Figure 1). This is probably caused by a combination of two effects: (1) a somewhat larger size of I (27 amino acid residues) enables formation of several distinct conformational domains; and (2) conformation of I is specifically restricted by two disulfide bridges (Cys8–Cys25, Cys17–Cys27). Similar to other cysteine-containing AMPs [18,19], the helical segments of I are not amphipathic but instead the three-dimensional (3D) surface of the peptide contains distinct hydrophilic patches (53% surface area within two distinct cationic domains, Arg4–Lys5 and Lys12,13,14,16,18,22,26) connected by hydrophobic segments. As a consequence, in H2O the whole I possesses amphipathic structure. These structural characteristics of I follow from the NMR analysis of I [20] and from the initial study of I and its analogs [1]. According to NMR [20], I contains two α-helical segments formed by the respective ten (Arg4–Lys13) and five (Pro20–Val24) amino acid residues. Their distance and orientation towards one another is stabilized by the Cys8–Cys25 disulfide bridge. The helical segments are linked by a six-residue Lys14–Gly19 loop, which is connected to the peptide C-terminus by the Cys17–Cys27 disulfide bridge. The NMR analysis does not show any significant changes of I when interacting with SDS micelles and it indicates that the peptide does not penetrate into the micelles [20]. Analogously to other AMPs, a search for sequential similarities within protein databases revealed significant (~75%) homologies with other proteins, in this case with those of Shk family [20,21,22]. However, these proteins are not primarily displaying antimicrobial activity, but they act more as ionic channel blockers. Similar to many therapeutic proteins [23], biological activity of I is affected by alterations of the disulfide bonds. Modifications of the disulfide bridge pattern may lead to reduction or even a complete loss of biological activity [1], which indicates that correct disulfide bond formation is crucial for stabilization of biologically active 3D conformation of I.
Here we investigate the role and geometry of disulfide bridges in I utilizing the methods of chiroptical spectroscopy including circular dichroism (both electronic—ECD, and vibrational—VCD) and Raman optical activity (ROA) [24,25,26]. While ECD is a well-established technique in the field of AMP studies [27], VCD studies are still rather scarce [28,29,30,31,32,33], and ROA is yet to be employed. Although ECD spectroscopy is a powerful tool for the estimation of α-helical content, the proportion of structures like β-sheet, β-turn, random coil, polyproline II helix (PPII) or 310 helix is usually only approximate, especially in the presence of strongly manifesting α-helices [24]. On the other hand, vibrational spectra (particularly IR absorption) can easily show β-sheet conformation [34]. In VCD spectra, there are also characteristic patterns for α-helical, unordered and β-sheet structures [35,36] and it can distinguish more clearly the otherwise very similar spectra of statistically unordered and more regular left-handed PPII-type structures [37,38]. Similarly to IR/VCD, Raman and ROA spectroscopies can give us information about peptide/protein conformation [26,39,40]. Typical ROA patterns identify α-helices, β-sheets, β-turns and even PPII-type helices [38,40]. A combined use of chiroptical techniques should provide a possibility to directly evaluate changes in secondary structure simultaneously with the changes in disulfide group conformation. The inherent disadvantage of these methods consisting in lower structural resolution is offset by their experimental simplicity and ability to gradually modify solution properties.
Moreover, a joint analysis of Raman and ROA experimental spectra may provide information about peptide/protein rigidity or flexibility. Higher molecular flexibility is usually indicated by (i) low intensity ratio between ROA and its parent Raman signals; (ii) broadening of spectral lines; and (iii) weak ROA signal in the low-frequency region (below ~700 cm−1) [41]. Furthermore, Raman/ROA spectra provide additional means of investigating internal arrangement of disulfide bridges as inherently dissymmetric chiral structures due to signals of S–S (νS–S, ~500 cm−1) and C–S (νC–S, ~650 cm−1) stretching vibrations [39,42]. For this purpose, it is not possible to utilize the alternative IR/VCD because of the instrumental cut-off at ~1000 cm−1 (VCD). In Raman spectra, frequency of the S–S stretching mode reflects conformation of the Cα–Cβ–S–S′–Cβ′–Cα′ fragment and Raman signals in the C–S stretching region reflect conformation of the C–Cα–Cβ–S and S′–Cβ′–Cα′–C′ fragments [39]. The ROA signals originating in S–S stretching vibrations seem to reflect chirality of the disulfide groups, as indicated by previous preliminary theoretical and experimental studies [42,43,44].
In this study, we aim at possible decoding of the role of the disulfide bridges in I utilizing the native peptide I and its three analogs with modified disulfide bridge pattern, i.e., with distinct cystein residues replaced with alanines (see Table 1). These analogs lack either one (II, III) or both (IV) native disulfide bridges and possess either reduced (II, III) or no (IV) activity against common microbial pathogens [1]. We study the effects of changes in disulfide-related localized conformational stiffening on lasiocepsin secondary/tertiary structure in water and in the presence of TFE—an α-helix inducing agent, and SDS—a model mimicking in a very simple way cell membranes [45]. Changes in structural behavior, symmetry and conformation of disulfide bridges of the peptides in different environments are then correlated with their biological activities.

2. Materials and Methods

Peptide synthesis: The peptides IIV were custom synthesized (Spyder Institute, s.r.o., Prague, Czech Republic) using standard methods of solid-phase peptide synthesis [1] and used without further purification. The trifluoroacetate counterion (CF3COO, or TFA), which was present after routine peptide synthesis, was exchanged for the Cl counterion as described in [46]. Antimicrobial activities of IIV (against Bacillus subtilis, Staphylococcus aureus, Escherichia coli, Pseudomonas aeruginosa and Candida albicans) and haemolytic potencies were determined in Reference [1] according to standard procedures and are shown in Table 1.
Absorption and ECD spectroscopy: Electronic absorption and ECD spectra were recorded on the Jasco J-815 spectrometer (Tokyo, Japan). The spectra were recorded in 180–300 nm (amide groups) and 240–350 nm (disulfide group) spectral regions at room temperature. Deionized water, TFE/water mixture (10%, 20% and 50% v/v) and aqueous solution of sodium dodecylsulfate (SDS) in the 0.016–16 mM (0.0046–4.6 mg/mL) concentration range were used as solvents. Suprasil quartz cells with 1 mm and 1 cm path lengths and 0.125 and 1 mg/mL peptide concentrations were used for the measurements in the respective amide and disulfide spectral regions. The final spectra were obtained as an average of two consecutive scans taken at the scanning speed of 10 nm/min (10 data points per nm) and time constant of 8 s. Final ECD and absorption spectra were related to molar concentrations of the particular chromophore (disulfide or amide) and expressed alternatively as Δε and ε (L mol−1 cm−1) for the disulfide spectral region or as molar ellipticities Θ (deg cm2 dmol−1) in the amide region which allows us a simple comparison with other already published data. The approximate secondary structure content was numerically estimated using CDPro software package [47] employing the implied CONTIN algorithm [48,49]. It is to be kept in mind that such automatic computer analysis suffers numerous limitations (numerical error ≤ 10%) and its results depend on the choice of particular algorithm [50,51].
Since the experimental conditions (mainly sample concentrations) varied depending on the spectroscopic technique used (range from 0.125 mg/mL for ECD to 100 mg/mL for VCD and ROA), we have tested stability of secondary structures of lasiocepsin analogs by parallel ECD experiments in this concentration interval. No significant structural differences were found (data not shown).
Infrared and VCD spectroscopy: VCD and IR absorption spectra were recorded on a commercial dual source VCD spectrometer (ChiralIR-2X™, BioTools, Inc., Jupiter, FL, USA) working in a dual PEM mode using two ZnSe photoelastic modulators (36.996 and 37.02 kHz, Hinds Instruments, Inc., Hillsboro, OR, USA) [52,53]. Samples in distilled H2O (100 mg/mL) and aqueous 100 mM SDS solution (20 mg/mL) were measured in a demountable CaF2 cell (Biocell™, 6 μm pathlength, sample volume ~8 μL). The 1:4 micelle/peptide ratio was used due to the limited peptide solubility in SDS and in order to minimize possible peptide aggregation (i.e., the micelle/peptide ratio was two times higher than for the ECD experiments in 16 mM SDS). The data were collected for ~12 h (12 blocks of 6000 scans each at 8 cm−1 resolution) at 25 °C. A total absorbance at ~1650 cm−1 was lower than 1 in all cases. The corresponding solvent scans were subtracted as background. Post-processing of the experimental data involved a linear baseline correction followed by smoothing with a second-order Savitzky–Golay filter using a 9-point window. Final IR and VCD data in the 1750–1450 cm−1 spectral range are presented as the respective A and ΔA values with the intensities normalized to amide I peak in absorption.
Raman spectroscopy and Raman optical activity: Raman and ROA spectra were recorded on a commercial ROA spectrometer (ChiralRAMAN-2X, BioTools, Inc., Jupiter, FL, USA) working in backscattering geometry and utilizing scattered circular polarization (SCP) modulation scheme. The instrument uses excitation laser wavelength of 532 nm. The experiments were performed in deionized H2O (100 mg/mL) and aqueous 100 mM SDS solution (20 mg/mL) at ~20 °C using the 1:4 micelle/peptide ratio (i.e., the conditions were the same as for the VCD experiments). The samples were measured in quartz ROA micro-cells (Starna Scientific, 4 × 3 mm, volume ~50 µL) with antireflective coated windows. Experimental conditions included 250 mW laser power at the sample, 8 cm−1 spectral resolution and acquisition time of ~5 days for the measurements in deionized H2O, and 600 mW laser power at the sample, 8 cm−1 spectral resolution and acquisition time of ~14 days for the measurements in SDS solution. The spectra were processed by subtracting signal of the solvent (water or SDS solution) and correcting the baseline (by subtracting a fitted 5th order polynomial). ROA data processing further included a second-order Savitzky–Golay smoothing (using a 9-point window). Raman spectra were normalized to the total integrated area of the spectrum in the 350–1800 cm−1 range. The same normalization factors were then used for normalization of the corresponding ROA spectra. Final ROA and Raman spectra are presented as the respective (IRIL) and (IR + IL) values where IR and IL are the corresponding intensities of right- and left-SCP light. Numerical data treatment was performed using GRAMS/AI software (Thermo Scientific). Separation of complex amide Raman bands into single components was achieved with the aid of second derivatives.

3. Results

3.1. Secondary Structuture Assignement of I–IV in Water

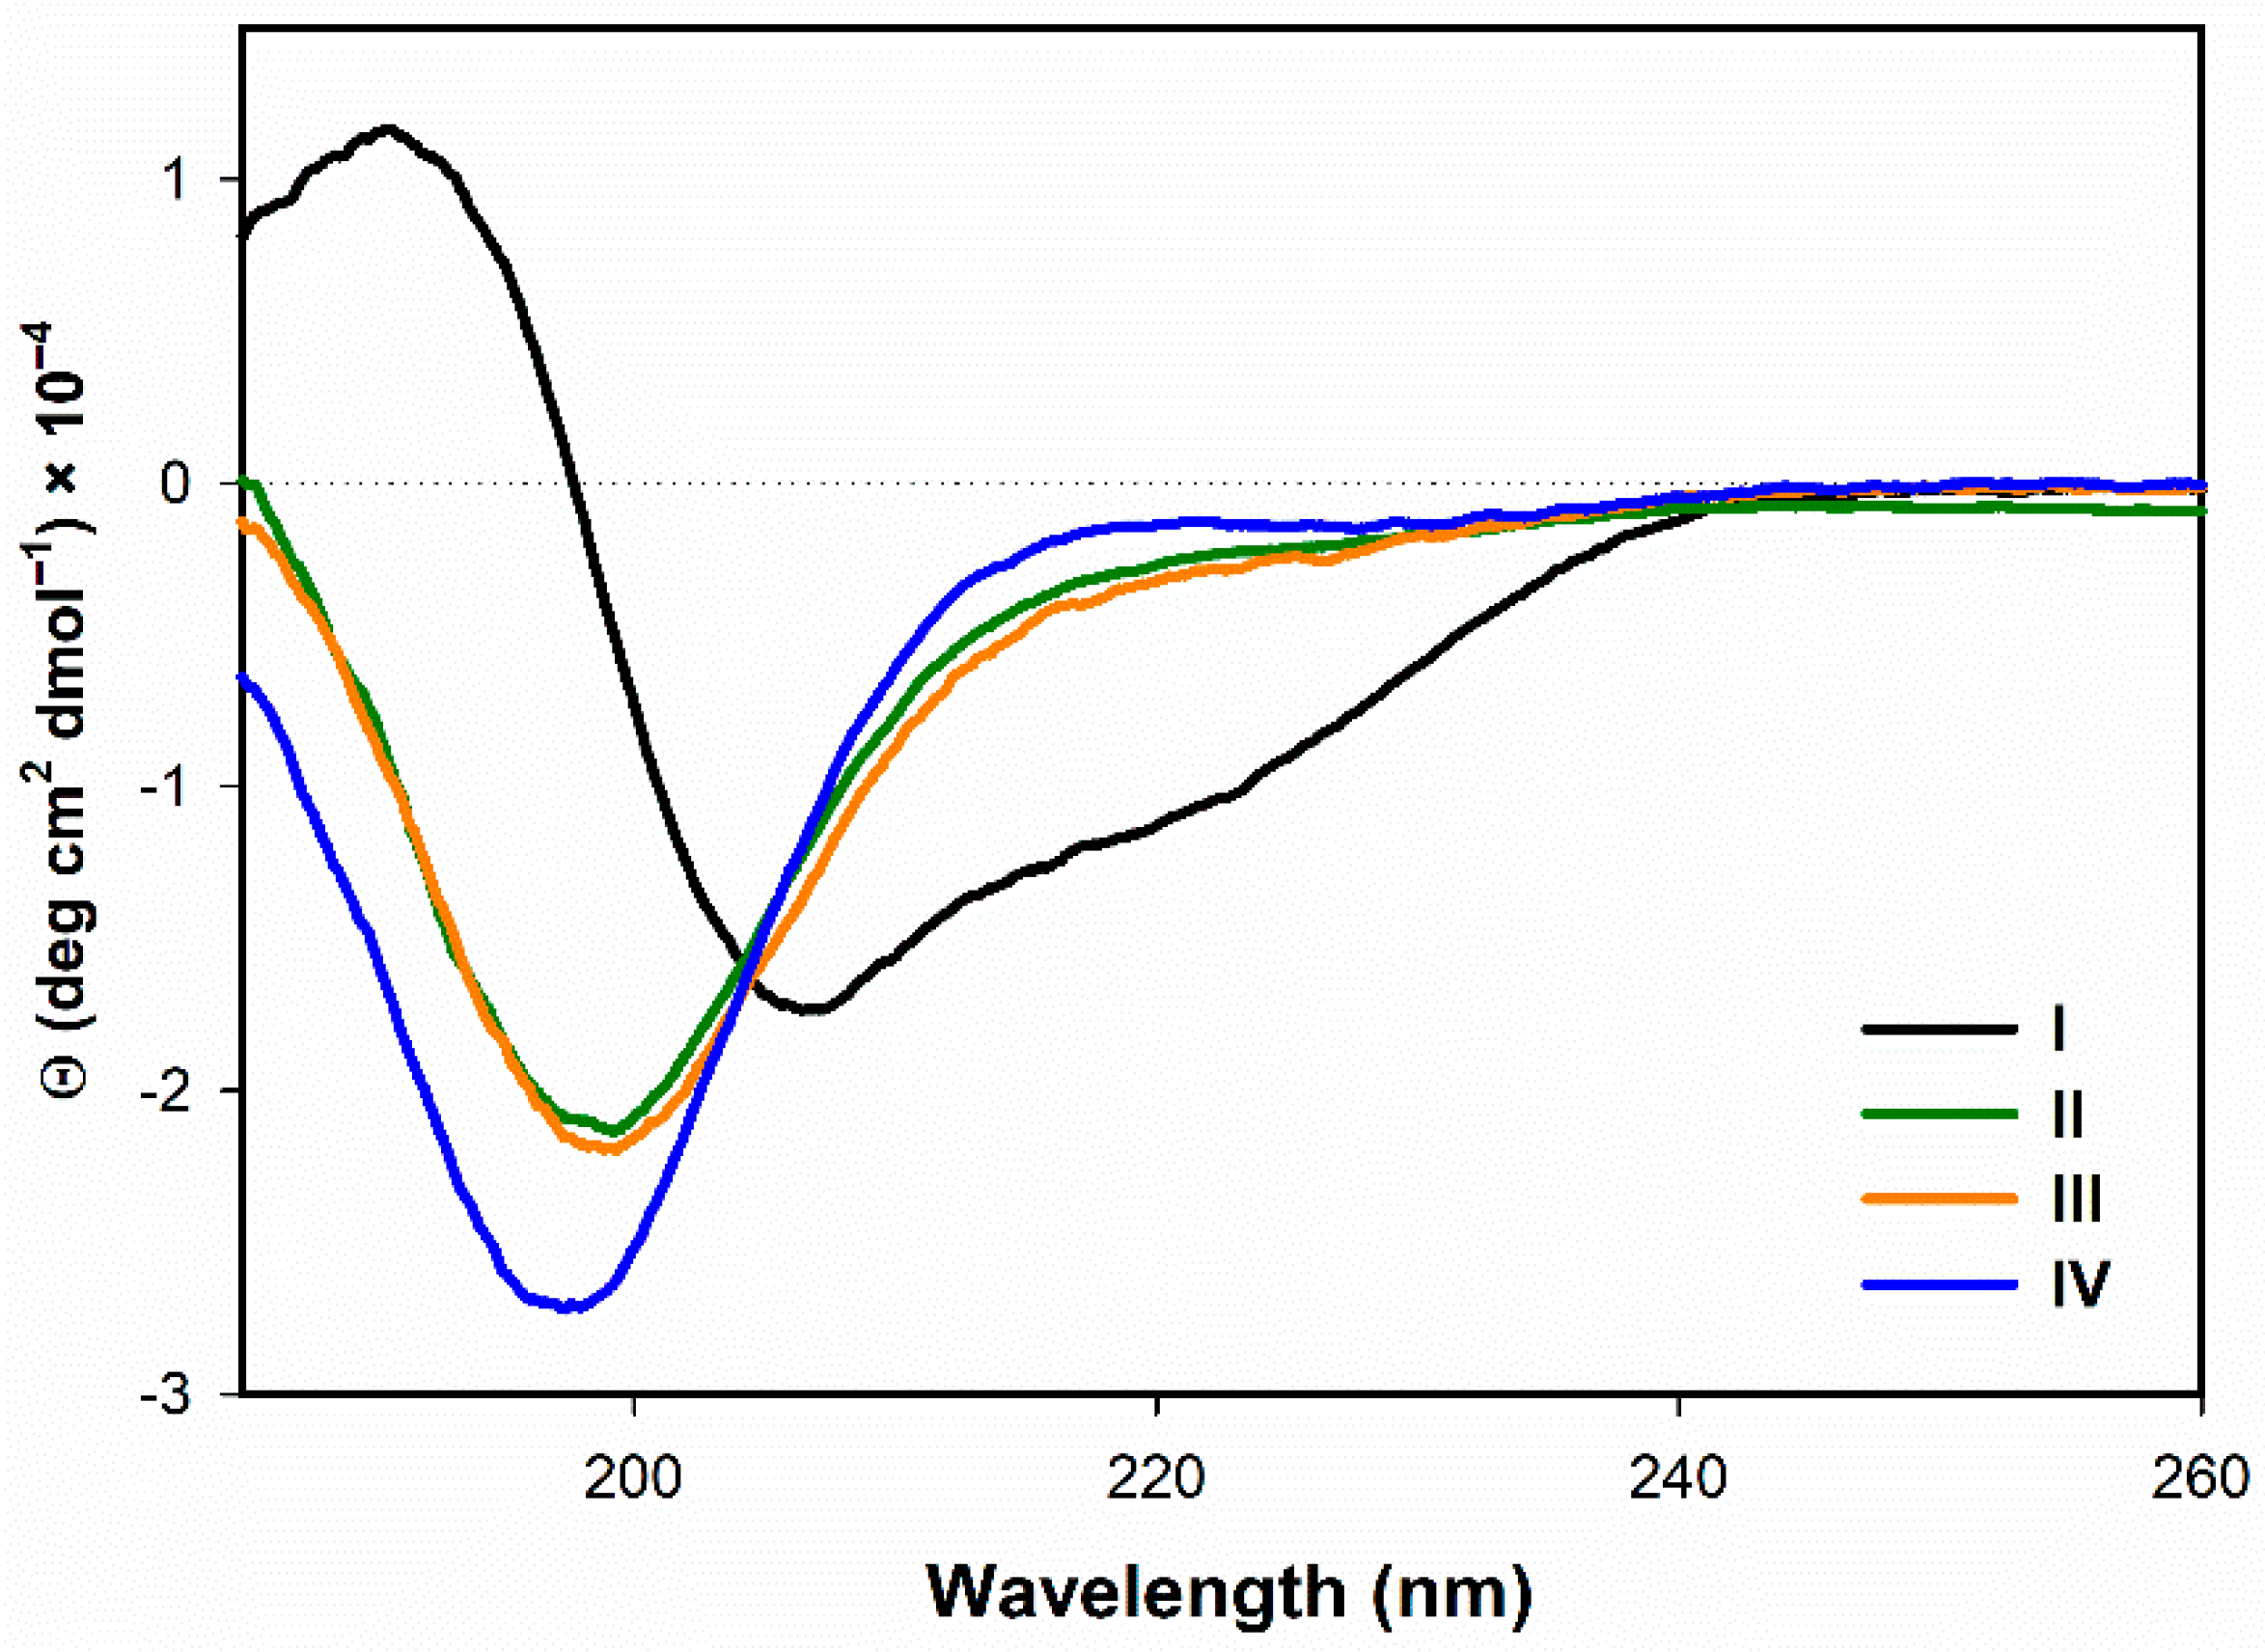
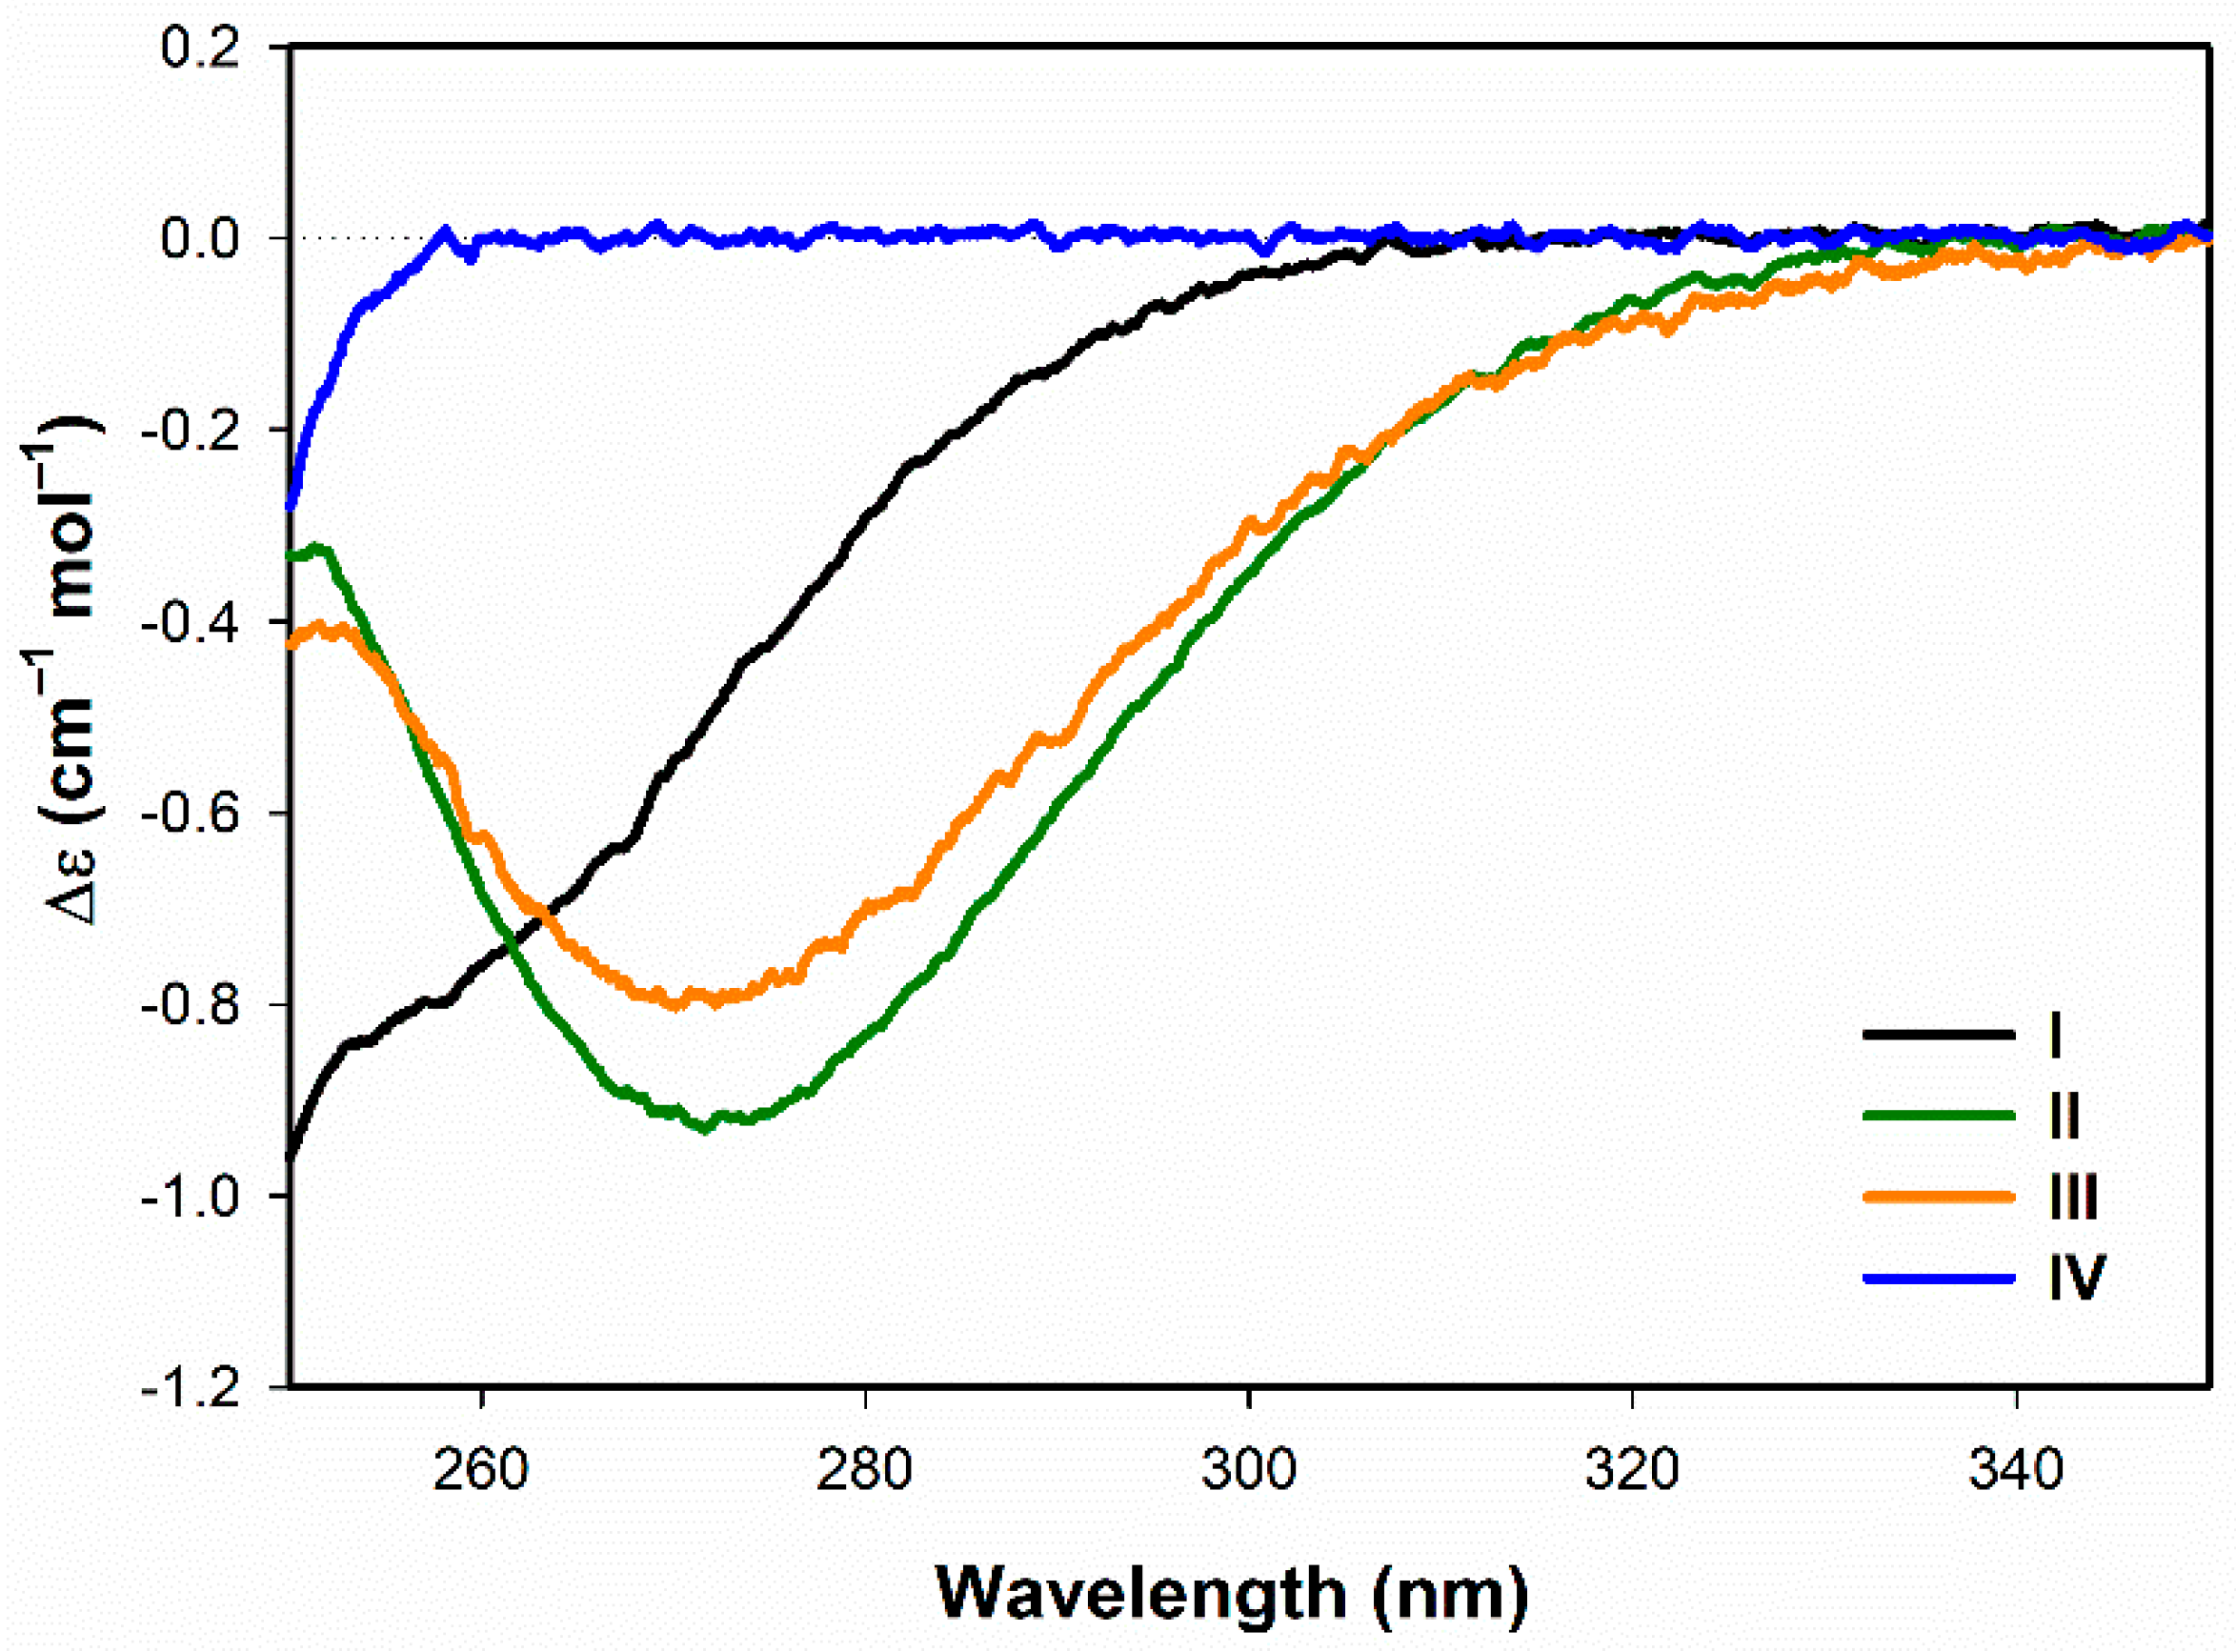
3.1.1. Electronic Circular Dichroism

In accord with the preliminary data [1], ECD of the natural peptide I in aqueous solution (Figure 2) exhibits a pattern typical for oligopeptides having partially defined (α-helical) secondary structure (a positive band at ~192 nm, a negative band at 206 nm and a shoulder at 222 nm). This result, in agreement with NMR study [20], hints at the importance of stiffening of spatial arrangement of I by the two disulfide bridges. The overall dichroic intensity ([Θ] ~2.104 deg.cm2 dmol−1) is smaller (about half) than for a completely α-helical peptide and hints on the presence of other secondary structure elements. According to an approximate numerical evaluation [47,48] (Table S1 in Supplementary Material), I in water contains ~29% α-helical conformation and ~10% 310 helical conformation, while NMR data indicate ~56% of helical structure [20]. These two results are still in a reasonable mutual agreement if we consider that terminal residues of helices contribute to the ECD manifestation to a lesser extent. Therefore, we assume that the α-helical content of I as found by ECD is actually about 15% lower. Apart from the helical fractions there seems to be a contribution of unordered (34%) and/or PPII (6%) structures, β-turn (18%) and β-sheet (4%) conformations.
Unlike for I, ECD spectra of both II and III (Figure 2) in water exhibit only a single negative band at ~198 nm of medium intensity (~−2 × 10⁴ deg cm2 dmol−1). Based on spectral shapes, secondary structures of II and III appear to be composed mainly of unordered and β-sheet conformations [24]. Accordingly, numerical analysis [47,48] (Table S1 in Supplementary Material) indicates ~50% of statistically unordered structure, ~10% of β-sheets and about 20% of β-turns with only ~8% of helical contribution for both II and III. ECD spectrum of IV (Figure 2) also exhibits only one negative band of slightly higher intensity at ~197 nm with the overall shape somewhat different even from those of II and III. There is an additional weak positive feature at ~215 nm, which may be due to the higher content of PPII conformation [54,55]. Numerical evaluation of ECD spectrum of IV (Table S1 in Supplementary Material) indicates the prevailing unordered (48%), β-turn (20%) and PPII (21%) conformations together with minor portions of β-sheets (6%) and 310 helices (3%).
ECD signals in the near-UV spectral region (240–350 nm) enable us to study the manifestation of the disulfide bridge chromophores. Advantageously, our peptides do not contain any aromatic amino acid residues that might interfere with disulfide-related bands, i.e., we observe pure disulfide signals. ECD spectra (Figure 3) indicate significant differences between geometries of the disulfide groups in the peptides IIII besides the obvious effect of differing number of disulfide chromophores. Particularly, while the spectra of II and III exhibit a negative ECD band having the maximum at ~272 nm, the spectrum of I shows a negative low-intensity (~2/3) shoulder at 264 nm. Based on these data we may hypothesize that disulfide groups of II and III might adopt similar conformations, while the disulfide conformations in I might be different.
Unfortunately, it is not possible to unambiguously assign the conformation of the disulfide groups on the sole basis of ECD. The negative ECD signal of IIII around ~270 nm may indicate both right-, and left- handedness of the disulfide groups, depending on the exact magnitude of the S–S torsion angle [24,56,57,58]. Therefore, ECD data in the near-UV spectral region are further complemented by the Raman/ROA measurements, which could provide more detailed information about disulfide bridge conformation using the assignment of C–S and S–S stretching vibrations (see Section 3.1.2).

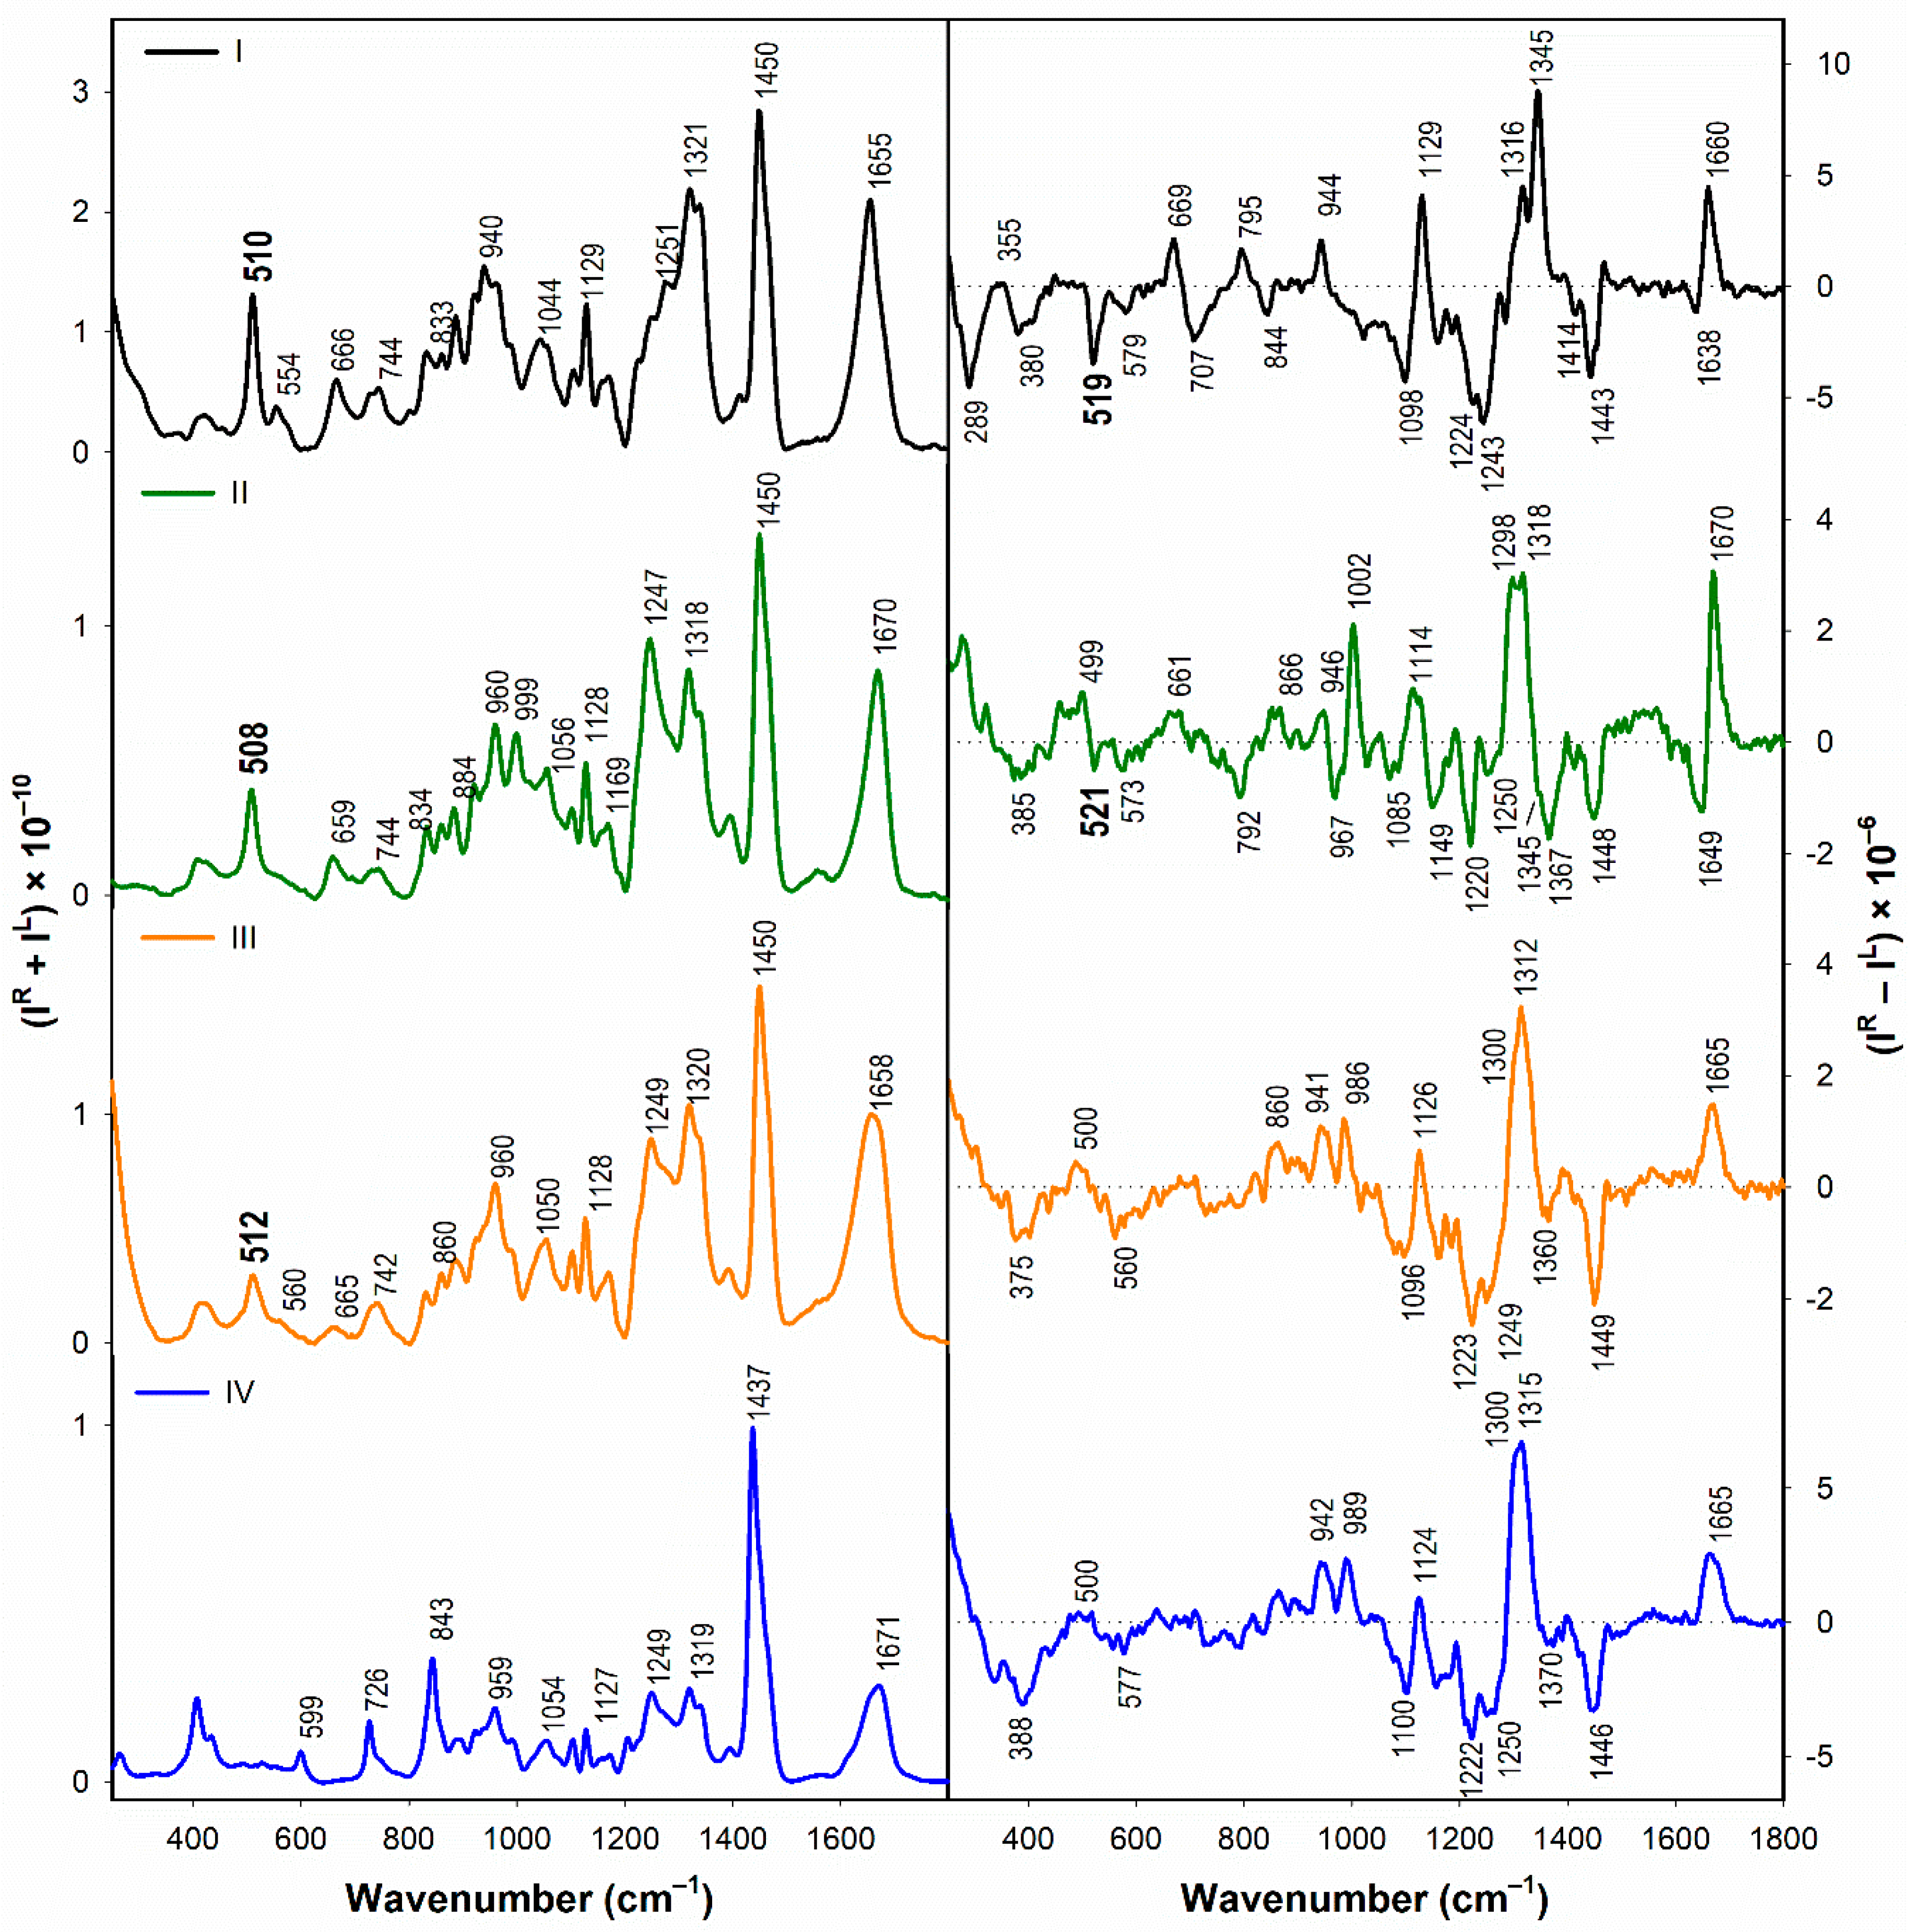
3.1.2. Vibrational Spectroscopy

For I, both IR/VCD (Figure 4, black line) and Raman/ROA (black line) spectra in amide I–III regions indicate simultaneous presence of α-helical and PPII structures. In VCD, the prevailing α-helical conformation is indicated by negative bands at ~1661 cm−1 and ~1519 cm−1 in the respective amide I and amide II spectral regions [36]. In amide I region, absence of a positive component of VCD couplet (centered at ~1640 cm−1), which is typical for purely α-helical peptides, seems to be caused by an overlap with another, negative band, which might arise from the PPII-type conformation contribution [35,37]. ROA enables even more detailed interpretation, because in ROA spectra there is a number of well separated bands that may be unequivocally assigned to particular secondary structure elements (such as PPII and α-helices) [40]. We detect ROA signals corresponding to both α-helices (a negative/positive amide I couplet at ~1638 and 1660 cm−1 with a positive amide III band at ~1345 cm−1) and PPII conformations (a positive band at ~1316 cm−1) [40]. In agreement with ECD (see above), besides these α-helical and PPII conformations, vibrational spectroscopies show just a moderate contribution of β-structures (implied by the characteristic IR bands at ~1639 cm−1 and 1678 cm−1 which are however discernible only from the 2nd derivatives of the IR spectra) [34,59,60]. This result is in a good agreement with the NMR data of I [20].
For the peptide II, IR absorption (Figure 4, left, green line) similar to ECD (see above) shows a different conformational composition with the major contribution of β-sheet structure (bands at ~1631 and 1685 cm−1) and a small contribution of α-helical and/or unordered conformations (the band at ~1655 cm−1) [34]. This finding is further supported by VCD spectra (right, green line) exhibiting an intense negative amide I band at ~1620 cm−1 and a positive/negative amide II couplet at ~1564 and 1521 cm−1, indicating high β-structure content [36]. Together with the intense negative band at ~1620 cm−1, an additional positive broad band centered at ~1665 cm−1 (probably consisting of two components—one at ~1645 cm−1 and the other at ~1680 cm−1) might be even indicative of a formation of a β-sheet-rich (left-handed) fibrillar structure [61,62,63]. The prevailing β-sheet structure is confirmed by ROA (Figure 5) with a characteristic strong negative/positive amide I couplet at ~1649 and 1670 cm−1. A positive band at ~1298 cm−1 in combination with a negative band at ~1367 cm−1 with a negative shoulder at ~1345 cm−1 are indicative of the β turn conformation [64]. ROA further indicates participation of PPII conformation due to the presence of a sharp positive signal at ~1318 cm−1 [38,40].
For the peptide III, IR spectra (Figure 4, left, orange line) exhibit a strong band at ~1650 cm−1 due to unordered/PPII and/or α-helical structures. There is also a shoulder at ~1680 cm−1 (indicative of β-conformation) and an amide II band at ~1550 cm−1. VCD spectra (Figure 4, right, orange line) exhibit a positive/negative amide I couplet at ~1678 and 1642 cm−1 with a negative shoulder at ~1612 cm−1 and a positive/negative amide II couplet at ~1562 and ~1524 cm−1. These bands indicate possible combined contribution of PPII [35,37] and β-structures [36]. Based on ROA spectra (Figure 5 right, orange line), PPII structure seems to be dominant (as indicated by a single-signed positive amide I band at ~1665 cm−1 together with a strong positive amide III signal at ~1312 cm−1). According to the literature [64], an additional negative signal at ~1247 cm−1 should originate in β-sheet structure. However, a negative signal in the same spectral region is also observed for α-helical proteins such as human serum albumin [65] and others [66]. Therefore, we do not consider this band to be an unequivocal β-structure identifier. Yet some minor portion of β-structure seems to be present, as we observe a shoulder at ~1300 cm−1 together with a negative signal at ~1360 cm−1, indicating β-turn participation [64].
IR absorption spectra of the peptide IV (left, blue line) show an intense band at ~1650 cm−1 (i.e., unordered/PPII and/or α-helical structure) together with a shoulder at ~1680 cm−1 (β-structure) in amide I region and a band at ~1550 cm−1 in amide II region. When these characteristics are combined with VCD spectra (a positive/negative amide I couplet at ~1670 and 1622 cm−1 with a negative shoulder at ~1640 cm−1 together with a positive/negative amide II couplet at ~1563 and 1525 cm−1), the results indicate a combination of PPII [35,37] and β-conformations [36]. Signals attributed to the PPII structure are dominant in the ROA spectra (Figure 5) showing a positive amide III band at ~1315 cm−1 and a positive single-signed amide I feature at ~1665 cm−1. An additional positive shoulder at ~1300 cm−1 together with a negative signal at ~1370 cm−1 indicates the presence of β-turns [64].
In the disulfide region, Raman spectra of IIII in H2O (Figure 5) exhibit an intense band at ~510 cm−1 accompanied by either another low-intensity feature at ~554 cm−1 (I) or a weak shoulder at ~560 cm−1 (II, III). These bands may indicate prevailing gauche-gauche-gauche arrangement of the disulfide bridges with a minor portion of trans-gauche-trans conformation [39]. Further information is provided by Raman signals in the C–S vibration region (600–800 cm−1) revealing that the S–Cβ–Cα–C dihedral angles in IIII may adopt both PN or PC (Raman band at ~745 cm−1) and PH conformations (Raman band at ~665 cm−1) [67]. Presence of signals in the S–S and C–S region is also expected in ROA spectra. While the signals related to S–S stretching vibrations are generally visible in ROA spectra, those due to C–S stretching are typically not detectable at all, as they are even weaker and overlapped by other vibrational modes. As has been already reported [68], interpretation of ROA signals in this region should be done with a great care, because not all of the bands can be attributed to disulfides. A positive ROA signal at ~500 cm−1 in the spectra of II and III and a negative one at ~579, 573 and 560 cm−1 in the spectra of I, II and III, respectively, cannot be assigned directly to the S–S stretching vibrations, as similar features can be seen also in the spectrum of IV (with a positive band at ~500 cm−1 and a negative one at ~577 cm−1). On the other hand, a negative ROA signal at ~520 cm−1 in the spectrum of I and II (albeit of different intensity) cannot be found in the spectra of IV. Thus, this feature was tentatively assigned to the S–S stretching vibrations. On the contrary, the ROA spectrum of III does not exhibit any features unambiguously attributable to the S–S stretching vibrations.

3.2. Structural Changes of I–IV due to the Presence of TFE and SDS

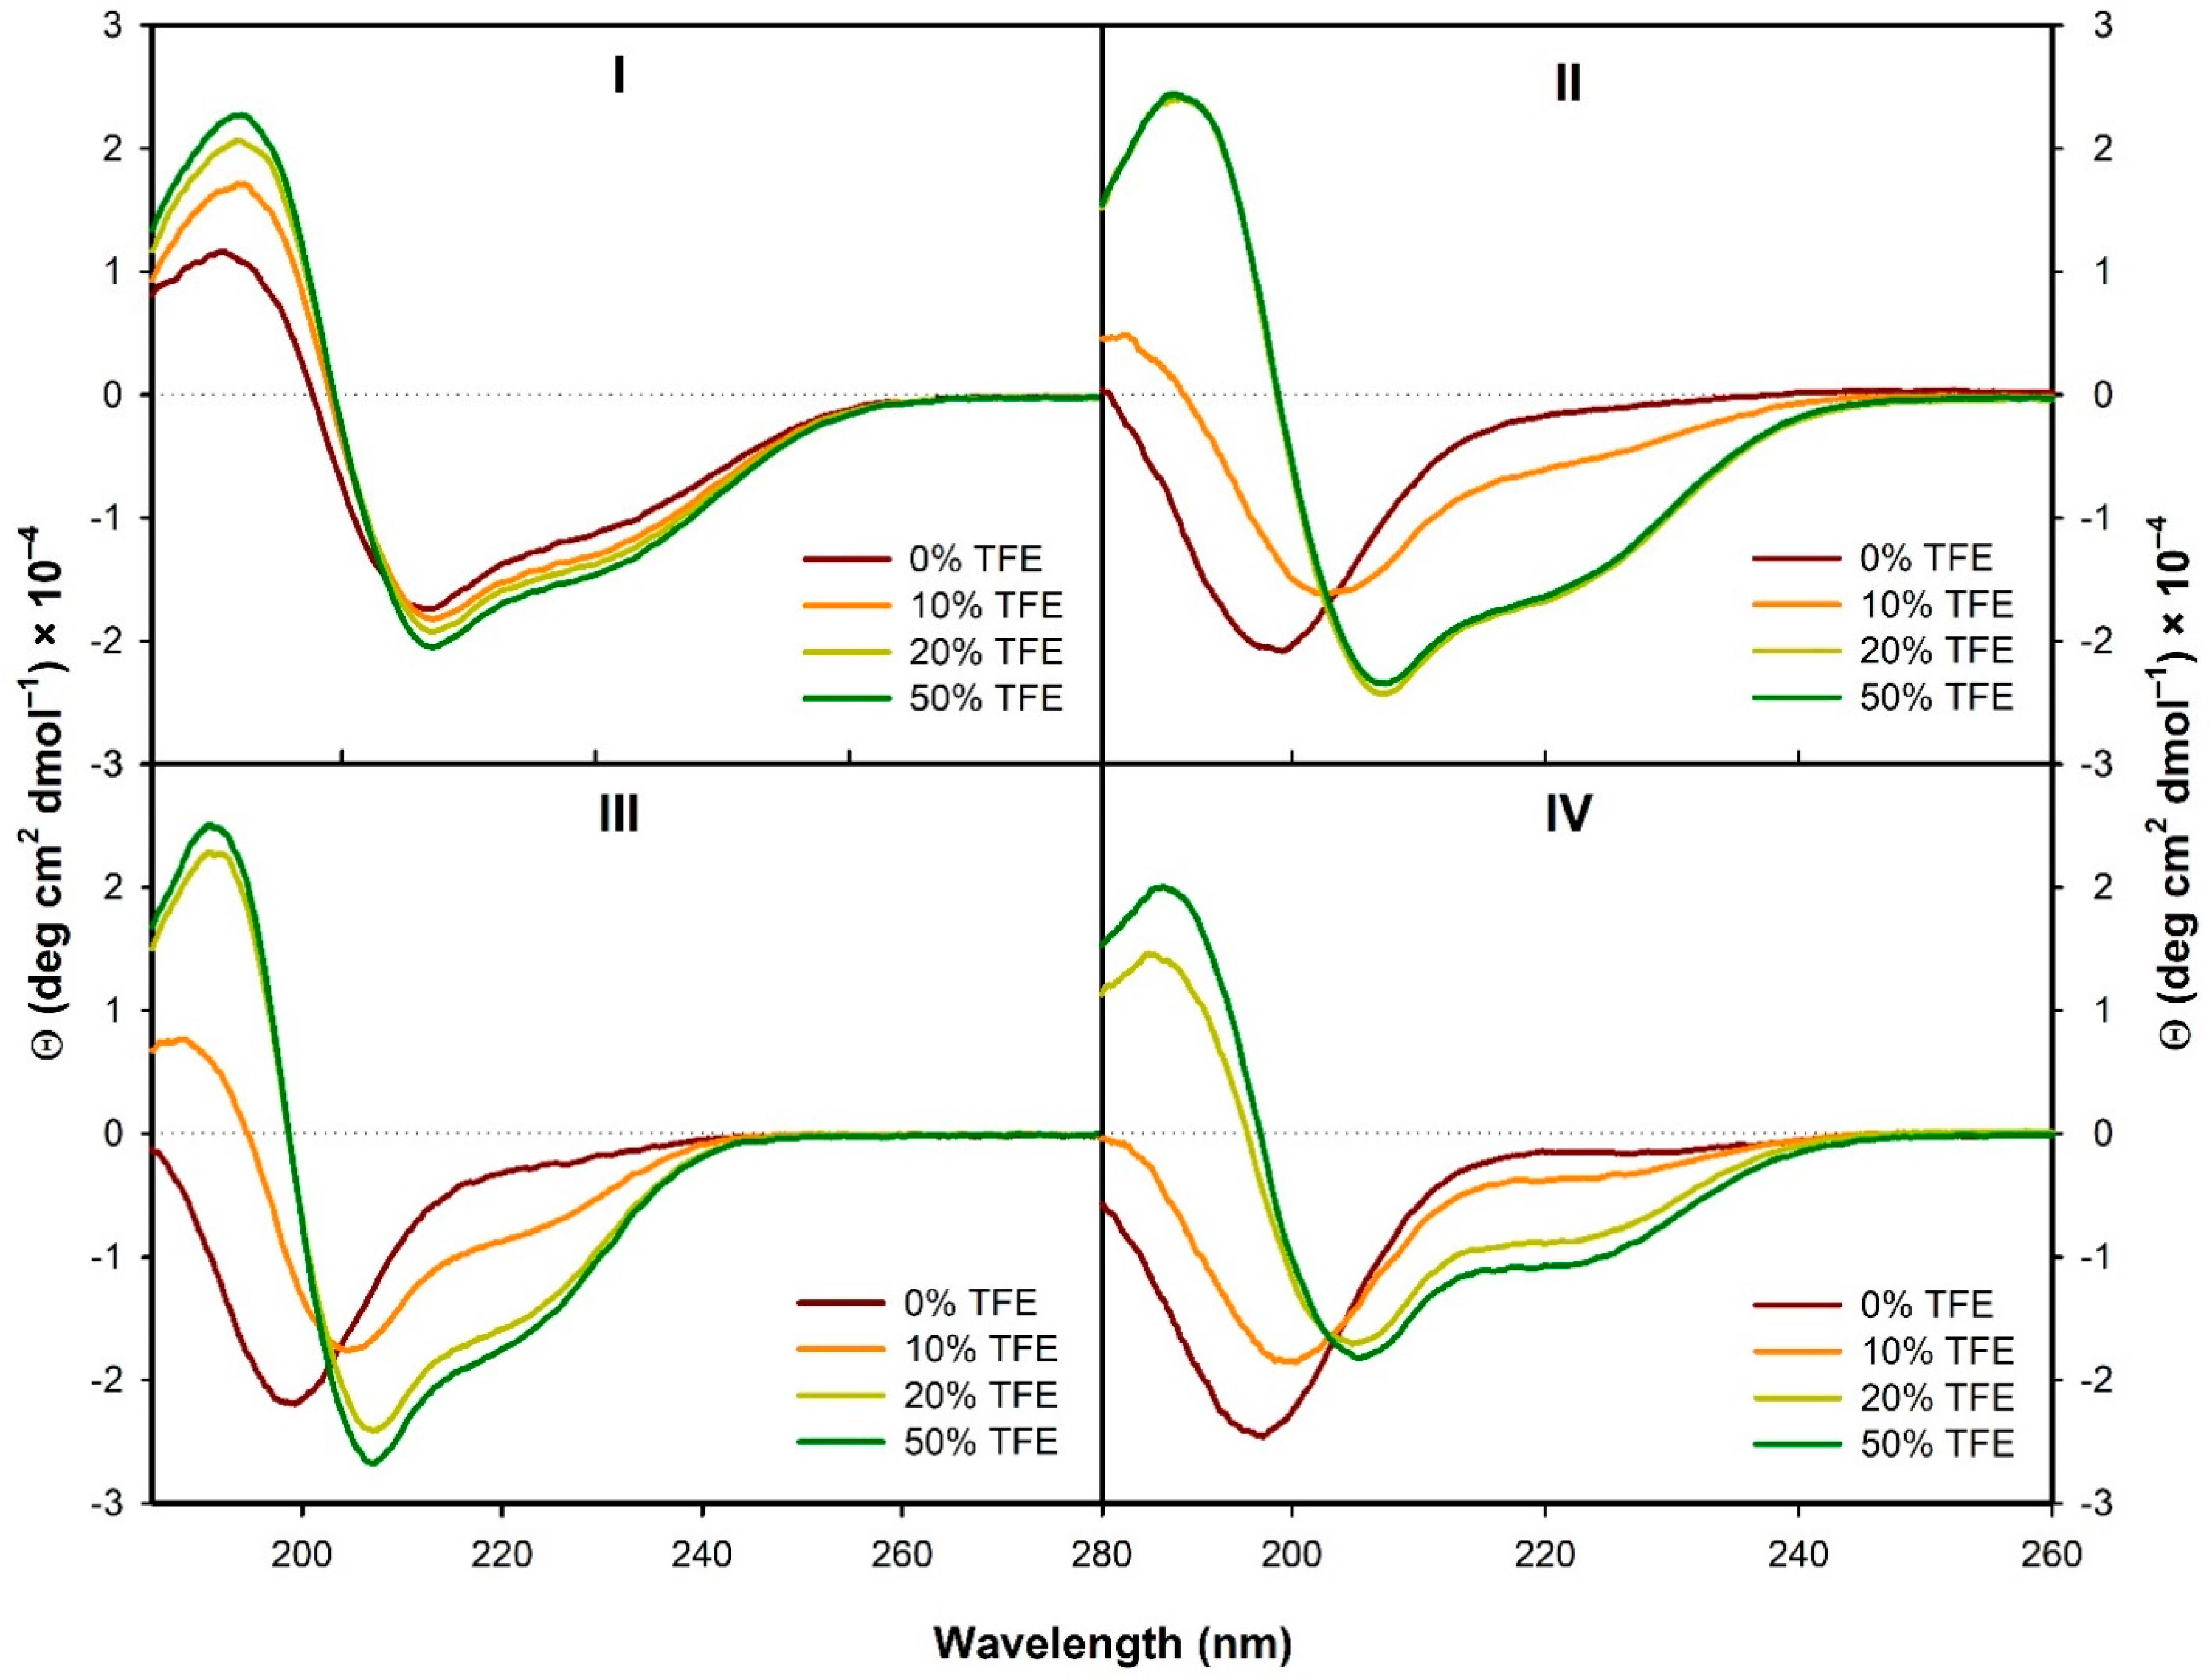
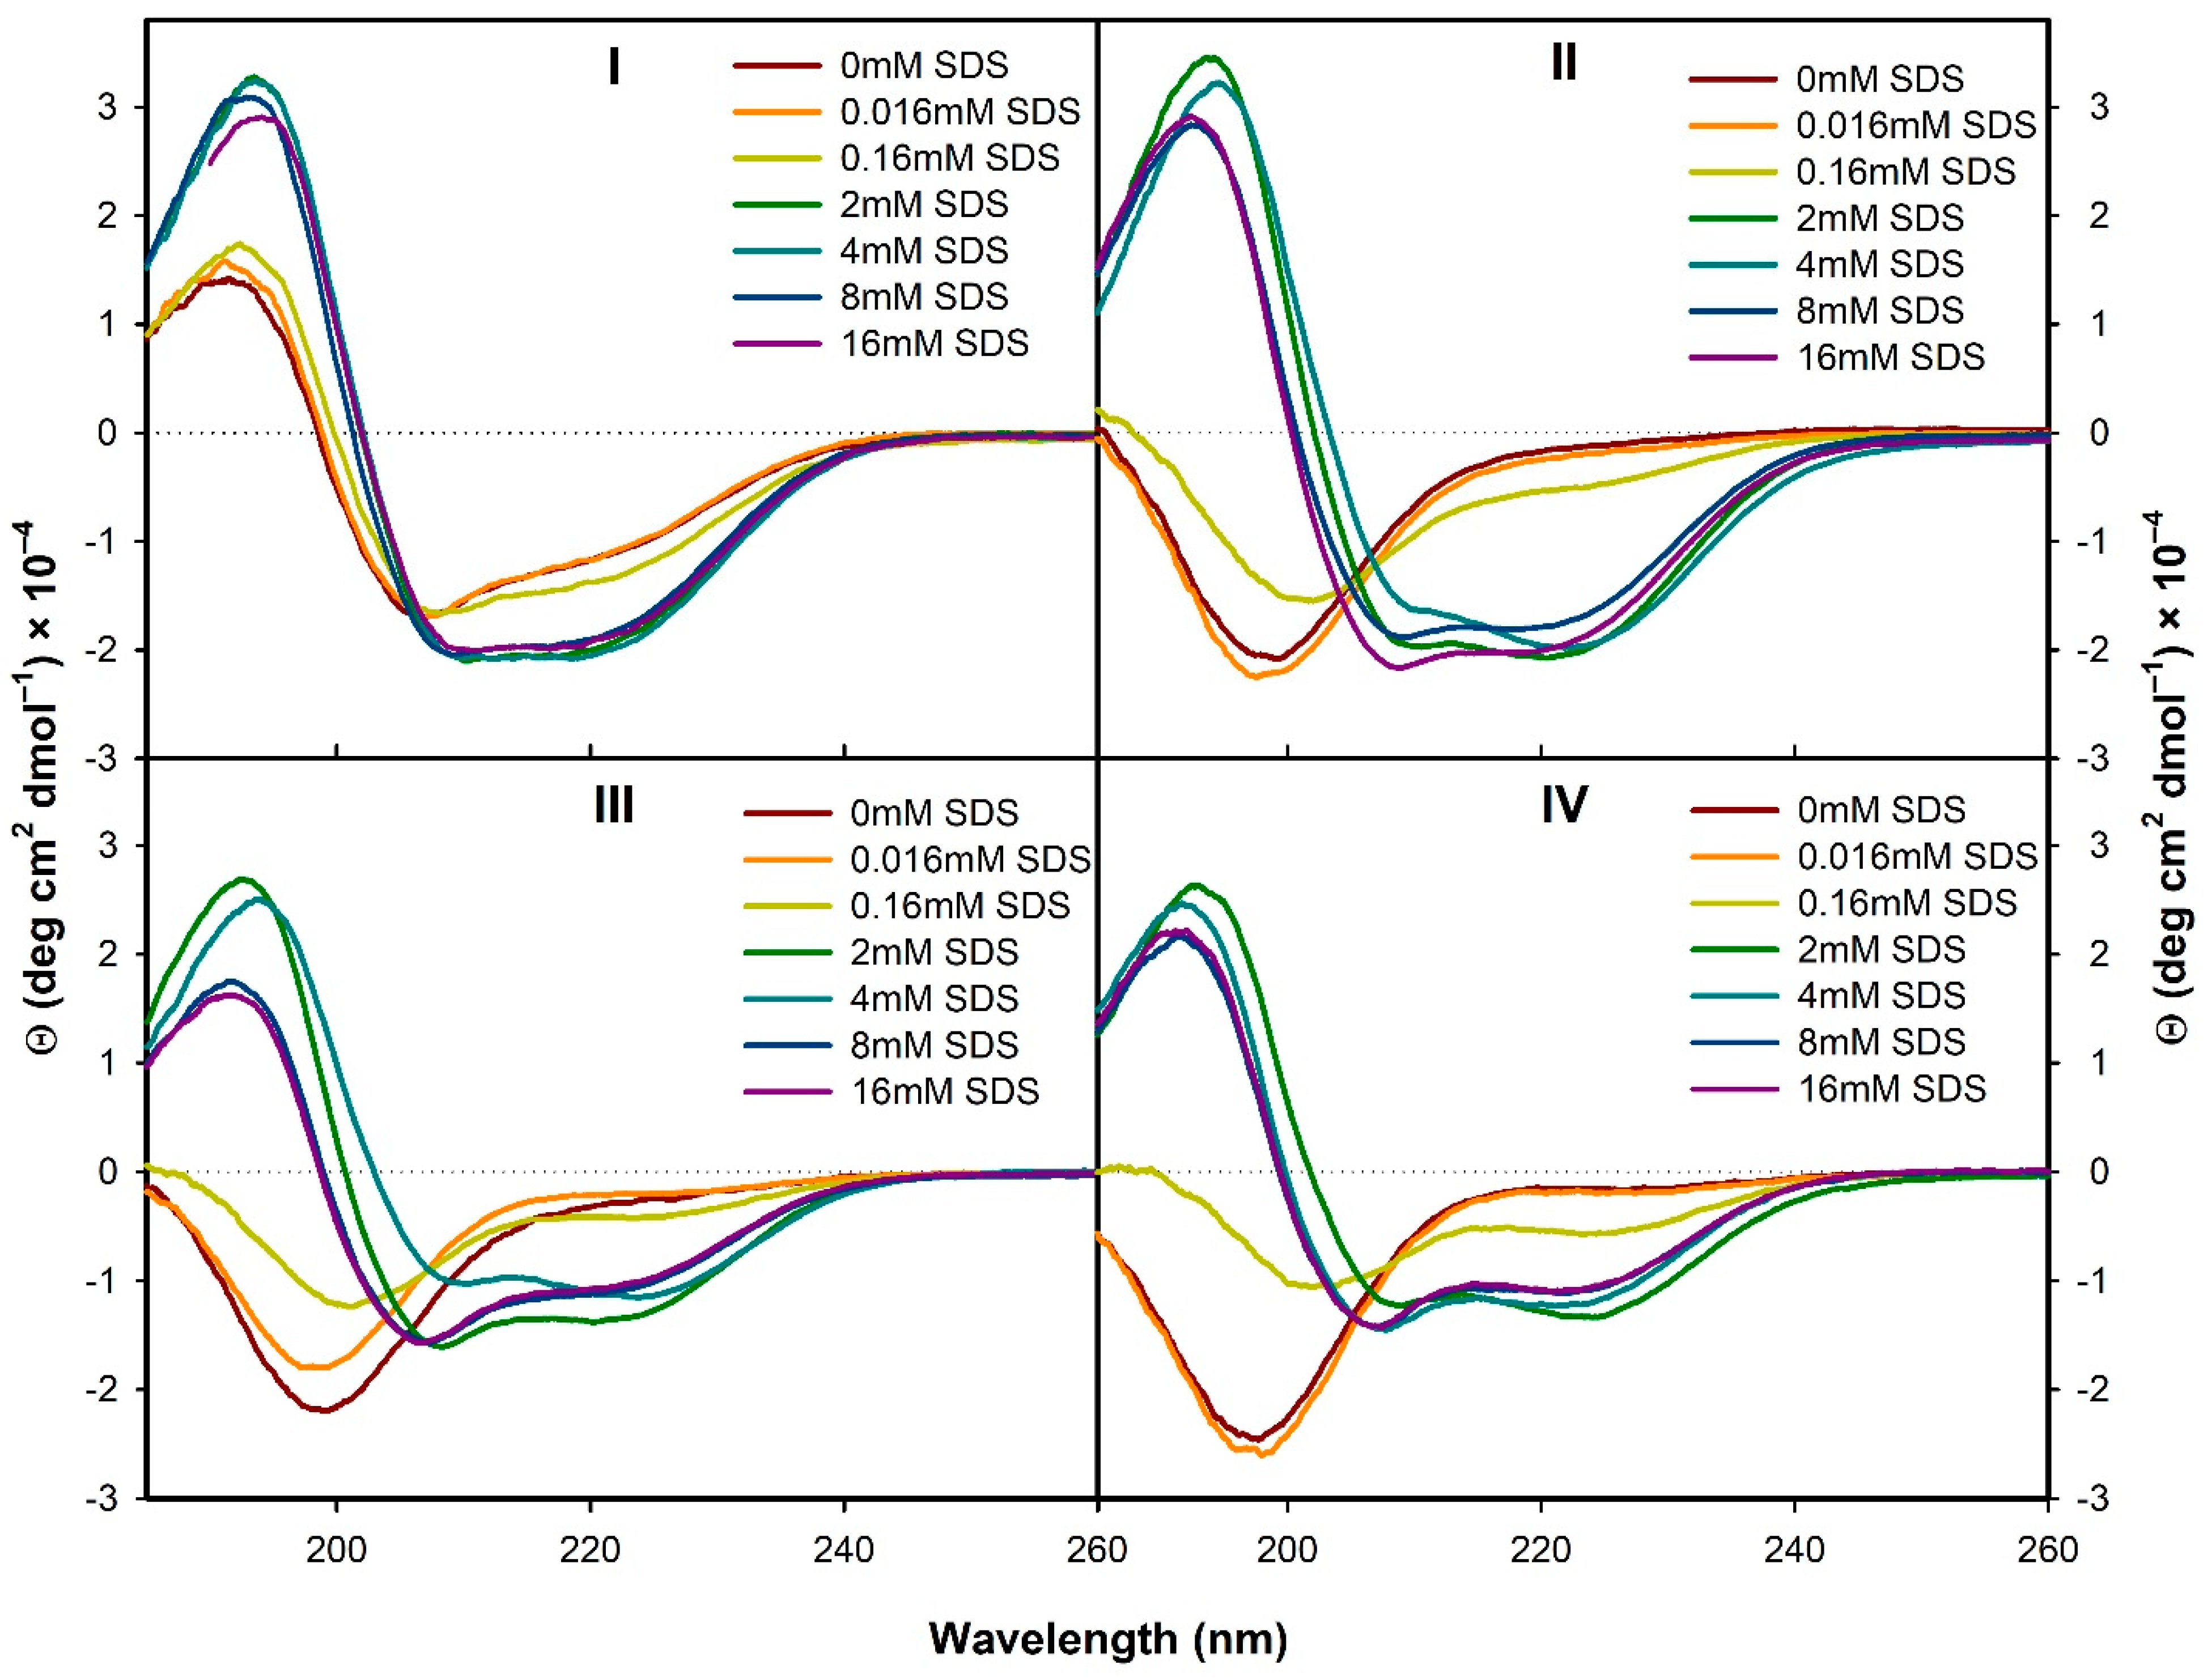
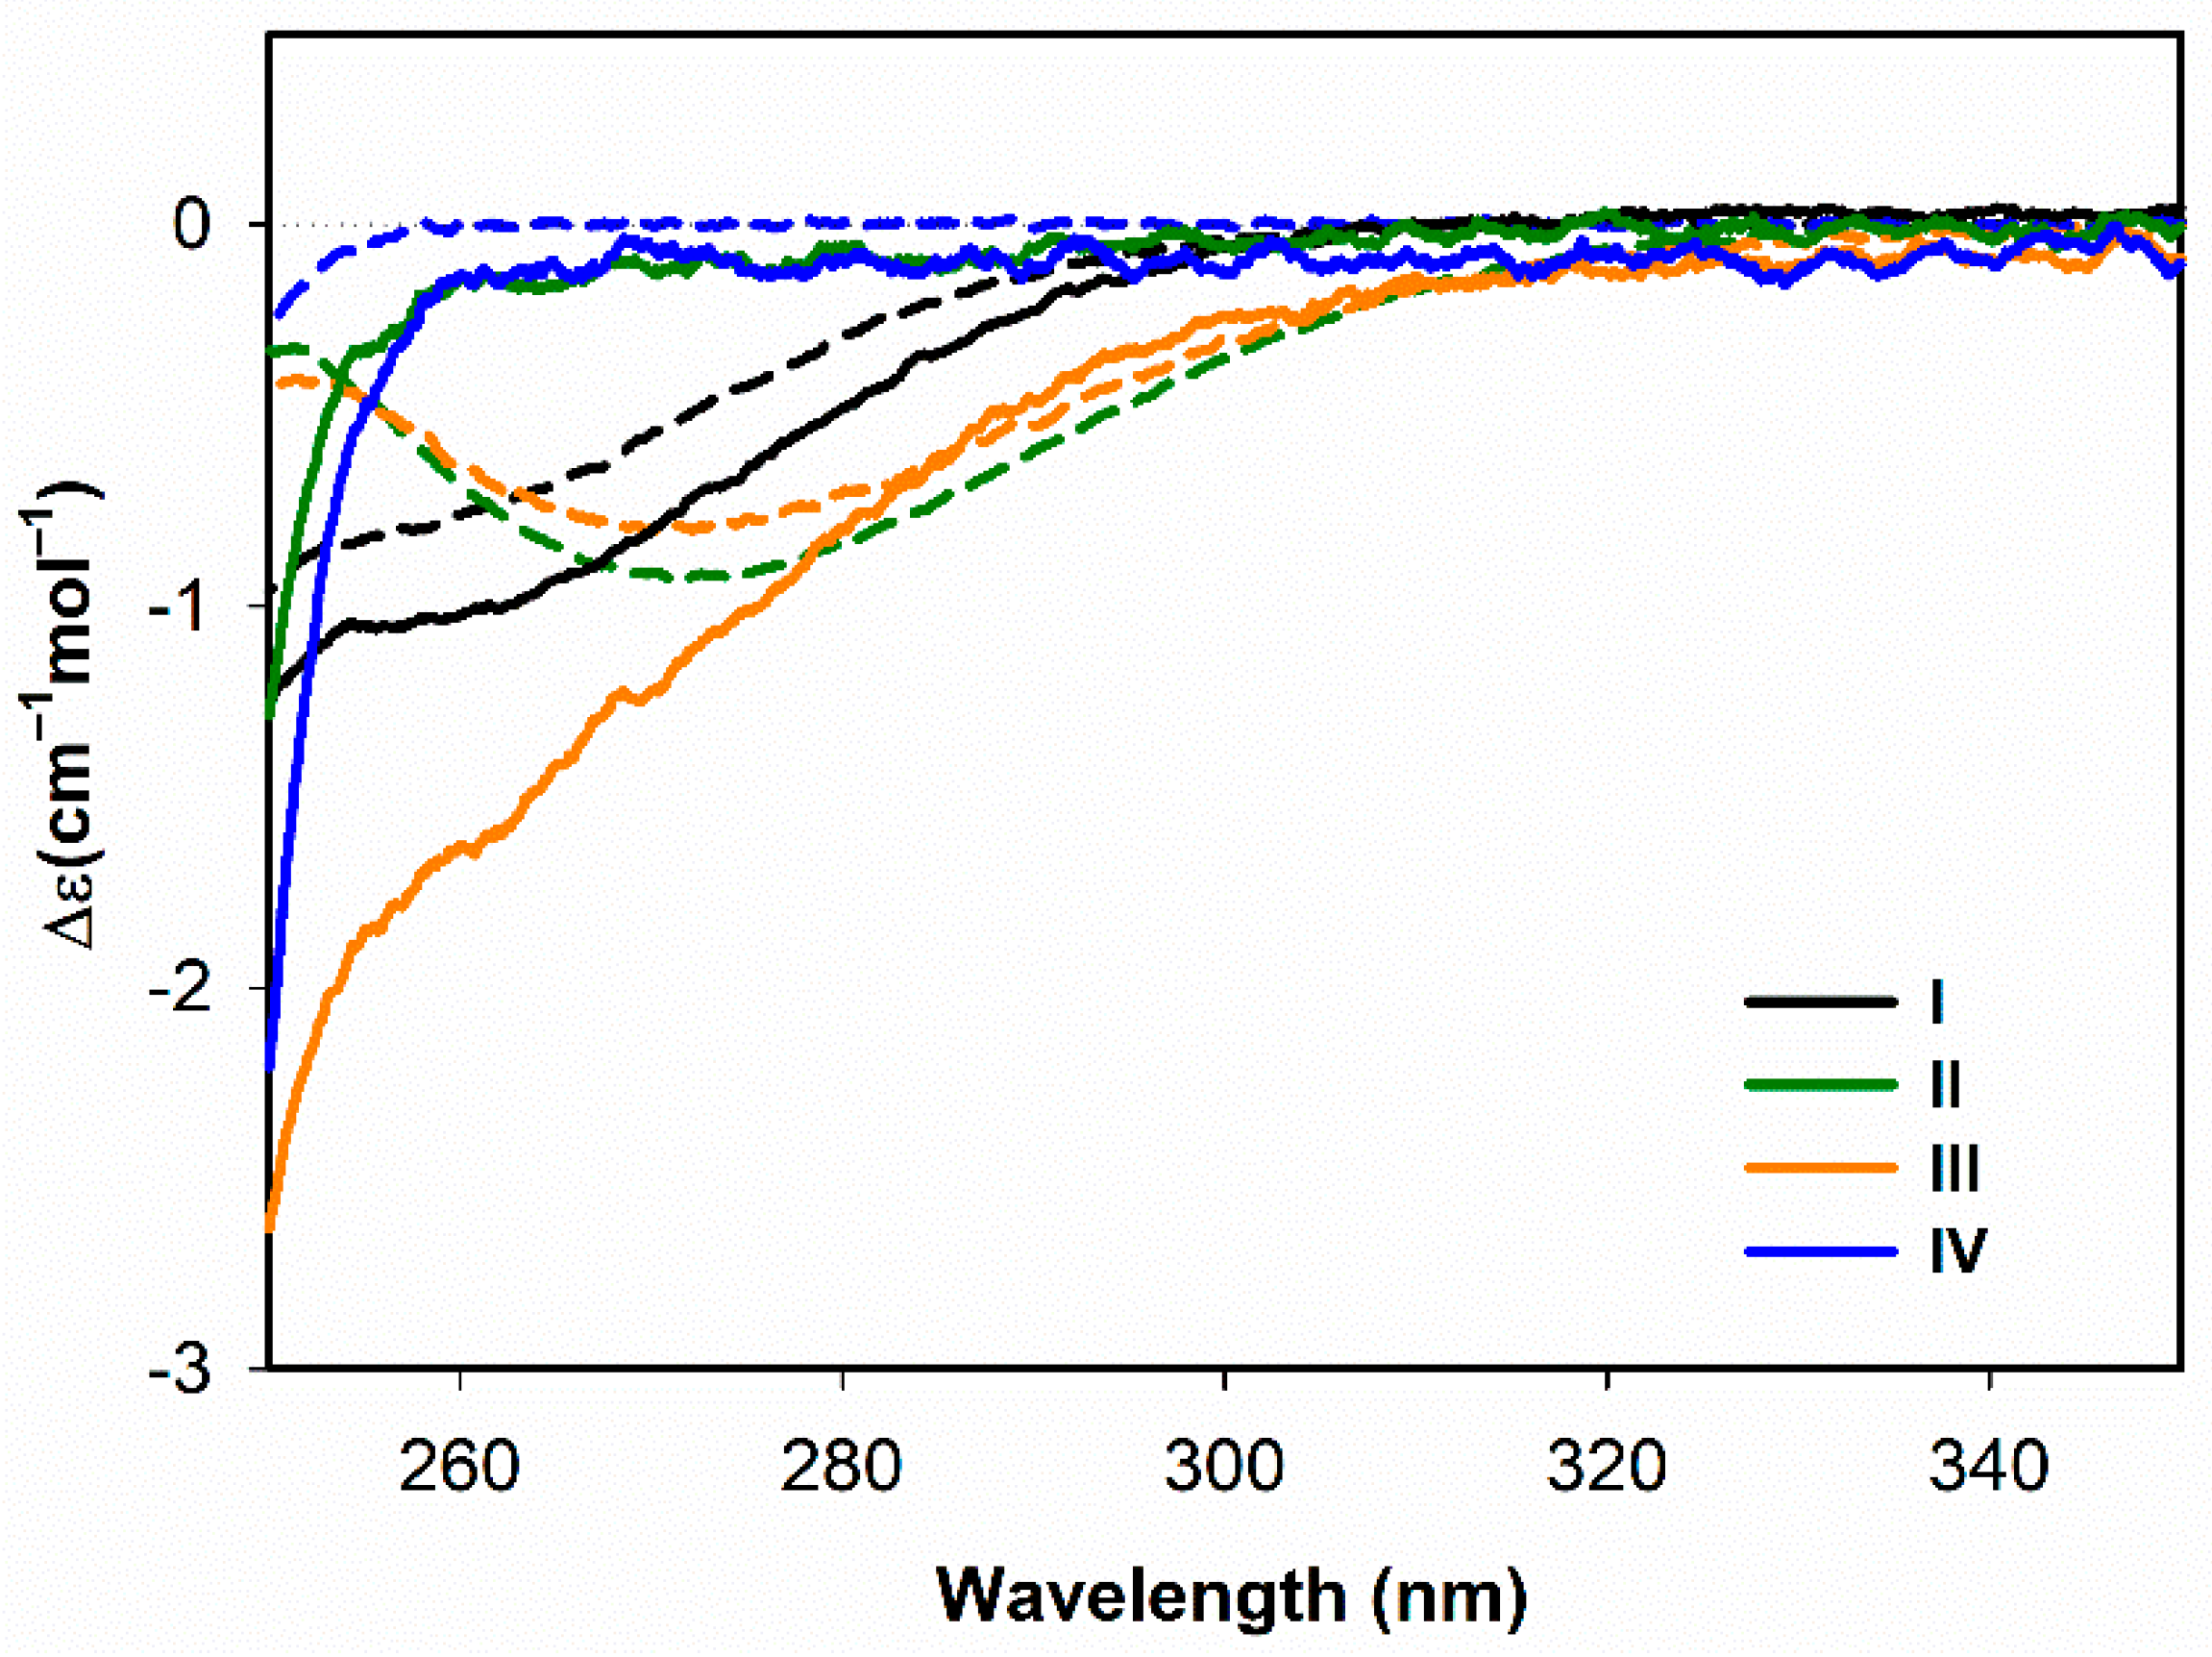
3.2.1. Structural Changes Followed by ECD

The ability of the peptides to adopt α-helical arrangement can be discerned from titration studies using TFE (range 0%–50% v/v) (Figure 6, Table S1 in Supplementary Material), an agent known to enhance the α-helical content [69]. Here, we extend the results reported in our previous investigation which included data corresponding only to high (50%) TFE concentration [1], in order to report the dynamic effects on the peptide secondary structure caused by the TFE concentration increment. For I the addition of TFE causes no significant spectral changes, only a slight intensity increase of the negative maximum at 207 nm (together with the associated shoulder at 222 nm) and a positive maximum at ~192 nm. However, spectra of all other lasiocepsin analogs (IIIV) exhibit distinct spectral changes upon TFE addition. In 10% TFE, their ECD spectra show shifts of the negative maximum from 198 nm to 203 nm (II, III) and from 197 nm to 200 nm (IV) together with an appearance of a negative shoulder at 222 nm. With further increase of TFE concentration (20%–50%), ECD spectra of IIIV exhibit a formation of new bands at ~191 nm (positive) and ~207 nm (negative, ~205 nm for IV) together with a negative shoulder at ~222 nm. Spectral shapes and intensities of these bands do not change significantly with increasing TFE concentration (above 20% TFE), only for IV we observe a slight intensity increase of the band at 191 nm (~10%). All titrations of IIV with TFE display presence of a single isodichroic point at ~204 nm suggesting a simple two-state process. Experimental position of this isodichroic point implies a transition between random coil (and possibly PPII) and α-helical conformations [24]. This observation is well reproduced by the values in Table S1 in Supplementary Material. With the increasing TFE concentration, numerical analysis indicates an increase of proportion of α-helical conformation and a parallel decrease in content of random coil/PPII structures. Not surprisingly, this process is least pronounced for the conformationally restricted I. The α-helical fraction content increases from 29% to 32% for I; 3%–39% for II; 3%–37% for III and 3%–21% for IV. The biggest relative increase of α-helical fraction is observed when TFE concentration reaches 20% (v/v).
Interaction of our model peptides with membrane-like environment is roughly simulated by addition of SDS (Figure 7). The chosen SDS concentration range 0–16 mM is both below and above critical micelle concentration (cmc—~4 mM) [45]. Below cmc we can investigate stability of IIV against denaturation, as at low concentrations SDS acts as a denaturation agent [45]. Above cmc, we can study structural behavior of the peptides in the presence of micelles in solution, and thus mimic, in a very simple way, the interaction of the peptides with cell membranes. As expected, structural changes induced by SDS are more complex than those observed in the presence of TFE. For I at low SDS concentrations (below 2 mM) there are no significant changes in ECD spectra, indicating structural stability of the peptide against SDS denaturation. With additional SDS concentration increase (to 2 mM, which is still below cmc), intensity of the positive band at ~192 nm notably increases (about twice). At the same time, intensities of the negative band at ~206 nm (which becomes slightly red shifted to ~210 nm) and also of the shoulder at ~222 nm get more pronounced. Altogether these spectral changes result in a formation of an isodichroic point at ~207 nm, which indicates again a simple two-state transition [24], in this case characterized by an increase of α-helical content and a simultaneous decrease of β-turn and random coil/PPII structure content. An intensity decrease of the positive spectral band at 192 nm for SDS concentration above 2 mM indicates increasing β-sheet structure content. According to the numerical analysis (Table S1 in Supplementary Material), the α-helical fraction in 8 mM SDS increases by ~15% (from 29% to 45%), while both β-turn and random coil/PPII structure fractions decrease (to the respective amounts of ~5% and 10%).
The peptides IIIV behave differently (Figure 7). At SDS concentrations below 2 mM, their spectra exhibit an intensity decrease of the negative band at 198 nm accompanied by its shift towards higher wavelengths (to 201 nm for III, 202 nm for II and IV). In addition, a new band appears at ~224 nm. Such spectral behavior reflects probably not only presence of random coil and α-helical conformations, but also other secondary structures like β-sheet/β-turn and/or PPII helix [24,54]. Formation of β-structure might indicate partial peptide denaturation, which is probably easier with the less stabilized structures IIIV which lack one (II, III) or both (IV) disulfide bridges. However, numerical analysis does not show any substantial changes in β-sheet/β-turn or PPII contributions (see Table S1 in Supplementary Material) probably due to its limited accuracy [47]. With further increase of SDS concentration (above 2 mM) the peptides IIIV formally start behaving like I, i.e., they show an apparent increase in proportion of α-helical conformation by forming a typical pattern composed of a positive ECD band at ~193 nm together with two negative bands of comparable intensity at 207 and 222 nm. A relative increase in α-helical content as estimated by numerical analysis (Table S1 in Supplementary Material) is the biggest for the peptide II (~45%—from 3% to 48%), while for the peptides III and IV it is ~20% lower (from 3% to ~25%). Underlying structural differences induced by SDS may be uncovered also by analysis of the Δε222/Δε207 ratio [24]. For I the Δε222/Δε207 ratio remains nearly independent of SDS concentration (close to unity), as expected for the prevailing α-helical conformation. On the other hand, for IIIV this ratio notably changes. It is > 1 for II and III in 4 mM SDS (Δε222/Δε207 = 1.37 for II and 1.18 for III), which may indicate a formation of β-structure [24]. For II further increase of SDS concentration leads to a decrease of the Δε222/Δε207 value to 0.94 in 8 mM SDS, and even to 0.91 in 16 mM SDS, indicating a return back to the prevailing α-helical structure. For III the Δε222/Δε207 value drops down to 0.71 (8 mM SDS) and 0.69 (in 16 mM SDS), which may even hint on a possible contribution of 310 helices [24]. For IV the maximum Δε222/Δε207 value (1.09) is reached in 2 mM SDS and in higher SDS concentration it decreases to 0.78. This change also indicates a possible occurrence of 310 helices. For IIIV, the ~5% increase in 310 helical content is confirmed by the numerical analysis of ECD data (Table S1 in Supplementary Material). Altogether, for the analogs IIIV an increase of SDS concentration from 2 to 8 mM seems to cause a minor increase of proportion of 310 helical and/or β-structure conformations.
If we compare structural behavior of IIV when brought into interaction with TFE or SDS, we can see that in both cases the α-helical fractions of their secondary structures increase and ultimately become the prevailing ones. However, as revealed by the detailed analysis of the spectral shapes of the ECD curves (particularly changes in the Δε222/Δε207 intensity ratio—see above), there are notable differences between the action of TFE and SDS. When the peptides interact with TFE, the changes of secondary structure can be described by a simple two-state transition [24], thought, according to the changes in the Δε222/Δε207 intensity ratio, α-helical structure formation seems to be accompanied by the formation of 310 helices (Δε222/Δε207 ratio < 1). On the other hand, interaction with SDS induces more complex structural changes. For the SDS concentration reaching cmc, the formation of more pronounced α-helical structure is observed for IIV. While for I this structural change is accompanied by a decrease of β-turn and random coil structure contribution, for IIIV β-structure contribution increases (Δε222/Δε207 ratio ≥ 1). On the other hand, with continuing increase of SDS concentration (above cmc), besides the major α-helical structure contribution, for III and IV we observe additional involvement of the 310 helical conformation (Δε222/Δε207 ratio < 1).
Distinct structural changes can be observed also in the disulfide transition region (Figure 8). While spectral behavior of I does not change significantly upon interaction with SDS, the spectra of both II and III (whose spectra exhibit a broad negative band at ~275 nm in water) undergo major changes. While for III we observe formation of a broad shoulder at ~270 nm, ECD signal of II practically disappears. The observed spectral change for II and III probably reflects conformational changes of the disulfide bridge orientation upon interaction with SDS micelles. Such change is not observed for the natural peptide I.

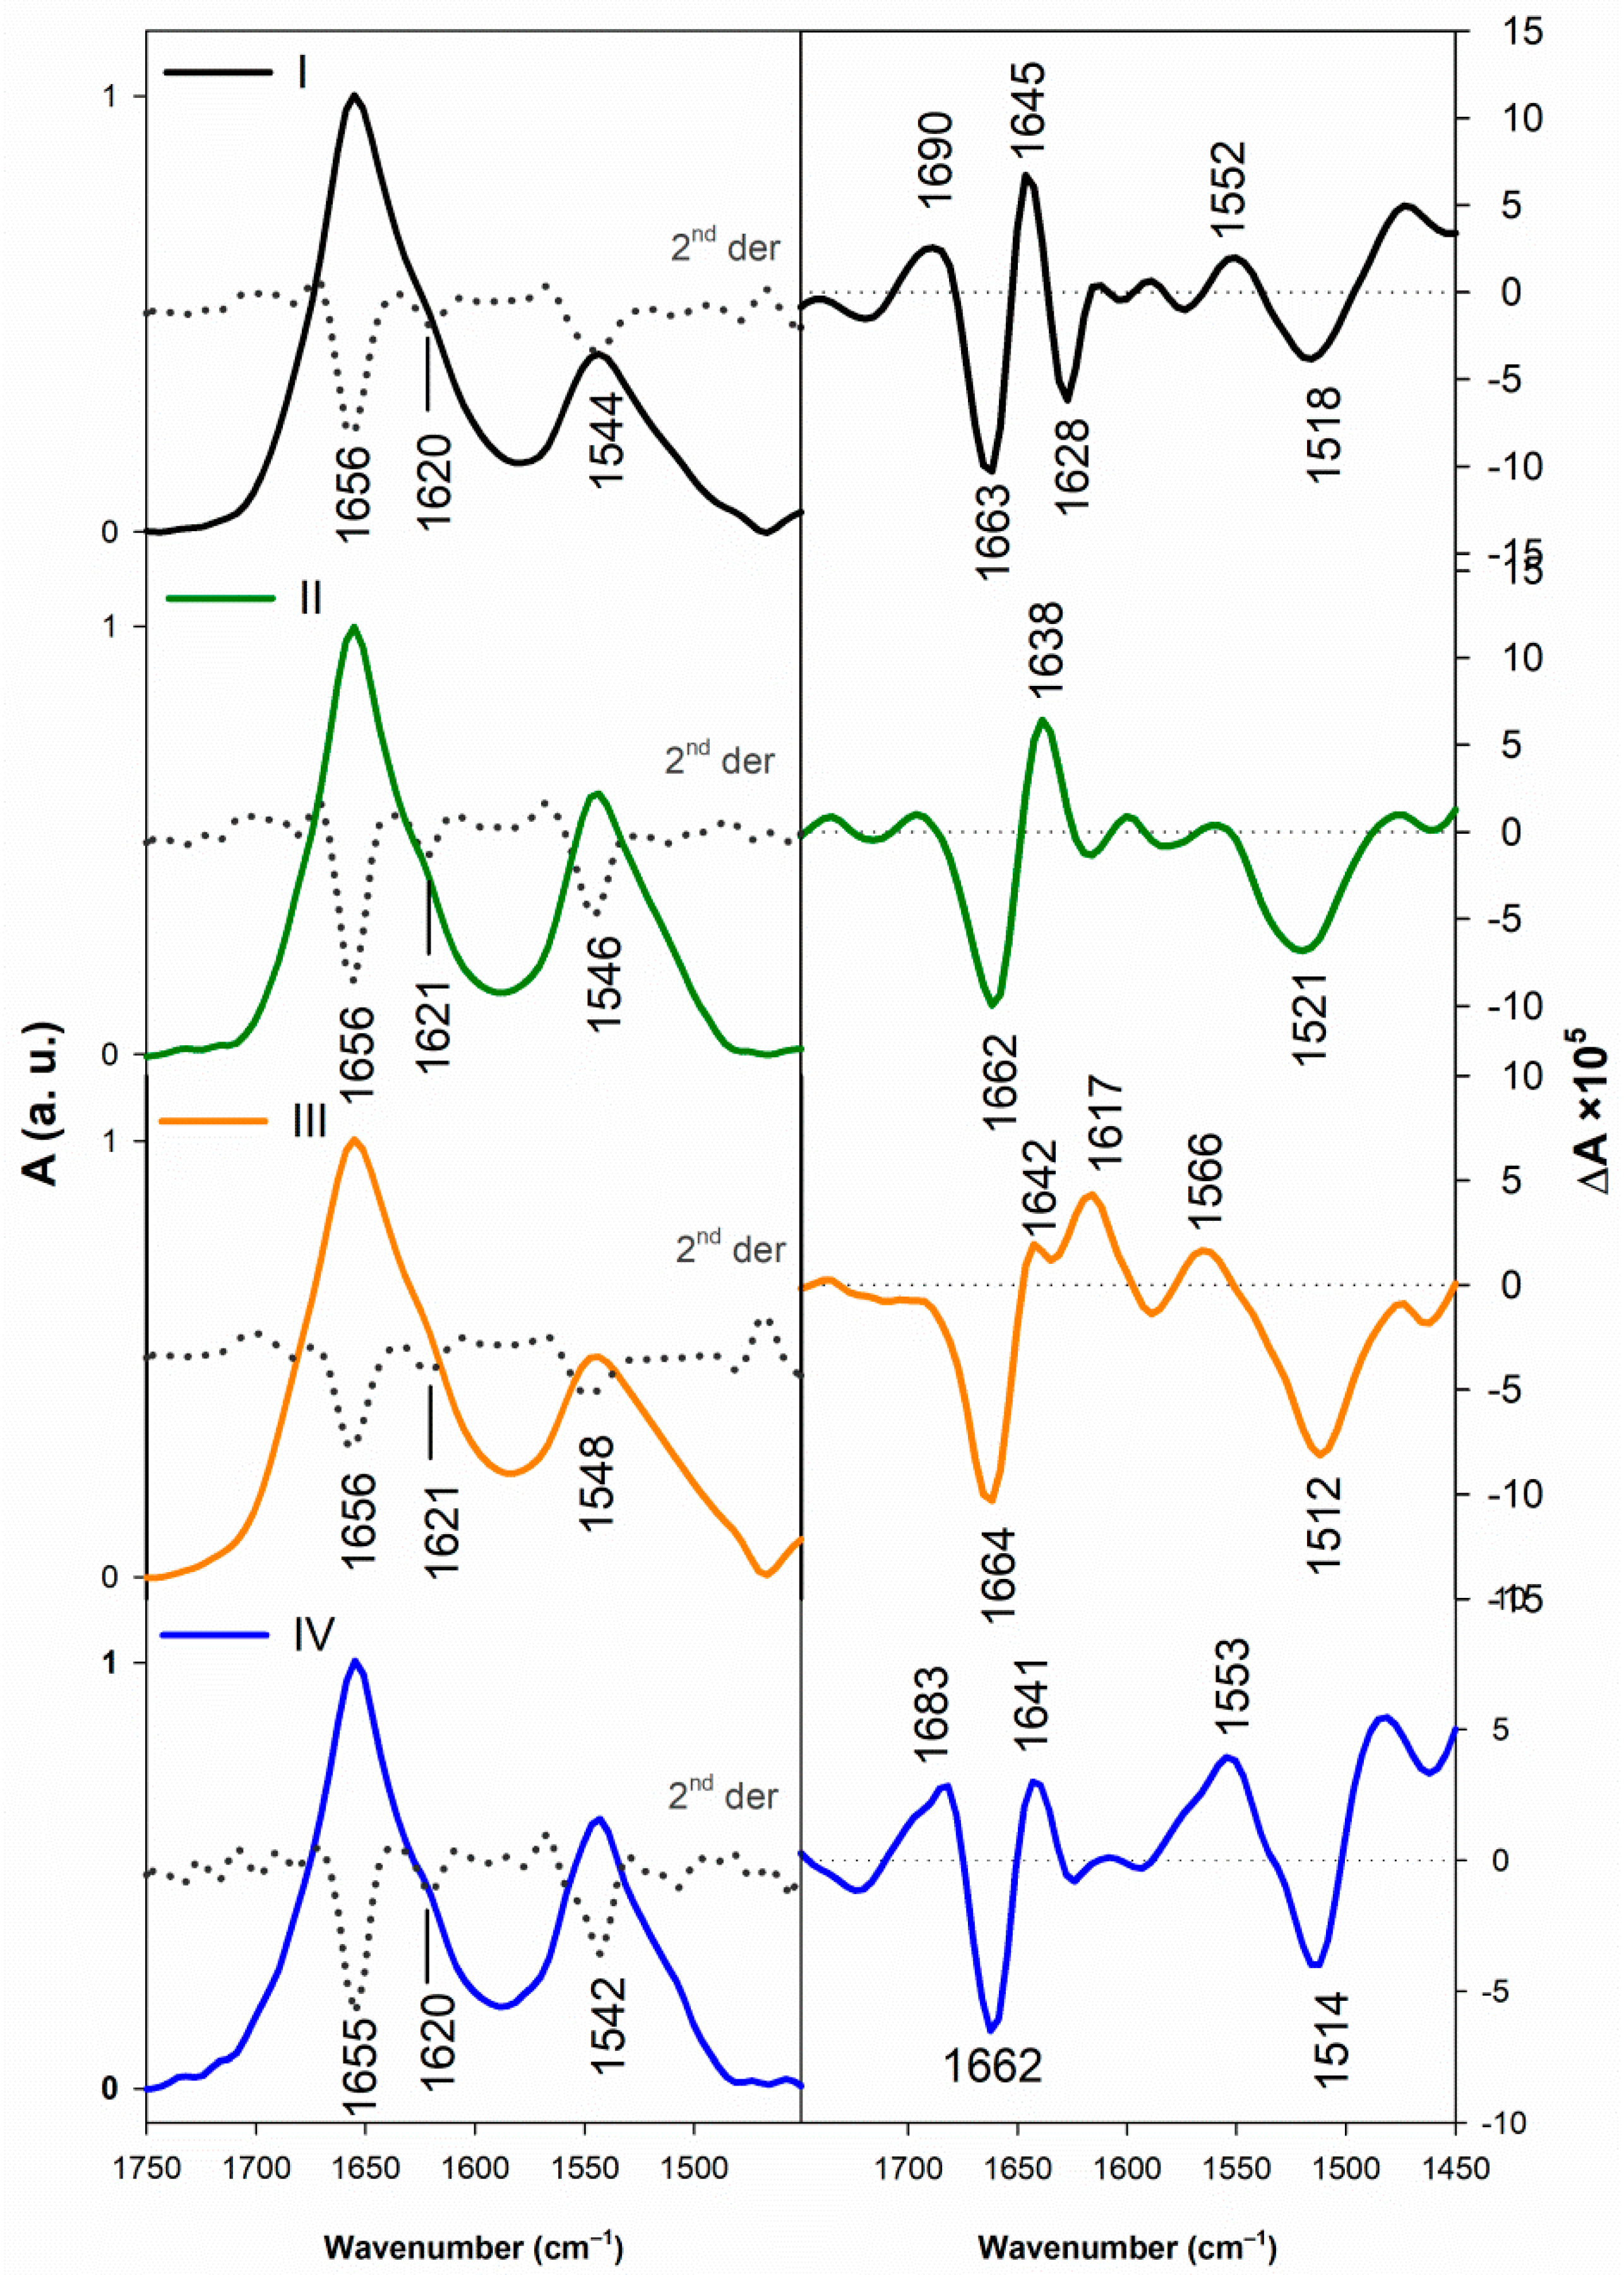
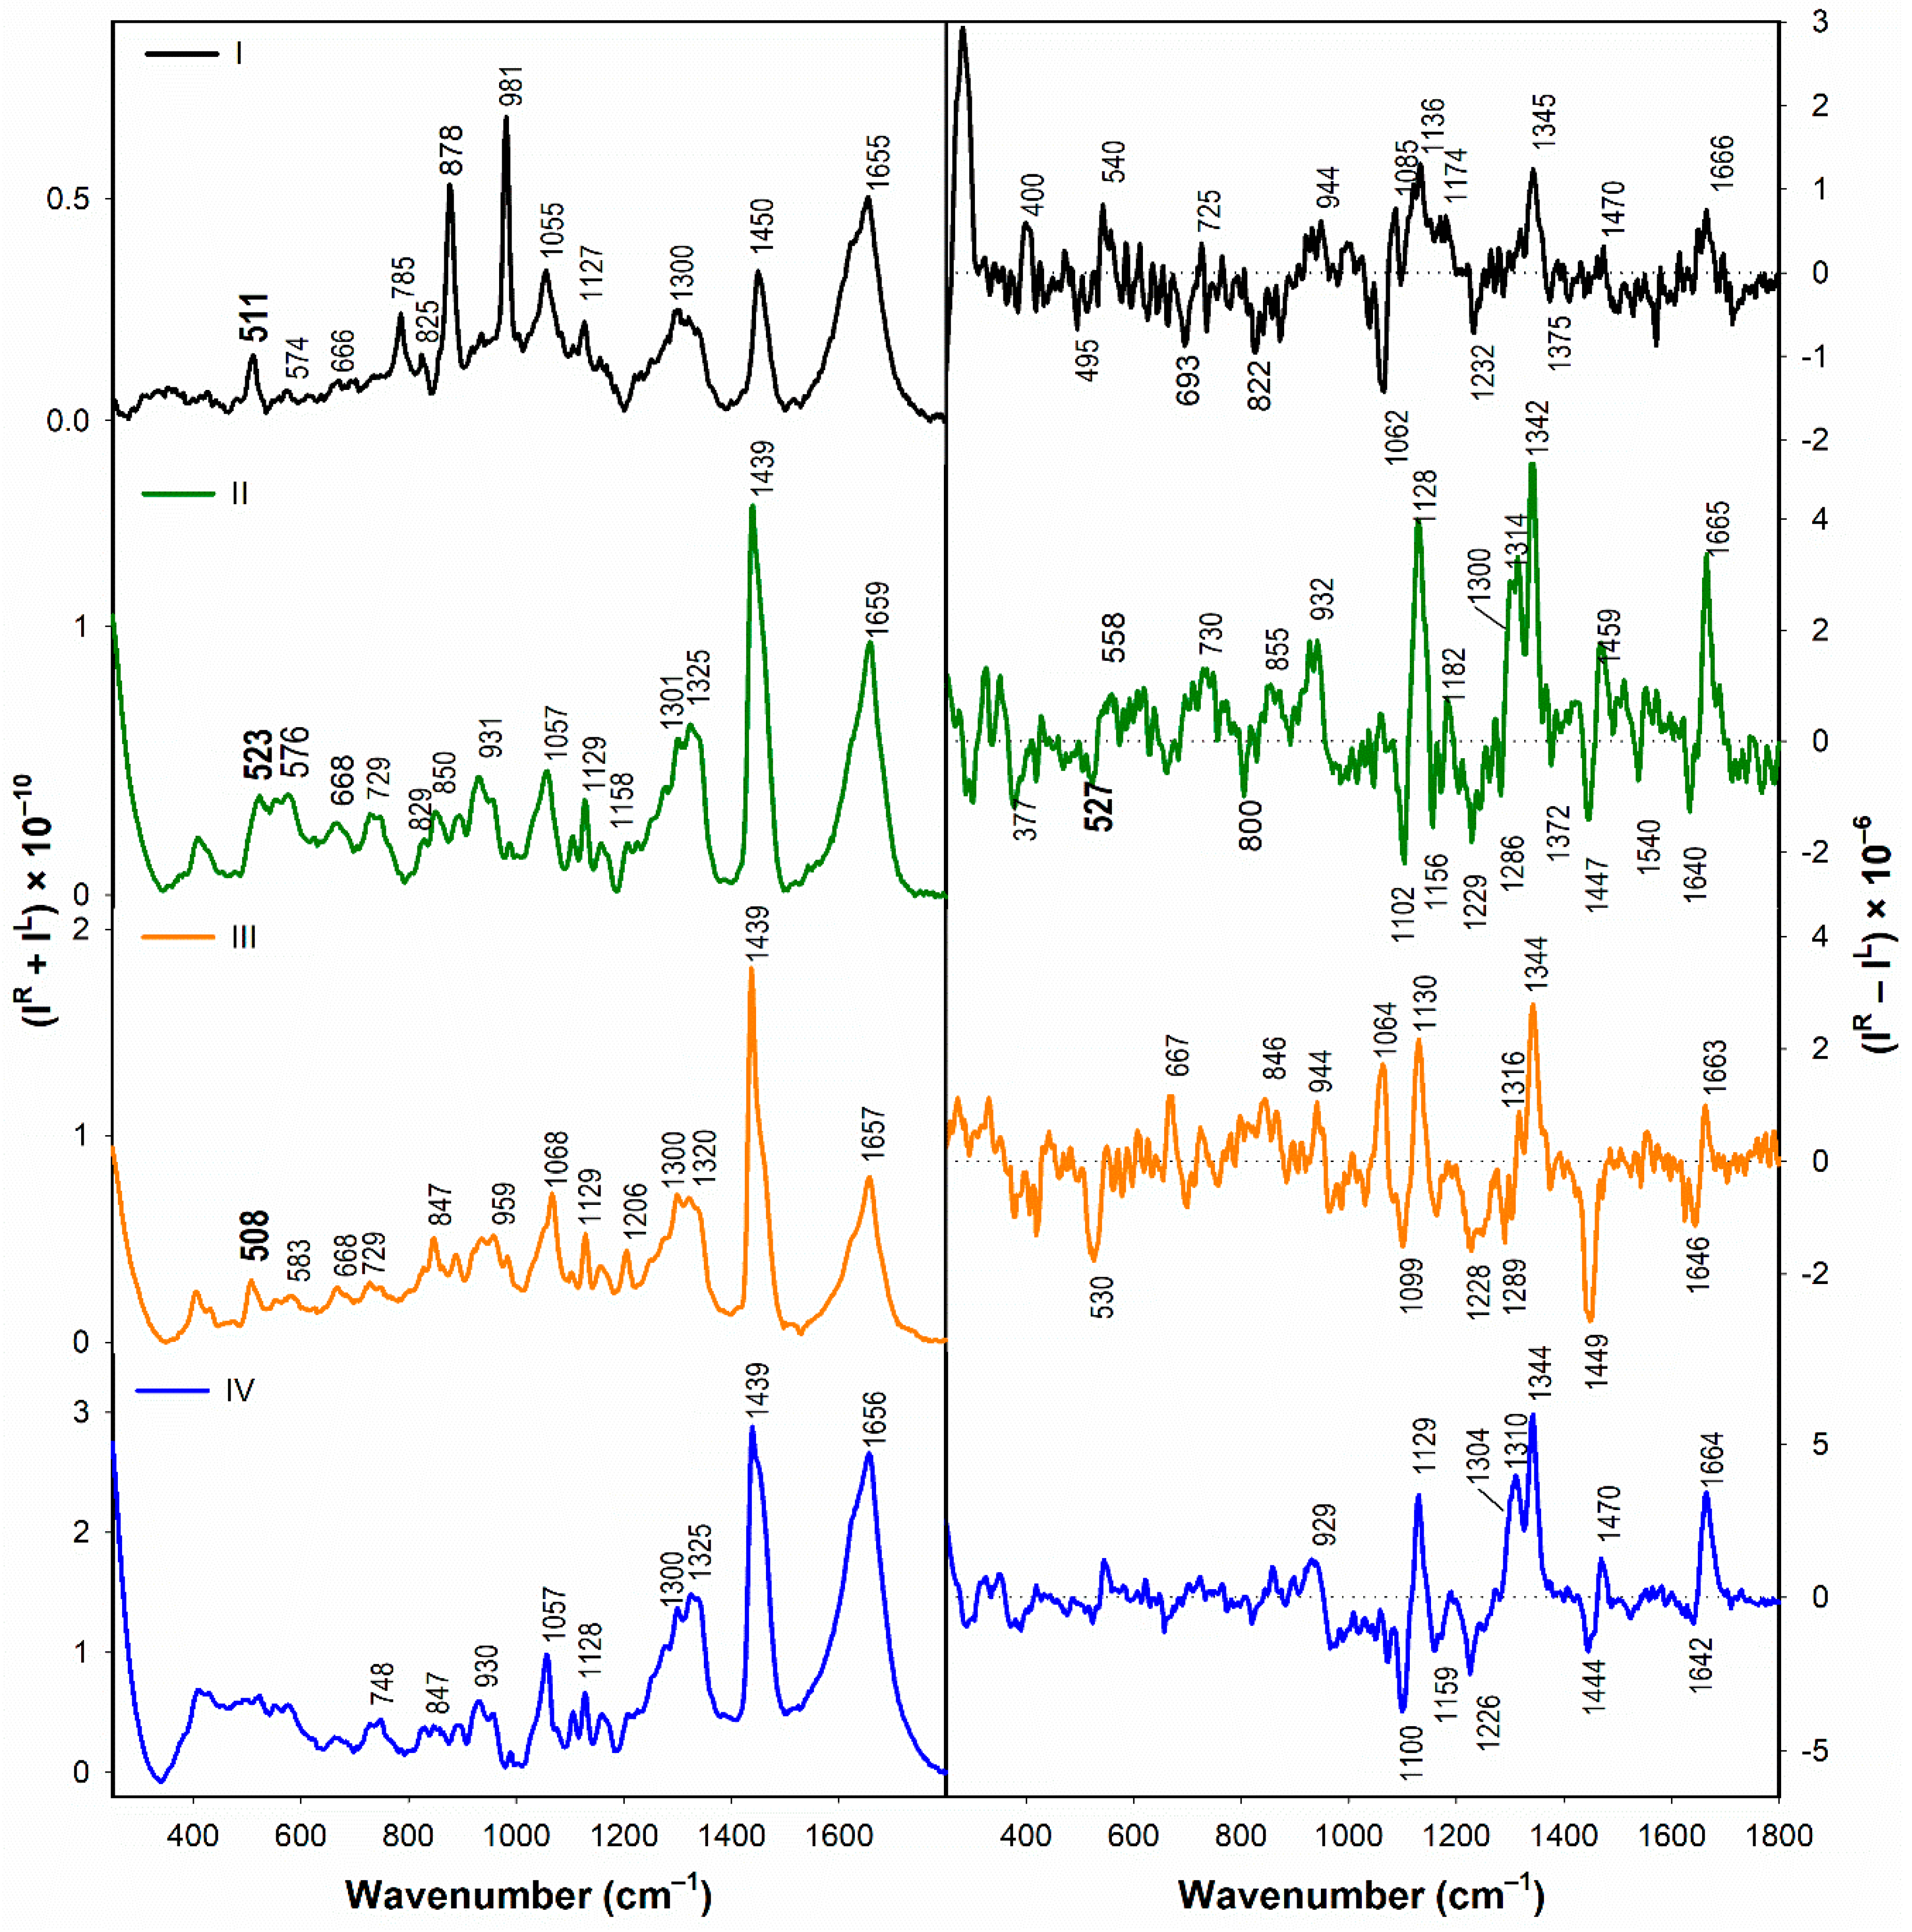
3.2.2. Structural Changes Followed by Vibrational Spectroscopy

Similar to ECD data, both IR/VCD (Figure 9) and Raman/ROA spectra of IIV (Figure 10) indicate significant structural changes caused by the addition of SDS micelles. When interpreting vibrational spectroscopy data of the peptides measured in the presence of SDS micelles, one should keep in mind that the β-sheet structure content could be overestimated due to the high sample concentration used for the vibrational spectroscopy experiments. In order to evaluate such effect, ECD spectra of the highly concentrated samples I–IV were measured in H2O and in the presence of SDS micelles. In the presence of SDS micelles, ECD spectra show some time-induced structural changes related to changes in β-structure content. On the other hand, such changes do not occur in pure water (see Figure S1 in Supplementary Material comparing ECD spectra of I–IV in water and SDS, obtained before and after vibrational spectroscopy measurements).
IR spectra of all the peptides in the presence of SDS are dominated by the band at ~1655 cm−1 due to either unordered or α-helical structure. An additional, low-intensity amide I component at ~1620 cm−1 might be due to the partial β-aggregation [59], probably caused by high sample concentration. However, its contribution is only minor and should not have a significant effect on the secondary structure estimation. While in water the VCD spectrum of I exhibits only one amide I band at ~1661 cm−1 (Figure 9), in the presence of SDS we observe four amide I bands. A couplet at ~1663 and 1645 cm−1 implies the presence of α-helical structure, while the respective positive and negative bands at 1690 and 1628 cm−1 are indicative of β-turn and β-sheet conformation [36]. The bands typical for α-helical conformation (a negative/positive amide I couplet at ~1660 and ~1640 cm−1 and a negative amide II band at ~1520 cm−1) can be also found in the spectra of the analogs II–IV. VCD spectra of II and IV also indicate a contribution of β-turn (a positive amide I band at ~1690 cm−1 for II and at ~1683 for IV) and/or β-sheet conformation (a positive amide II band at ~1553 cm−1 for IV) [36]. Due to the rather complex VCD spectral shapes in amide I region, the PPII structure participation [35,37] cannot be also excluded. To aid with the assignment we again employ ROA spectroscopy.
Despite ROA spectra of I in 100 mM SDS (Figure 10) are rather noisy compared to those recorded in H2O (due to the less favorable experimental conditions for this particular experiment—lower sample concentration and higher background fluorescence), we can still clearly distinguish the positive amide III band at ~1345 cm−1, indicating a prevailing α-helical conformation [40]. Due to the poor S/N ratio, it is not possible to resolve other bands in the extended amide III region. Participation of other structural elements such as PPII is likable, particularly due to the presence of a positive single-signed amide I feature at ~1666 cm−1 instead of a characteristic α-helical negative/positive couplet centered at ~1650 cm−1 [40]. Unlike for I, ROA spectra of IIIV exhibit well resolved spectral features even in the presence of 100 mM SDS (due to the lower residual fluorescence of these samples). ROA spectra of all the analogs show a positive/negative amide I couplet at ~1666 and ~1640 cm−1, which could be, together with a positive amide III signal at 1342 cm−1 (II) or 1344 cm−1 (III and IV), assigned to the α-helical conformation. According to the literature [70], the amide III band near ~1340 cm−1 corresponds to the hydrated form of α-helices. Based on a comparison of spectral patterns of I–IV in amide I and amide III regions, similarities can be found between the spectra of I and III, and those of II and IV. While the spectra of I and III seem to exhibit rather low-intensity amide I signals and their amide III signals are both dominated by the band at ~1345 cm−1, in the spectra of II and IV we observe rather intense amide I couplet and additional positive amide III signals within the 1300–1315 cm−1 region. Such amide III signals might indicate that, apart from hydrated α-helical segments (indicated by the band near ~1340 cm−1), unhydrated α-helical structures are also present [70]. Lower intensity of the amide I band of I and III might suggest an additional secondary structure contribution. Based on the relative intensity of the bands ascribed to the α-helical structure, it seems that the larger proportion of α-helical structure is present in the analog II, which is in agreement with ECD data.
In the Raman/ROA spectra of the disulfide-containing analogs (I–III), an addition of 100 mM SDS causes changes of the S–S stretching signals (Figure 10). While in Raman spectra the S–S stretching bands of I and III remain mostly unchanged (with the prevailing gauche-gauche-gauche conformation), for II we observe two bands at 523 and 576 cm−1 (indicating a combination of gauche-gauche-trans and trans-gauche-trans conformation) [39] which replace the single band at 508 cm−1 observed in water. The Raman signals in the C–S stretching vibration region (600–800 cm−1) show that the S–Cβ–Cα–C dihedral angles in IIII may probably adopt both PN or PC (Raman band at ~730 cm−1) and PH conformations (Raman band at ~668 cm−1) [67]. The ROA spectrum of I in SDS exhibits a positive band at ~540 cm−1, which might indicate a conformational change, because in H2O we observe the ROA band at ~520 cm−1 with the opposite (negative) sign. When compared to the measurements in H2O, we see additional spectral changes also in the ROA spectra of both II and III: (i) a sign change of the ROA signal in the ~560–570 cm−1 region (from the negative one to a positive one) in the spectrum of II, and (ii) formation of a strong negative ROA band at ~530 cm−1 in the spectrum of III. These spectral changes again hint on possible conformational changes of the disulfide groups of II and III induced by the peptide interaction with SDS.
Apart from the analysis of amide vibrations and identification of markers specific for individual secondary structure elements, overall shape (within the whole recorded region from ~100 to 2000 cm−1) and mutual ratio of Raman and ROA spectral intensities enables qualitative characterization of the peptide flexibility. As follows from a comparison of the normalized Raman vs. ROA spectra of IIV (Figure S2 in Supplementary Material), an overall intensity ratio between the ROA signals and its parent Raman signals is the highest for the peptides I and II (both in H2O and SDS). Together with the presence of sharp bands and rather intense ROA signals below ~750 cm−1, these spectral features indicate relatively high structural rigidity of I and II. Lower intensity (~⅔) of the ROA signals of III is probably caused by an averaging of spectra of several conformers, thus suggesting higher peptide flexibility. The highest flexibility is indicated for the peptide IV, whose ROA spectra (both in H2O and SDS) exhibit the lowest spectral intensities, broader bands and small signals below ~750 cm−1 [41].

3.3. Summarization of the Results

Based on the obtained data, the results can be summarized as follows:
  • Secondary structure of I in water, as derived from ECD, IR/VCD, and Raman/ROA data, corresponds well to the published NMR structure.
  • The native peptide I manifests high structural and conformational rigidity, as evidenced by ROA data. While the analog II appears to be still conformationally rigid (although to somewhat lesser extent than I), the analogs III and IV seem to be rather flexible. The analog IV is the most flexible one.
  • In the presence of TFE (>20%) or SDS (>2 mM), all the analogs form α-helical structure (at least to some extent) with some random coil/PPII structure participation. On the contrary, in H2O the α-helical structure is observed only for the natural peptide I.
  • Based on the ROA spectra, hydrated form of α-helical structure seems to prevail in all the analogs IIV in the presence of SDS. Analogs II and IV seem to also have a considerable portion of unhydrated α-helical structure.
  • According to the Raman spectra, the disulfide groups of IIII in water adopt predominantly the gauche-gauche-gauche conformation. In the presence of SDS, gauche-gauche-gauche conformation remains dominant in I and III, while for II we observe a conformational change to gauche-gauche-trans and trans-gauche-trans conformation.
  • Both ECD and ROA spectra indicate structural changes in absolute configuration of disulfide groups upon addition of SDS.
These findings are further discussed in the following section.

4. Discussion

Secondary structure of the native lasiocepsin: Estimated secondary structure of I in water, resulting from the analysis of chiroptical spectra, can be directly compared to the available NMR data [20]. The published NMR structure (PDB ID: 2mbd) involves two α-helices (Arg4–Lys14 and Leu21-Cys25, containing 10 and 4 amide bonds, respectively), one β-turn (Lys18–Leu21, consisting of 3 amide bonds) and three segments having random coil/unordered/extended structure (the initial Gly1–Arg4, middle Lys14–Lys18, and final Cys25–Cys27 moieties, total of 10 amide bonds). Based on ECD numerical data analysis, the fractions of secondary structure motifs are estimated as follows: (i) 39% of helical structures (sum of α- and 310 helices, corresponding to approx. 11 amide bonds), (ii) 18% of β-turns (approx. 5 amide bonds), and (iii) 43% of other structural elements (random coil, PPII, and β-sheet structure) characterized by similar backbone dihedral angles [71]. This result is in a good agreement with NMR data. The only notable difference is a slight underestimation of the α-helical content, which could be due to a systematic error of the applied method (CDPro fit) [47]. Vibrational techniques confirm prevailing α-helical and random coil/PPII conformation, accompanied by a small portion of β-turn structure. In addition, ROA hints on peptide rigidity and conformational stability (due to the sharp, well-distinguished ROA bands in the low-wavelength spectral region). Based on these results, it seems that a combined use of chiroptical methods allows rather precise identification of secondary structure elements of I. For their relative simplicity and availability, chiroptical techniques enable us to monitor structural changes of I induced by changes in the environment or in the peptide primary structure (the analogs IIIV with modified disulfide bridge patterns).
Secondary structure of lasiocepsin analogs under different environmental conditions: Conformation of the natural peptide I, which possesses substantial antibacterial and antifungal activity, is rather restricted and does not change significantly upon addition of TFE or SDS. In contrast, the analogs IIIV, which show reduced biological activity, are able to undergo major conformational changes. In water, their secondary structure is mainly composed of random coil/PPII and β-sheet conformations, while the addition of TFE (>20%) or SDS (>2 mM) results in a significant decrease of random coil/PPII participation and a simultaneous increase of the α-helical content (for II and III the relative amount of the α-helical fraction is even comparable to that of the native I). Based on our results, it seems that biological activities of these peptides might not be solely determined by their propensity for forming α-helical structure. Although biological activities of the peptides IIII are different, their ability to form α-helical structure in the membrane-mimicking environment remains similar. This behavior indicates that, for maintaining biological activity, the peptides need to adopt a specific 3D arrangement of secondary structure domains (i.e., a specific-amphipathic peptide tertiary structure). This emphasizes the role of disulfide bridges which act as tertiary structure stabilizers.
The role of disulfide bridges in maintaining lasiocepsin tertiary structure: The preceding NMR study [20] hints on the importance of mutually perpendicular orientation of the two α-helical segments of I (Arg4–Lys13 and Pro20-Val24), which is stabilized by the Cys8–Cys25 disulfide bridge. The orthogonal arrangement of these segments results in formation of a specific amphipathic structure, which seems responsible for biological activity of I. Thus, mutual orientation of the helical segments seems more important than their ideal α-helical conformation. Our results further support this hypothesis and provide additional details. Apparently, mutual perpendicular orientation of the helical segments cannot be achieved with the analog II lacking the Cys8–Cys25 disulfide group. In aqueous solution, this analog clearly favors β-sheet and PPII structures over α-helices. It seems that the longer α-helix (Arg4–Lys14) cannot keep its fold, while the shorter one (Leu21–Cys25) remains at least somewhat stabilized by the Cys17–Cys27 bridge. Although α-helix formation can be in II induced relatively easily by the addition of TFE or SDS micelles, this peptide exhibits only reduced antimicrobial activity. Similar behavior is observed for the analog IV lacking both disulfide bridges. According to ROA, its structure in aqueous solution is relatively flexible, suggesting a dynamic equilibrium between several conformations, favoring random coil/PPII folds. Even though addition of TFE or SDS micelles again leads to a substantial increase in α-helical content, this analog remains almost inactive.
In contrast, analog III, which lacks the Cys17–Cys27 disulfide bridge, behaves differently. In water, it appears to be the second most flexible of all four analogs. Similar to II and IV, it contains only a small proportion of α-helices, whose abundance significantly increases after the addition of TFE or SDS micelles. On the other hand, III exhibits higher antimicrobial activity than II and IV, indicating that this analog is able to rearrange (at least to some extent) its tertiary structure to the form which closely resembles the conformation of the native peptide I. Thus, the presence of the Cys8–Cys25 disulfide bridge, which stabilizes the distance and orientation of the two α-helical segments in natural I, appears to be crucial.
This assumption is further supported by ROA spectra of IIV in the presence of SDS, which show differences in hydration of α-helical segments in I and III (with predominant hydrated α-helices) compared to II and IV (with both hydrated and unhydrated α-helices). These differences might be explained either by deeper incorporation of the peptides II and IV into SDS micelles, or by the different arrangement of their α-helical segments. In II and IV, such rearrangement seems plausible due to the absence of the stabilizing Cys8-Cys25 disulfide bond, which might result in realignment of hydrophobic and hydrophilic patches. Such changes could affect the ability of the peptides to interact properly with membrane and, consequently, reduce their biological activity. The results of ROA analysis, indicating hydration of the α-helical segments of I, are in an agreement with the NMR analysis, which shows that the peptide does not penetrate into the SDS micelles [20]. It seems that the peptide might bind onto the negatively charged surface of the micelles and thus cover them in a detergent-like manner (the carpet-like mechanism [14]). However, for deeper understanding of the process, additional detailed analysis of lasiocepsin peptides in interaction with models which more closely resemble bacterial membranes (such as liposomes of different composition) should be carried out.
Based on these observations, it appears that the Cys8–Cys25 disulfide bridge has a “functional” role and is critical for maintaining the tertiary structure and overall amphipathic structure of lasiocepsin, and, consequently also its antimicrobial activity. The Cys17–Cys27 disulfide bridge has a “stabilizing” role, consisting in reducing the peptide flexibility and maintaining its secondary structure.
The specific tertiary structure fold, i.e., the perpendicular orientation of the α-helical segments maintained by the Cys8–Cys25 disulfide bridge, appears to be the main factor responsible for the high antimicrobial activity of lasiocepsin. Therefore, it would be beneficial to study it further and in closer detail, for example with the aid of Cys crosslinkers of different lengths.
Conformation of the disulfide bridges: Changes in disulfide bridge conformation are reflected both in ECD and Raman/ROA spectra. Unfortunately, the exact interpretation of ECD disulfide signals would require either additional information on disulfide group geometry, i.e., approximate magnitude of the C–S–S–C torsion angles [58,72], or a dedicated computational study. Raman/ROA spectroscopy evidently reacts to the conformation of the S–S and C–S bond via S–S and C–S stretching vibrations. We observe changes both in positions (Raman/ROA) and even signs (ROA) of the bands in the S–S stretching region. For II, changes in Raman signals due to the S–S stretching vibrations correspond to conformational changes of the C–S–S–C fragment from gauche-gauche-gauche to gauche-gauche-trans and trans-gauche-trans conformation, indicating possible elongation of the disulfide bridge. Sign flips and shifts of the ROA bands in the S–S stretching region may also indicate significant disulfide group conformational changes, including changes in their absolute conformation [42,43]. However, the analysis of the experimental data is not in this case very straightforward. As the positions of the ROA bands do not always correspond to the positions of the Raman bands assigned to the S–S stretching vibrations (e.g., for I and III in SDS, the respective ROA bands at 540 and 530 cm−1 do not have any visible counterparts in their parent Raman spectra), it is not possible to interpret the experimental results directly. The assignment is rather difficult, as it is not clear whether the ROA bands are due to the S–S vibrations or due to vibrations of the peptide backbone (or both). Based on the previous studies of disulfide-related ROA signals [42,43], for I the sign flip of the ROA signal in the S–S stretching region from the negative one in water to the positive one in the presence of SDS micelles could be interpreted as a change of an absolute sense of the disulfide group conformation (from left- to right-handed). For III formation of the negative ROA band in the presence of SDS might indicate prevailing left-handed disulfide group orientation, while its absence in water might be caused by an averaging of spectra of several conformers, thus suggesting higher peptide flexibility [42,43]. However, the molecules in solution are dynamic systems having several possible allowed geometries, each of them having distinct spectral manifestation. The observed spectra represent an average of all these conformations. For better understanding of the relation between the conformation of the disulfide bridges and the sign of the corresponding S–S stretching bands in the ROA spectra, a dedicated detailed computational study would be needed. This will be a matter of our further investigation.

5. Conclusions

We have shown that a combination of optical and chiroptical spectroscopic techniques (both electronic and vibrational) represents an effective tool for inspecting lasiocepsin conformation in different environments (i.e., in water and in the presence of the membrane-mimicking agents) and that the set of these techniques can be potentially used for studying mechanism of AMP action. For the natural peptide I both in aqueous and in SDS micelle-containing solution, secondary structure estimation derived from chiroptical data correlates well with the published NMR structure [20]. Utilizing analogs IIIV with modified disulfide bridge patterns and inspecting them both in water and in the membrane-mimicking environment, we were able to complement the previous findings and further characterize the role of Cys8–Cys25 and Cys17–Cys27 disulfide bridges on lasiocepsin structure. Both disulfide groups are important for stabilizing lasiocepsin conformation, but each of them has a different role. The Cys8–Cys25 disulfide group (connecting the two orthogonally oriented α-helical segments of I [20]) appears to be crucial for sustaining lasiocepsin tertiary structure and its overall amphipathic character, which is necessary for maintaining its biological activity. On the other hand, the Cys17–Cys27 disulfide bridge has a supporting function consisting in reducing the peptide flexibility. The hydration of α-helical segments in I and III confirmed predominant solvent exposition of helices in agreement with NMR study.
The observed changes in ECD, Raman and ROA disulfide-related signals induced either by removing particular disulfide groups or by interaction with a membrane-mimicking environment (SDS micelles) seem to reflect changes in disulfide group conformations. However, detailed interpretation of experimental disulfide-related signals will require a dedicated computational study.

Supplementary Materials

The following are available online at https://www.mdpi.com/2073-8994/12/5/812/s1, Table S1: Estimated secondary structure fractions (in %) of IIV determined from the ECD spectra [47,48] measured in H2O and in the presence of TFE (10%–50%) and SDS (0.016–8 mM); Figure S1: ECD spectra of IIV in H2O (A) and in the presence of SDS (16 mM) (B) collected before (solid line) and after (dashed line) the VCD and ROA spectra measurement. Figure S2: Normalized ROA spectra of IIV measured in H2O (left) and 100 mM SDS (right).

Author Contributions

Conceptualization, L.B.; data curation, M.P. and L.B.; formal analysis, M.P., V.P., R.K.D. and L.B.; funding acquisition, P.M., V.B. and L.B.; investigation, M.P., V.P., P.M., R.K.D. and L.B.; project administration, V.B. and L.B.; resources, V.Č.; supervision, V.B. and L.B.; validation, V.P., P.M. and L.B.; writing—original draft, M.P., V.P., P.M. and L.B.; writing—review and editing, M.P., V.P., R.K.D., V.Č., V.B. and L.B. All authors have read and agreed to the published version of the manuscript.

Funding

This work was supported by Charles University (Progres Q47 and project UNCE 010), Grant Agency of the Czech Republic (projects no. 208/10/0376 and P205/10/1276) and Grant Agency of Charles University (project no. 578212).

Acknowledgments

We thank Zuzana Flegelová (Spyder s.r.o.) for the custom peptide synthesis.

Conflicts of Interest

The authors declare no conflict of interest.

References

  1. Monincová, L.; Slaninová, J.; Fučík, V.; Hovorka, O.; Voburka, Z.; Bednárová, L.; Maloň, P.; Štokrová, J.; Čeřovský, V. Lasiocepsin, a Novel Cyclic Antimicrobial Peptide from the Venom of Eusocial Bee Lasioglossum Laticeps (Hymenoptera: Halictidae). Amino Acids 2012, 43, 751–761. [Google Scholar] [CrossRef] [PubMed]
  2. Easton, D.M.; Nijnik, A.; Mayer, M.L.; Hancock, E.W. Potential of Immunomodulatory Host Defense Peptides as Novel Anti-Infectives. Trends Biotechnol. 2009, 27, 582–590. [Google Scholar] [CrossRef] [PubMed]
  3. Fjell, C.D.; Hiss, J.A.; Hancock, R.E.W.; Schneider, G. Designing Antimicrobial Peptides: Form Follows Function. Nat. Rev. Drug Discov. 2012, 11, 37–51. [Google Scholar] [CrossRef]
  4. Phoenix, D.A.; Dennison, S.R.; Harris, F. Antimicrobial Peptides; Wiley-VCH; Wiley-VCH Verlag GmbH & Co. KGaA: Weinheim, Germany, 2013. [Google Scholar]
  5. Zasloff, M. Antimicrobial Peptides of Multicellular Organisms. Nature 2002, 415, 389–395. [Google Scholar] [CrossRef] [PubMed]
  6. Hancock, R.E.; Scott, M.G. The Role of Antimicrobial Peptides in Animal Defenses. Proc. Natl. Acad. Sci. USA 2000, 97, 8856–8861. [Google Scholar] [CrossRef] [Green Version]
  7. Spohn, R.; Daruka, L.; Lázár, V.; Martins, A.; Vidovics, F.; Grézal, G.; Méhi, O.; Kintses, B.; Számel, M.; Jangir, P.K.; et al. Integrated Evolutionary Analysis Reveals Antimicrobial Peptides with Limited Resistance. Nat. Commun. 2019, 10, 1–13. [Google Scholar] [CrossRef]
  8. Epand, R.F.; Mor, A.; Epand, R.M. Lipid Complexes with Cationic Peptides and OAKs; Their Role in Antimicrobial Action and in the Delivery of Antimicrobial Agents. Cell. Mol. Life Sci. 2011, 68, 2177–2188. [Google Scholar] [CrossRef]
  9. Epand, R.M.; Epand, R.F.; Arnusch, C.J.; Papahadjopoulos-Sternberg, B.; Wang, G.; Shai, Y. Lipid Clustering by Three Homologous Arginine-Rich Antimicrobial Peptides Is Insensitive to Amino Acid Arrangement and Induced Secondary Structure. Biochim. Biophys. Acta 2010, 1798, 1272–1280. [Google Scholar] [CrossRef] [Green Version]
  10. Shaw, J.E.; Epand, R.F.; Hsu, J.C.Y.; Mo, G.C.H.; Epand, R.M.; Yip, C.M. Cationic Peptide-Induced Remodelling of Model Membranes: Direct Visualization by in Situ Atomic Force Microscopy. J. Struct. Biol. 2008, 162, 121–138. [Google Scholar] [CrossRef]
  11. White, S.H.; Wimley, W.C. Hydrophobic Interactions of Peptides with Membrane Interfaces. Biochim. Biophys. Acta Rev. Biomembr. 1998, 1376, 339–352. [Google Scholar] [CrossRef] [Green Version]
  12. White, S.H.; Wimley, W.C. Membrane Protein Folding and Stability: Physical Principles. Annu. Rev. Biophys. Biomol. Struct. 1999, 28, 319–365. [Google Scholar] [CrossRef]
  13. Lee, T.-H.; Hall, K.N.; Aguilar, M.-I. Antimicrobial Peptide Structure and Mechanism of Action: A Focus on the Role of Membrane Structure. Curr. Top. Med. Chem. 2015, 16, 25–39. [Google Scholar] [CrossRef]
  14. Haney, E.F.; Mansour, S.C.; Hancock, R.E.W. Antimicrobial Peptides: Methods and Protocols; Hansen, P.R., Ed.; Springer Science+Business Media LLC: Berlin, Germany, 2017; Volume 1548. [Google Scholar]
  15. Taylor, K.; Barran, P.E.; Dorin, J.R. Structure-Activity Relationships in Β-Defensin Peptides. Pept. Sci. 2008, 90, 1–7. [Google Scholar] [CrossRef] [Green Version]
  16. Papo, N.; Shai, Y. Can We Predict Biological Activity of Antimicrobial Peptides from Their Interactions with Model Phospholipid Membranes? Peptides 2003, 24, 1693–1703. [Google Scholar] [CrossRef]
  17. Wimley, W.C. Describing the Mechanism of Antimicrobial Peptide Action with the Interfacial Activity Model. ACS Chem. Biol. 2010, 5, 905–917. [Google Scholar] [CrossRef] [Green Version]
  18. Lavergne, V.; Taft, R.J.; Alewood, P.F. Cysteine-Rich Mini-Proteins in Human Biology. Curr. Top. Med. Chem. 2012, 12, 1514–1533. [Google Scholar] [CrossRef]
  19. Zhu, S.; Gao, B. Evolutionary Origin of β-Defensins. Dev. Comp. Immunol. 2012, 39, 79–84. [Google Scholar] [CrossRef]
  20. Monincová, L.; Buděšínský, M.; Čujová, S.; Čeřovský, V.; Veverka, V. Structural Basis for Antimicrobial Activity of Lasiocepsin. ChemBioChem 2014, 15, 301–308. [Google Scholar] [CrossRef]
  21. Castaneda, O.; Sotolongo, V.; Amor, A.M.; Stocklin, R.; Anderson, A.J.; Harvey, A.L.; Engstrom, A.; Wernstedt, C.; Karlsson, E. Characterization of a Potassium Channel Toxin from the Caribbean Sea Anemone Stichodactyla Helianthus. Toxicon 1995, 33, 603–613. [Google Scholar] [CrossRef]
  22. Tudor, J.E.; Pallaghy, P.K.; Pennington, M.W.; Norton, R.S. Solution Structure of ShK Toxin, a Novel Potassium Channel Inhibitor from a Sea Anemone. Nat. Struct. Biol. 1996, 3, 317–320. [Google Scholar] [CrossRef]
  23. Zhang, L.; Chou, C.P.; Moo-Young, M. Disulfide Bond Formation and Its Impact on the Biological Activity and Stability of Recombinant Therapeutic Proteins Produced by Escherichia Coli Expression System. Biotechnol. Adv. 2011, 29, 923–929. [Google Scholar] [CrossRef]
  24. Berova, N.; Polavarapu, P.L.; Nakanishi, K.; Woody, R.W. (Eds.) Comprehensive Chiroptical Spectroscopy Applications in Stereochemical Analysis of Synthetic Compounds, Natural Products and Biomolecules; John Wiley & Sons: Hoboken, NJ, USA, 2012. [Google Scholar]
  25. Nafie, L.A. Vibrational Optical Activity: Principles and Applications; John Wiley & Sons: Chichester, UK, 2011. [Google Scholar]
  26. Barron, L. The Development of Biomolecular Raman Optical Activity Spectroscopy. Biomed. Spectrosc. Imaging 2015, 4, 223–253. [Google Scholar] [CrossRef] [Green Version]
  27. Blondelle, S.E.; Lohner, K.; Aguilar, M.I. Lipid-Induced Conformation and Lipid-Binding Properties of Cytolytic and Antimicrobial Peptides: Determination and Biological Speci¢city. Biochim. Biophys. Acta 1999, 1462, 89–108. [Google Scholar] [CrossRef] [Green Version]
  28. Shanmugam, G.; Polavarapu, P.L.; Gopinath, D.; Jayakumar, R. The Structure of Antimicrobial Pexiganan Peptide in Solution Probed by Fourier Transform Infrared Absorption, Vibrational Circular Dichroism, and Electronic Circular Dichroism Spectroscopy. Biopolym. Pept. Sci. Sect. 2005, 80, 636–642. [Google Scholar] [CrossRef]
  29. Novotná, P.; Urbanová, M. Vibrational Circular Dichroism Study of Polypeptide Model-Membrane Systems. Anal. Biochem. 2012, 427, 211–218. [Google Scholar] [CrossRef]
  30. Kocourková, L.; Novotná, P.; Čujová, S.; Čeřovský, V.; Urbanová, M.; Setnička, V. Conformational Study of Melectin and Antapin Antimicrobial Peptides in Model Membrane Environments. Spectrochim. Acta Part A Mol. Biomol. Spectrosc. 2017, 170, 247–255. [Google Scholar] [CrossRef]
  31. Mijiddorj, B.; Kaneda, S.; Sato, H.; Kitahashi, Y.; Javkhlantugs, N.; Naito, A.; Ueda, K.; Kawamura, I. The Role of D-Allo-Isoleucine in the Deposition of the Anti-Leishmania Peptide Bombinin H4 as Revealed by 31P Solid-State NMR, VCD Spectroscopy, and MD Simulation. Biochim. Biophys. Acta Proteins Proteomics 2018, 1866, 789–798. [Google Scholar] [CrossRef] [Green Version]
  32. Pazderková, M.; Maloň, P.; Zíma, V.; Hofbauerová, K.; Kopecký, V.J.; Kočišová, E.; Pazderka, T.; Čeřovský, V.; Bednárová, L. Interaction of Halictine-Related Antimicrobial Peptides with Membrane Models. Int. J. Mol. Sci. 2019, 20, 631. [Google Scholar] [CrossRef] [Green Version]
  33. Keiderling, T.A. Structure of Condensed Phase Peptides: Insights from Vibrational Circular Dichroism and Raman Optical Activity Techniques. Chem. Rev. 2020, 120, 3381–3419. [Google Scholar] [CrossRef]
  34. Barth, A.; Zscherp, C. What Vibrations Tell Us about Proteins. Q. Rev. Biophys. 2002, 35, 369–430. [Google Scholar] [CrossRef]
  35. Keiderling, T.A. Protein and Peptide Secondary Structure and Conformational Determination with Vibrational Circular Dichroism. Curr. Opin. Chem. Biol. 2002, 6, 682–688. [Google Scholar] [CrossRef]
  36. Ma, S.; Freedman, T.B.; Dukor, R.K.; Nafie, L.A. Near-Infrared and Mid-Infrared Fourier Transform Vibrational Circular Dichroism of Proteins in Aqueous Solution. Appl. Spectrosc. 2010, 64, 615–626. [Google Scholar] [CrossRef]
  37. Dukor, R.K.; Keiderling, T.A. Reassessment of the Random Coil Conformation: Vibrational CD Study of Proline Oligopeptides and Related Polypeptides. Biopolymers 1991, 31, 1747–1761. [Google Scholar] [CrossRef]
  38. Bochicchio, B.; Tamburro, A.M. Polyproline II Structure in Proteins: Identification by Chiroptical Spectroscopies, Stability, and Functions. Chirality 2002, 14, 782–792. [Google Scholar] [CrossRef]
  39. Havel, H.A. Spectroscopic Methods for Determining Protein Structure in Solution; VCH Publishers, Inc.: New York, NY, USA, 1996. [Google Scholar]
  40. Zhu, F.J.; Isaacs, N.W.; Hecht, L.; Barron, L.D. Raman Optical Activity: A Tool for Protein Structure Analysis. Structure 2005, 13, 1409–1419. [Google Scholar] [CrossRef]
  41. Kapitán, J.; Baumruk, V.; Kopecký, V.J.; Bouř, P. Conformational Flexibility of L-Alanine Zwitterion Determines Shapes of Raman and Raman Optical Activity Spectral Bands. J. Phys. Chem. A 2006, 110, 4689–4696. [Google Scholar] [CrossRef] [Green Version]
  42. Bednárová, L.; Bouř, P.; Maloň, P. Vibrational and Electronic Optical Activity of the Chiral Disulphide Group: Implications for Disulphide Bridge Conformation. Chirality 2010, 22, 514–526. [Google Scholar] [CrossRef]
  43. Maloň, P.; Bednárová, L.; Straka, M.; Krejčí, L.; Kumprecht, L.; Kraus, T.; Kubáňová, M.; Baumruk, V. Disulfide Chromophore and Its Optical Activity. Chirality 2010, 22, E47–E55. [Google Scholar] [CrossRef]
  44. Pazderková, M.; Bednárová, L.; Dlouhá, H.; Flegel, M.; Lebl, M.; Hlaváček, J.; Setnička, V.; Urbanová, M.; Hynie, S.; Klenerová, V.; et al. Electronic and Vibrational Optical Activity of Several Peptides Related to Neurohypophyseal Hormones: Disulfide Group Conformation. Biopolymers 2012, 97, 923–932. [Google Scholar] [CrossRef]
  45. Tanford, C. The Hydrophobic Effect: Formation of Micelles and Biological Membranes; Wiley-Interscience: New York, NY, USA, 1980. [Google Scholar]
  46. Andrushchenko, V.V.; Vogel, H.J.; Prenner, E.J. Optimization of the Hydrochloric Acid Concentration Used for Trifluoroacetate Removal from Synthetic Peptides. J. Pept. Sci. 2007, 13, 37–43. [Google Scholar] [CrossRef]
  47. Sreerama, N.; Woody, R.W. Estimation of Protein Secondary Structure from Circular Dichroism Spectra: Comparison of CONTIN, SELCON, and CDSSTR Methods with an Expanded Reference Set. Anal. Biochem. 2000, 287, 252–260. [Google Scholar] [CrossRef]
  48. Provencher, S.W.; Glöckner, J. Estimation of Globular Protein Secondary Structure from Circular Dichroism. Biochemistry 1981, 20, 33–37. [Google Scholar] [CrossRef] [PubMed]
  49. Provencher, S.W. A Constrained Regularization Method for Inverting Data Represented by Linear Algebraic or Integral Equations. Comp. Phys. Com. 1982, 27, 213–227. [Google Scholar] [CrossRef]
  50. Greenfield, N.J. Methods to Estimate the Conformation of Proteins and Polypeptides from Circular Dichroism Data. Anal. Biochem. 1996, 235, 1–10. [Google Scholar] [CrossRef]
  51. Whitmore, L.; Wallace, B.A. DICHROWEB, an Online Server for Protein Secondary Structure Analyses from Circular Dichroism Spectroscopic Data. Nucleic Acids Res. 2004, 32, 668–673. [Google Scholar] [CrossRef] [Green Version]
  52. Nafie, L.A.; Buijs, H.; Rilling, A.; Cao, X.; Dukor, R.K. Dual Source Fourier Transform Polarization Modulation Spectroscopy: An Improved Method for the Measurement of Circular and Linear Dichroism. Appl. Spectrosc. 2004, 58, 647–654. [Google Scholar] [CrossRef]
  53. Nafie, L.A. Dual Polarization Modulation: Real-Time, Spectral Multiplex Separation of Circular Dichroism from Linear Birefringence Spectral Intensities. Appl. Spectrosc. 2000, 54, 1634–1645. [Google Scholar] [CrossRef]
  54. Drake, A.F.; Siligardi, G.; Gibbons, W.A. Reassessment of the Electronic Circular Dichroism Criteria for Random Coil Conformations of Poly(L-Lysine) and the Implications for Protein Folding and Denaturation Studies. Biophys. Chem. 1988, 31, 143–146. [Google Scholar] [CrossRef]
  55. Shi, Z.; Olson, C.A.; Rose, G.D.; Baldwin, R.L.; Kallenbach, N.R. Polyproline II Structure in a Sequence of Seven Alanine Residues. Proc. Natl. Acad. Sci. USA 2002, 99, 9190–9195. [Google Scholar] [CrossRef] [Green Version]
  56. Bergson, G. Molecular Orbital Treatment of the 3para-Alpha-Interaction in Five-Membered Cyclic Disulphides. Ark. Kemi 1958, 12, 233–237. [Google Scholar]
  57. Bergson, G. A Semi-Empirical Study of Interaction between Lone-Pair Electrons with Special Reference to Problem of Hybridization and Theory of Restricted Rotation About Single Bonds—Applications to Structure and Reactivity of Sulphur Chains. Ark. Kemi 1962, 18, 409–434. [Google Scholar]
  58. Linderberg, J.; Michl, J. On Inherent Optical Activity of Organic Disulfides. J. Am. Chem. Soc. 1970, 92, 2619–2625. [Google Scholar] [CrossRef]
  59. Barth, A. Infrared Spectroscopy of Proteins. Biochim. Biophys. Acta 2007, 1767, 1073–1101. [Google Scholar] [CrossRef] [Green Version]
  60. Barth, A.; Haris, P.I. Biological and Biomedical Infrared Spectroscopy; Haris, P.I., Ed.; IOS Press: Amsterdam, The Netherlands, 2009; Volume 2. [Google Scholar]
  61. Ma, S.; Cao, X.; Mak, M.; Sadik, A.; Walkner, C.; Freedman, T.B.; Lednev, I.K.; Dukor, R.K.; Nafie, L.A. Vibrational Circular Dichroism Shows Unusual Sensitivity to Protein Fibril Formation and Development in Solution. J. Am. Chem. Soc. 2007, 129, 12364–12365. [Google Scholar] [CrossRef]
  62. Kurouski, D.; Dukor, R.K.; Lu, X.; Nafie, L.A.; Lednev, I.K. Normal and Reversed Supramolecular Chirality of Insulin Fibrils Probed by Vibrational Circular Dichroism at the Protofilament Level of Fibril Structure. Biophys. J. 2012, 103, 522–531. [Google Scholar] [CrossRef] [Green Version]
  63. Kurouski, D.; Lu, X.; Popova, L.; Wan, W.; Shanmugasundaram, M.; Stubbs, G.; Dukor, R.K.; Lednev, I.K.; Nafie, L.A. Is Supramolecular Filament Chirality the Underlying Cause of Major Morphology Differences in Amyloid Fibrils? J. Am. Chem. Soc. 2014, 136, 2302–2312. [Google Scholar] [CrossRef]
  64. McColl, I.H.; Blanch, E.W.; Gill, A.C.; Rhie, A.G.; Ritchie, M.A.; Hecht, L.; Nielsen, K.; Barron, L.D. A New Perspective on Beta-Sheet Structures Using Vibrational Raman Optical Activity: From Poly(L-Lysine) to the Prion Protein. J. Am. Chem. Soc. 2003, 125, 10019–10026. [Google Scholar] [CrossRef]
  65. Barron, L.D.; Hecht, L.; Blanch, E.W.; Bell, A.F. Solution Structure and Dynamics of Biomolecules from Raman Optical Activity. Prog. Biophys. Mol. Biol. 2000, 73, 1–49. [Google Scholar] [CrossRef]
  66. Zhu, F.; Tranter, G.E.; Isaacs, N.W.; Hecht, L.; Barron, L.D. Delineation of Protein Structure Classes from Multivariate Analysis of Protein Raman Optical Activity Data. J. Mol. Biol. 2006, 363, 19–26. [Google Scholar] [CrossRef]
  67. Qian, W.; Zhao, W.; Krimm, S. Vibrational Studies of the Disulfied Group in Proteins Part IV. SS and CS Stretch Frequencies of Known Peptide and Protein Disulfide Bridges. J. Mol. Struct. 1991, 250, 89–102. [Google Scholar] [CrossRef] [Green Version]
  68. Kapitán, J.; Baumruk, V.; Hulačová, H.; Maloň, P. Raman Optical Activity of the Hinge Peptide. Vib. Spectrosc. 2006, 42, 88–92. [Google Scholar] [CrossRef]
  69. Buck, M. Trifluoroethanol and Colleagues: Cosolvents Come of Age. Recent Studies with Peptides and Proteins. Q. Rev. Biophys. 1998, 31, 297–355. [Google Scholar] [CrossRef]
  70. McColl, I.H.; Blanch, E.W.; Hecht, L.; Barron, L.D. A Study of Alpha-Helix Hydration in Polypeptides, Proteins, and Viruses Using Vibrational Raman Optical Activity. J. Am. Chem. Soc. 2004, 126, 8181–8188. [Google Scholar] [CrossRef]
  71. Schweitzer-Stenner, R. Conformational Propensities and Residual Structures in Unfolded Peptides and Proteins. Mol. Biosyst. 2012, 8, 122–133. [Google Scholar] [CrossRef]
  72. Woody, R.W. Application of the Bergson Model to the Optical Properties of Chiral Disulfides. Tetrahedron 1973, 29, 1273–1283. [Google Scholar] [CrossRef]
Figure 1. NMR structure of I (PDB ID: 2mbd).
Symmetry 12 00812 g001
Figure 2. Electronic circular dichroism (ECD) spectra of I–IV in H2O measured in amide region.
Symmetry 12 00812 g002
Figure 3. ECD spectra of I–IV in the region of disulfide transitions measured in H2O.
Symmetry 12 00812 g003
Figure 4. Infrared (IR, left) and vibrational circular dichroism (VCD, right) spectra of IIV measured in H2O.
Symmetry 12 00812 g004
Figure 5. Raman (left) and Raman optical activity (ROA, right) spectra of IIV measured in H2O.
Symmetry 12 00812 g005
Figure 6. ECD spectra of I–IV measured in 0%–50% (v/v) TFE.
Symmetry 12 00812 g006
Figure 7. ECD spectra of I–IV measured in 0–16 mM SDS.
Symmetry 12 00812 g007
Figure 8. ECD spectra of I–IV measured 100 mM SDS (solid line) in the disulfide transition region. ECD spectra of I–IV measured in H2O (dashed line) are included for comparison.
Symmetry 12 00812 g008
Figure 9. IR (left) and VCD (right) spectra of IIV in the presence of 100 mM SDS.
Symmetry 12 00812 g009
Figure 10. Raman (left) and ROA (right) spectra of I–IV measured in the presence of SDS micelles (100 mM SDS).
Symmetry 12 00812 g010
Table 1. Structure and antimicrobial activities * of lasiocepsin (I) and its three analogs (IIIV).
ILasiocepsin AnalogsAntimicrobial Activity
MIC (μM)
(mg/mL)
B.s.S.a.E.c.P.a.C.a.
IGLPRKILCAIAKKKGKCKGPLKLVCKC0.4938.6153.6
0.0010.2690.0250.040.01
IIGLPRKILAAIAKKKGKCKGPLKLVAKC4.2>100>100>10050
0.012>0.283>0.283>0.2830.0141
IIIGLPRKILCAIAKKKGKAKGPLKLVCKA0.5>100556570
0.001>0.2830.1560.1840.0198
IVGLPRKILAAIAKKKGKAKGPLKLVAKA12>100>100>100>100
0.033>0.277>0.277>0.277>0.277
The pairs of connected Cys residues forming the S–S bridges are coded in red (CC) and green (CC), while the substituting Ala residues are shown in blue (A). B.s.Bacillus subtilis; S.a.Staphylococcus aureus; E.c.Escherichia coli; P.a.Pseudomonas aeruginosa; C.a.Candida albicans. * The haemolysis value at the highest concentration of the peptide tested (200 μM) was lower than 1%. Reproduced from the Reference [1].

