
Changes in Weather-Related Fatalities in the Czech Republic during the 1961–2020 Period

 , , ,
, , ,
Abstract
:1. Introduction
2. Materials and Methods
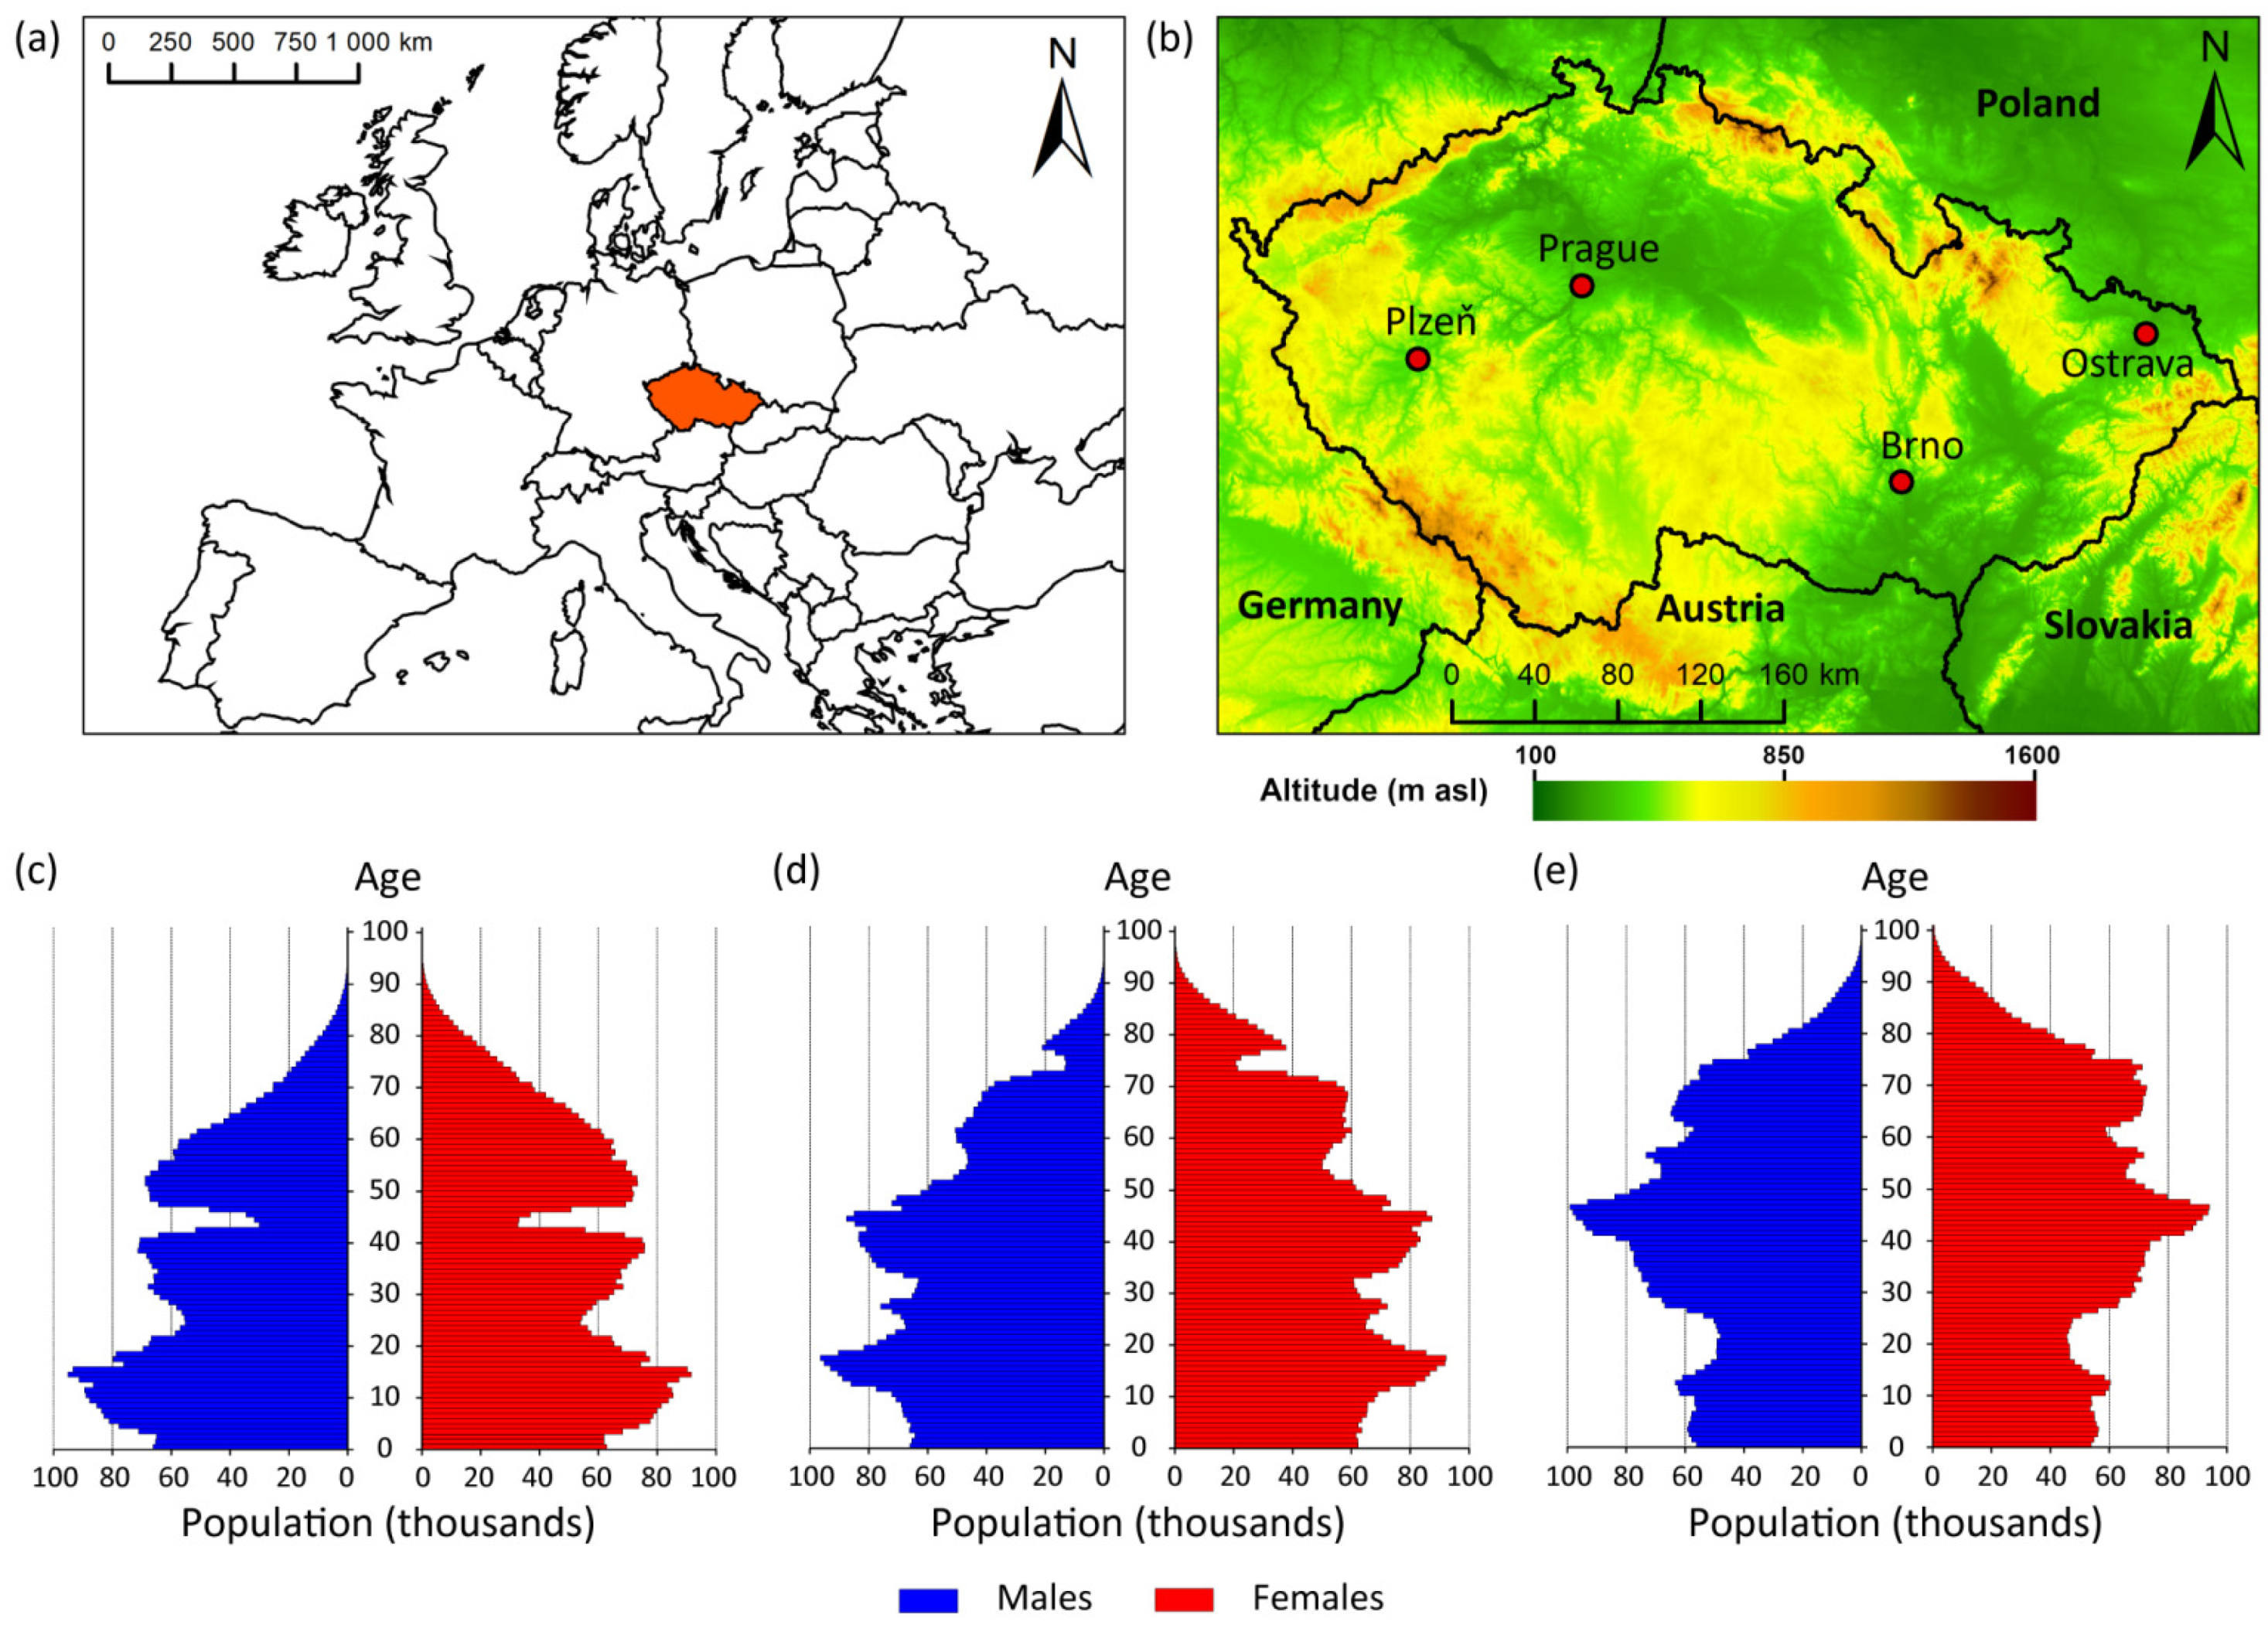
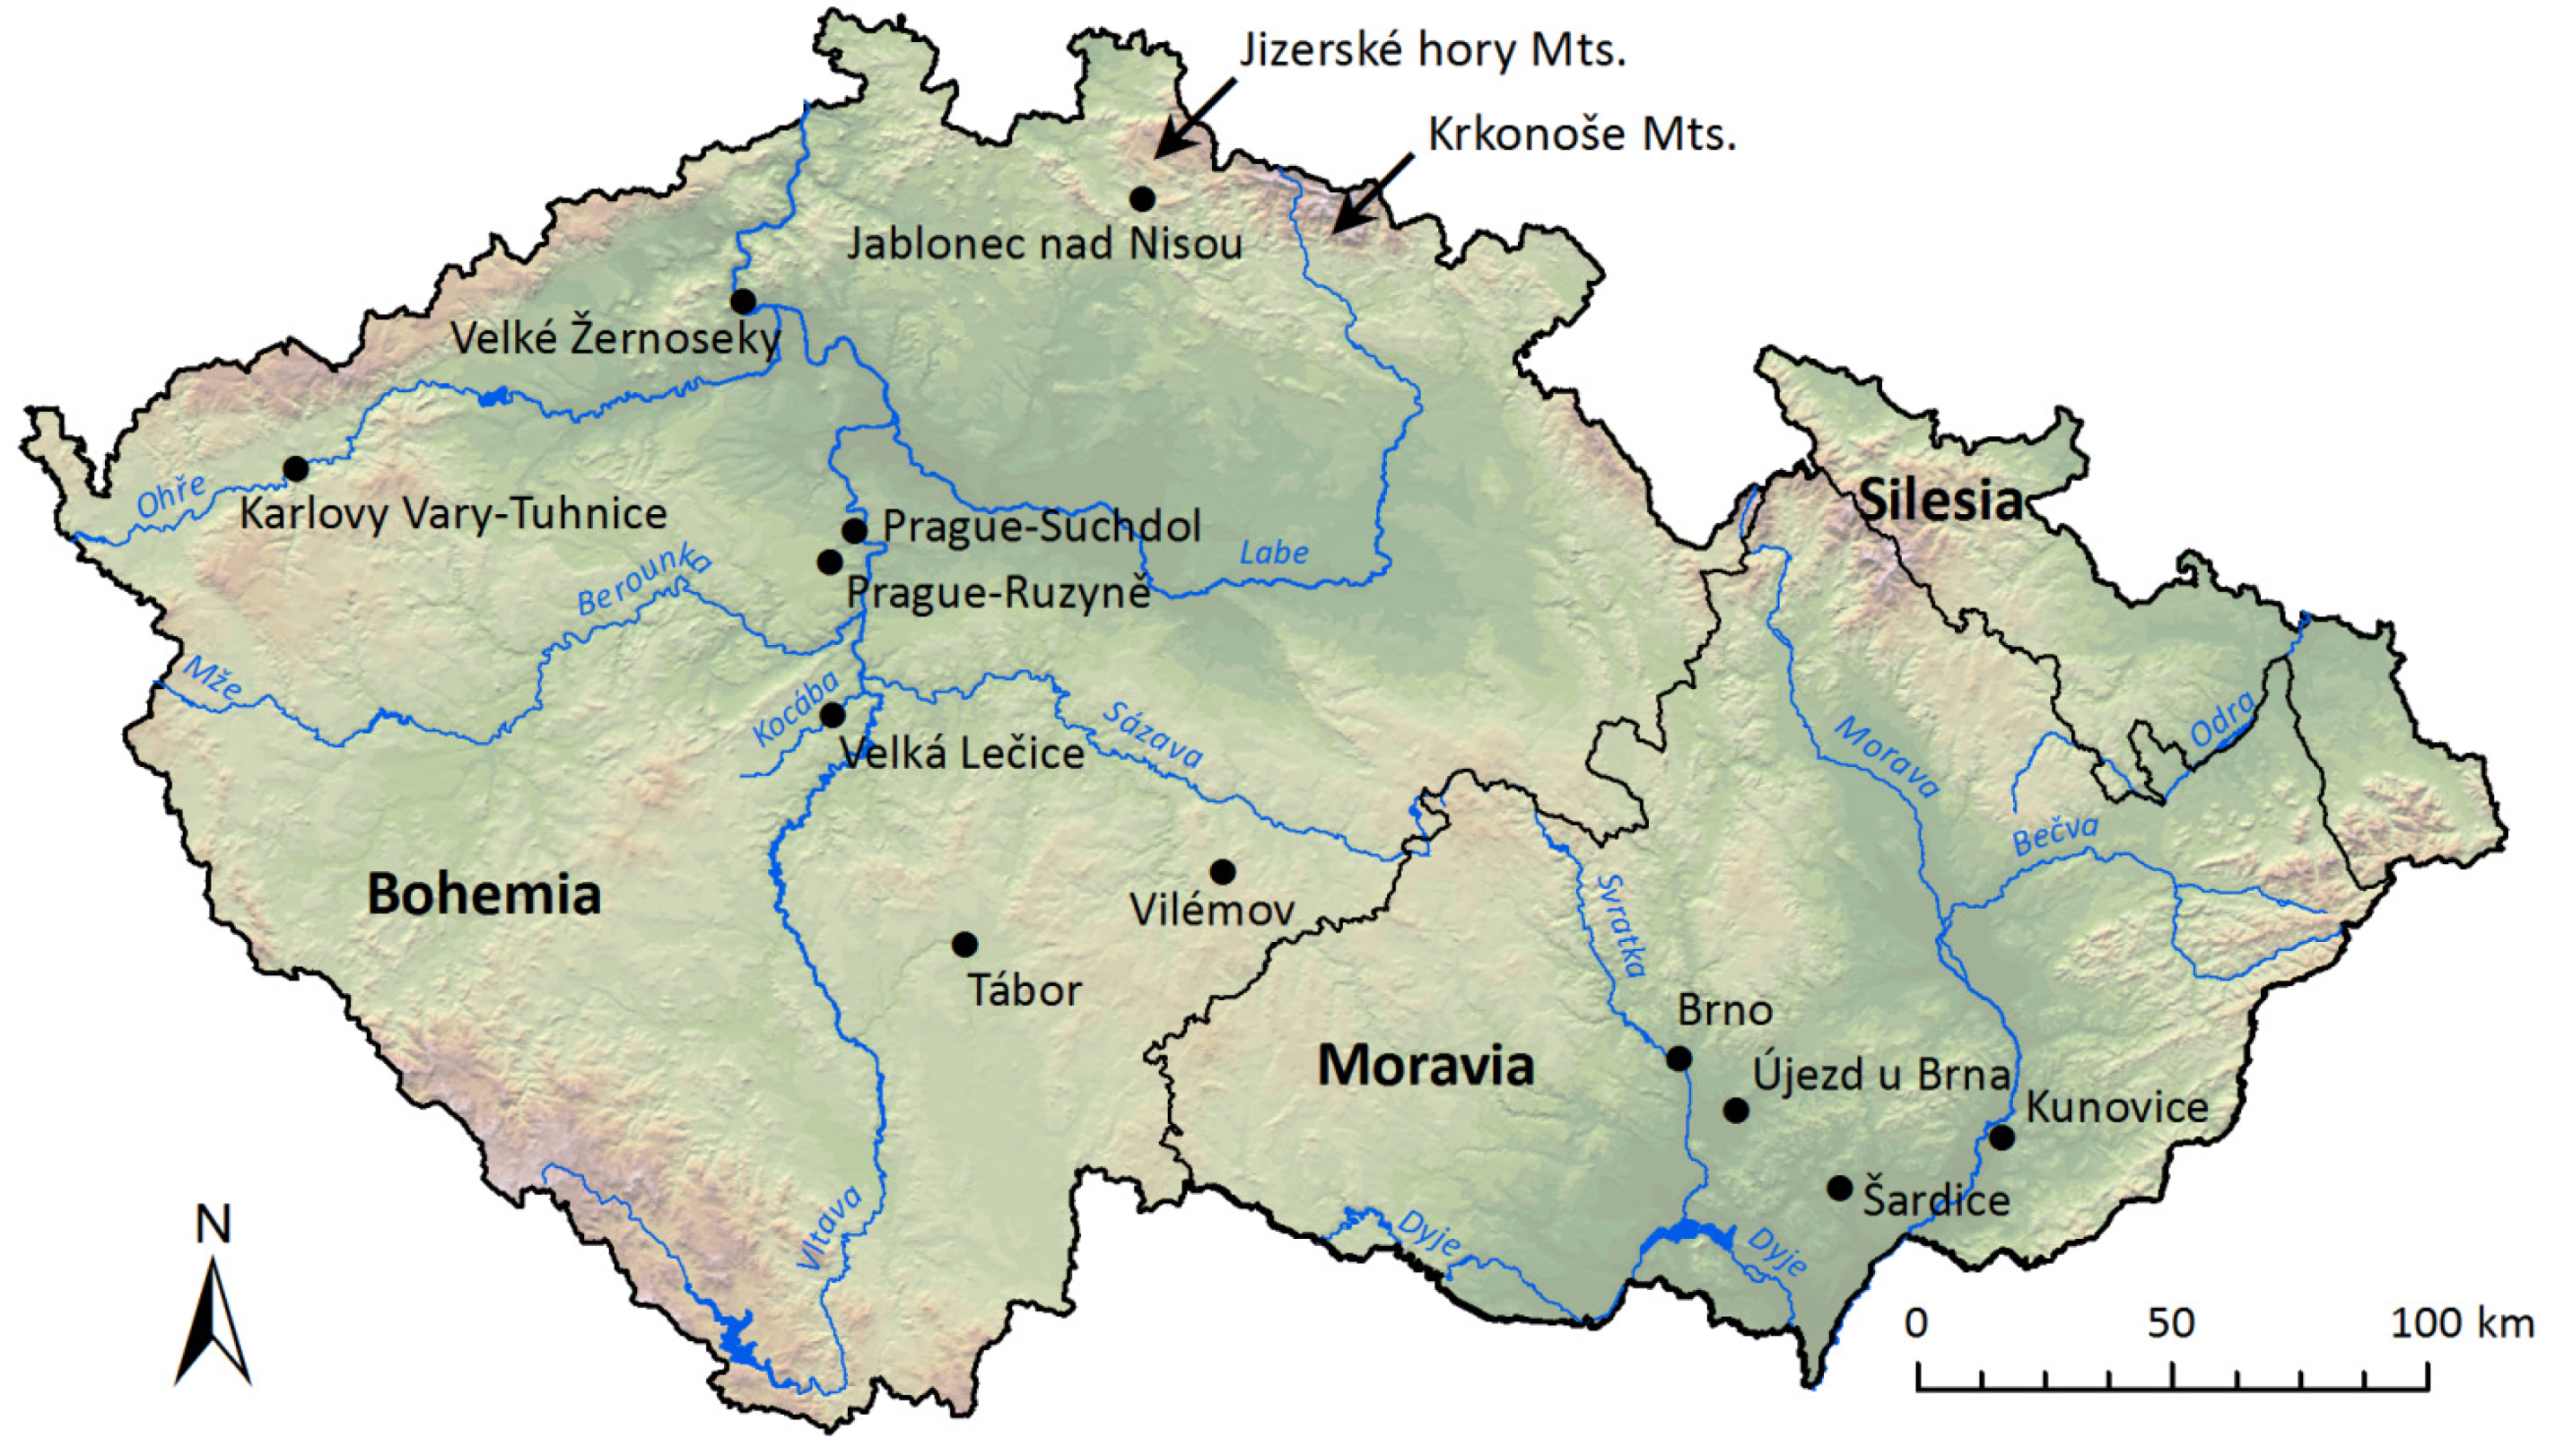
2.1. Basic Information about the Czech Republic
2.2. Fatality Data
2.3. Meteorological Data
- (i)
- Thunderstorm—72 stations;
- (ii)
- Daily wind gusts ≥20 m s−1—24 stations;
- (iii)
- Glaze ice—11 stations;
- (iv)
- Fog—6 stations;
- (v)
- Snowfall—625 stations;
- (vi)
- Snow cover depth ≥1, 3, 5, 10 and 15 cm—625 stations;
- (vii)
- Precipitation with daily totals ≥1.0 mm—531 stations;
- (viii)
- Frost days (TMIN < 0.0 °C), days with TMIN ≤ −5.0 °C and with TMIN ≤ −10.0 °C—133 stations.
2.4. Methods
2.4.1. Fatality Database
- (i)
- Date of the fatal accident or event;
- (ii)
- Locality (i.e., place of the fatal accident or event);
- (iii)
- Type of weather event (see below);
- (iv)
- Time (hour) of day (morning 0400–0800 Central European Time—CET, forenoon 0800–1200 CET, afternoon 1200–1800 CET, evening 1800–2200 CET, night 2200–0400 CET);
- (v)
- Name of the casualty;
- (vi)
- Gender (male, female);
- (vii)
- Age (exact age in years or estimated age: child 0–15 years, adult 16–65 years, elderly 66 years and more);
- (viii)
- Cause of death (drowning, falling tree/branch, vehicle accident, underlying health reason, freezing to death/hypothermia, lightning strike, other reason);
- (ix)
- Place of death (river/lake/reservoir/bank, within a building, road, open space in a built-up area, countryside, other places);
- (x)
- Type of fatality (direct, indirect);
- (xi)
- Behaviour of fatality (non-hazardous, hazardous);
- (xii)
- Source of information.
- (i)
- Floods
- (ii)
- Windstorms
- (iii)
- Convective storms
- (iv)
- Snow and glaze ice
- (v)
- Frost
- (vi)
- Fog
- (vii)
- Other weather phenomena
2.4.2. Statistical Analysis
3. Results
3.1. Fatalities Associated with Severe Weather
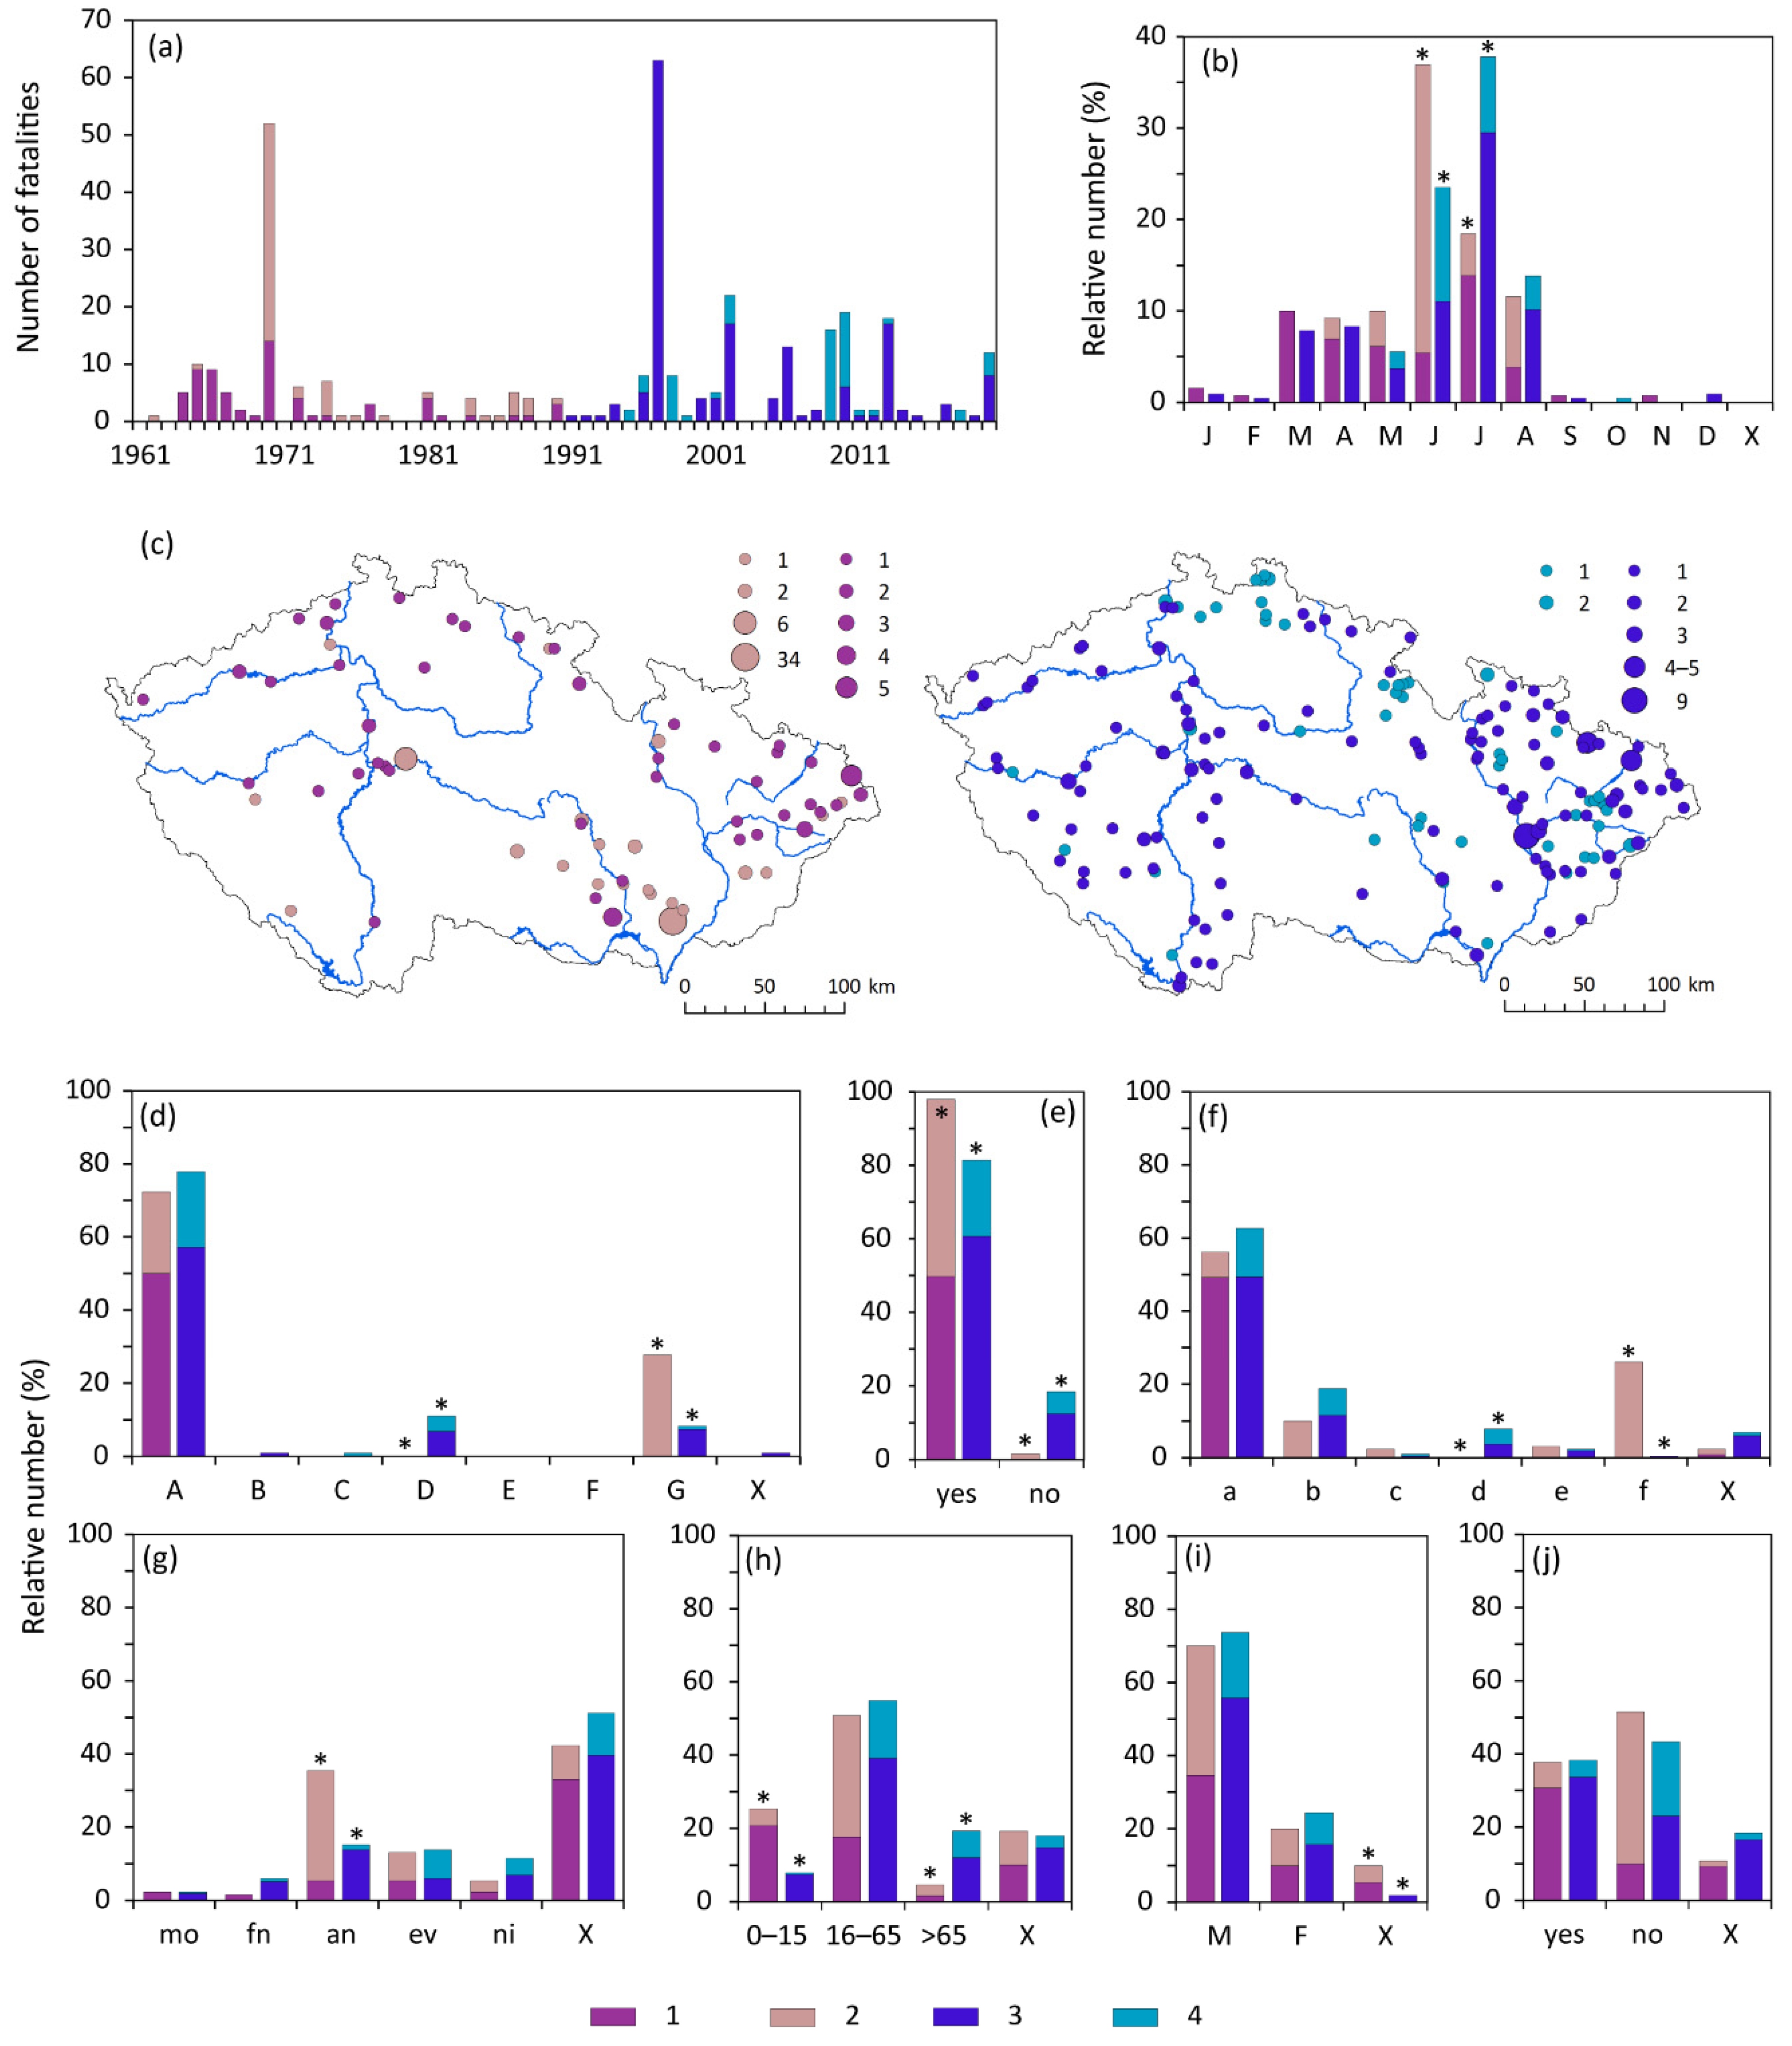
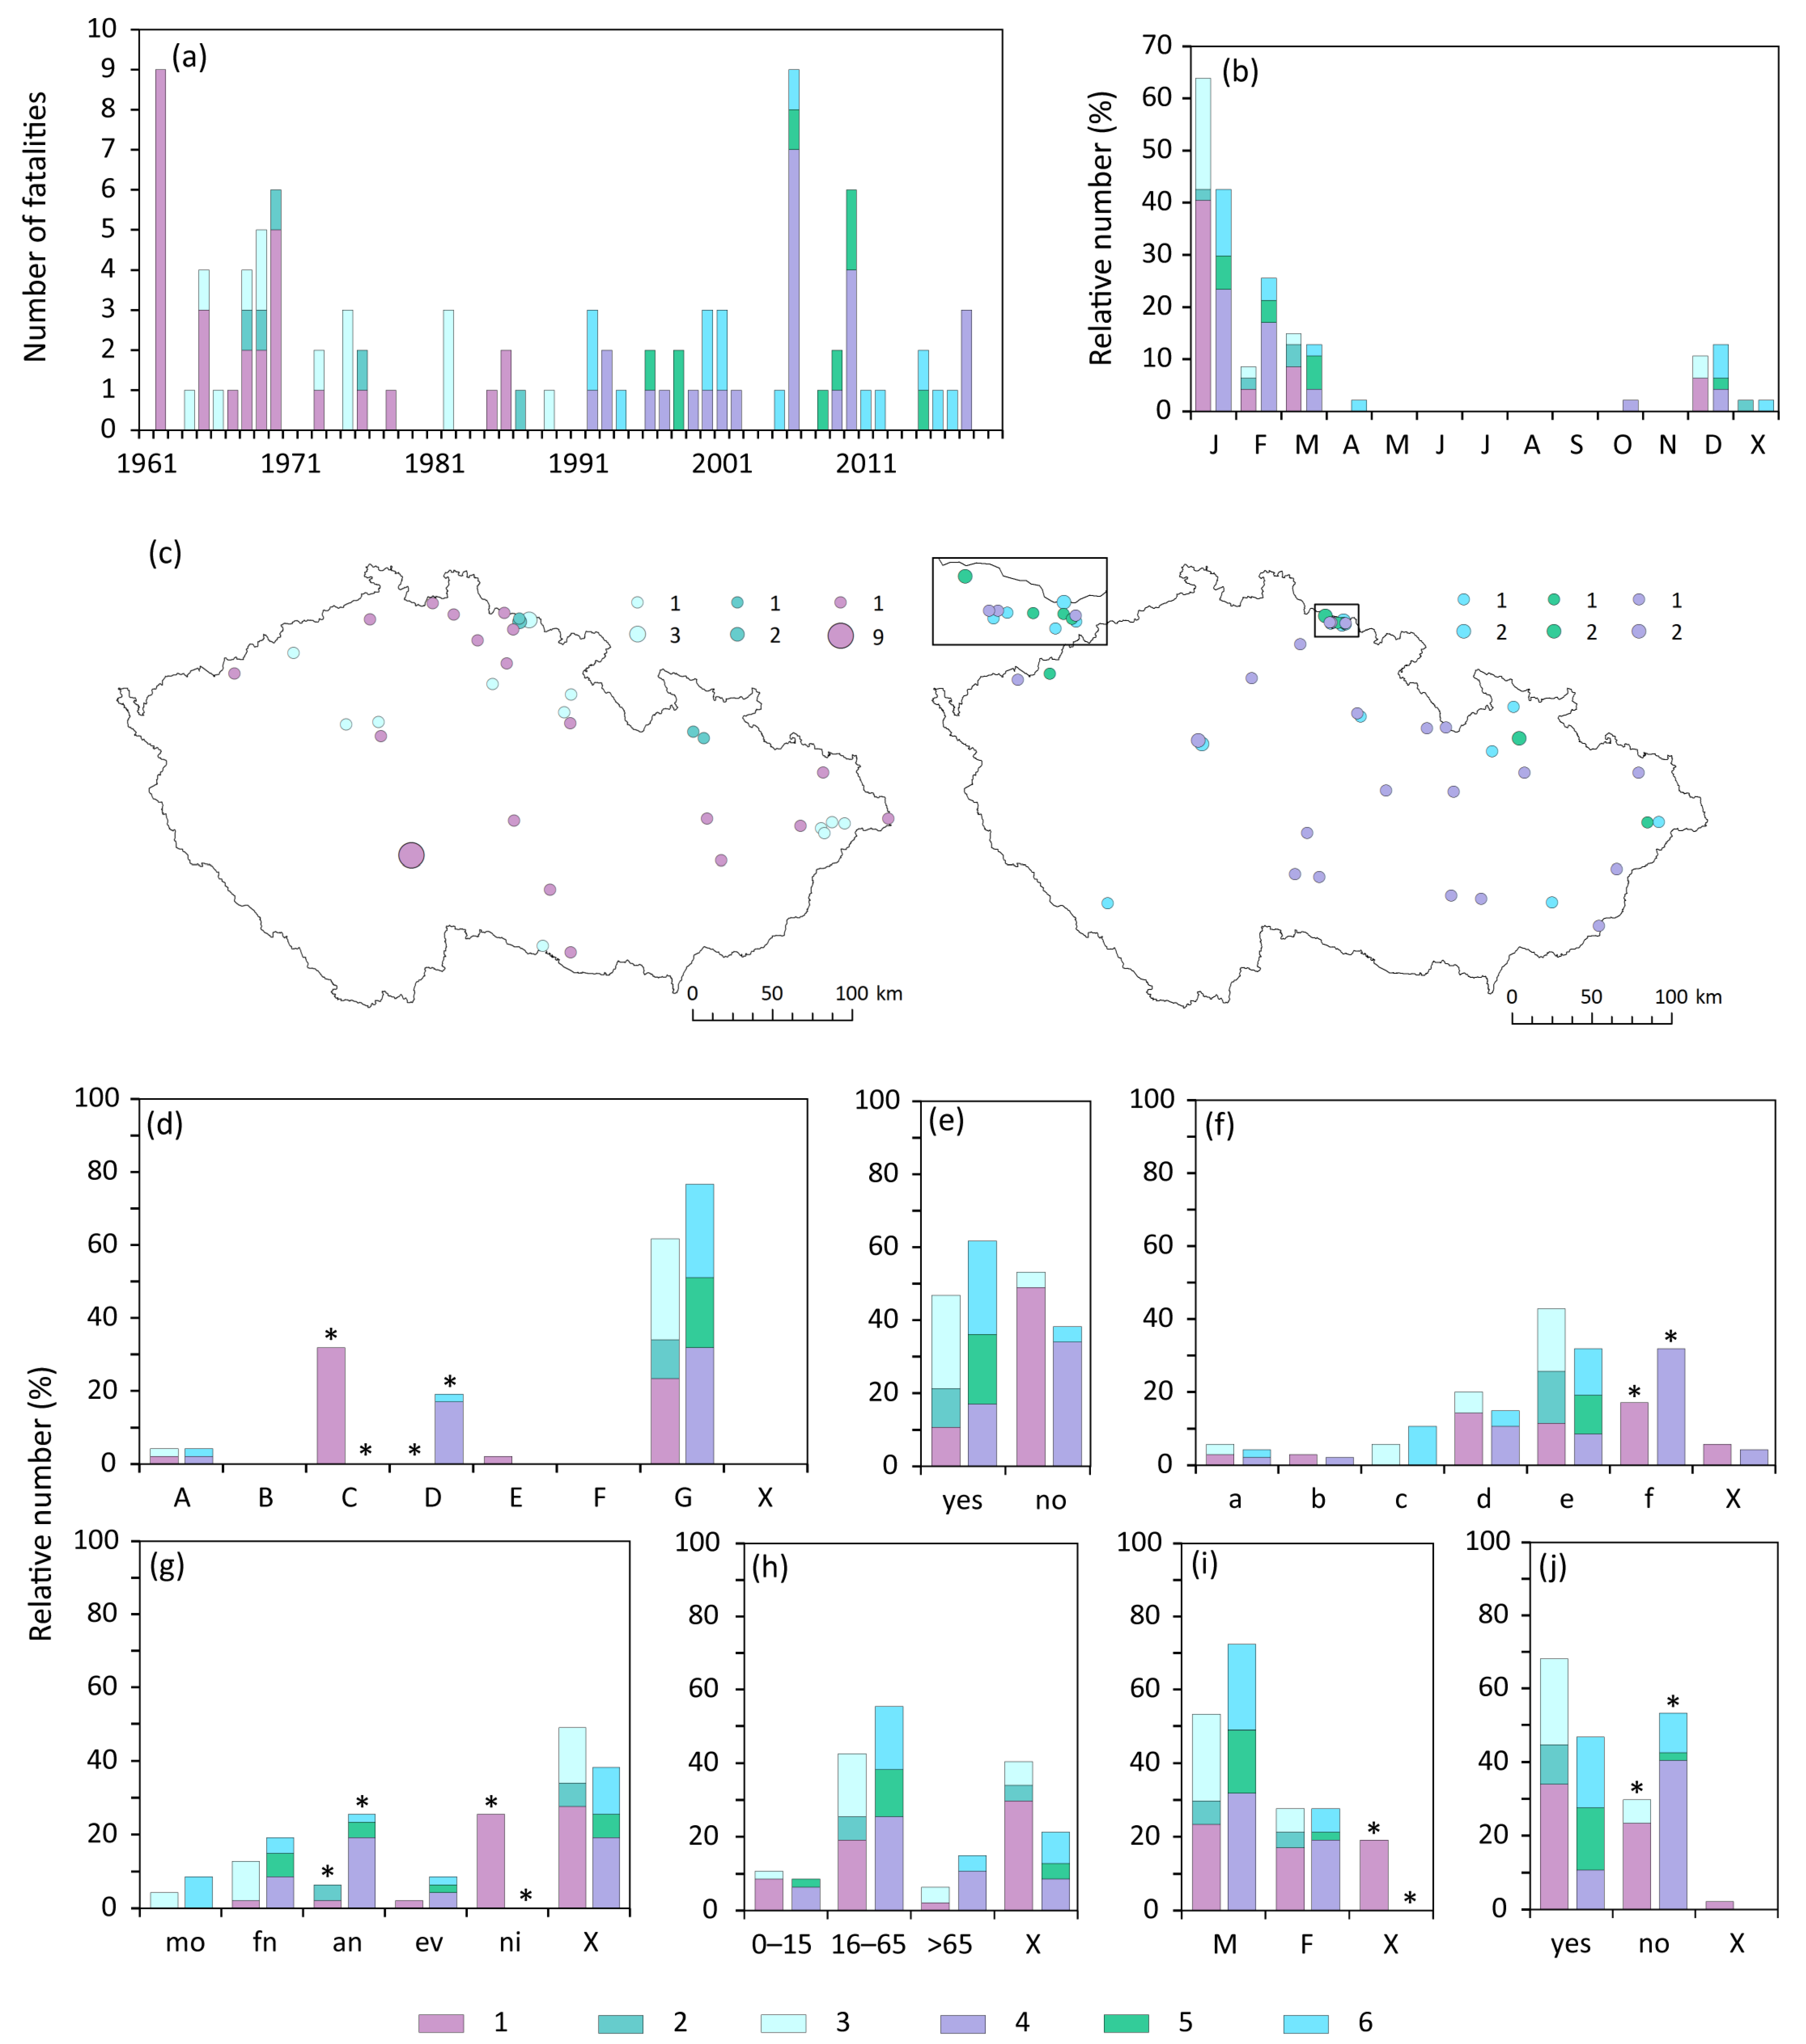
3.1.1. Floods
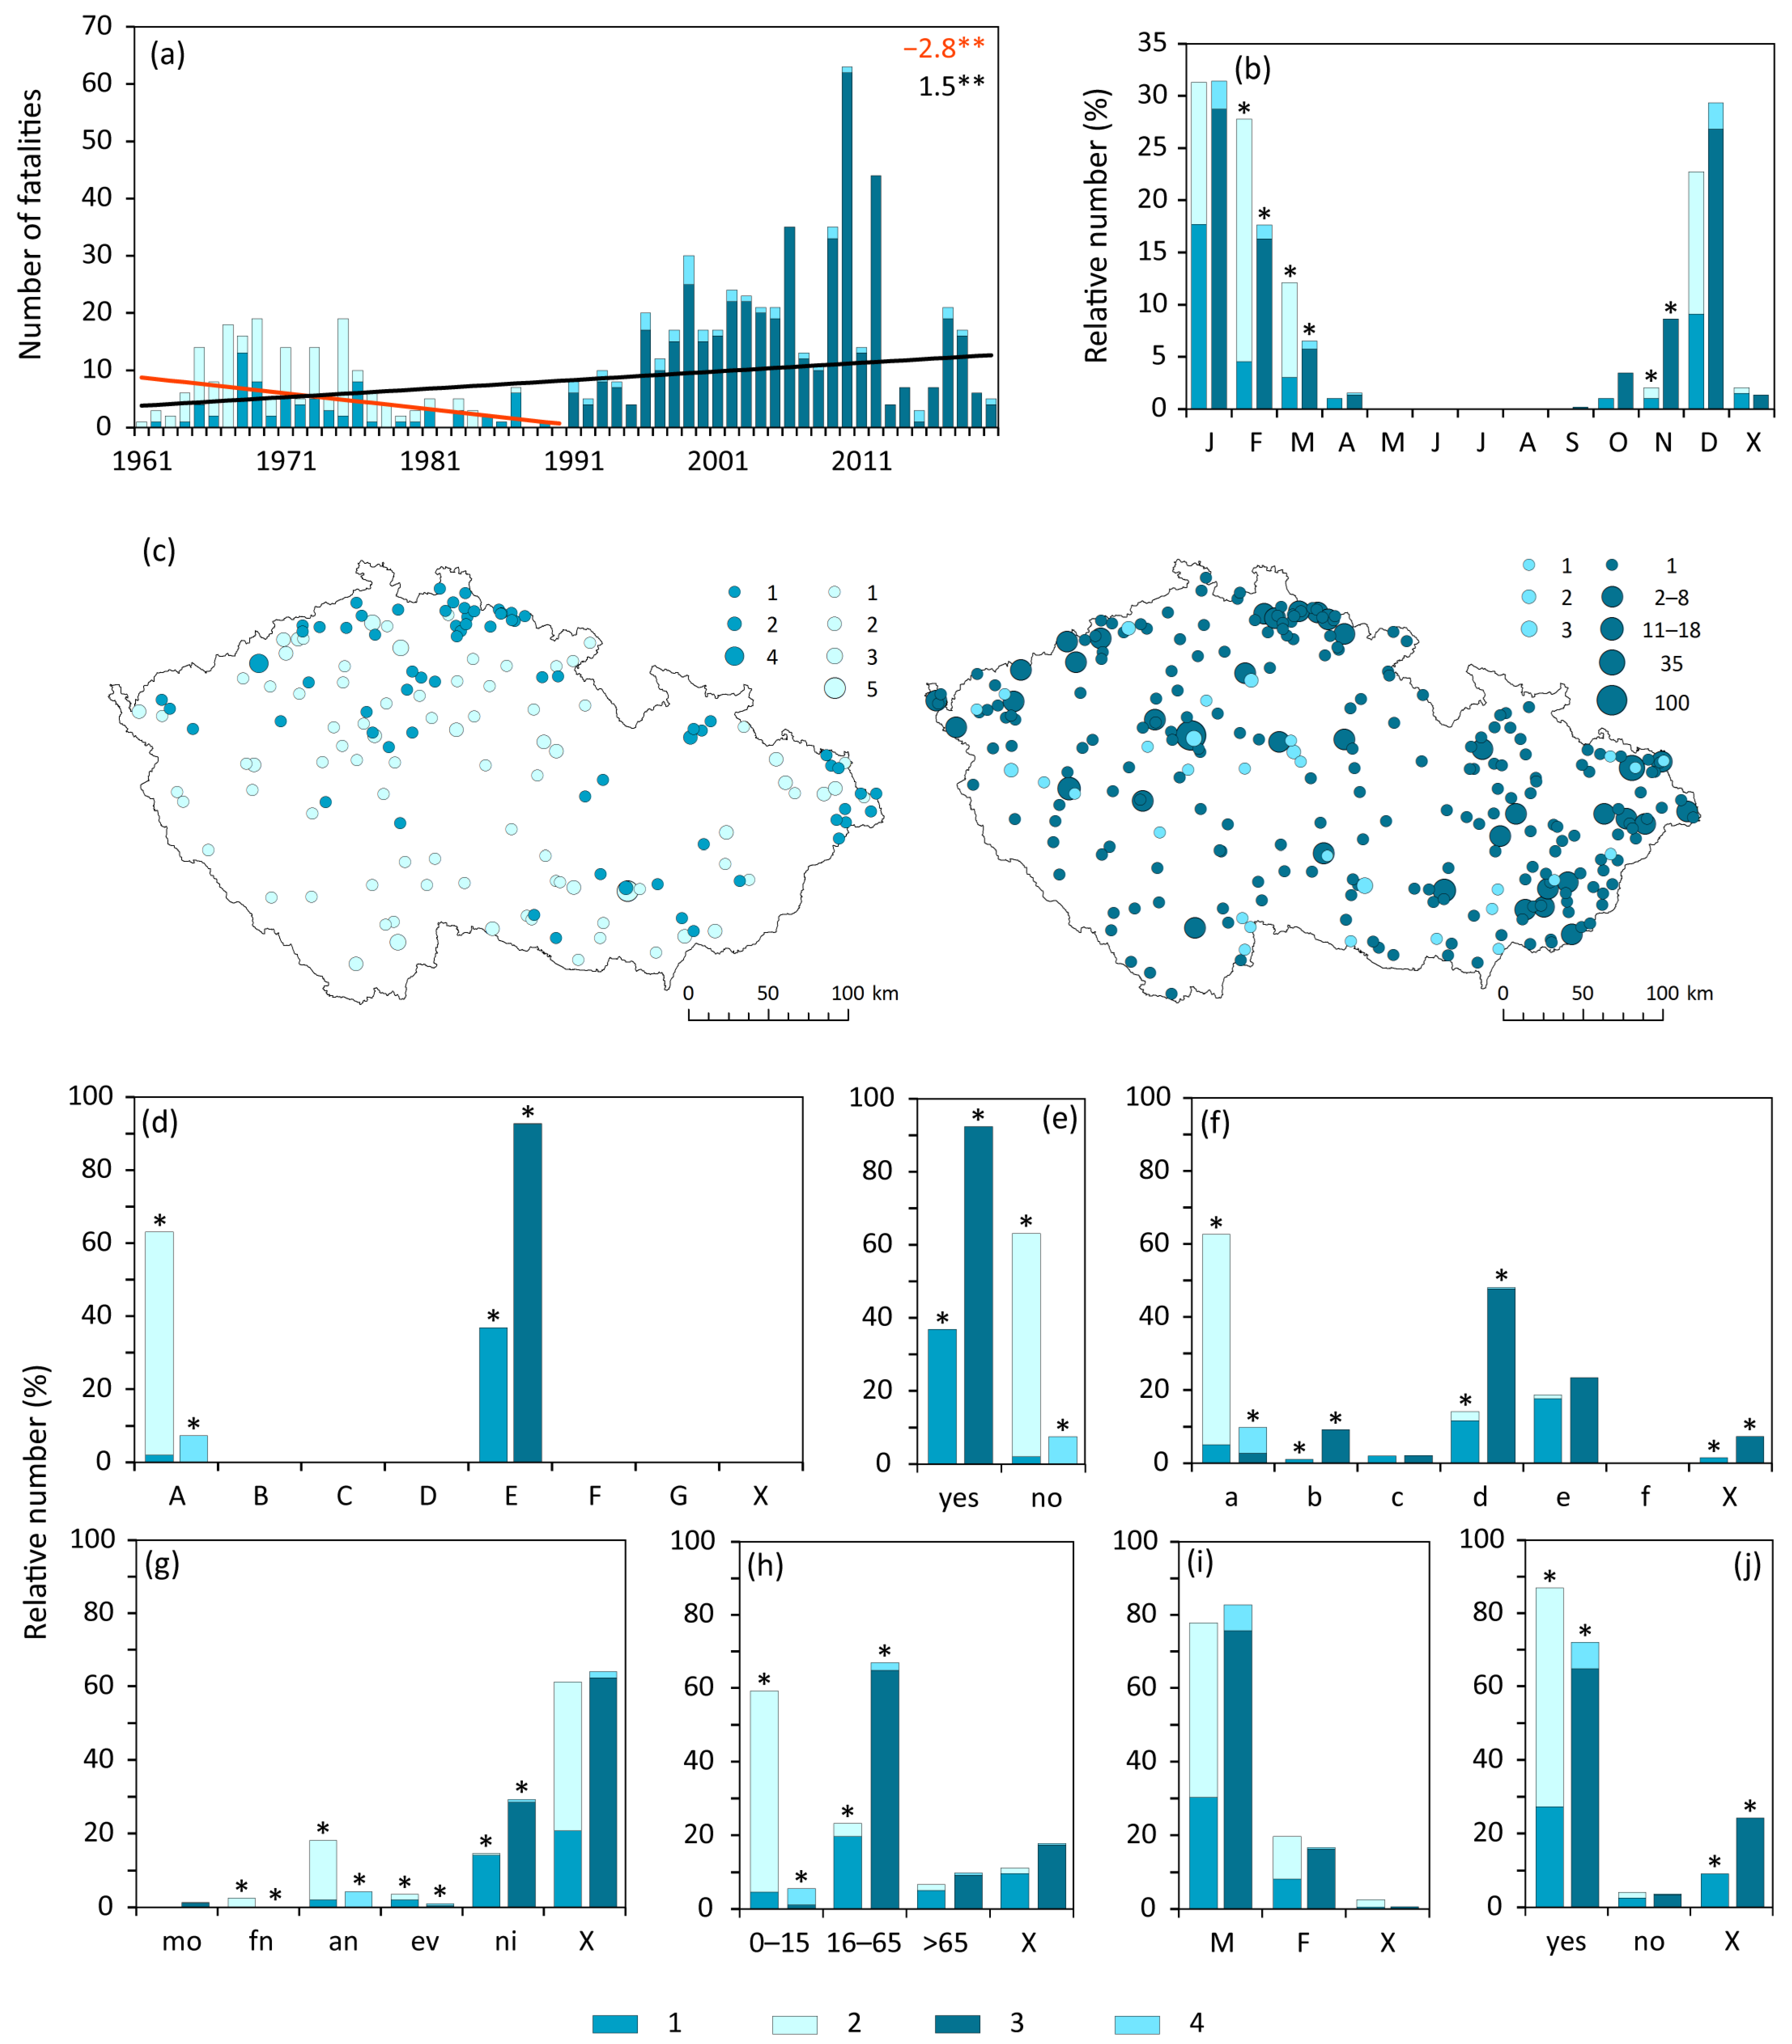
3.1.2. Windstorms
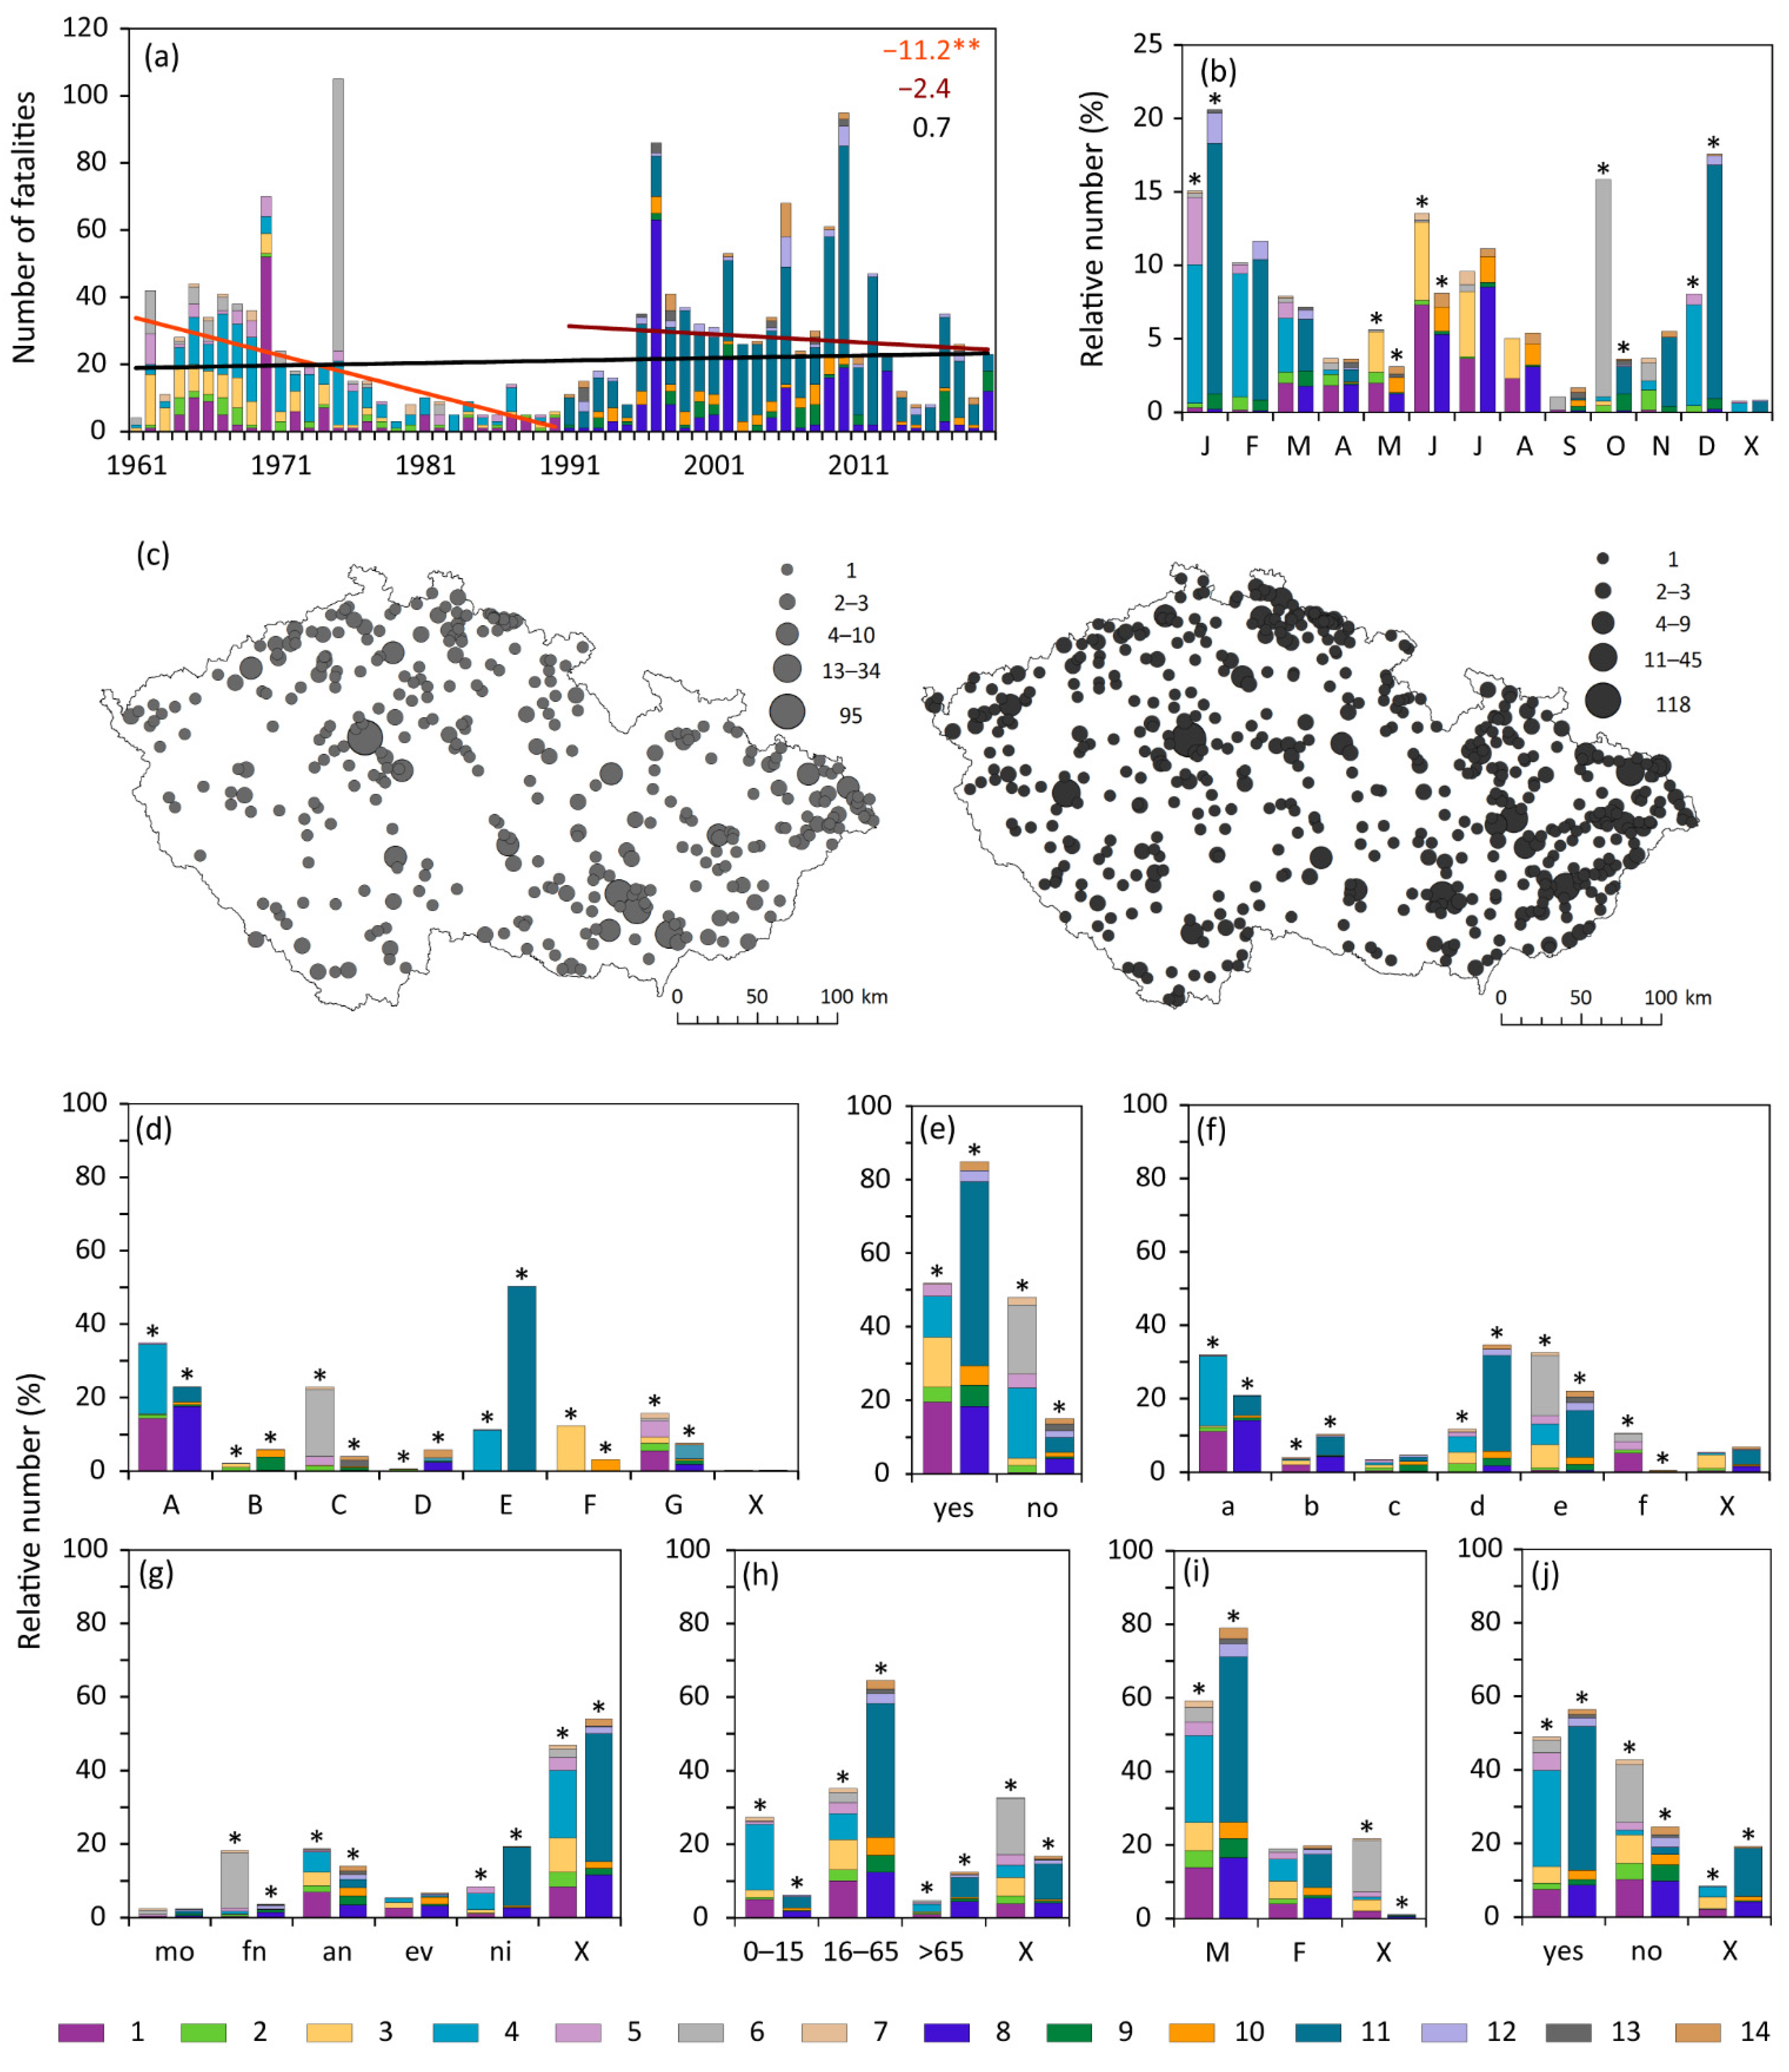
3.1.3. Convective Storms
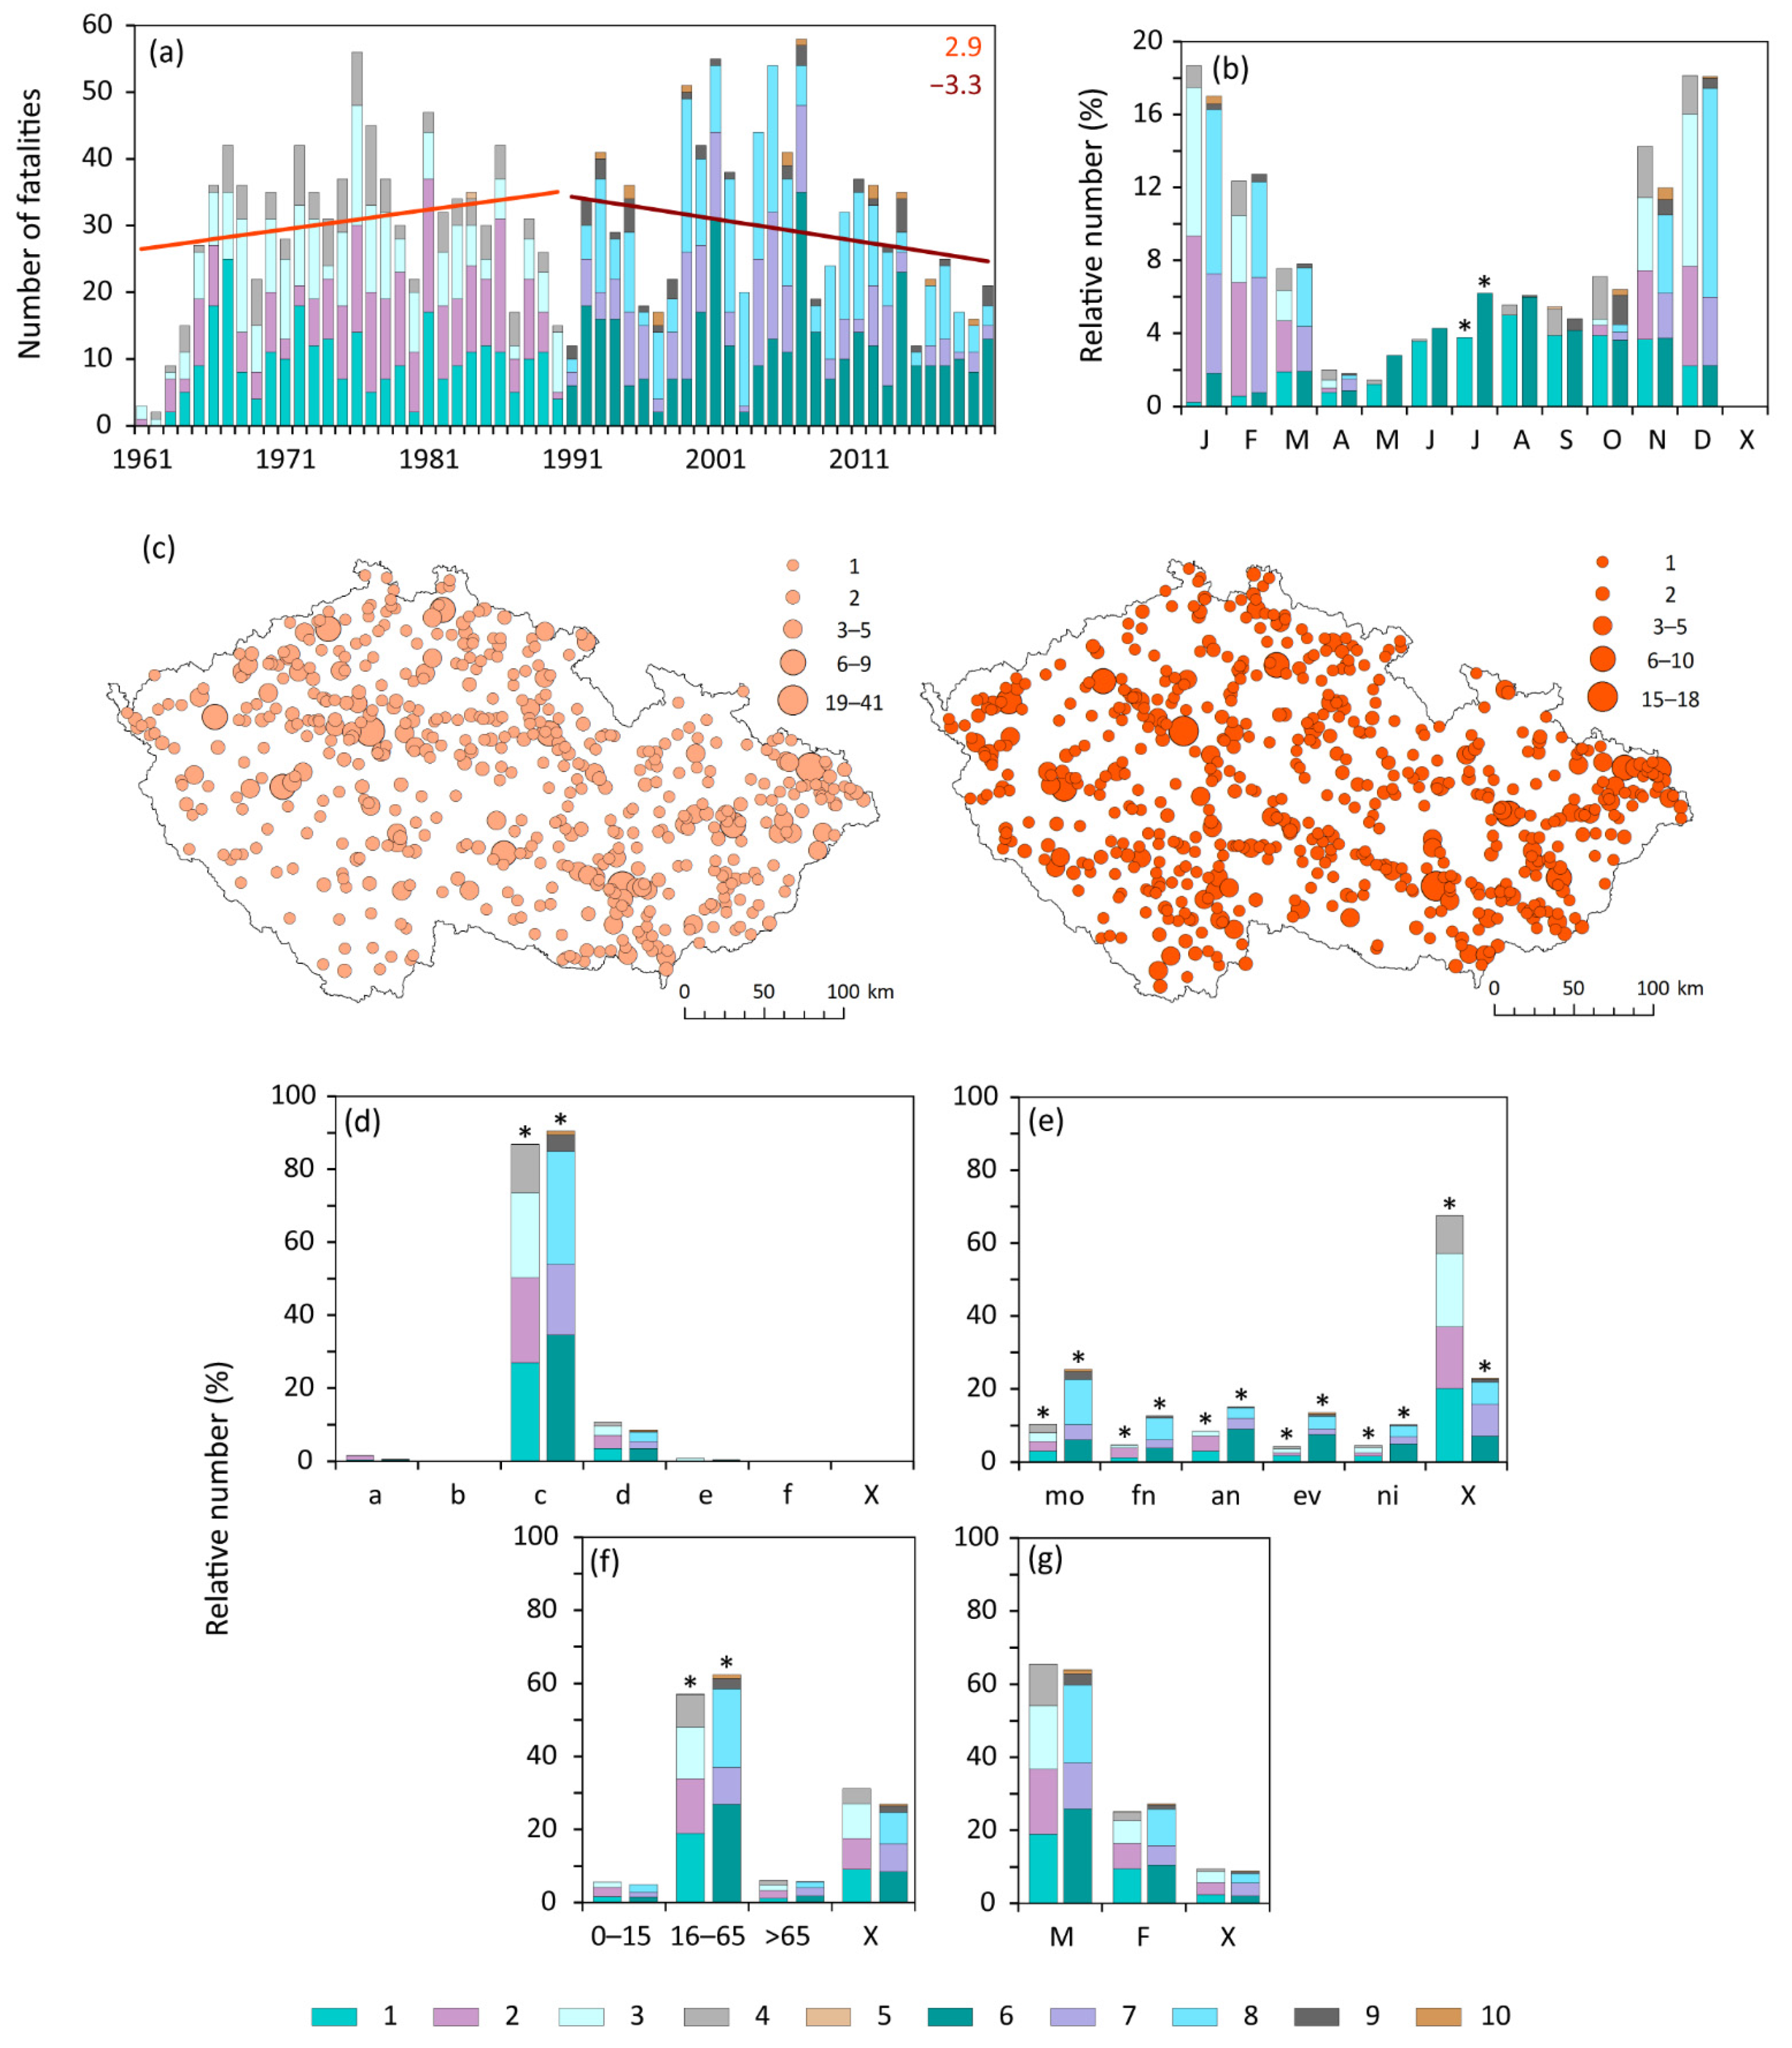
3.1.4. Snow and Glaze Ice
3.1.5. Frosts
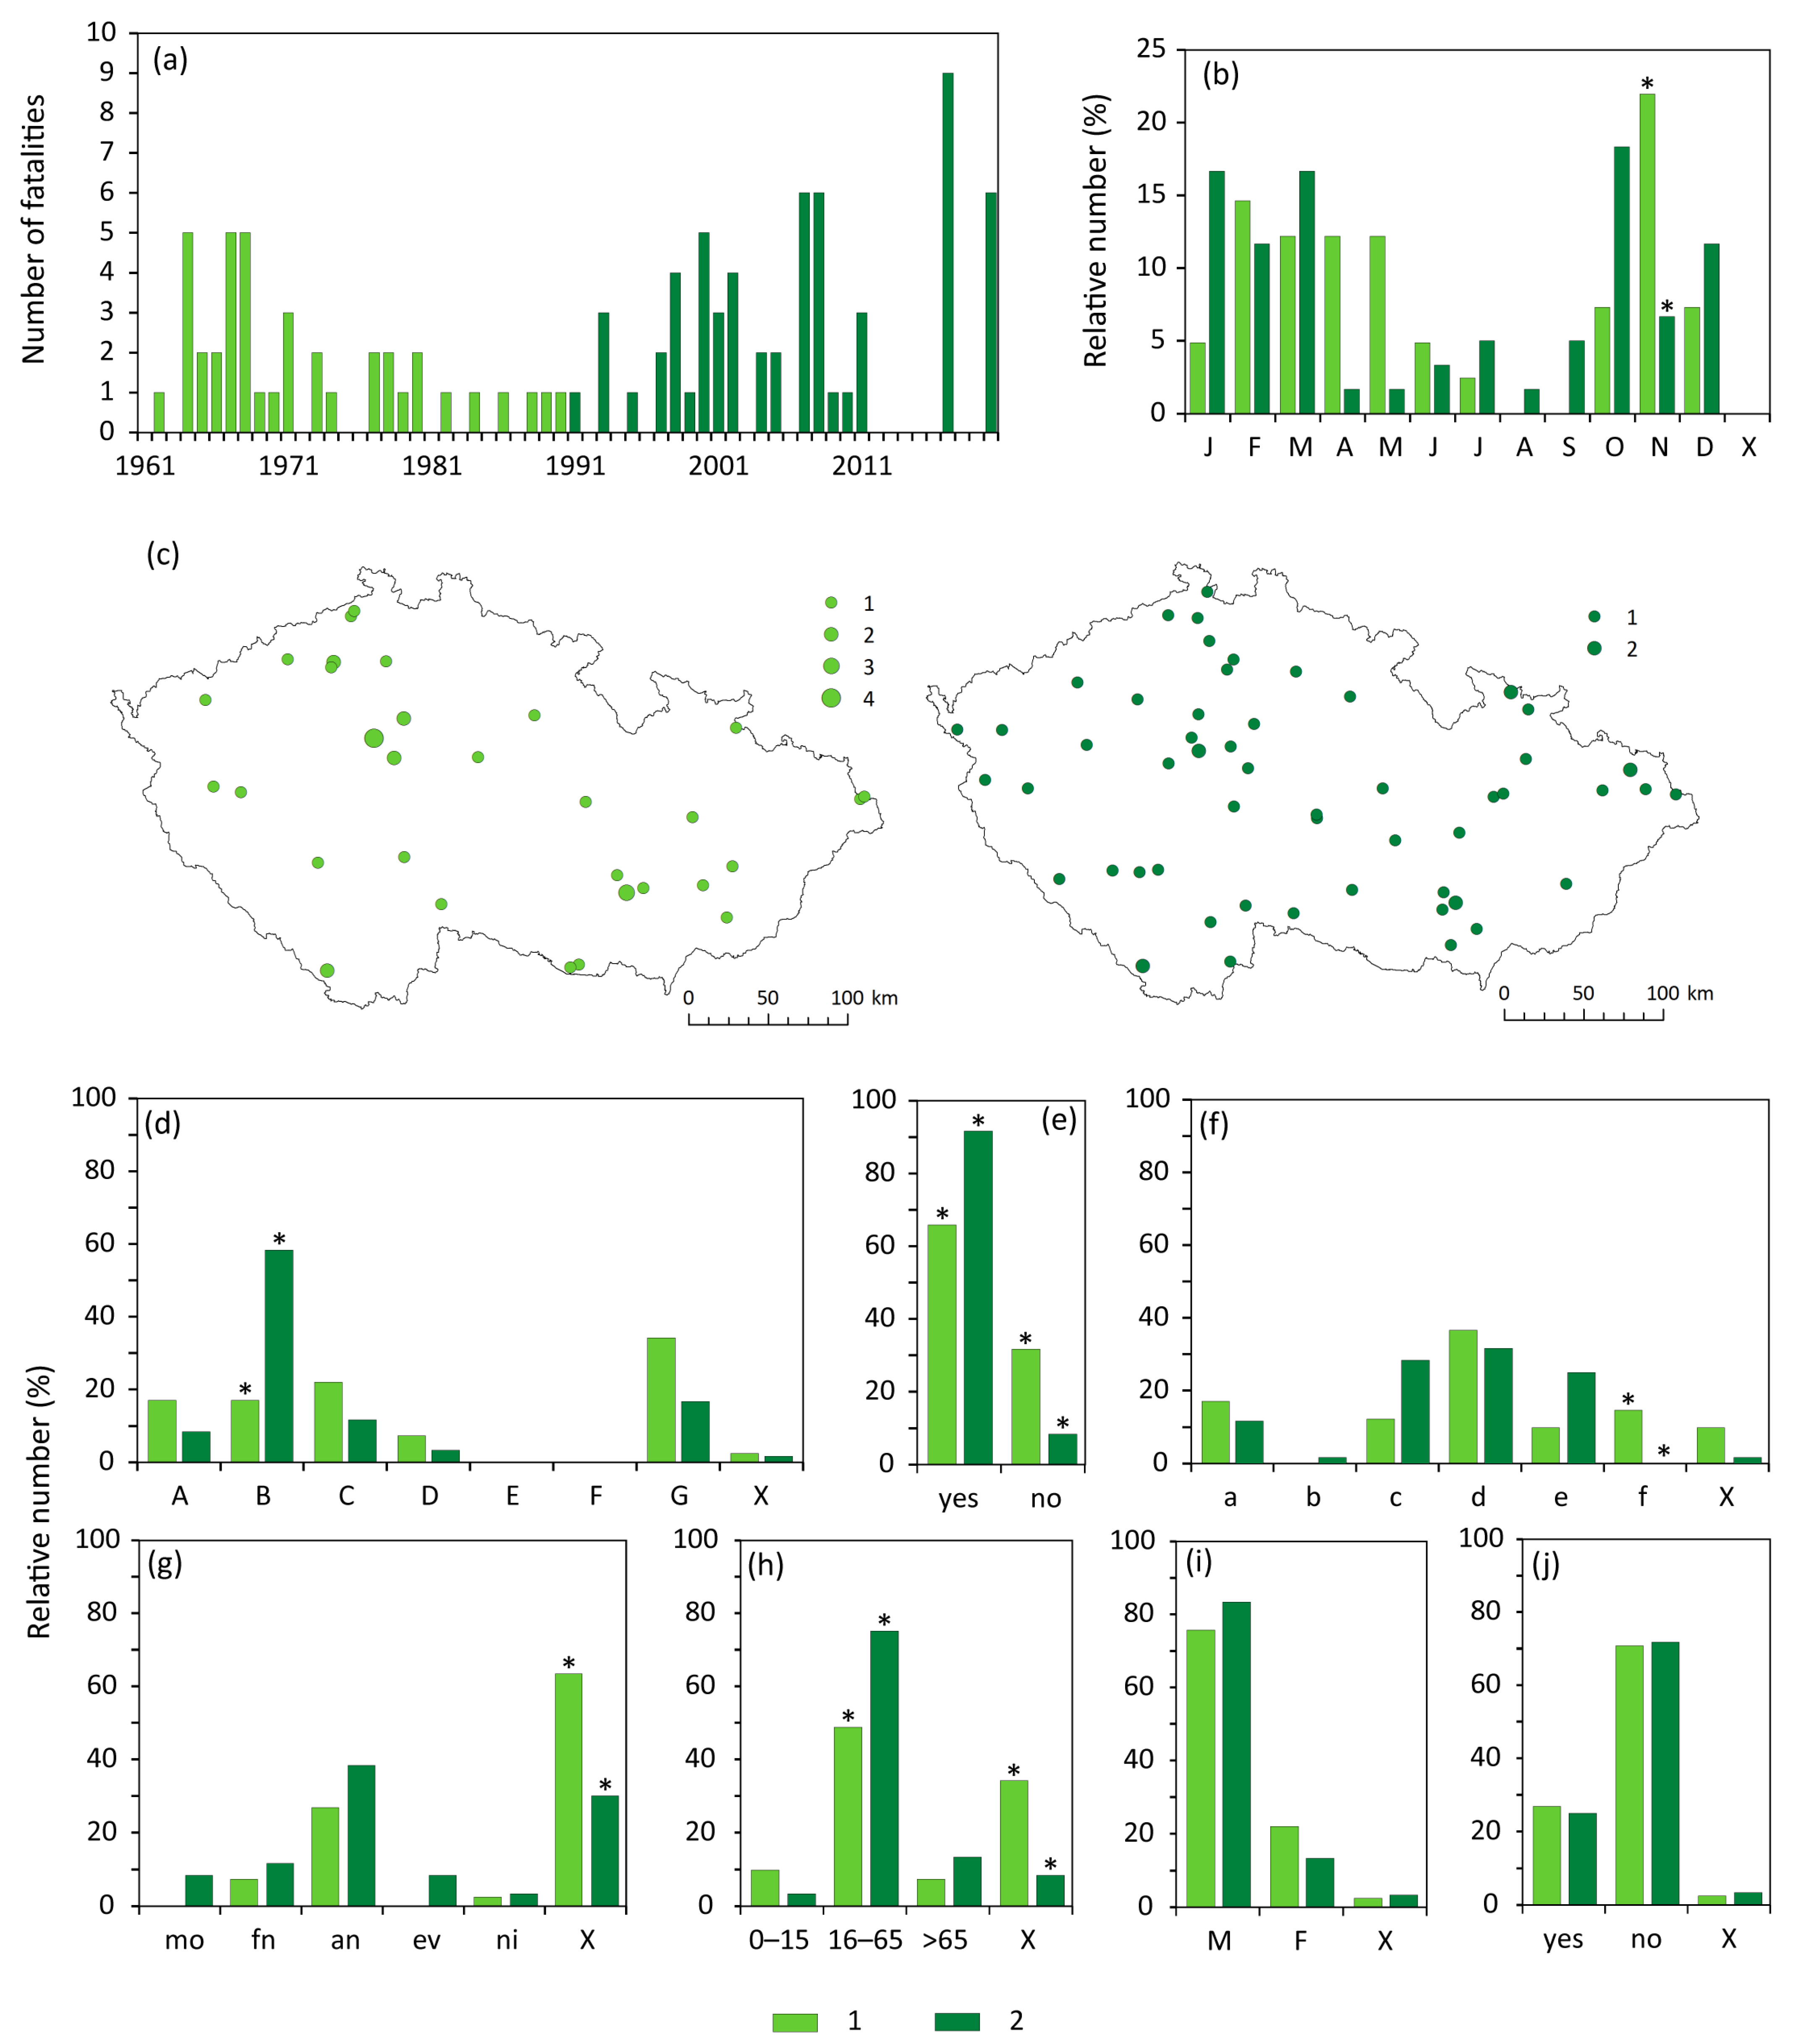
3.1.6. Fog
3.1.7. Further Severe Weather Categories
3.1.8. Synthesis of Severe Weather Fatalities
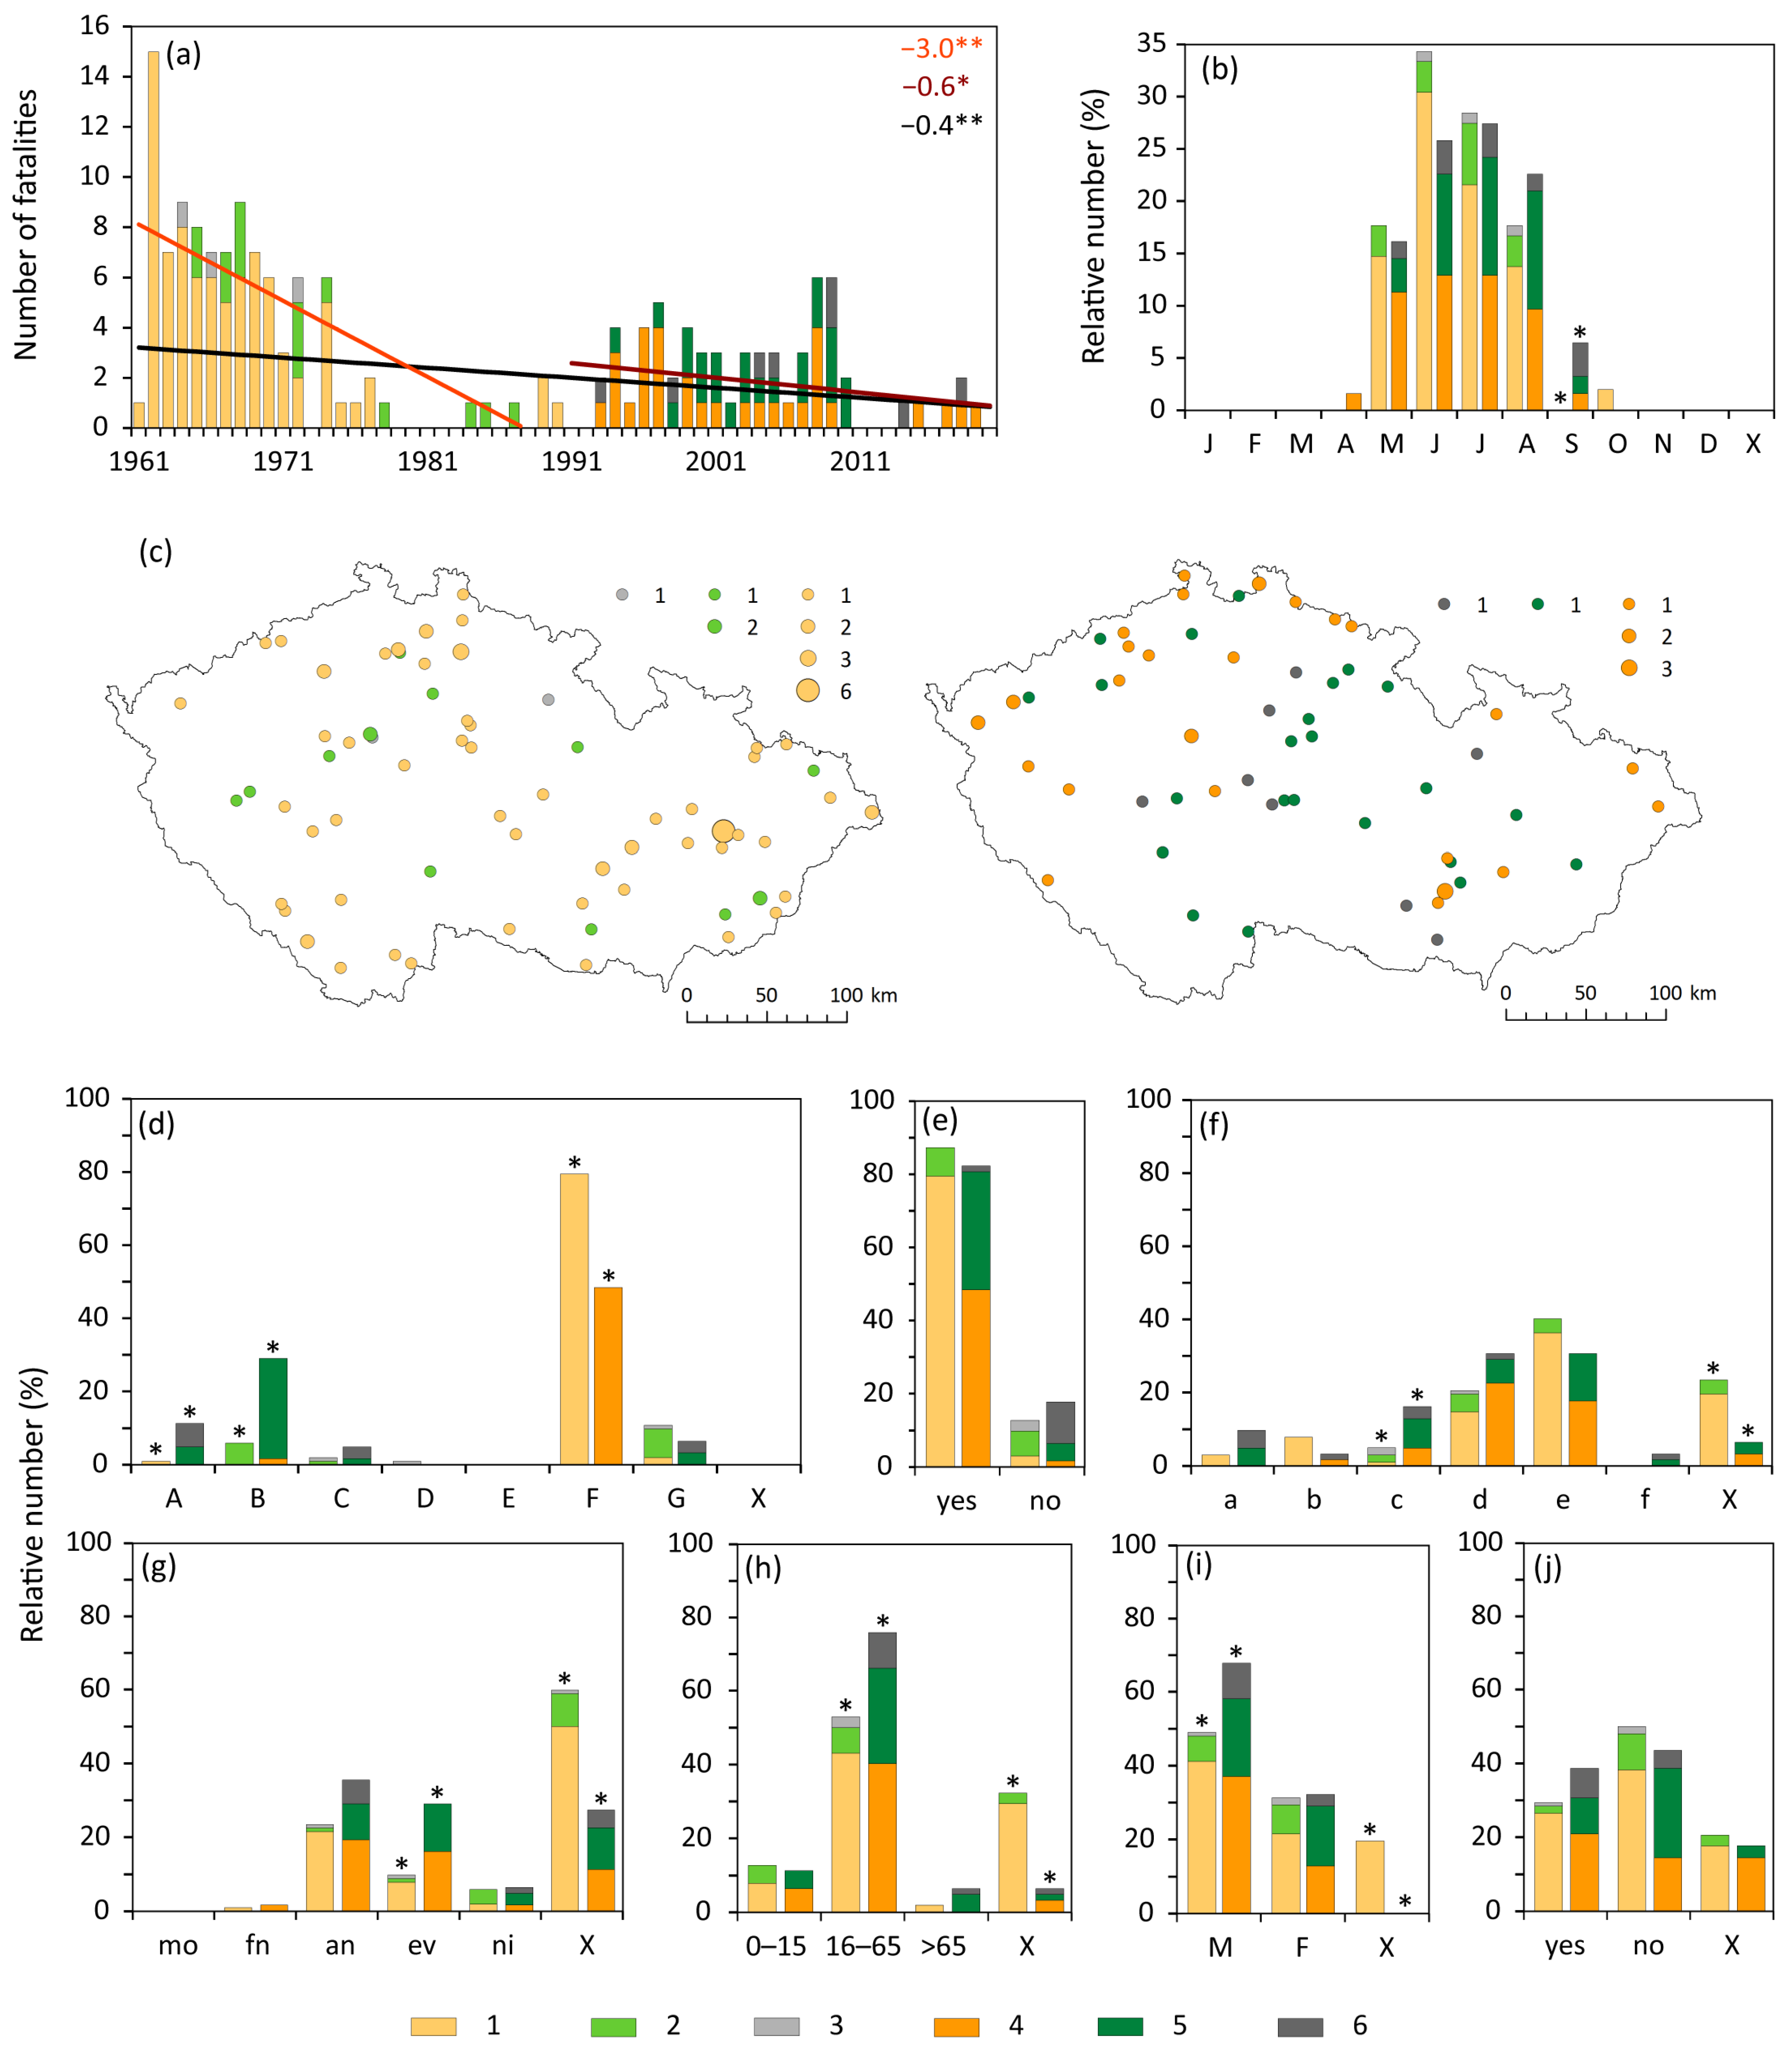
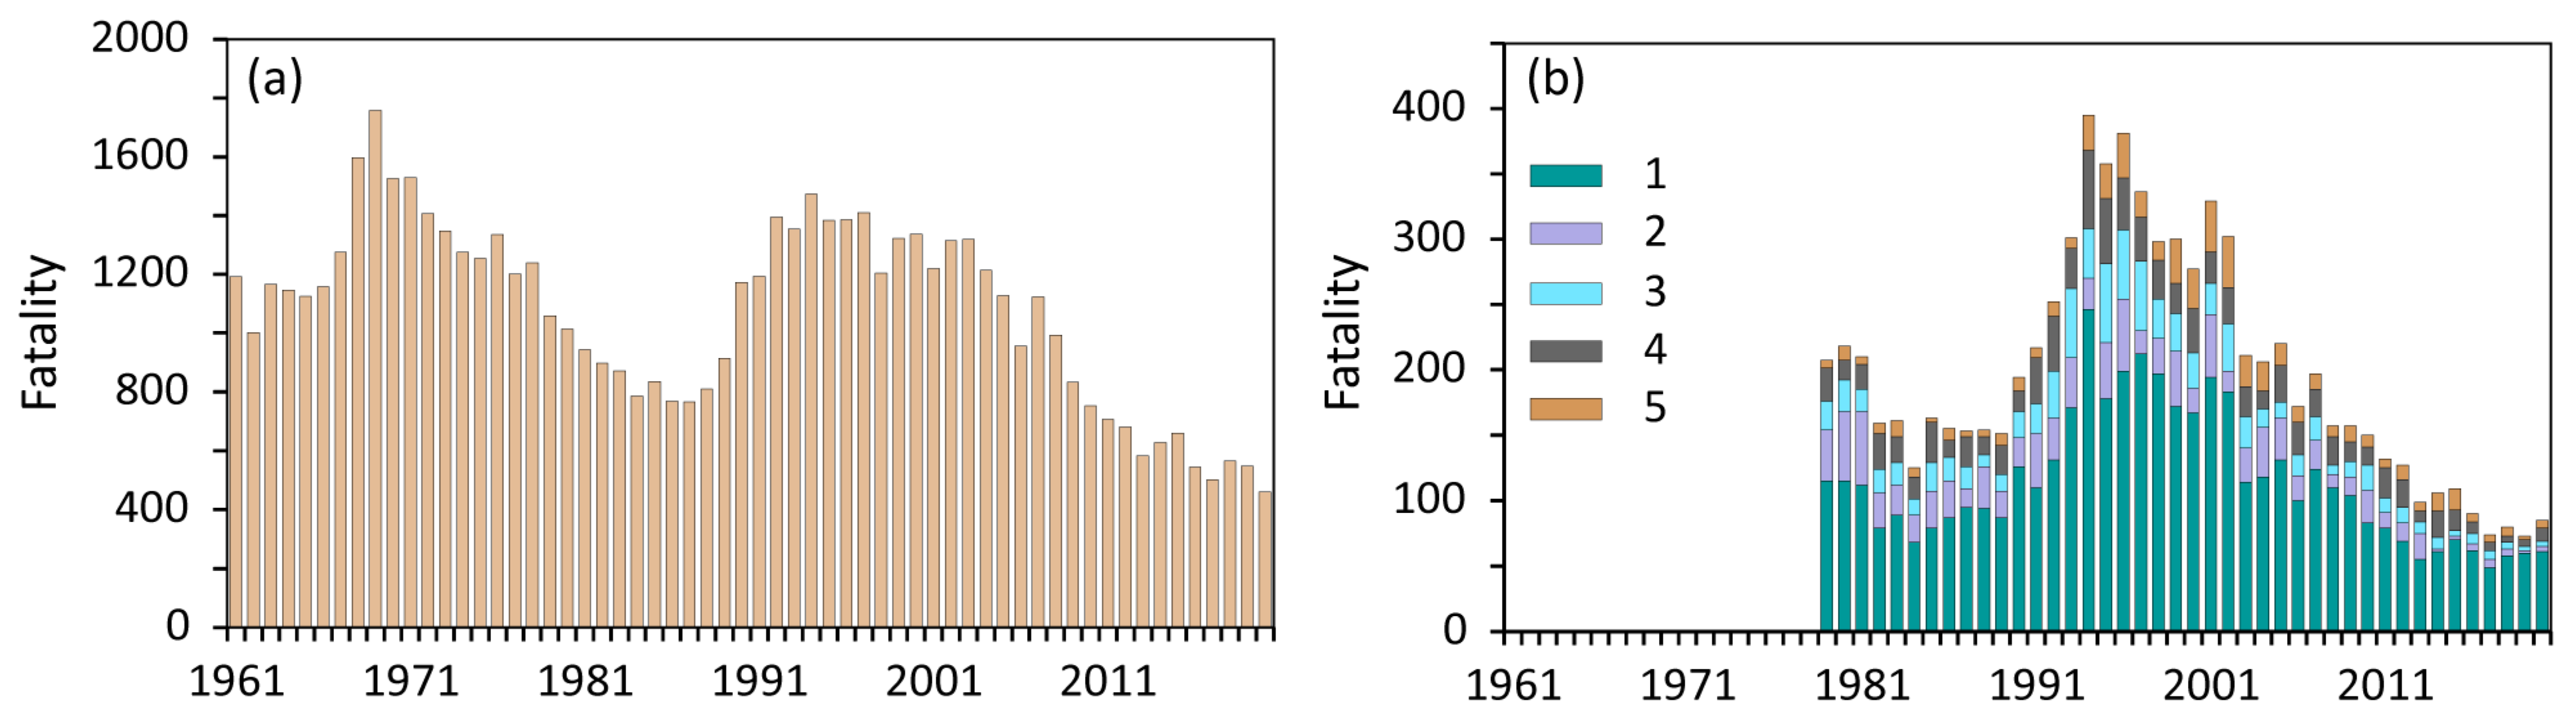
3.2. Vehicle Accident Fatalities Associated with Inclement Weather
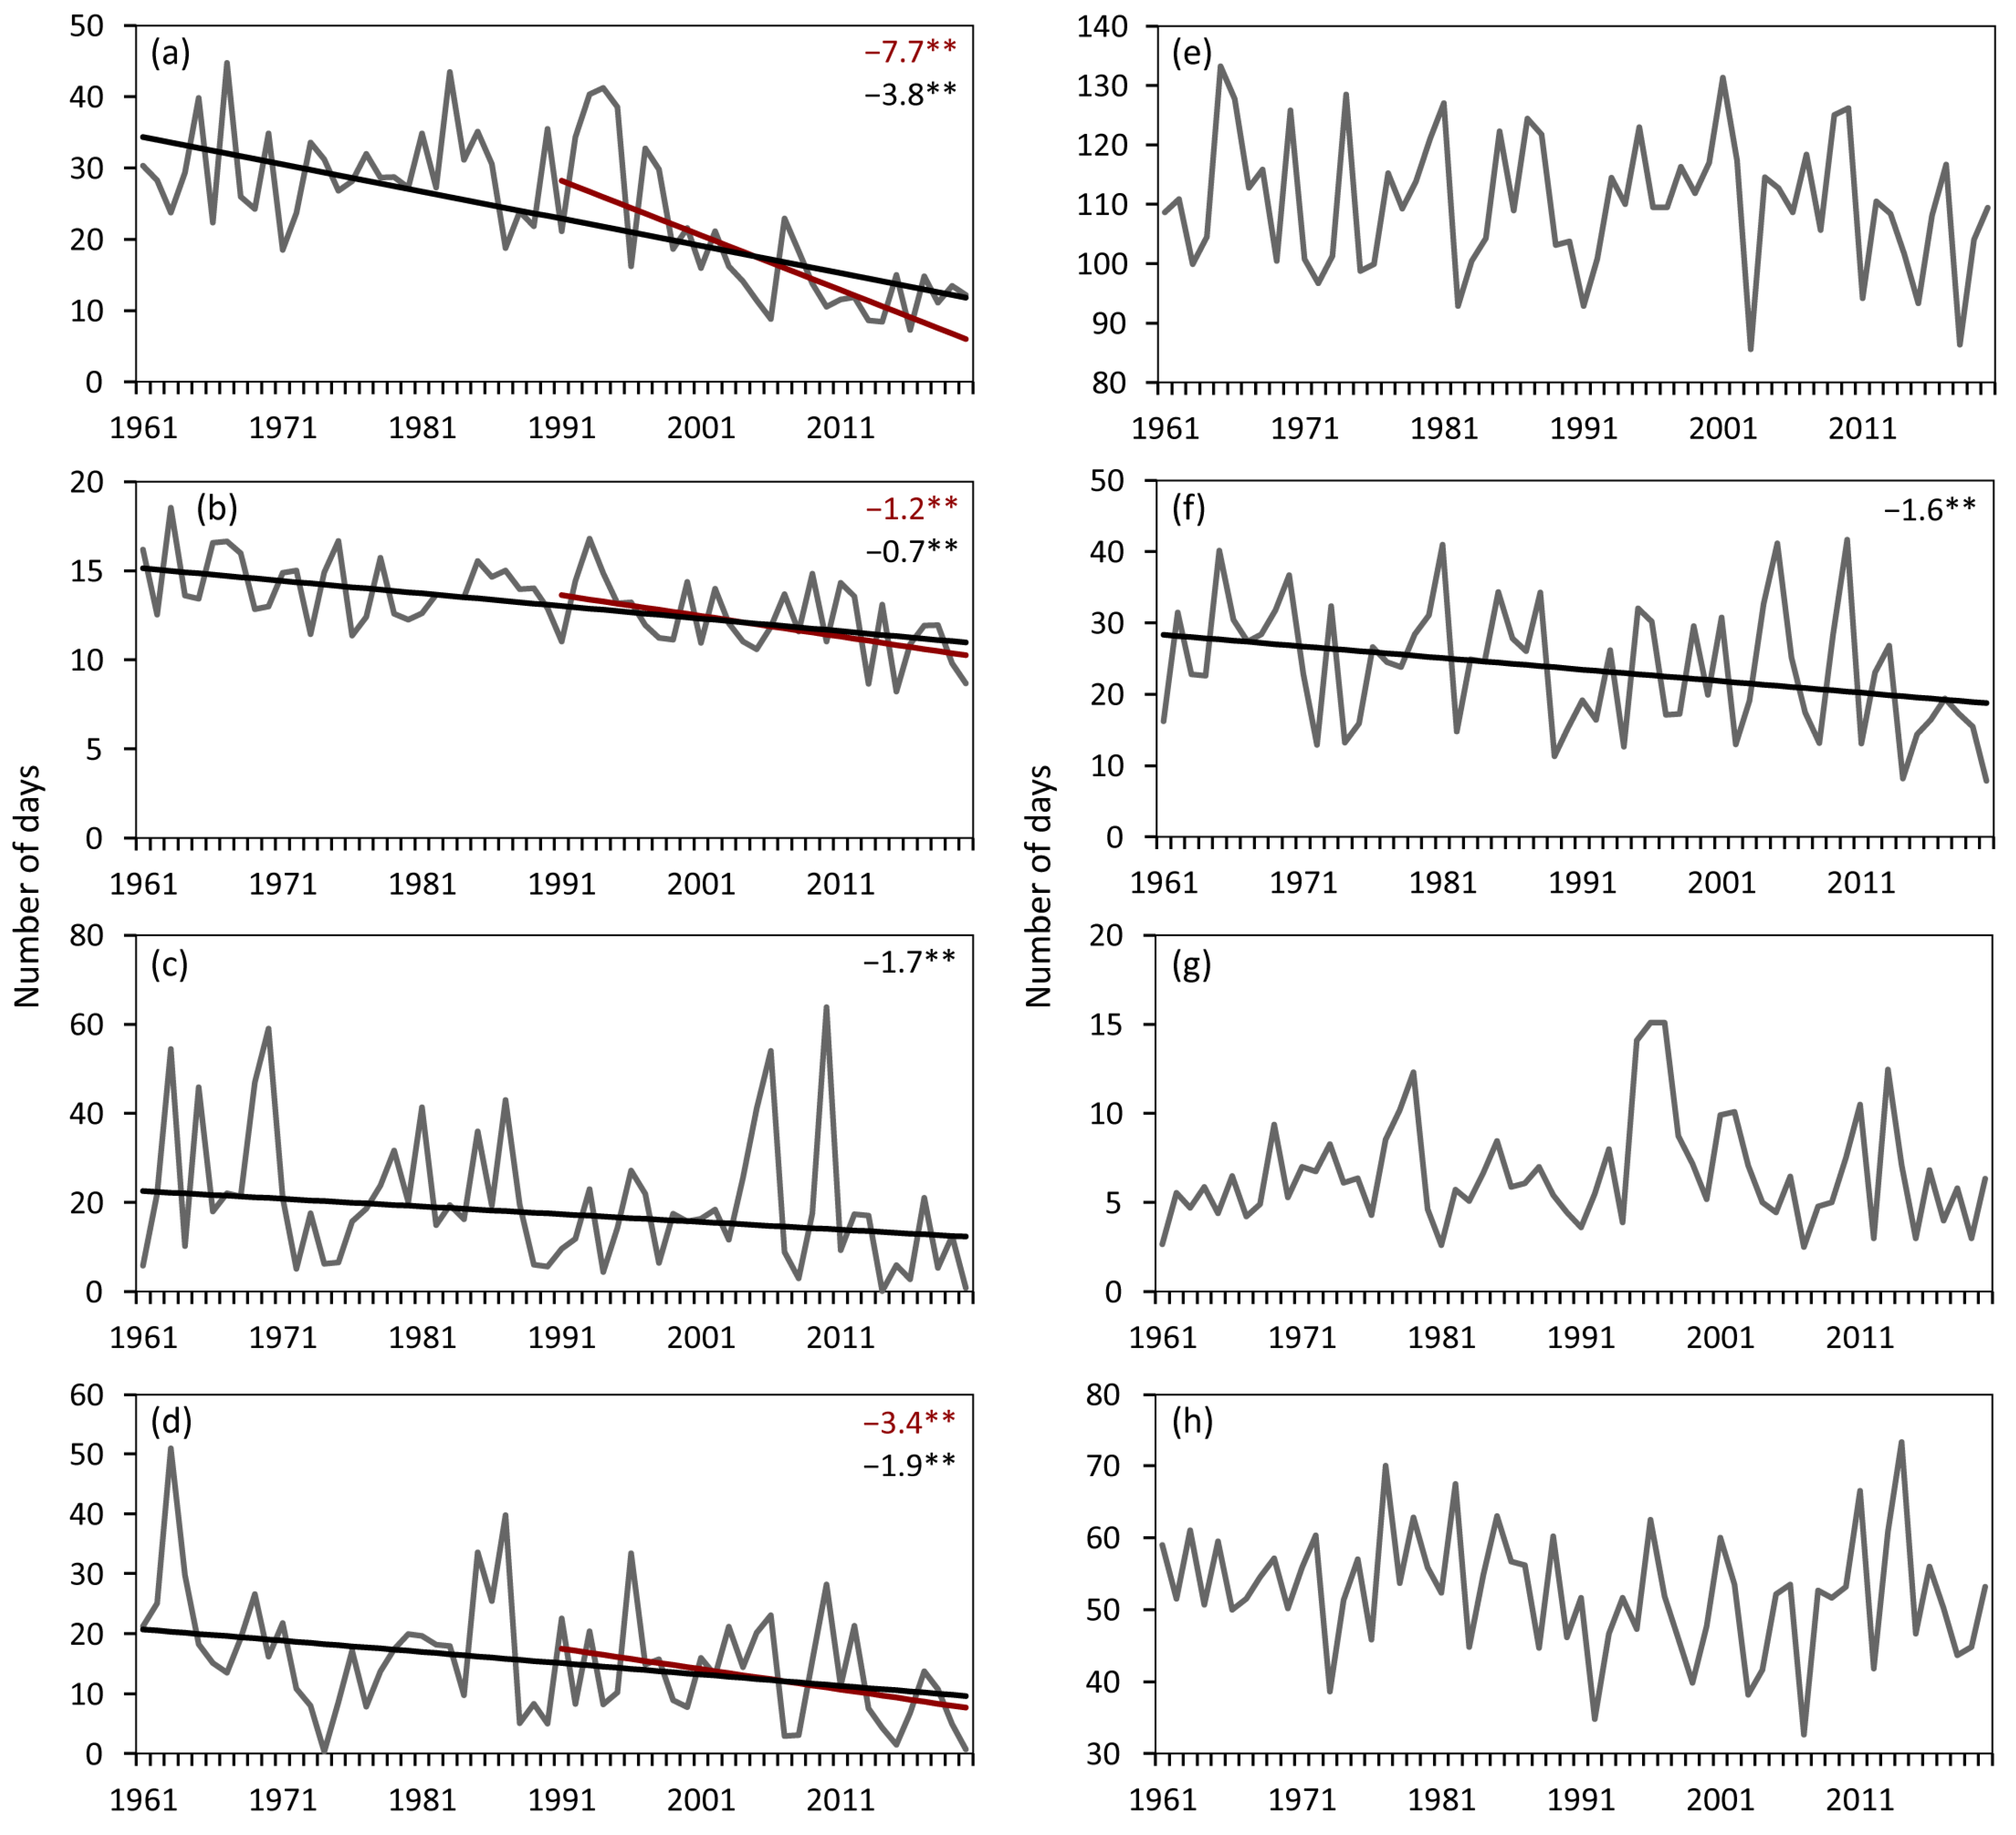
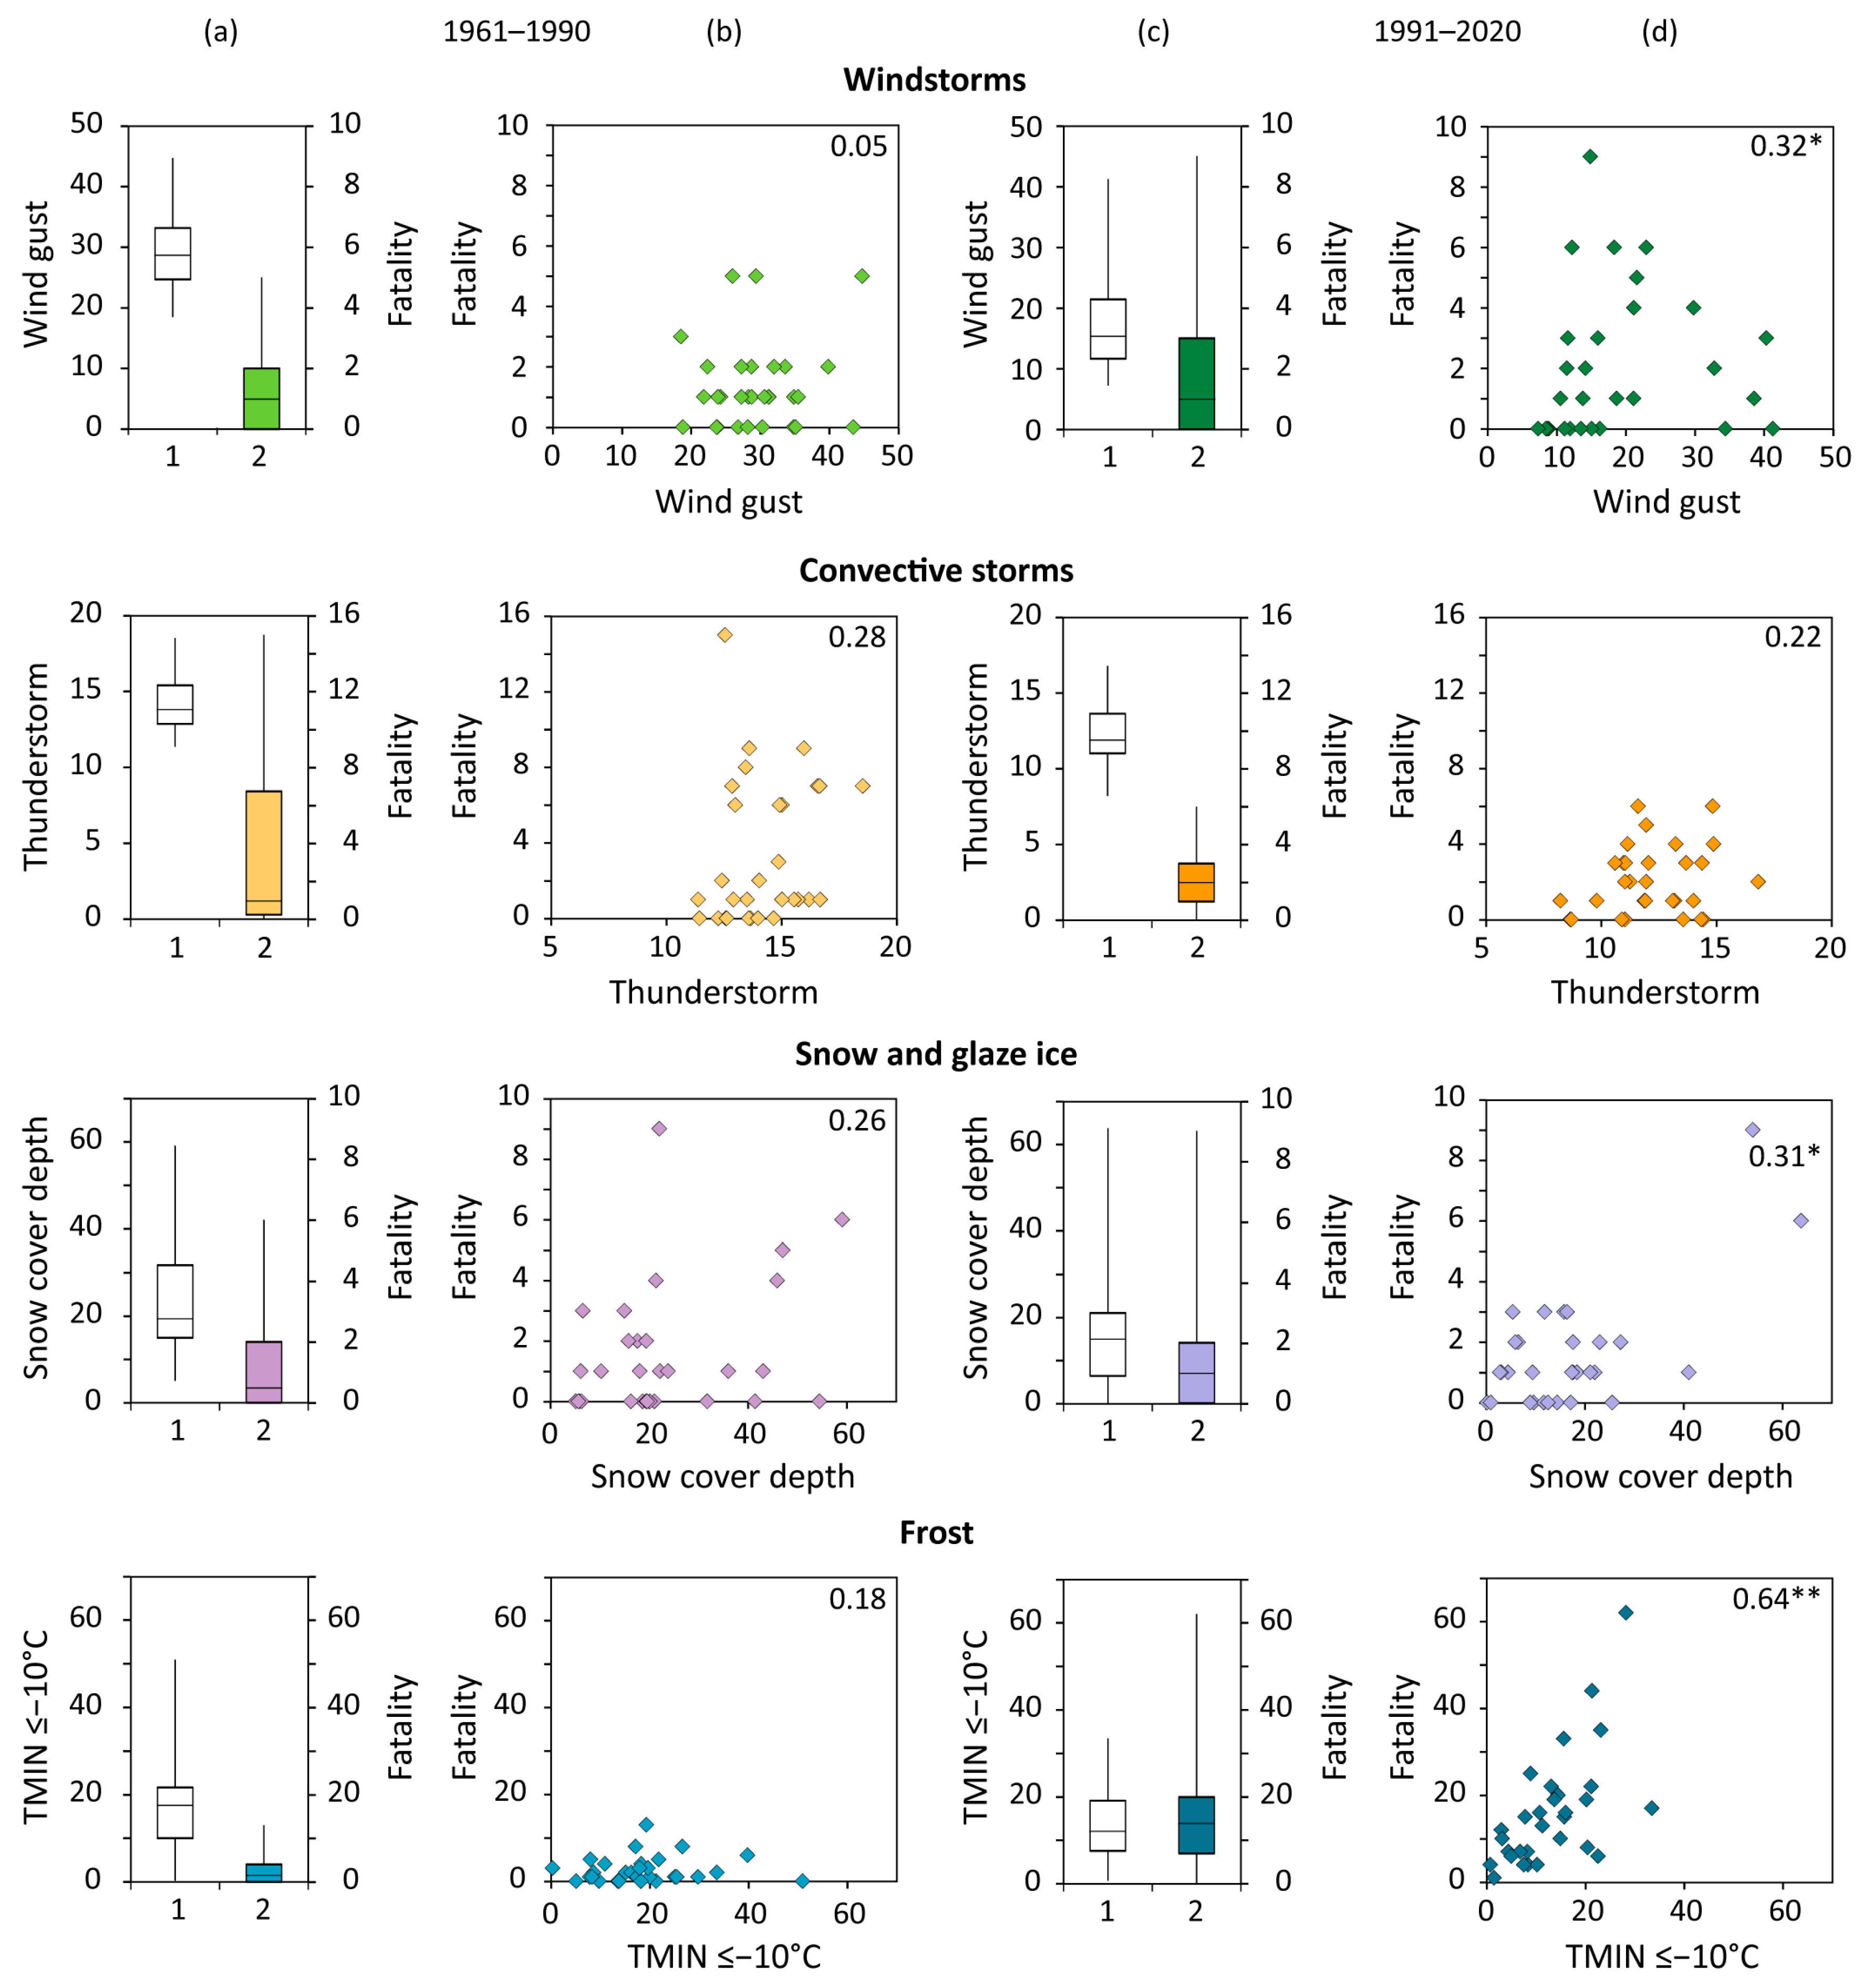
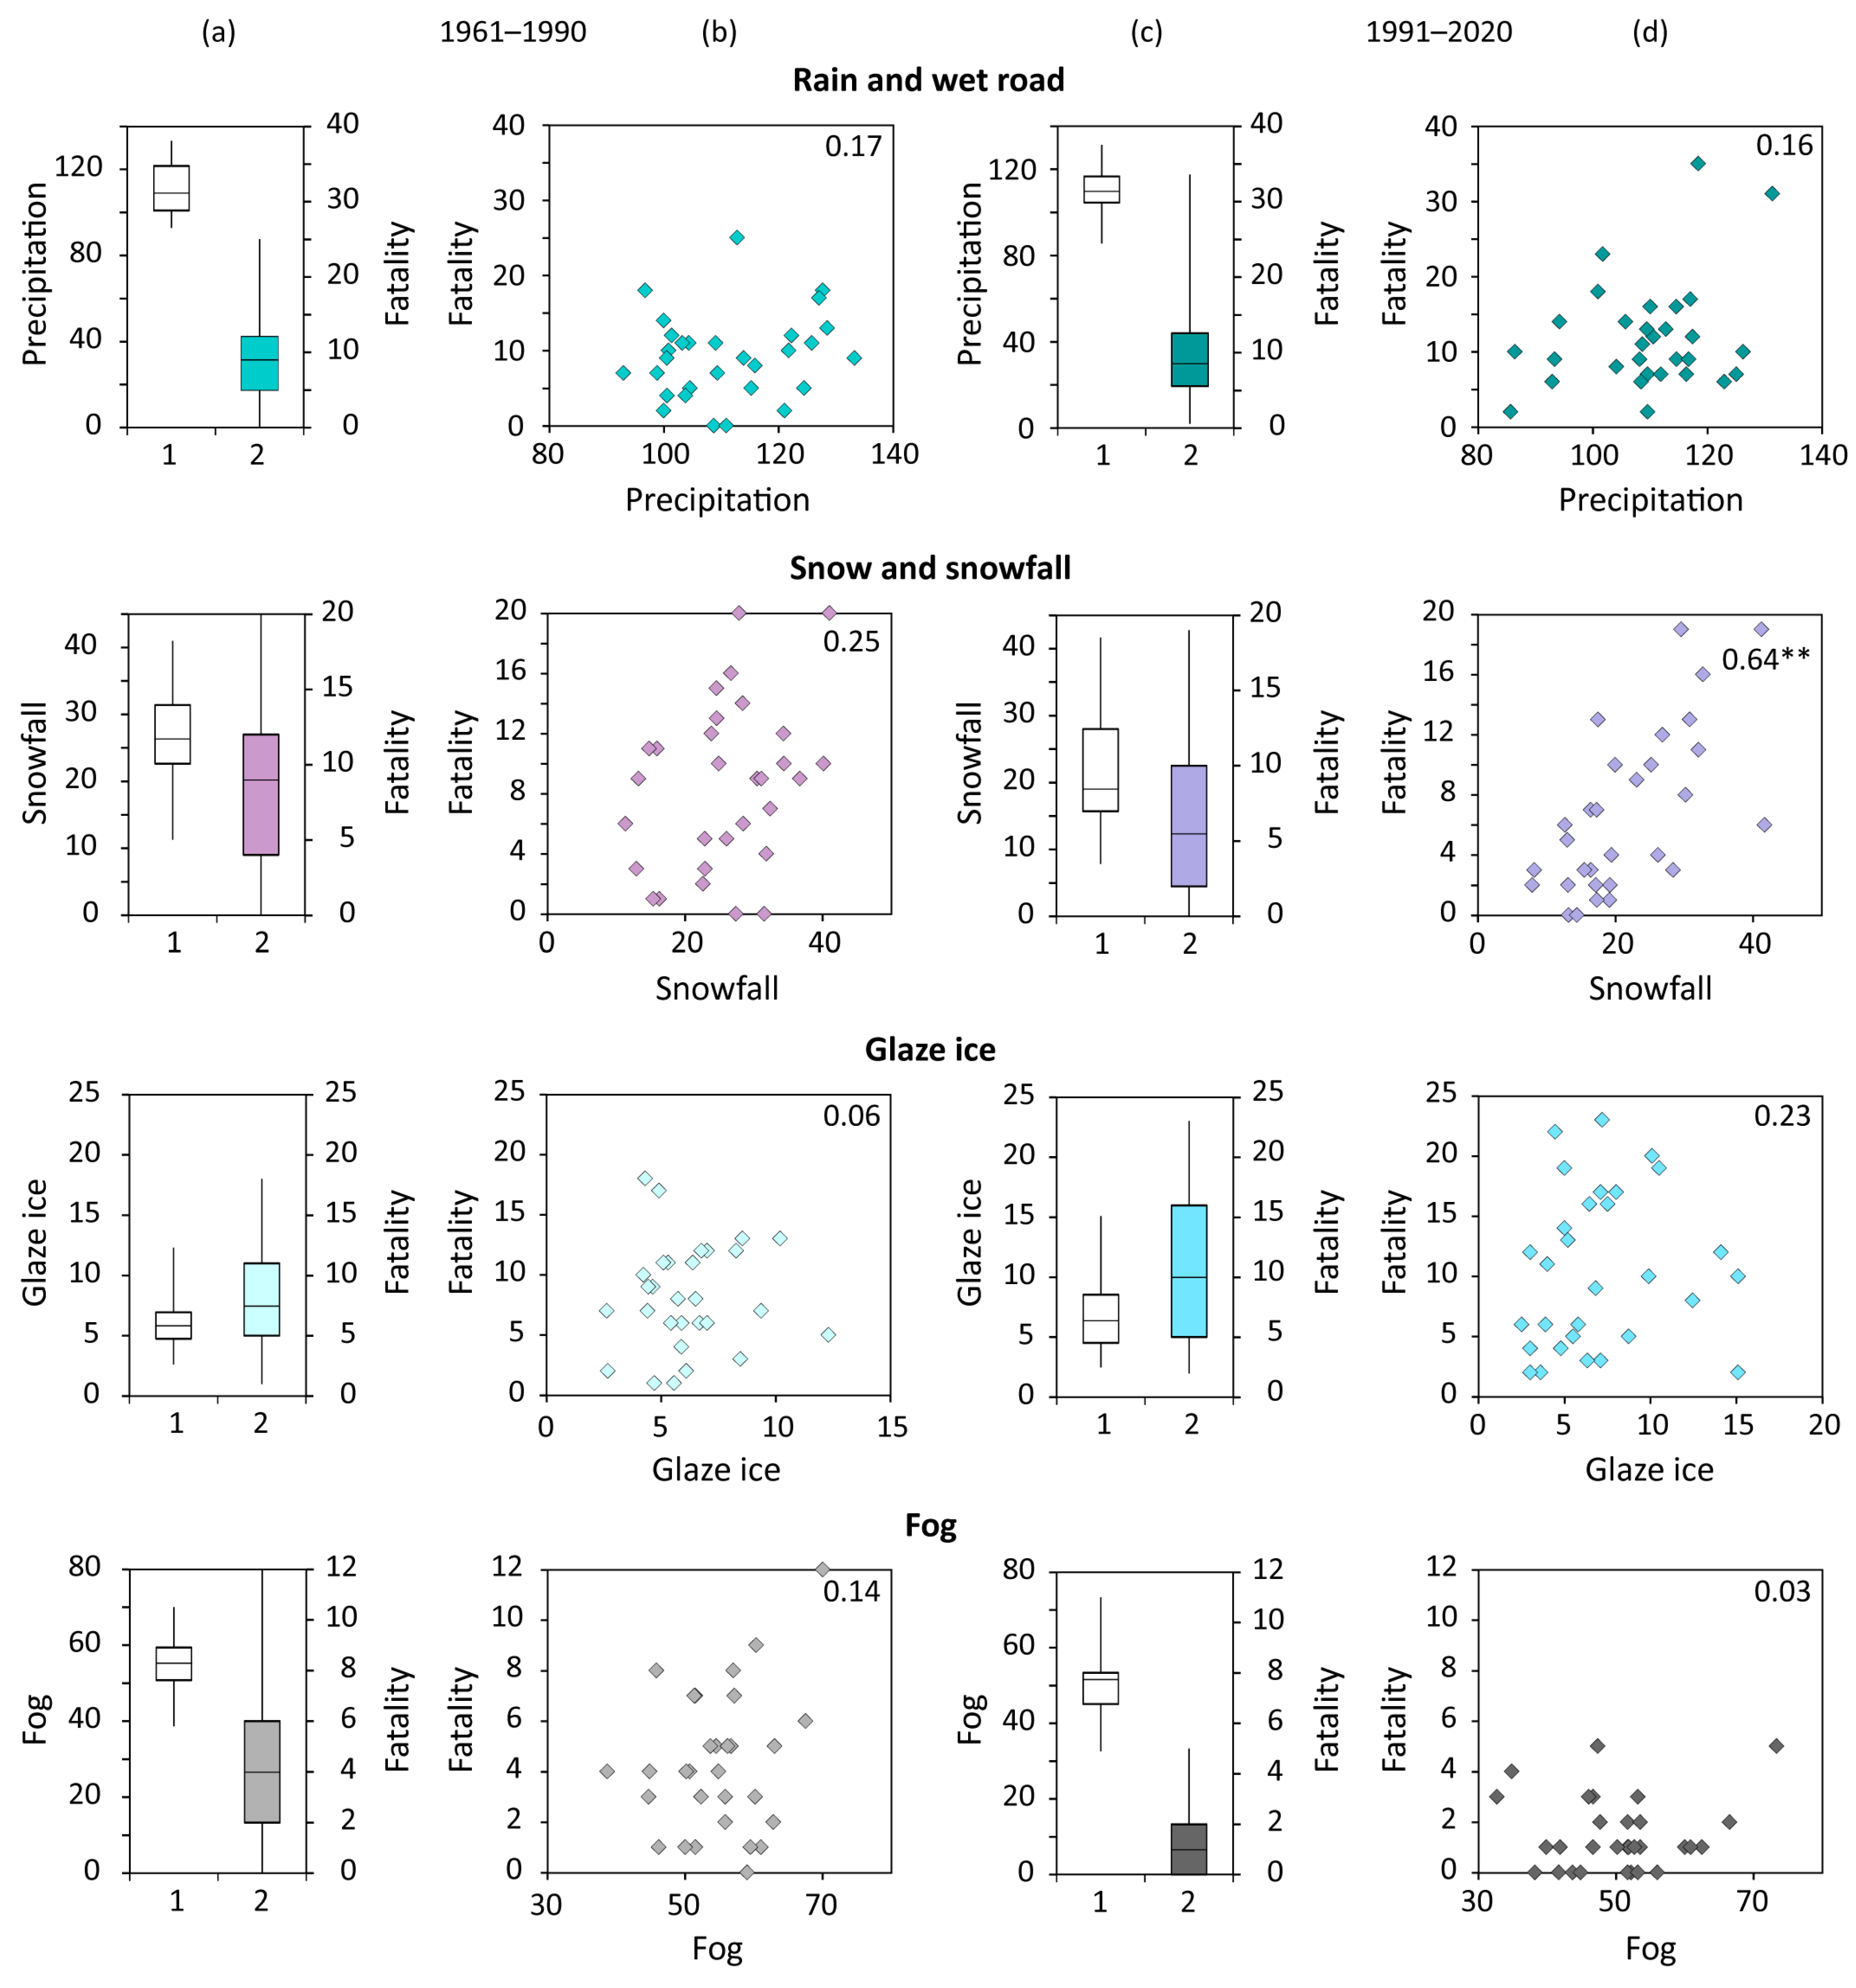
3.3. Climatic Factors and Related Fatalities
4. Discussion
4.1. Data Uncertainty
4.2. Severe Weather Fatalities
4.3. Vehicle Accident Fatalities
5. Conclusions
- (i)
- Based on documentary sources, particularly newspapers, a unique database of fatalities related to severe weather and vehicle accidents during inclement weather over the territory of the CR for the 1961–2020 period was created. Despite the database representing the lower estimate of all weather-related fatalities, it allows studying the spatio-temporal variability of fatalities and their special characteristics.
- (ii)
- The annual numbers of weather-related fatalities between 1961–1990 and 1991–2020 increased in the flood, windstorm, and particularly frost (cold waves) categories, and decreased for convective storms and fog. There were also statistically significant changes in the internal structure of these fatality categories. The 30-year linear trends in individual fatality categories are prevailingly zero or non-significant.
- (iii)
- Although the basic features of weather-related fatalities generally indicated the highest percentages for their occurrence in the winter months (the secondary maximum in the summer months), males, adults, direct deaths, deaths by freezing or hypothermia, and hazardous behaviour, relative proportions between both 30-years periods and individual fatality categories were often very different and in many cases statistically significant.
- (iv)
- It is difficult to find, on the annual and whole-republic scales, a clear relationship between the numbers of weather-related fatalities and climate variables, despite substantial changes appearing in many of them due to global warming, being enhanced especially in 1991–2020. The correlation analysis only proved a statistically significant relationship for “snow and glaze ice” fatalities with the number of days with some snow cover depth and “frost” fatalities with the numbers of days with a minimum temperature below −5 °C or −10 °C. Enhanced flood activity of the past decades was reflected in a substantial increase of “flood” fatalities.
- (v)
- The “rain”, “snow (snowfall)”, “glaze ice”, and “fog” categories are the most important weather factors influencing the annual numbers of vehicle accident fatalities during inclement weather. However, their small proportion of all annual fatalities, achieving only 1–6%, signal highly undervalued data excerpted from newspapers and internet sources. Only “snow (snowfall)” fatalities are significantly correlated with the number of snowfall days, while for other fatality categories their correlations with corresponding climatic variables are non-significant.
- (vi)
- Results of the analysis of fatalities related to severe weather or vehicle accidents during inclement weather reflect different climatological, political, economic, and societal changes. It is a great challenge for further research to go from annual and whole-republic scales to higher spatio-temporal resolutions, which may enhance the importance of this and similar studies for risk management, not only in the CR.
Author Contributions
Funding
Institutional Review Board Statement
Informed Consent Statement
Data Availability Statement
Acknowledgments
Conflicts of Interest
Appendix A
- (i)
- Lidová demokracie, 12 July 1968, p. 5; Rovnost, 13 July 1968, p. 1; Rudé právo, 12 July 1968, p. 2; Svobodné slovo, 12 July 1968, p. 3 (source): On 11 July 1968 (date) around midday (time of day), 48-year-old (age) pilot Miloš Funk (name and gender) from Brno arrived with an AN-2 plane to the airport (place of death) at Kunovice (locality). He fixed the plane and remained there to be saved before the rain. A sharp whirlwind—tornado (event)—took a hangar away, tore off the plane from the ropes and brought it out of the hangar into the open. The plane turned over several times (cause of death) and the pilot died.
- (ii)
- Svobodné slovo, 18 August 1978, p. 7 (source): On Wednesday 16 August 1978 (date) in the early evening (time of day), a torrent of water (event) at Velké Žernoseky (locality) lifted a car with a 36-year-old driver, carried it a 50-m distance on the road (place of death) and dropped it into a ditch. The driver and his wife with three children were in the car. Additionally, a 4-year-old (age) little girl (gender) was taken away by the torrent (cause of death) and died.
- (iii)
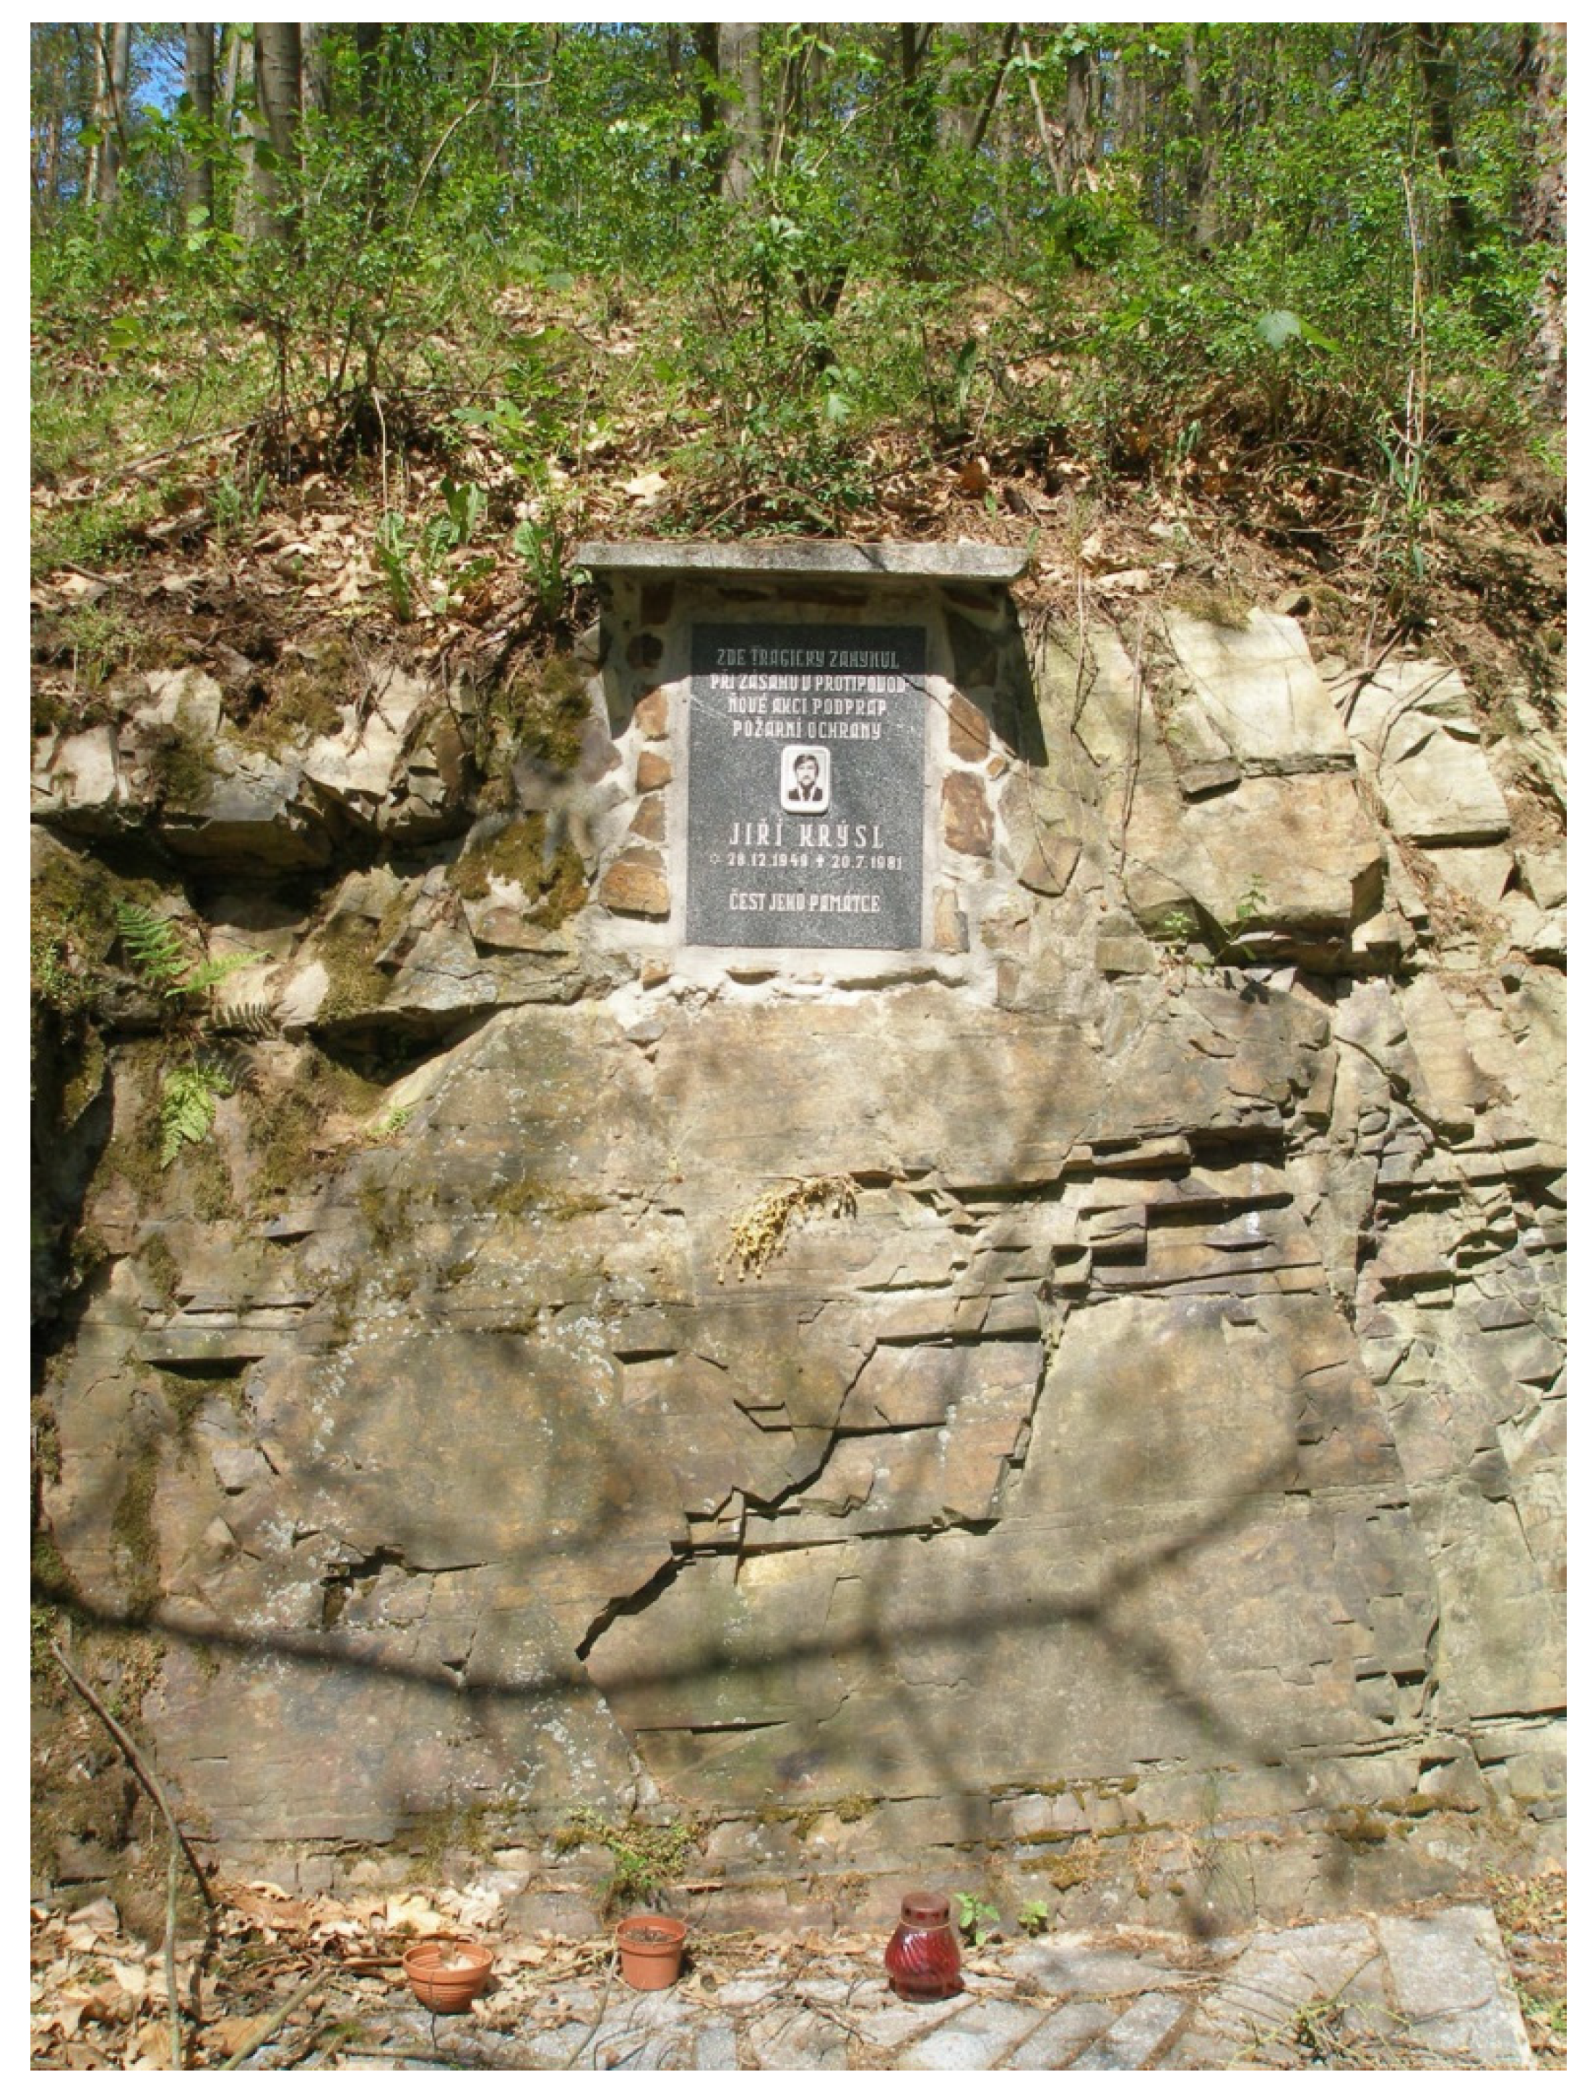
- https://cs.wikipedia.org/wiki/Soubor:Kocaba-2007-05-19-PomnikJirihoKrysla.JPG (accessed on 20 December 2021) (source): Memorial plaque of Jiří Krýsl with the inscription: “First sergeant of the fire brigade Jiří Krýsl (* 28 December 1949, † 20 July 1981) died tragically here at an intervention during an anti-flooding action. Honour to his memory.” Circumstances: After a four-day rain, on 20 July 1981 (date), the dam of Strž pond collapsed and caused a flood (event). Five firemen were in a lifeboat in the Kocába valley (place of death) at Velká Lečice (locality) which after a sudden and sharp hit of a water wave turned over (cause of death). Four men were saved, but 31-year-old (age) Jiří Krýsl (name, gender) died in the flood.
- (iv)
- Právo, 1 July 1994, p. 3 (source): In the afternoon (time of day) of 29 June 1994 (date), two 16-year (age) students (gender) playing basketball on the playing field at Tuhnice in Karlovy Vary (locality) hid before a thunderstorm (event) under a tree (place of death), which was struck by lightning (cause of death). One of the students fell dead into the brook, the second in shock crawled up to Poštovní Street and was transported to the hospital.
- (v)
- Právo, 27 March 2006, p. 6 (source): Half-past-two p.m. (time of day) on 25 March 2006 (date) at Vilémov (locality), a layer of snow (cause of death) from a lean-to of the house (place of death) fell on a seven-year-old (age) boy (gender). He died after being transported to the hospital.
- (vi)
- https://www.idnes.cz/liberec/zpravy/jablonec-nad-nisou-autobusove-nadrazi-garaz-mrtvy-muz-svazane-nohy-podchlazeni-bezdomovec.A180130_174216_liberec-zpravy_fer, (accessed on 20 December 2021) (source): A 46-year-old (age) homeless person (gender), who was found dead on Monday 29 January 2018 (date) at a garage (place of death) near the bus terminal in the centre of Jablonec nad Nisou (locality). He died of exposure (cause of death) (confirmed by post-mortem examination).


Appendix B

| Date | Place | Event | N | Reason | Type of Death |
|---|---|---|---|---|---|
| 28–29 January 1962 | Tábor | Snowstorm | 9 | Entry of train on a blind track in the night | Derailment of the train |
| 10 October 1962 | Újezd u Brna | Fog | 13 | Loss of pilot orientation during landing | Crash of the plane into a hill |
| 9 June 1970 | Šardice | Flash flood | 34 | Breakthrough of a torrent of water into a lignite mine | Collapse of mine and torrent of mud |
| 30 October 1975 | Prague-Suchdol | Fog | 80 | Loss of pilot orientation during landing | Crash of the plane into terrain |
| 19 March 1982 | Central Bohemia | Winter weather | 9 | Snow and ice on roads | Vehicle accidents |
| 20–22 December 1986 | Bohemia | Snow | 8 | Snow on roads | Vehicle accidents |
| July 1997 | Moravia and Silesia | Flood | 61 | Extreme river discharges, flooding | Drowning, collapse of buildings, rescue work, health complications |
| 7–8 February 1999 | CR | Snow | 8 | Snow and ice on roads | Vehicle accidents |
| 5–mid-February 1999 | CR | Cold wave | 8 | Frost, bad weather in the mountains | Freezing to death/hypothermia |
| August 2002 | Bohemia | Flood | 17 | Extreme river discharges, flooding | Drowning, collapse of buildings, rescue work, health complications, other |
| 20 January–1 February 2006 | CR | Cold wave | 18 | Extreme frosts | Freezing to death/hypothermia |
| March–April 2006 | Bohemia and Moravia | Flood | 8 | Extreme river discharges, flooding | Drowning, rescue work, health complications |
| 7–17 January 2009 | CR | Cold wave | 11 | Extreme frosts | Freezing to death/hypothermia |
| 24–27 June 2009 | Moravia and Silesia | Flash floods | 14 | Water torrent | Drowning, rescue work, health complications |
| 16–20 December 2009 | CR | Cold wave | 11 | Extreme frosts | Freezing to death/hypothermia |
| 23–31 January 2010 | CR | Cold wave | 12 | Extreme frosts | Freezing to death/hypothermia |
| 7 August 2010 | Northern Bohemia | Flash flood | 8 | Water torrent | Drowning, health complications |
| 1–22 December 2010 | CR | Cold wave | 25 | Extreme frosts | Freezing to death/hypothermia |
| 16 February 2012 | CR | Cold wave | 25 | Extreme frosts | Freezing to death/hypothermia |
| 5–11 December 2012 | CR | Cold wave | 8 | Extreme frosts | Freezing to death/hypothermia |
| June 2013 | Bohemia | Flood | 17 | Extreme river discharges, flooding | Drowning, collapse of buildings, rescue work, health complications, other |
| 6–10 January 2017 | CR | Cold wave | 8 | Extreme frosts | Freezing to death/hypothermia |
| 21–28 February 2018 | CR | Cold wave | 10 | Extreme frosts | Freezing to death/hypothermia |
References
- WMO. WMO Atlas of Mortality and Economic Losses from Weather, Climate and Water Extremes (1970–2019); WMO-No. 1267; World Meteorological Organization: Geneva, Switzerland, 2021. [Google Scholar]
- UN Office for Disaster Risk Reduction: Sendai Framework for Disaster Risk Reduction 2015–2030. Available online: https://www.unisdr.org/we/inform/publications/43291 (accessed on 21 February 2022).
- Wright, N.; Fagan, L.; Lapitan, J.M.; Kayano, R.; Abrahams, J.; Huda, Q.; Murray, V. Health emergency and disaster risk management: Five years into implementation of the Sendai framework. Int. J. Disaster Risk Sci. 2020, 11, 206–217. [Google Scholar] [CrossRef]
- Robine, J.-M.; Cheung, S.L.K.; Le Roy, S.; Van Oyen, H.; Griffiths, C.; Michel, J.-P.; Herrmann, F.R. Death toll exceeded 70,000 in Europe during the summer of 2003. C. R. Biol. 2008, 331, 171–178. [Google Scholar] [CrossRef] [PubMed]
- de Castro, M.; Gomez-Gesteira, M.; Ramos, A.M.; Álvarez, I.; de Castro, P. Effects of heat waves on human mortality, Galicia, Spain. Clim. Res. 2011, 48, 333–341. [Google Scholar] [CrossRef] [Green Version]
- Vyberčki, D.; Švec, M.; Faško, P.; Savinova, H.; Trizna, M.; Mičietova, E. The effects of the 1996–2012 summer heat events on human mortality in Slovakia. Morav. Geogr. Rep. 2015, 23, 58–70. [Google Scholar] [CrossRef] [Green Version]
- Graczyk, D.; Kundzewicz, Z.W.; Choryński, A.; Førland, E.J.; Pińskwar, I.; Szwed, M. Heat-related mortality during hot summers in Polish cities. Theor. Appl. Climatol. 2019, 136, 1259–1273. [Google Scholar] [CrossRef] [Green Version]
- Vicedo-Cabrera, A.M.; Scovronick, N.; Sera, F.; Royé, D.; Schneider, R.; Tobias, A.; Astrom, C.; Guo, Y.; Honda, Y.; Hondula, D.M.; et al. The burden of heat-related mortality attributable to recent human-induced climate change. Nat. Clim. Chang. 2021, 11, 492–500. [Google Scholar] [CrossRef]
- Diakakis, M. Have flood mortality qualitative characteristics changed during the last decades? The case study of Greece. Environ. Hazards 2016, 15, 148–159. [Google Scholar] [CrossRef]
- Diakakis, M.; Deligiannakis, G. Flood fatalities in Greece: 1970–2010. J. Flood Risk Manag. 2017, 10, 115–123. [Google Scholar] [CrossRef]
- Pereira, S.; Diakakis, M.; Deligiannakis, G.; Zêzere, J.L. Comparing flood mortality in Portugal and Greece (Western and Eastern Mediterranean). Int. J. Disaster Risk Reduct. 2017, 22, 147–157. [Google Scholar] [CrossRef]
- Petrucci, O.; Aceto, L.; Bianchi, C.; Bigot, V.; Brázdil, R.; Pereira, S.; Kahraman, A.; Kiliç, Ö.; Kotroni, V.; Llasat, M.C.; et al. Flood fatalities in Europe, 1980–2018: Variability, features, and lessons to learn. Water 2019, 11, 1682. [Google Scholar] [CrossRef] [Green Version]
- Petrucci, O.; Papagiannaki, K.; Aceto, L.; Boissier, L.; Kotroni, V.; Grimalt, M.; Llasat, M.C.; Llasat-Botija, M.; Rosselló, J.; Pasqua, A.A.; et al. MEFF: The database of MEditerranean Flood Fatalities (1980 to 2015). J. Flood Risk Manag. 2019, 12, e12461. [Google Scholar] [CrossRef] [Green Version]
- Vinet, F.; Bigot, V.; Petrucci, O.; Papagiannaki, K.; Llasat, M.C.; Kotroni, V.; Boissier, L.; Aceto, L.; Grimalt, M.; Llasat-Botija, M.; et al. Mapping flood-related mortality in the Mediterranean basin. Results from the MEFF v2.0 DB. Water 2019, 11, 2196. [Google Scholar] [CrossRef] [Green Version]
- Grimalt-Gelabert, M.; Rosselló-Geli, J.; Bauzà-Llinàs, J. Flood related mortality in a touristic island: Mallorca (Balearic Islands) 1960–2018. J. Flood Risk Manag. 2020, 13, e12644. [Google Scholar] [CrossRef]
- Špitalar, M.; Brilly, M.; Kos, D.; Žiberna, A. Analysis of flood fatalities—Slovenian illustration. Water 2020, 12, 64. [Google Scholar] [CrossRef] [Green Version]
- Petrucci, O. Factors leading to the occurrence of flood fatalities: A systematic review of research papers published between 2010 and 2020. Nat. Hazards Earth Syst. Sci. 2022, 22, 71–83. [Google Scholar] [CrossRef]
- Hilker, N.; Badoux, A.; Hegg, C. The Swiss flood and landslide damage database 1972–2007. Nat. Hazards Earth Syst. Sci. 2009, 9, 913–925. [Google Scholar] [CrossRef] [Green Version]
- Haque, U.; Blum, P.; da Silva, P.F.; Andersen, P.; Pilz, J.; Chalov, S.R.; Malet, J.-P.; Auflič, M.J.; Andres, N.; Poyiadji, E.; et al. Fatal landslides in Europe. Landslides 2016, 13, 1545–1554. [Google Scholar] [CrossRef]
- Salvati, P.; Petrucci, O.; Rossi, M.; Bianchi, C.; Pasqua, A.A.; Guzzetti, F. Gender, age and circumstances analysis of flood and landslide fatalities in Italy. Sci. Total Environ. 2018, 610–611, 867–879. [Google Scholar] [CrossRef]
- Analitis, A.; Katsouyanni, K.; Biggeri, A.; Baccini, M.; Forsberg, B.; Bisanti, L.; Kirchmayer, U.; Ballester, F.; Cadum, E.; Goodman, P.G.; et al. Effects of cold weather on mortality: Results from 15 European cities within the PHEWE Project. Am. J. Epidemiol. 2008, 168, 1397–1408. [Google Scholar] [CrossRef] [PubMed] [Green Version]
- Fonseca-Rodríguez, O.; Sheridan, S.C.; Lundevaller, E.H.; Schumann, B. Effect of extreme hot and cold weather on cause-specific hospitalizations in Sweden: A time series analysis. Environ. Res. 2021, 193, 110535. [Google Scholar] [CrossRef]
- Grigorieva, E.A.; Revich, B.A. Health risks to the Russian population from temperature extremes at the beginning of the XXI century. Atmosphere 2021, 12, 1331. [Google Scholar] [CrossRef]
- Petkova, E.P.; Dimitrova, L.K.; Sera, F.; Gasparrini, A. Mortality attributable to heat and cold among the elderly in Sofia, Bulgaria. Int. J. Biometeorol. 2021, 65, 865–872. [Google Scholar] [CrossRef]
- Folkerts, M.A.; Bröde, P.; Botzen, W.J.W.; Martinius, M.L.; Gerrett, N.; Harmsen, C.N.; Daanen, H.A.M. Sex differences in temperature-related all-cause mortality in the Netherlands. Int. Arch. Occup. Environ. Health 2022, 95, 249–258. [Google Scholar] [CrossRef] [PubMed]
- Elsom, D.M. Deaths and injuries caused by lightning in the United Kingdom: Analyses of two databases. Atmos. Res. 2001, 56, 325–334. [Google Scholar] [CrossRef]
- Elsom, D.M.; Webb, J.D.C. Deaths and injuries from lightning in the UK, 1988–2012. Weather 2014, 69, 221–226. [Google Scholar] [CrossRef] [Green Version]
- Holle, R.L. A summary of recent national-scale lightning fatality studies. Weather Clim. Soc. 2016, 8, 35–42. [Google Scholar] [CrossRef]
- Antonescu, B.; Cărbunaru, F. Lightning-related fatalities in Romania from 1999 to 2015. Weather Clim. Soc. 2018, 10, 241–252. [Google Scholar] [CrossRef]
- Trigo, R.M.; Ramos, C.; Pereira, S.S.; Ramos, A.M.; Zêzere, J.L.; Liberato, M.L.R. The deadliest storm of the 20th century striking Portugal: Flood impacts and atmospheric circulation. J. Hydrol. 2016, 541A, 597–610. [Google Scholar] [CrossRef]
- Taszarek, M.; Gromadzki, J. Deadly tornadoes in Poland from 1820 to 2015. Mon. Weather Rev. 2017, 145, 1221–1243. [Google Scholar] [CrossRef]
- Salvador, C.; Nieto, R.; Linares, C.; Díaz, J.; Gimeno, L. Short-term effects of drought on daily mortality in Spain from 2000 to 2009. Environ. Res. 2020, 183, 109200. [Google Scholar] [CrossRef] [PubMed]
- Badoux, A.; Andres, N.; Techel, F.; Hegg, C. Natural hazard fatalities in Switzerland from 1946 to 2015. Nat. Hazards Earth Syst. Sci. 2016, 16, 2747–2768. [Google Scholar] [CrossRef] [Green Version]
- Petrucci, O.; Salvati, P.; Aceto, L.; Bianchi, C.; Pasqua, A.A.; Rossi, M.; Guzzetti, F. The vulnerability of people to damaging hydrogeological events in the Calabria Region (Southern Italy). Int. J. Environ. Res. Public Health 2018, 15, 48. [Google Scholar] [CrossRef] [PubMed] [Green Version]
- Psistaki, K.; Paschalidou, A.K.; McGregor, G. Weather patterns and all-cause mortality in England, UK. Int. J. Biometeorol. 2020, 64, 123–136. [Google Scholar] [CrossRef]
- Bergel-Hayat, R.; Debbarha, M.; Antonioub, C.; Yannis, G. Explaining the road accident risk: Weather effects. Accident Anal. Prev. 2013, 60, 456–465. [Google Scholar] [CrossRef] [Green Version]
- Chakrabarty, N.; Gupta, K. Analysis of driver behaviour and crash characteristics during adverse weather conditions. Procedia–Soc. Behav. Sci. 2013, 104, 1048–1057. [Google Scholar] [CrossRef] [Green Version]
- Vajda, A.; Tuomenvirta, H.; Juga, I.; Nurmi, P.; Jokinen, P.; Rauhala, J. Severe weather affecting European transport systems: The identification, classification and frequencies of event. Nat. Hazards 2014, 72, 169–188. [Google Scholar] [CrossRef]
- Mohammed, A.A.; Ambak, K.; Mosa, A.M.; Syamsunur, D. A review of the traffic accidents and related practices worldwide. Open Transp. J. 2019, 13, 65–83. [Google Scholar] [CrossRef] [Green Version]
- Zou, Y.; Zhang, Y.; Cheng, K. Exploring the impact of climate and extreme weather on fatal traffic accidents. Sustainability 2021, 13, 390. [Google Scholar] [CrossRef]
- Sharif, H.O.; Hossain, M.M.; Jackson, T.; Bin-Shafique, S. Person-place-time analysis of vehicle fatalities caused by flash floods in Texas. Geomat. Nat. Hazards Risk 2012, 3, 311–323. [Google Scholar] [CrossRef] [Green Version]
- Enríquez-de-Salamanca, Á. Victims crossing overflowing watercourses with vehicles in Spain. J. Flood Risk Manag. 2020, 13, e12645. [Google Scholar] [CrossRef]
- Eisenberg, D.; Warner, K.E. Effects of snowfalls on motor vehicle collisions, injuries, and fatalities. Am. J. Public Health 2005, 95, 120–124. [Google Scholar] [CrossRef] [PubMed]
- Black, A.W.; Mote, T.L. Effects of winter precipitation on automobile collisions, injuries, and fatalities in the United States. J. Transp. Geogr. 2015, 48, 165–175. [Google Scholar] [CrossRef]
- Jackson, T.L.; Sharif, H.O. Rainfall impacts on traffic safety: Rain-related fatal crashes in Texas. Geomat. Nat. Hazards Risk 2016, 7, 843–860. [Google Scholar] [CrossRef] [Green Version]
- Tobin, D.M.; Kumjian, M.R.; Black, A.W. Characteristics of recent vehicle-related fatalities during active precipitation in the United States. Weather Clim. Soc. 2019, 11, 935–952. [Google Scholar] [CrossRef]
- Han, Z.; Sharif, H.O. Investigation of the relationship between rainfall and fatal crashes in Texas, 1994–2018. Sustainability 2020, 12, 7976. [Google Scholar] [CrossRef]
- Han, Z.; Sharif, H.O. Vehicle-related flood fatalities in Texas, 1959–2019. Water 2020, 12, 2884. [Google Scholar] [CrossRef]
- Kyselý, J.; Kříž, B. Decreased impacts of the 2003 heat waves on mortality in the Czech Republic: An improved response? Int. J. Biometeorol. 2008, 52, 733–745. [Google Scholar] [CrossRef] [PubMed]
- Kyselý, J.; Plavcová, E. Declining impacts of hot spells on mortality in the Czech Republic, 1986–2009: Adaptation to climate change? Clim. Chang. 2012, 113, 437–453. [Google Scholar] [CrossRef]
- Knobová, V.; Hůnová, I.; Malý, M.; Braniš, M. Vliv vln vedra v létě 2003 a 2006 na úmrtnost obyvatel Prahy (Heat wave effect on mortality in Prague in summer 2003 and 2006). Meteorol. Zpr. 2014, 67, 33–40. [Google Scholar]
- Hanzlíková, H.; Plavcová, E.; Kynčl, J.; Kříž, B.; Kyselý, J. Contrasting patterns of hot spell effects on morbidity and mortality for cardiovascular diseases in the Czech Republic, 1994–2009. Int. J. Biometeorol. 2015, 59, 1673–1684. [Google Scholar] [CrossRef]
- Urban, A.; Hanzlíková, H.; Kyselý, J.; Plavcová, E. Impacts of the 2015 heat waves on mortality in the Czech Republic—A comparison with previous heat waves. Int. J. Environ. Res. Public Health 2017, 14, 1562. [Google Scholar] [CrossRef] [Green Version]
- Arsenović, D.; Lehnert, M.; Fiedor, D.; Šimáček, P.; Středová, H.; Středa, T.; Savić, S. Heat-waves and mortality in Czech cities: A case study for the summers of 2015 and 2016. Geogr. Pannonica 2019, 23, 162–172. [Google Scholar] [CrossRef] [Green Version]
- Urban, A.; Kyselý, J.; Plavcová, E.; Hanzlíková, H.; Štěpánek, P. Temporal changes in years of life lost associated with heat waves in the Czech Republic. Sci. Total Environ. 2020, 716, 137093. [Google Scholar] [CrossRef]
- Kyselý, J.; Pokorná, L.; Kyncl, J.; Kříž, B. Excess cardiovascular mortality associated with cold spells in the Czech Republic. BMC Public Health 2009, 9, 19. [Google Scholar] [CrossRef] [PubMed] [Green Version]
- Plavcová, E.; Urban, A. Intensified impacts on mortality due to compound winter extremes in the Czech Republic. Sci. Total Environ. 2020, 746, 141033. [Google Scholar] [CrossRef]
- Hanzlíková, H.; Kyselý, J.; Plavcová, E. Vliv horkých a studených vln na kardiovaskulární úmrtnost a nemocnost v České republice (Hot and cold spell effects on cardiovascular mortality and hospital admissions in the Czech Republic). Meteorol. Zpr. 2016, 69, 74–82. [Google Scholar]
- Brazdova, M.; Riha, J. A simple model for the estimation of the number of fatalities due to floods in central Europe. Nat. Hazards Earth Syst. Sci. 2014, 14, 1663–1676. [Google Scholar] [CrossRef] [Green Version]
- Brázdil, R.; Chromá, K.; Řehoř, J.; Zahradníček, P.; Dolák, L.; Řezníčková, L.; Dobrovolný, P. Potential of documentary evidence to study fatalities of hydrological and meteorological events in the Czech Republic. Water 2019, 11, 2014. [Google Scholar] [CrossRef] [Green Version]
- Brázdil, R.; Chromá, K.; Dolák, L.; Řehoř, J.; Řezníčková, L.; Zahradníček, P.; Dobrovolný, P. Fatalities associated with the severe weather conditions in the Czech Republic, 2000–2019. Nat. Hazards Earth Syst. Sci. 2021, 21, 1355–1382. [Google Scholar] [CrossRef]
- Brázdil, R.; Chromá, K.; Zahradníček, P.; Dobrovolný, P.; Dolák, L. Weather and traffic accidents in the Czech Republic, 1979–2020. Theor. Appl. Climatol. 2022. [Google Scholar] [CrossRef]
- Tolasz, R.; Míková, T.; Valeriánová, A.; Voženílek, V. Atlas podnebí Česka (Climate Atlas of Czechia); Český hydrometeorologický ústav, Univerzita Palackého v Olomouci: Praha, Olomouc, Czech Republic, 2007. [Google Scholar]
- Český statistický úřad (Czech Statistical Office). Available online: https://www.czso.cz/ (accessed on 20 February 2022).
- Český statistický úřad—Veřejná databáze (Czech Statistical Office—Public Database). Available online: https://vdb.czso.cz/vdbvo2/ (accessed on 20 February 2022).
- Vintr, J. Analýza hydrometeorologických extrémů v České republice na základě novinových článků (Analysis of hydrometeorological extremes in the Czech Republic based on newspaper reports). Master’s Thesis, Masarykova Univerzita, Brno, Czech Republic, 2020. [Google Scholar]
- Mann, H.B. Non-parametric tests against trend. Econometrica 1945, 13, 163–171. [Google Scholar] [CrossRef]
- Kendall, M.G. Rank Correlation Methods, 4th ed.; Charles Griffin: London, UK, 1975. [Google Scholar]
- Theil, H. A rank-invariant method of linear and polynomial regression analysis. In Henri Theil’s Contributions to Economics and Econometrics; Advanced Studies in Theoretical and Applied Econometrics, 23; Raj, B., Koerts, J., Eds.; Springer: Dordrecht, Switzerland, 1992; pp. 345–381. [Google Scholar] [CrossRef]
- Sen, P.K. Estimates of the regression coefficient based on Kendall’s tau. J. Amer. Stat. Assoc. 1968, 63, 1379–1389. [Google Scholar] [CrossRef]
- Sprinthall, R.C. Basic Statistical Analysis, 9th ed.; Pearson Education: New York, NY, USA, 2011. [Google Scholar]
- Hladný, J.; Krátká, M.; Kašpárek, L. August 2002 Catastrophic Flood in the Czech Republic; Ministry of the Environment of the Czech Republic: Prague, Czech Republic, 2004. [Google Scholar]
- Hostýnek, J.; Novák, M.; Žák, M. Kyrill a Emma v Česku—Meteorologické příčiny, průběh bouří s hodnocením větrných extrémů (The Kyrill and Emma storms in Czechia—Meteorological causes and the course of the storms, with evaluation of wind extremes). Meteorol. Zpr. 2008, 61, 65–71. [Google Scholar]
- Hujslová, J.; Šimandl, P. Bouře Herwart v Česku (The storm Herwart in Czechia). Meteorol. Zpr. 2018, 71, 60–63. [Google Scholar]
- Poláček, D.; Švec, P. Fatální chyba v mlze. Jak se odehrála největší letecká katastrofa v historii Česka (Fatal error in fog. These were the conditions of the largest airplane catastrophe in the history of Czechia). Available online: https://zpravy.aktualne.cz/domaci/foto-unikatni-snimky-uplynulo-45-let-co-prazsky-suchdol-zdev/r~0d10bfd01ab411eb9d74ac1f6b220ee8/ (accessed on 15 December 2021).
- Krupka, J. Jsou to jatka, volali zdravotníci. Pád letadla v Suchdole nepřežily desítky lidí (It is carnage, declared the paramedics. Dozens of people were killed in a plane crash in Suchdol). Available online: https://zdarsky.denik.cz/zpravy-z-ceska/havarie-letadla-v-suchdole.html (accessed on 15 December 2021).
- V Újezdu u Brna odhalili pomník jedné z největších leteckých katastrof (The memorial to one of the largest plane disasters was unveiled at Újezd u Brna). Available online: https://ct24.ceskatelevize.cz/archiv/1095541-v-ujezdu-u-brna-odhalili-pomnik-jedne-z-nejhorsich-leteckych-katastrof (accessed on 15 December 2021).
- Havárie dvou letadel z Francie (An accident of two planes from France). Rudé právo, 25 April 1992; p. 2.
- Smrt v 17.32 (A death at 17:32). Rudé právo, 27 April 1992; p. 4.
- Smrtící past pod Smědavou (A death trap under Smědava). Rudé právo, 29 April 1992; p. 4.
- Zêzere, J.; Pereira, S.; Tavales, A.; Bateira, C.; Trigo, R.; Quaresma, I.; Santos, P.; Santos, M.; Verde, J. DISASTER: A GIS database on hydro-geomorphologic disasters in Portugal. Nat. Hazards 2014, 72, 503–532. [Google Scholar] [CrossRef]
- Vinet, F.; Boissier, L.; Saint-Martin, C. Flashflood-related mortality in southern France: First results from a new database. In: 3rd European Conference on Flood Risk Management (FLOODrisk 2016). E3S Web Conf. 2016, 7, 06001. [Google Scholar] [CrossRef] [Green Version]
- Aceto, L.; Pasqua, A.A.; Petrucci, O. Effects of damaging hydrogeological events on people throughout 15 years in a Mediterranean region. Adv. Geosci. 2017, 44, 67–77. [Google Scholar] [CrossRef] [Green Version]
- Sharma, S.; Blagrave, K.; Watson, S.R.; O’Reilly, C.M.; Batt, R.; Magnuson, J.J.; Clemens, T.; Denfeld, B.A.; Flaim, G.; Hori, Y.; et al. Increased winter drownings in ice-covered regions with warmer winters. PLoS ONE 2020, 15, e0241222. [Google Scholar] [CrossRef]
- Brázdil, R.; Zahradníček, P.; Dobrovolný, P.; Řehoř, J.; Trnka, M.; Lhotka, O.; Štěpánek, P. Circulation and climate variability in the Czech Republic between 1961 and 2020: A comparison of changes for two “normal” periods. Atmosphere 2022, 13, 137. [Google Scholar] [CrossRef]
- Zahradníček, P.; Brázdil, R.; Řehoř, J.; Lhotka, O.; Dobrovolný, P.; Štěpánek, P.; Trnka, M. Temperature extremes and circulation types in the Czech Republic, 1961–2020. Int. J. Climatol. 2022. [Google Scholar] [CrossRef]
- Brázdil, R.; Řezníčková, L.; Havlíček, M.; Elleder, L. Floods in the Czech Republic. In Changes in Flood Risk in Europe; IAHS Special Publication, 10; Kundzewicz, Z.W., Ed.; IAHS Press and CRC Press/Balkema: Wallingford, UK, 2012; pp. 178–198. [Google Scholar]
- Blöschl, G.; Kiss, A.; Viglione, A.; Barriendos, M.; Böhm, O.; Brázdil, R.; Coeur, D.; Demarée, G.; Carmen Llasat, M.; Macdonald, N.; et al. Current European flood-rich period exceptional compared with past 500 years. Nature 2020, 583, 560–566. [Google Scholar] [CrossRef] [PubMed]
- Franzke, C.L.E.; Torelló i Sentelles, H. Risk of extreme high fatalities due to weather and climate hazards and its connection to large-scale climate variability. Clim. Chang. 2020, 162, 507–525. [Google Scholar] [CrossRef]
- Halásová, O.; Brázdil, R. Flash floods in Moravia and Silesia during the nineteenth and twentieth centuries. Geografie 2020, 125, 117–137. [Google Scholar] [CrossRef]
- Brázdil, R.; Zahradníček, P.; Dobrovolný, P.; Štěpánek, P.; Trnka, M. Observed changes in precipitation during recent warming: The Czech Republic, 1961–2019. Int. J. Climatol. 2021, 41, 3881–3902. [Google Scholar] [CrossRef]
- Singh, O.; Singh, J. Lightning fatalities over India: 1979–2011. Meteorol. Appl. 2015, 22, 770–778. [Google Scholar] [CrossRef]
- Tobin, D.M.; Kumjian, M.R.; Black, A.W. Effects of precipitation type on crash relative risk estimates in Kansas. Accident Anal. Prev. 2021, 151, 105946. [Google Scholar] [CrossRef]
- Andrey, J.; Karlis, D.; Wets, G. Long-term trends in weather-related crash risks. J. Transp. Geogr. 2010, 18, 247–258. [Google Scholar] [CrossRef]
- Police of the Czech Republic. Statistika nehodovosti (Statistics of Accidents). Available online: https://www.policie.cz/clanek/statistika-nehodovosti-900835.aspx (accessed on 14 June 2021).
- Vývoj počtu usmrcených osob od roku 1961 (The development of the number of fatalities since 1961). Available online: https://www.policie.cz/soubor/1-2015-12-grafy-pdf.aspx (accessed on 15 February 2022).
- Skácal, L. Hloubková analýza mezinárodního srovnání dopravní nehodovosti v ČR (The detail analysis of traffic accidents in the CR in the international comparison). Observatoř bezpečnosti silničního provozu, říjen 2007. Available online: https://www.czrso.cz/clanek/hloubkova-analyza-mezinarodniho-srovnani-dopravni-nehodovosti-v/?id=1402 (accessed on 14 June 2021).
- ETSC—European Transport Safety Council. Road Deaths in the European Union—Latest Data. Available online: https://etsc.eu/euroadsafetydata/ (accessed on 10 March 2021).
- Pomník Jiřího Krýsla (Memorial of Jiří Krýsl). Available online: https://cs.wikipedia.org/wiki/Soubor:Kocaba-2007-05-19-PomnikJirihoKrysla.JPG (accessed on 20 December 2021).


| Period | Char. | Weather Category | Total | ||||||
|---|---|---|---|---|---|---|---|---|---|
| 1 | 2 | 3 | 4 | 5 | 6 | 7 | |||
| 1961–1990 | (a) | 130 | 41 | 102 | 47 | 198 | 124 | 15 | 657 |
| (b) | 19.8 | 6.2 | 15.5 | 7.2 | 30.1 | 18.9 | 2.3 | 100.0 | |
| 1991–2020 | (a) | 217 | 60 | 62 | 47 | 522 | 17 | 37 | 962 |
| (b) | 22.6 | 6.2 | 6.4 | 4.9 | 54.3 | 1.8 | 3.8 | 100.0 | |
| 1961–2020 | (a) | 347 | 101 | 164 | 94 | 720 | 141 | 52 | 1619 |
| (b) | 21.4 | 6.3 | 10.1 | 5.8 | 44.5 | 8.7 | 3.2 | 100.0 | |
| Period | Char. | Weather Conditions | Total | ||||
|---|---|---|---|---|---|---|---|
| 1 | 2 | 3 | 4 | 5 | |||
| 1961–1990 | (a) | 276 | 253 | 239 | 130 | 1 | 899 |
| (b) | 30.7 | 28.1 | 26.6 | 14.5 | 0.1 | 100.0 | |
| 1991–2020 | (a) | 359 | 201 | 316 | 45 | 14 | 935 |
| (b) | 38.4 | 21.5 | 33.8 | 4.8 | 1.5 | 100.0 | |
| 1961–2020 | (a) | 635 | 454 | 555 | 175 | 15 | 1834 |
| (b) | 34.6 | 24.8 | 30.3 | 9.5 | 0.8 | 100.0 | |
Publisher’s Note: MDPI stays neutral with regard to jurisdictional claims in published maps and institutional affiliations. |
© 2022 by the authors. Licensee MDPI, Basel, Switzerland. This article is an open access article distributed under the terms and conditions of the Creative Commons Attribution (CC BY) license (https://creativecommons.org/licenses/by/4.0/).
Share and Cite
Brázdil, R.; Chromá, K.; Zahradníček, P.; Dobrovolný, P.; Dolák, L.; Řehoř, J.; Řezníčková, L. Changes in Weather-Related Fatalities in the Czech Republic during the 1961–2020 Period. Atmosphere 2022, 13, 688. https://doi.org/10.3390/atmos13050688
Brázdil R, Chromá K, Zahradníček P, Dobrovolný P, Dolák L, Řehoř J, Řezníčková L. Changes in Weather-Related Fatalities in the Czech Republic during the 1961–2020 Period. Atmosphere. 2022; 13(5):688. https://doi.org/10.3390/atmos13050688
Chicago/Turabian StyleBrázdil, Rudolf, Kateřina Chromá, Pavel Zahradníček, Petr Dobrovolný, Lukáš Dolák, Jan Řehoř, and Ladislava Řezníčková. 2022. "Changes in Weather-Related Fatalities in the Czech Republic during the 1961–2020 Period" Atmosphere 13, no. 5: 688. https://doi.org/10.3390/atmos13050688