Article

Environmental Effects on Normalized Gross Primary Productivity in Beech and Norway Spruce Forests

1
Global Change Research Institute CAS, Bĕlidla 986/4a, 603 00 Brno, Czech Republic
2
Department of Agrosystems and Bioclimatology, Faculty of Agronomy, Mendel University in Brno, Zĕmĕdelská 1, 613 00 Brno, Czech Republic
3
Earth Observation Research and Innovation Centre, University of Energy and Natural Resources, Sunyani P.O. Box 214, Ghana
4
Faculty of Forestry and Wood Technology, Mendel University in Brno, Zĕmĕdelská 1, 613 00 Brno, Czech Republic
5
Department of Spatial Planning, Institute of Management, Slovak University of Technology in Bratislava, 81107 Bratislava, Slovakia
*
Author to whom correspondence should be addressed.
Atmosphere 2021, 12(9), 1128; https://doi.org/10.3390/atmos12091128
Submission received: 5 July 2021 / Revised: 24 August 2021 / Accepted: 27 August 2021 / Published: 1 September 2021
(This article belongs to the Special Issue Frontiers in Quantifying CO2 Uptake by Forests)

Abstract

:
The strong effects of climate change are expected to negatively impact the long-term resilience and function of forest ecosystems, which could lead to changes in forest carbon balance and productivity. However, these forest responses may vary with local conditions and forest types. Accordingly, this study was carried out to determine gross primary productivity (GPP) sensitivity to changes in environmental parameters. Central European beech (at Štítná) and spruce species (at Bílý Kr̆íz̆ and Rájec), growing under contrasting climatic conditions, were studied. The comparative analyses of GPP were based on a five-year-long dataset of eddy covariance fluxes during the main growing season (2012–2016). Results of forest GPP responses with changes in environmental factors from a traditional Stepwise multiple linear regression model (SMLR) were used and compared with Random forest (RF) analyses. To demonstrate how actual GPP trends compare to potential GPP (GPPpot) courses expected under near-optimal environmental conditions, we computed normalized GPP (GPPnorm) with values between 0 and 1 as the ratio of the estimated daily sum of GPP to GPPpot. The study confirmed the well-known effect of total intensity of the photosynthetically active radiation and its diffuse fraction on GPPnorm across all the forest types. However, the study also showed the secondary effects of other environmental variables on forest productivity depending on the species and local climatic conditions. The reduction in forest productivity at the beech forest in Štítná was presumed to be mainly induced by edaphic drought (anisohydric behaviour). In contrast, reduced forest productivity at the spruce forest sites was presumably induced by both meteorological and hydrological drought events, especially at the moderately dry climate in Rájec. Overall, our analyses call for more studies on forest productivity across different forest types and contrasting climatic conditions, as this productivity is strongly dependent on species type and site-specific environmental conditions.

1. Introduction

Gross primary productivity (GPP) constitutes an essential part of net ecosystem CO2 exchange (NEE) between the atmosphere and the forest ecosystems [1,2,3]. GPP provides important information about the photosynthetic capacity of the ecosystem and is modulated by numerous environmental factors leading to changes in forest growth [4,5,6,7]. Nonetheless, the accurate quantification of forest GPP on a global scale remains challenging due to the spatio-temporal heterogeneity of forest ecosystems [8]. At the plot scale (within the area of the flux-tower footprint), the eddy covariance (EC) technique has emerged as a direct state-of-the-art approach to study the seasonality of carbon fluxes between the atmosphere and forest ecosystems, and thus represents an indirect yet reliable measure of GPP [9,10,11,12].
Seasonal trends of GPP demonstrate the forest response to variations in environmental factors. However, these forest responses vary from site to site depending on the species, age, local climate, and additional factors. For instance, rising temperatures within the optimum range and water availability in most temperate forest ecosystems is positive to reduce the freezing stresses and increase ecosystem productivity by enhancing the rate of ecosystem photosynthesis. However, higher temperatures (beyond the optimum level) may induce varying physiological and biochemical responses to heat stress at different forest ecosystems based on the acclimation processes of specific plant species to changes in their environment [13,14]. Such contrasting GPP responses (due to the shift in plant functional traits) of specific species to different environmental stress conditions at different sites are poorly understood [15]. Therefore, through ecosystem carbon flux measurements, physiological responses of individual plant species to certain climatic anomalies such as heat and water stress can be studied [16,17]. Furthermore, as multiple climatic factors affect forest carbon uptake, there is the need to identify near-optimal environmental conditions for different species, under which GPP can reach maximal theoretically attainable values termed potential GPP (GPPpot).
GPP is primarily driven by available photosynthetically active radiation (PAR) coupled with other physiological processes like stomatal conductance that control carbon fluxes between the ecosystem and the atmosphere [18,19]. Moreover, the physiological processes that affect carbon uptake are also affected by complex interactions between a set of environmental drivers, including the quality of incoming solar radiation, temperature, atmospheric humidity, and soil moisture [18,20]. For example, the work in [19] has shown that photosynthesis of the upper spruce canopy could be severely depressed during clear sunny days due to the abrupt closure of stomata under high values of vapour pressure deficit. However, under cloudy conditions, the rate of photosynthesis of the lower spruce canopy increases due to the effective penetration of anisotropic diffuse radiation into the canopy, thus leading to an enhanced carbon gain and light use efficiency [21].
The main goal of this study is to determine the main environmental variables influencing the ratio between observed GPP and GPPpot of three forest ecosystems with contrasting plant species using two types of regression models. Forests dominated by Norway spruce (Picea abies (L.) Karst.) and European beech (Fagus sylvatica L.) were selected for this study due to their sensitivity to climate and high commercial and ecological importance in Central Europe [22,23]. Furthermore, the current distribution of spruce species at often unsuitable locations with sub-optimal climate conditions make them vulnerable to both biotic and abiotic stresses [24,25,26,27]. Thus, it is important to study the physiological responses of different plant species to the local environmental conditions across different forest sites. EC data were collected from two Norway spruce forest sites (Bílý Kr̆íz̆ and Rájec) with distinct climatic conditions, and a beech forest (Štítná) from 2012–2016 during the main growing season (May–September) to exclude the impact of phenology.

2. Materials and Methods

2.1. Sites Description

This study uses multi-year (2012–2016) EC measurements from three forest ecosystem stations located in the Czech Republic (Central Europe) that are part of the CzeCOS (Czech Carbon Observation System; http://www.czecos.cz/, accessed on 6 March 2021) and FLUXNET Network (Flux Tower Network; https://fluxnet.fluxdata.org/, accessed on 6 March 2021). FLUXNET site IDs are CZ-BK1 (wet spruce forest at Bílý Kr̆íz̆), CZ-RAJ (dry spruce forest at Rájec), and CZ-Stn (beech forest at Štítná). CZ-BK1 is also a candidate for ICOS (Integrated Carbon Observation System; https://www.icos-cp.eu/, accessed on 6 March 2021) network. All forest stands are even-aged monocultures. Their main characteristics are presented in (Table 1). The reference evapotranspiration amount at each forest stand was computed from in situ data and was additionally used for quantifying the atmospheric evaporative demand from 2012 to 2016.

2.2. Eddy Covariance and Ancillary Measurements

At each station, the EC system consisted of an infrared gas analyzer (LI-COR, Lincoln, NE, USA) and an ultrasonic anemometer (Gill Instruments, Lymington, UK) measuring at 20 Hz frequency (detailed description in Table A1). Each system was mounted on a tower at height above the forest canopy (as specified in Table A1). EC measurements were complemented by an extensive set of sensors to collect the required auxiliary meteorological data.
Measurements included air temperature (Tair) and relative humidity at the top of the forest canopy with the EMS33 temperature and humidity sensors (Embedded Moisture Sensor, Vancouver, BC, Canada). Hourly precipitation (P) was determined using a Precipitation Gauge 386C (Met One Instruments, Grants Pass, OR, USA). Measurements for the incoming photosynthetic active radiation (PAR) were made with a LI-190R Quantum Sensor (LI-COR, NE, USA) at both Bílý Kr̆íz̆ and Štítná and with an EMS12 sensor (EMS, CZ) at Rájec. Additionally, profiles of soil moisture were measured using the CS616 (Campbell Scientific, North Logan, UT, USA) sensors at both spruce forest sites (in Bílý Kr̆íz̆ and Rájec) and with the ThetaProbe (ML2x 355, Delta-T, Burwell, UK) sensors at Štítná. An overall description of the instrumentation at the study sites including soil temperature measurements (Ts) is given in Table A2.
To analyze the effects of diffuse and direct radiation on daily mean GPP values, the dataset was divided into sunny and cloudy days based on the clearness index (CNI). CNI is defined as the ratio of solar irradiation transmitted through the atmosphere onto the Earth’s surface relative to extraterrestrial irradiation. Sunny days were classified as days with CNI > 0.7 during daytime hours, cloudy days were characterized with CNI < 0.4, and CNI values of 0.4–0.7 were grouped as partly cloudy days [30].
The vapour pressure deficit (VPD; hPa) for each site was computed from Tair ( C) and relative air humidity (RH; %) according to [31]. The daily sum of PAR (MJ m−2 day−1) was derived following the work in [32].

2.3. Soil Water Content Simulations

As the soil volumetric water content (SVWC) was not measured over the entire period of the study (the measurements started at the beginning of 2016), the simulated daily SVWC was used. The simulations were performed by soil water balance model R-4ET (R package for Empirical Estimate of Ecosystem EvapoTranspiration, [33]). This soil water balance model was calibrated using the Bayesian statistics implemented in the R package BayesianTools [34] with Differential-Evolution Markov chain Monte Carlo sampler. In calibration using the Bayesian statistics, the model input parameters were updated iteratively to provide a probability distribution of the calibrated parameters representing the uncertainty in the measured data and structure of the model. These simulations were repeated several times (4.8 × 10⁶), with the first 1.8 × 10⁶ simulations based on the prior distribution and the remaining 3 × 10⁶ runs restricted by the posterior distribution that resulted from the first set of processes. This high number of iterations was significant in attaining a good input parameter convergence with narrow distribution. The Gelman diagnostics based on a criterion for potential scale reduction factor (less than 1.2 for all parameters) as used in [35,36] was used to inspect the convergence. Additionally, a final selection of parameters from their probability distributions was made using a maximum posteriori probability estimate.
Moreover, the input variables for the soil water balance model comprised meteorological data and leaf area index (see in [33] for more details). The soil at each of the sites was then stratified into 12 layers, increasing in thickness with depth to ~3 m. These soil layers were selected in a manner that matched the depths of all sensors with an extra ±2.5 cm due to the volume measured by these sensors. At all sites, the available SVWC measurements were available throughout the main root zone region. At the wet spruce forest site in Bílý Kr̆íz̆, the CS616 (Campbell Scientific, Inc., Logan, UT, USA) sensors were placed and measured at depths of 0.05, 0.1, 0.22, 0.34, and 0.42 m. Furthermore, at the dry spruce forest site in Rájec, the same type of sensors was placed and measured at depths of 0.05, 0.1, 0.2, 0.5, and 0.8 m. At the beech forest site in Štítná, the ThetaProbe (ML2x 355, Delta-T, UK) sensors were placed and measured at depths of 0.05, 0.1, 0.3, 0.6, and 0.9 m. The optimized model parameters included soil parameters such as the SVWC at saturation, field capacity, wilting point, and saturated hydraulic conductivity—all optimized at all 12 depths [33]. There were also additional single parameters of relevance to the SVWC simulations, which were optimized. These included the rooting depth with the Beta parameter, which described the root profile shape [37], surface resistance and the degree of isohydricity [38], the water interception capacity of leaf and bark area, and curve number representing a runoff parameter [33]. A uniform distribution of priors was applied if the lower and upper limits were set to be within ±50% of the values based on field measurements of wilting point, field capacity, and saturated water content and ±100% for the remaining parameters that were estimated from literature or previous anecdotal analysis. In providing the model with sufficient spin-up time to stabilize and provide reliable and robust parameterization, the model simulations were initiated at the start of 2010 with initial conditions of SVWC set to the field capacity estimated from soil texture (note that 2010 was one of the wettest years across all forest sites according to a computed standardized precipitation-evapotranspiration index over the region). Overall, the entire simulation was conducted from 2010–2019, with the observed data for the Bayesian calibration spanning from 2016 to 2019. The simulated SVWC averaged over all the depths produced a root mean square error of 0.037 m3 m−3 at the wet spruce forest site in Bílý Kr̆íz̆, 0.017 m3 m−3 for the dry spruce forest site in Rájec and 0.032 m3 m−3 for the beech forest site in Štítná, suggesting realistic SVWC estimates.

2.4. Data Processing and Analysis

2.4.1. Turbulent Flux Measurements

Across all the three study forests, the EC data from the main growing season (May–September) of 2012–2016 were used for the analyses. Processing of EC data (wind components, sonic temperature, CO2, and water vapour mixing ratios) was performed using an open-source software EddyPro (Li-COR, Lincoln, NE, USA). The most recent methods for flux corrections, conversions, and thorough quality control scheme [39,40] were applied. This process involves raw data despiking and statistical screening, basic quality checking of turbulent fluxes (i.e., flux stationarity and integral turbulence characteristics tests), coordinate rotation using the planar fit method [41], spectral correction [42,43,44], detecting and compensating for time lags of signals from the ultrasonic anemometer and the gas analyzer [43], footprint estimation and calculating half-hourly final fluxes. Flux measurements over periods with insufficiently developed turbulence, i.e., low friction velocity (u*) were detected and filtered out. This filtering procedure, according to the most current methodology [45], assured the exclusion of CO2 fluxes not necessarily representative of the ecosystem-scale biotic flux due to insufficient mixing across the canopy [46,47,48].
The R software [49] package ‘REddyProc’ [45] was used to gap-fill the EC data at all sites, using marginal distribution sampling [47]. CO2 flux (subsequently considered to be equal to NEE) was partitioned into GPP and ecosystem respiration (Reco). The flux partitioning approach by [47] using daytime data was applied to estimate half-hourly GPP (( μ mol m−2 s−1)) values. The half-hourly GPP values were aggregated to obtain daily and monthly sums of GPP values.

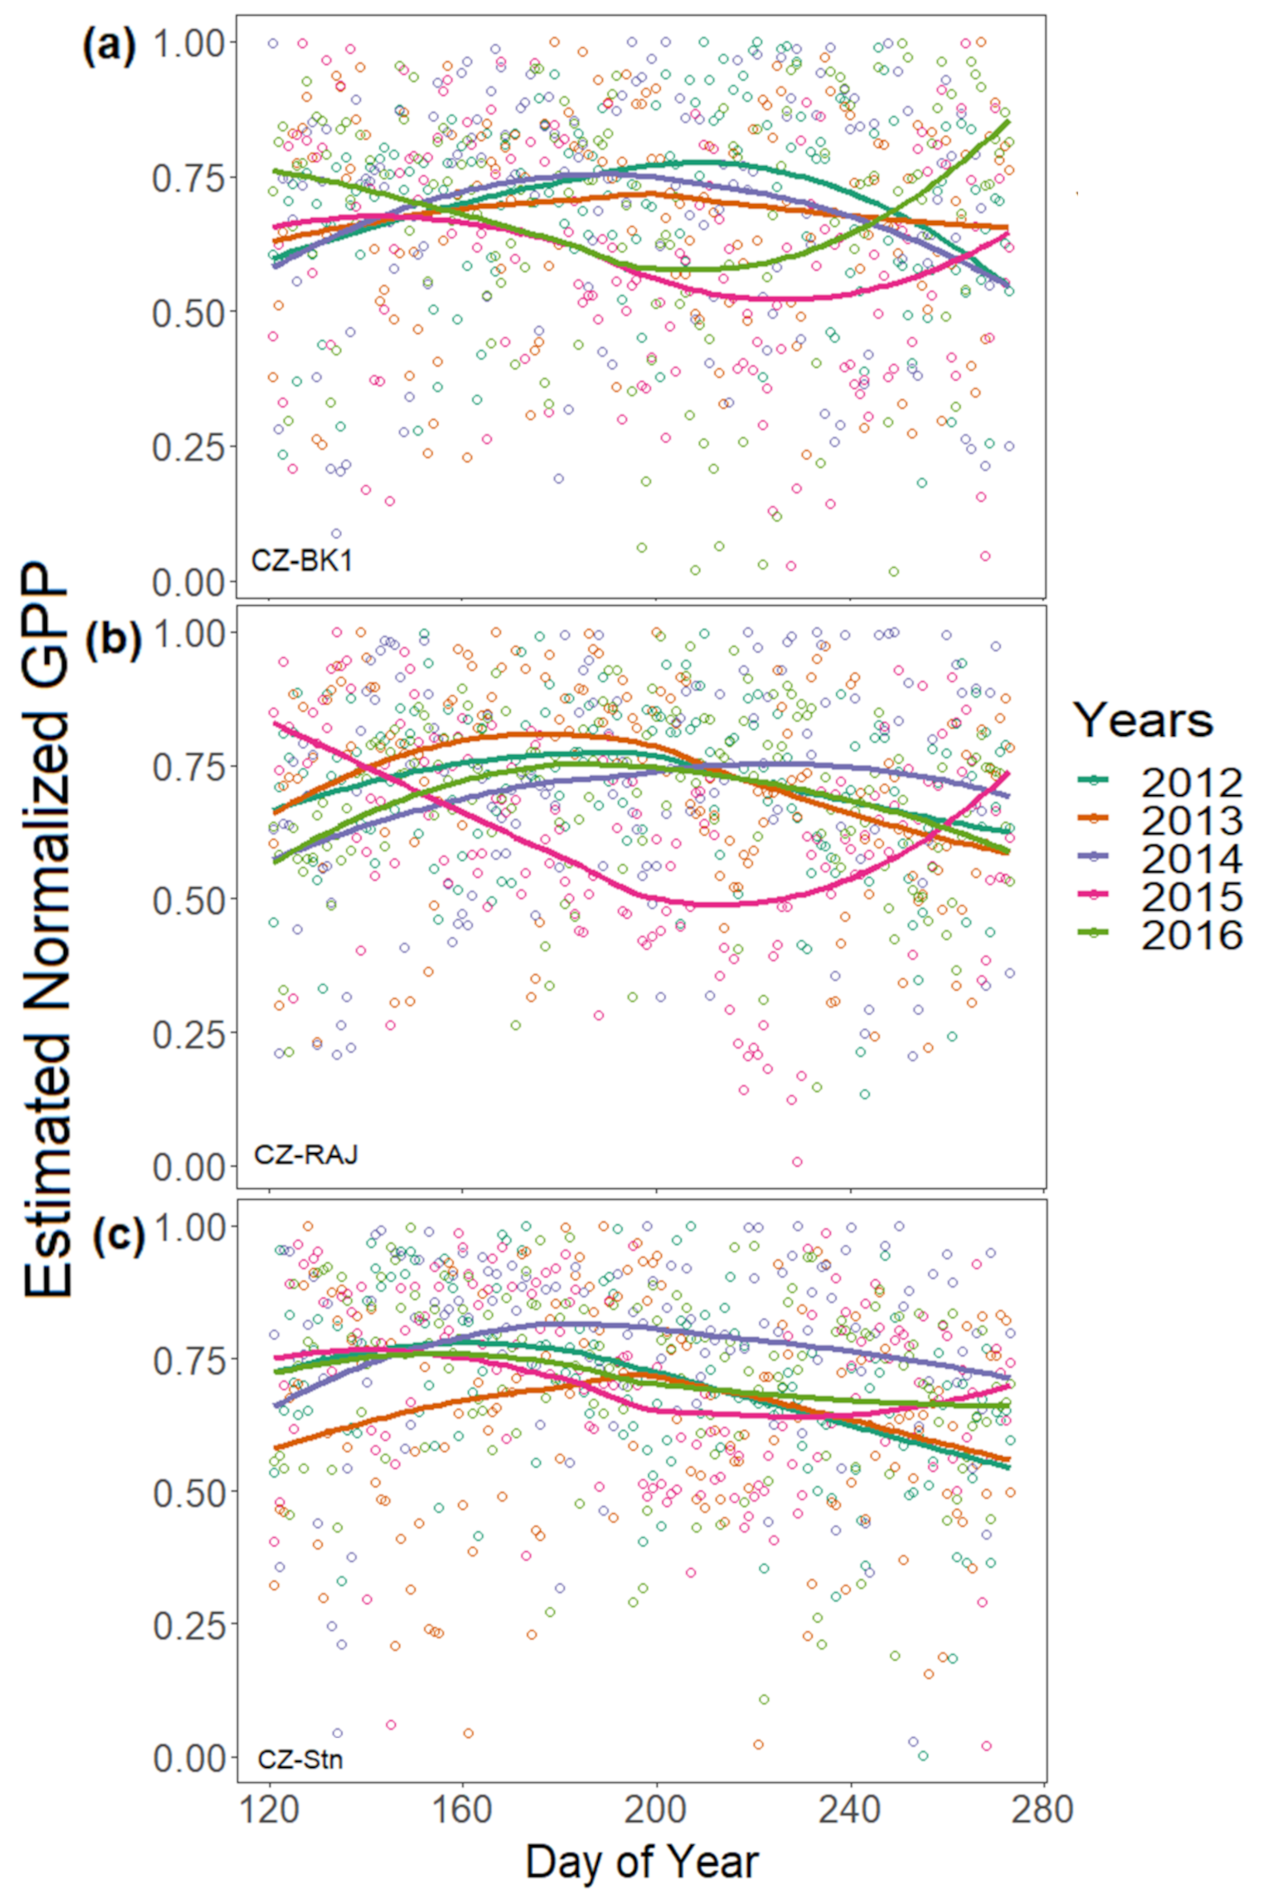
2.4.2. Estimation of Potential and Normalized GPP

GPPpot is defined here as the estimate of daily GPP sum that would be attainable under near-optimal environmental conditions (PAR, CNI, SVWC, VPD, Tair, Ts, and P) at given site and day of the year (DOY [50]). The GPPpot thus forms the boundary line of a scatter plot of GPP against DOY (especially for the growing season periods) pooled over multiple years of data. Specifically, to estimate the GPPpot, the following procedures were applied until there were no outliers as described in [50]:
  • Compute the 95th percentile from the daily sum of GPP pooled over years 2012–2016 for each DOY over a 7-day window (applied iteratively);
  • Outliers were detected and removed based on the percentiles method (all observations that positioned outside the interval formed by the 1 and 99 percentiles were considered as outliers).
To better compare the variation in GPP response across all the investigated forest stands, daily normalized GPP (GPPnorm) was derived for each forest station as the ratio of the estimated GPP to the GPPpot. Therefore, GPPnorm values ~1 represent days with maximum assimilation rates, whereas GPPnorm values ~0 represent days with extreme adverse effects on forest productivity. A smoothing spline curve was applied to depict the main trends in seasonal courses of GPPnorm during the growing seasons of 2012–2016.
A Pearson’s correlation coefficient matrix was calculated to determine the statistical relationship between GPPnorm and the environmental variables based on a covariance method at a significance level of 0.05 (Figure A2).

2.4.3. Multi-Linear and Tree-Based Regression Model Analyses

In order to assess the response of GPPnorm to the environmental factors (PAR, CNI, SVWC, VPD, Tair, and Ts) at each site, two methods were tested: (i) a stepwise multi-linear regression (SMLR) and (ii) random forest algorithm (RF). P was excluded from the analyses as it is not a direct measure of soil moisture; thus, SVWC was used for the regression analysis. The SMLR selection with interaction terms was designed using the stepwise regression method (in both forward and backward direction), to determine the significant terms in the model and eliminate the nuisance (i.e., non-significant) variables with 95% probability. In addition, quadratic terms were included to test for nonlinearity of the environmental variables with GPPnorm. All statistical analyses were performed using the R software package ‘stepAIC’ (Version 7.3-54, [51]) for computing stepwise regression in both forward and backward direction [49].
We trained and applied RF to predict GPPnorm at each of the forest ecosystems and for benchmarking the performance of the SMLR model. We used the R software package ‘randomForest’ (Version 4.6-14, [52]), with the following parameters established: number of trees of the model (ntrees) = 300, number of variables in each mode (nodesize) = 5, and the number of variables used in each tree (mtry) = one third of the total number of samples, as in [53] for regression RF. As part of the byproduct of the RF, the built-in variable importance measure that ranks the environmental variables (i.e., the features) according to their relevance in predicting GPPnorm at each of the forest ecosystems has been provided [54]. These feature scores are computed from permuting data points that were not included in the RF analyses (Out-Of-Bag samples) based on the mean decrease in accuracy. The higher the value of the mean decrease in accuracy, the higher the importance of the variable in the model.

2.4.4. Accuracy Test of Regression Models

To assess the performance of both the SMLR model and RF techniques in predicting GPPnorm at each of the forest ecosystems, model prediction accuracy indicators such as the Pearson correlation, the percentage of the variance explained (R2) in relation to estimated and predicted GPPnorm, and root mean square error (RMSE) values were derived and compared.

3. Results

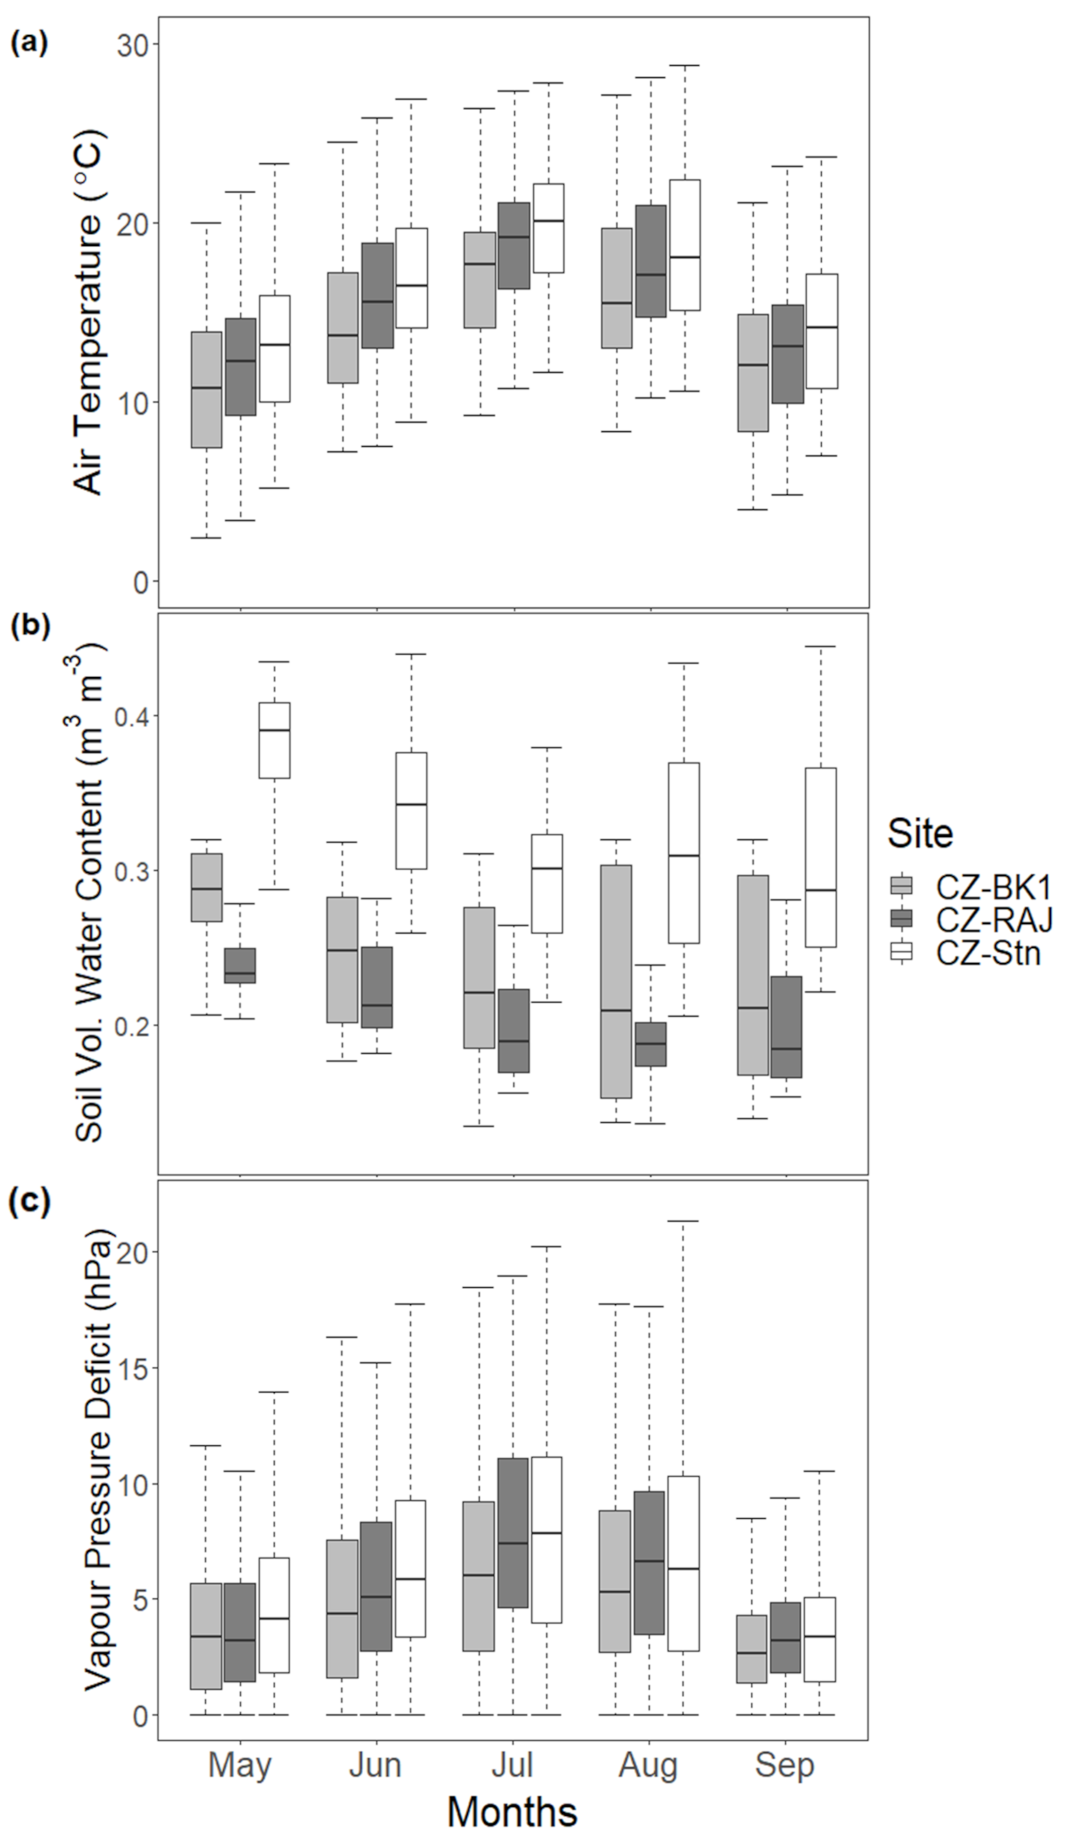
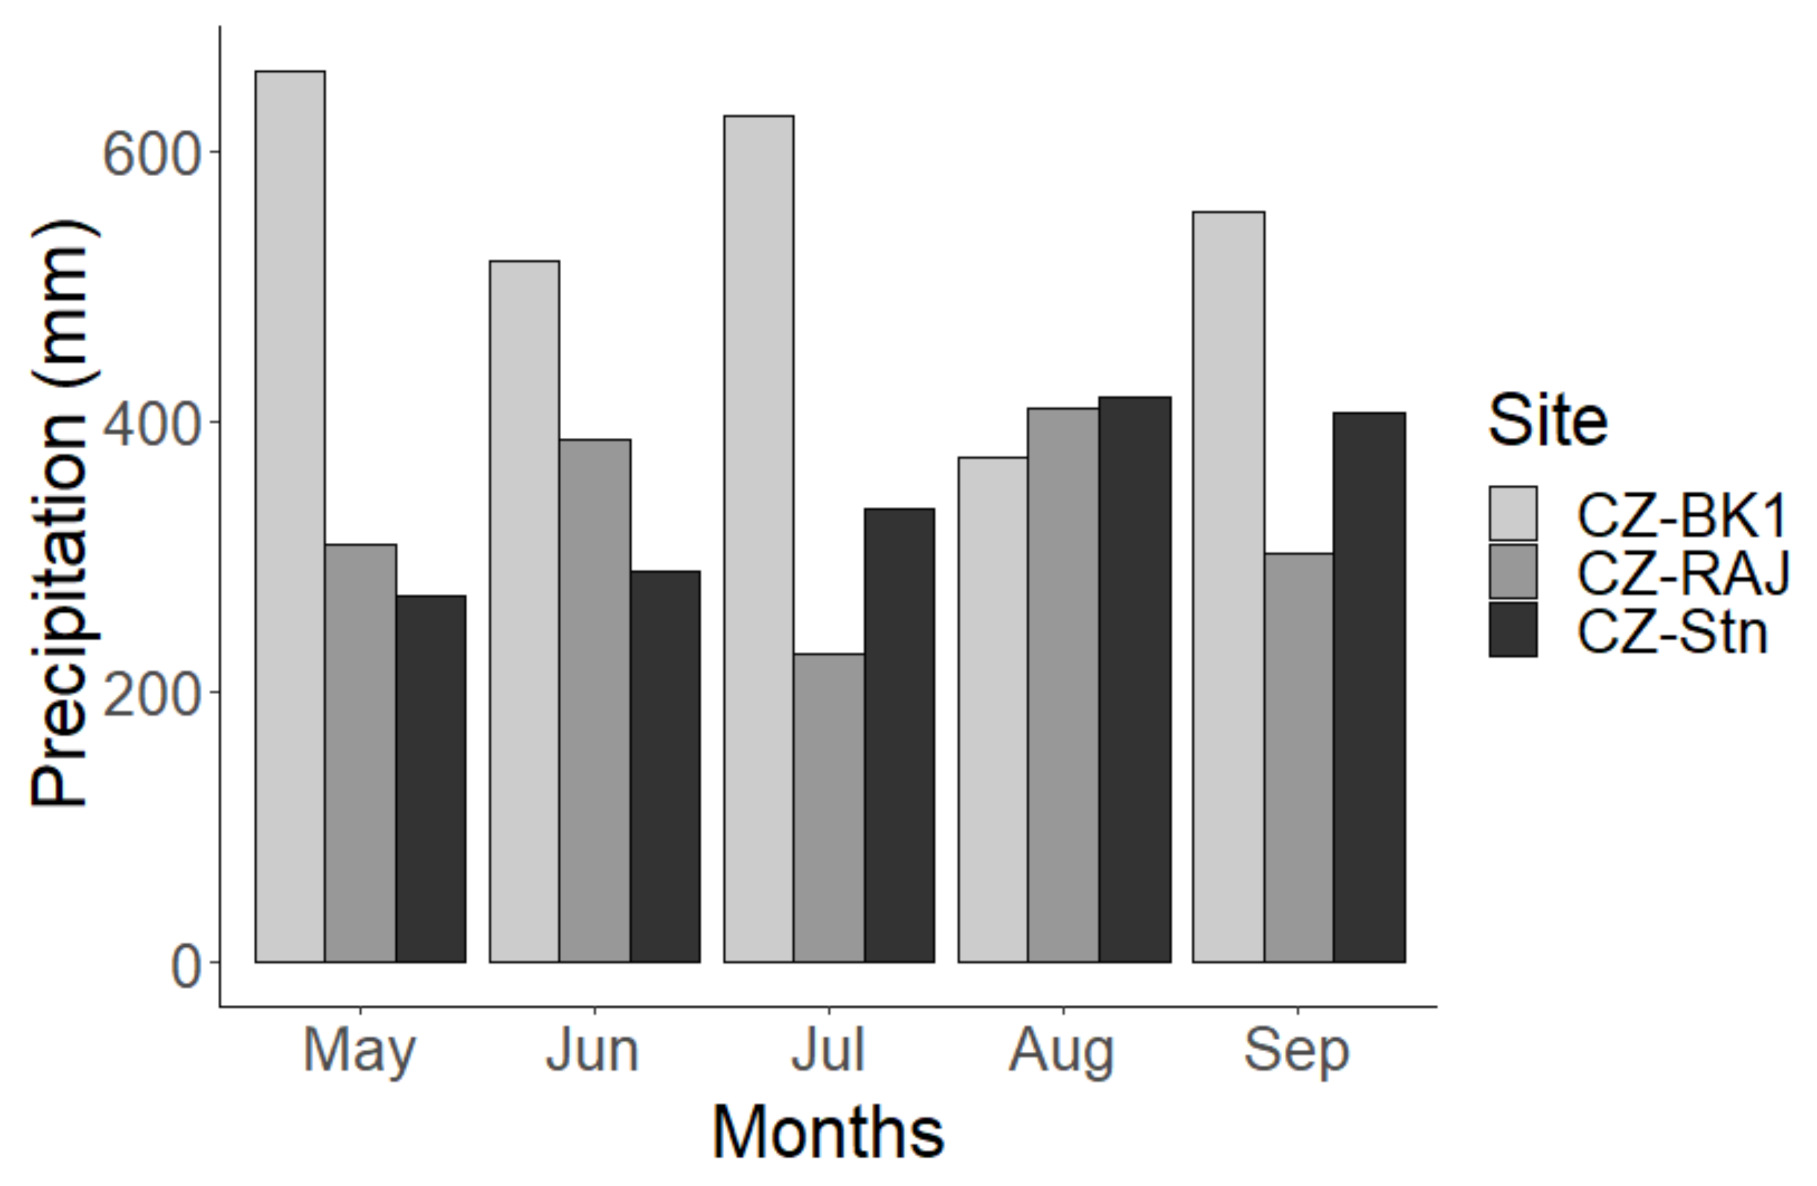
3.1. Variation in Meteorological Conditions at the Experimental Stations

Seasonal sum of precipitation during the main growing season period of the studied years at the wet spruce forest site in Bílý Kr̆íz̆ was approximately 40% and 37% higher than the seasonal sum of precipitation values at the dry spruce and the beech forest sites in Rájec and Štítná, respectively (Table 1 and Figure A1). Furthermore, the months of July–August were characterized mainly by hot and dry conditions across all forest stations, especially at the dry spruce forest in Rájec with high mean monthly Tair (10% higher than at the wet spruce forest site and 6% lower than at the beech forest) and low mean monthly SVWC values (14% and 52% lower than at the wet spruce and beech forest sites respectively) (Figure 1). However, the highest Tair values were consistently observed at the beech forest in Štítná and the lowest at the spruce forest in Bílý Kr̆íz̆. There were also statistically significant differences (p < 0.01) in the mean monthly VPD and SVWC values between the months of June–September in Bílý Kr̆íz̆ (with comparatively low monthly VPD values; Figure 1c) as compared to that in both Rájec and Štítná. These results indicate a drier climate at the dry spruce forest site in Rájec as compared to a humid climate in Bílý Kr̆íz̆.

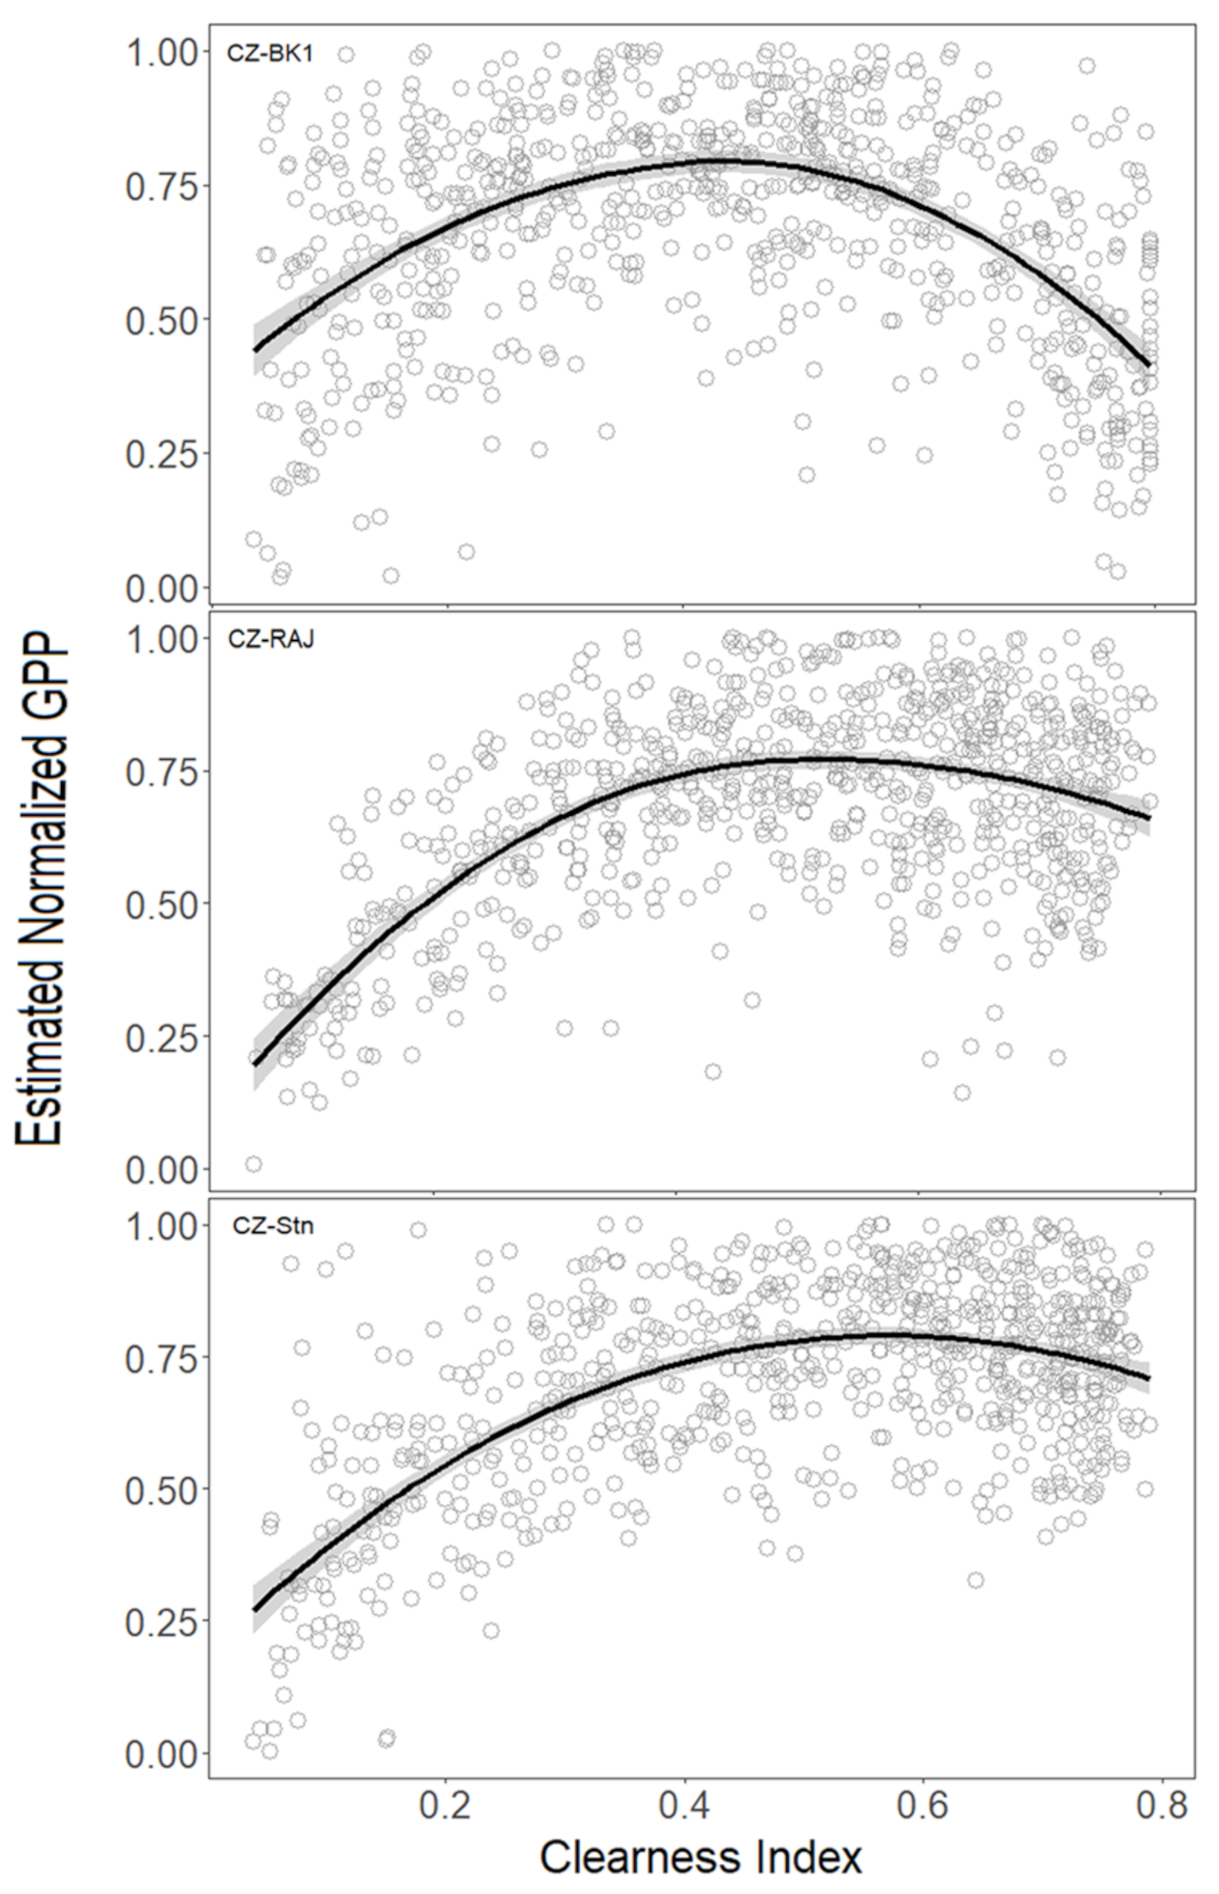
3.2. Effect of Meteorological Conditions on GPP

The annual course of mean daily sums of estimated GPP values in all the forests studied are shown in Figure 2. The area under the red curve represents the seasonal course of GPPpot, indicating how much the forest ecosystem could potentially assimilate carbon over the year under near-optimal environmental conditions. The systematic changes in estimated GPP during the growing season representing phenological responses to warming and other microclimatic conditions were well captured in Figure 2. Results show that the maximum GPPpot value of approximately 15.81 gC m−2 day−1 at the wet spruce forest site in Bílý Kr̆íz̆ was the highest across all the forest sites. This maximum GPPpot value was obtained on DOY values from 197–203 (within July) characterized by lower mean Tair and high SVWC values (Figure 1). Additionally, maximum GPPpot values of approximately 12.97 gC m−2 day−1 and 14.48 gC m−2 day−1 were obtained during June for the dry spruce (with DOY values from 170–177) and beech (with DOY values from 165–166 and 178) forest sites in Rájec and Štítná, respectively. Furthermore, the seasonal variations in the daily derived GPPnorm values over the growing season across all forest sites were compared for each of the studied year (Figure 3). Lower GPPnorm values were found in 2015 depicting GPP depression especially at the dry spruce forest site in Rájec during the main growing season of that year. The GPPnorm values were comparatively higher at the beech forest site in Štítná than at both spruce forest sites over the entire study period (Figure 3).
Our results from the Pearson correlation matrix revealed a moderate positive linear relationship between GPPnorm and PAR across all forest stands (Figure A2). However, CNI only showed a moderate positive linear relationship with GPPnorm in only the dry spruce and beech forest with a nonlinear relationship with GPPnorm at the wet spruce forest (Figure A2 and Figure A3). Additionally, we found statistically significant correlation coefficients (p < 0.05) between GPPnorm and other environmental variables such as PAR, P, VPD, SVWC, and Tair at the wet spruce forest. Furthermore, at the dry spruce forest, there were also statistically signifcant correlation coefficients between GPPnorm and PAR, CNI, SVWC, P, and Ts. Statistically significant correlation coefficients (p < 0.05) between GPPnorm and PAR, CNI, VPD, SVWC, Tair, and P were also observed at the beech forest site.

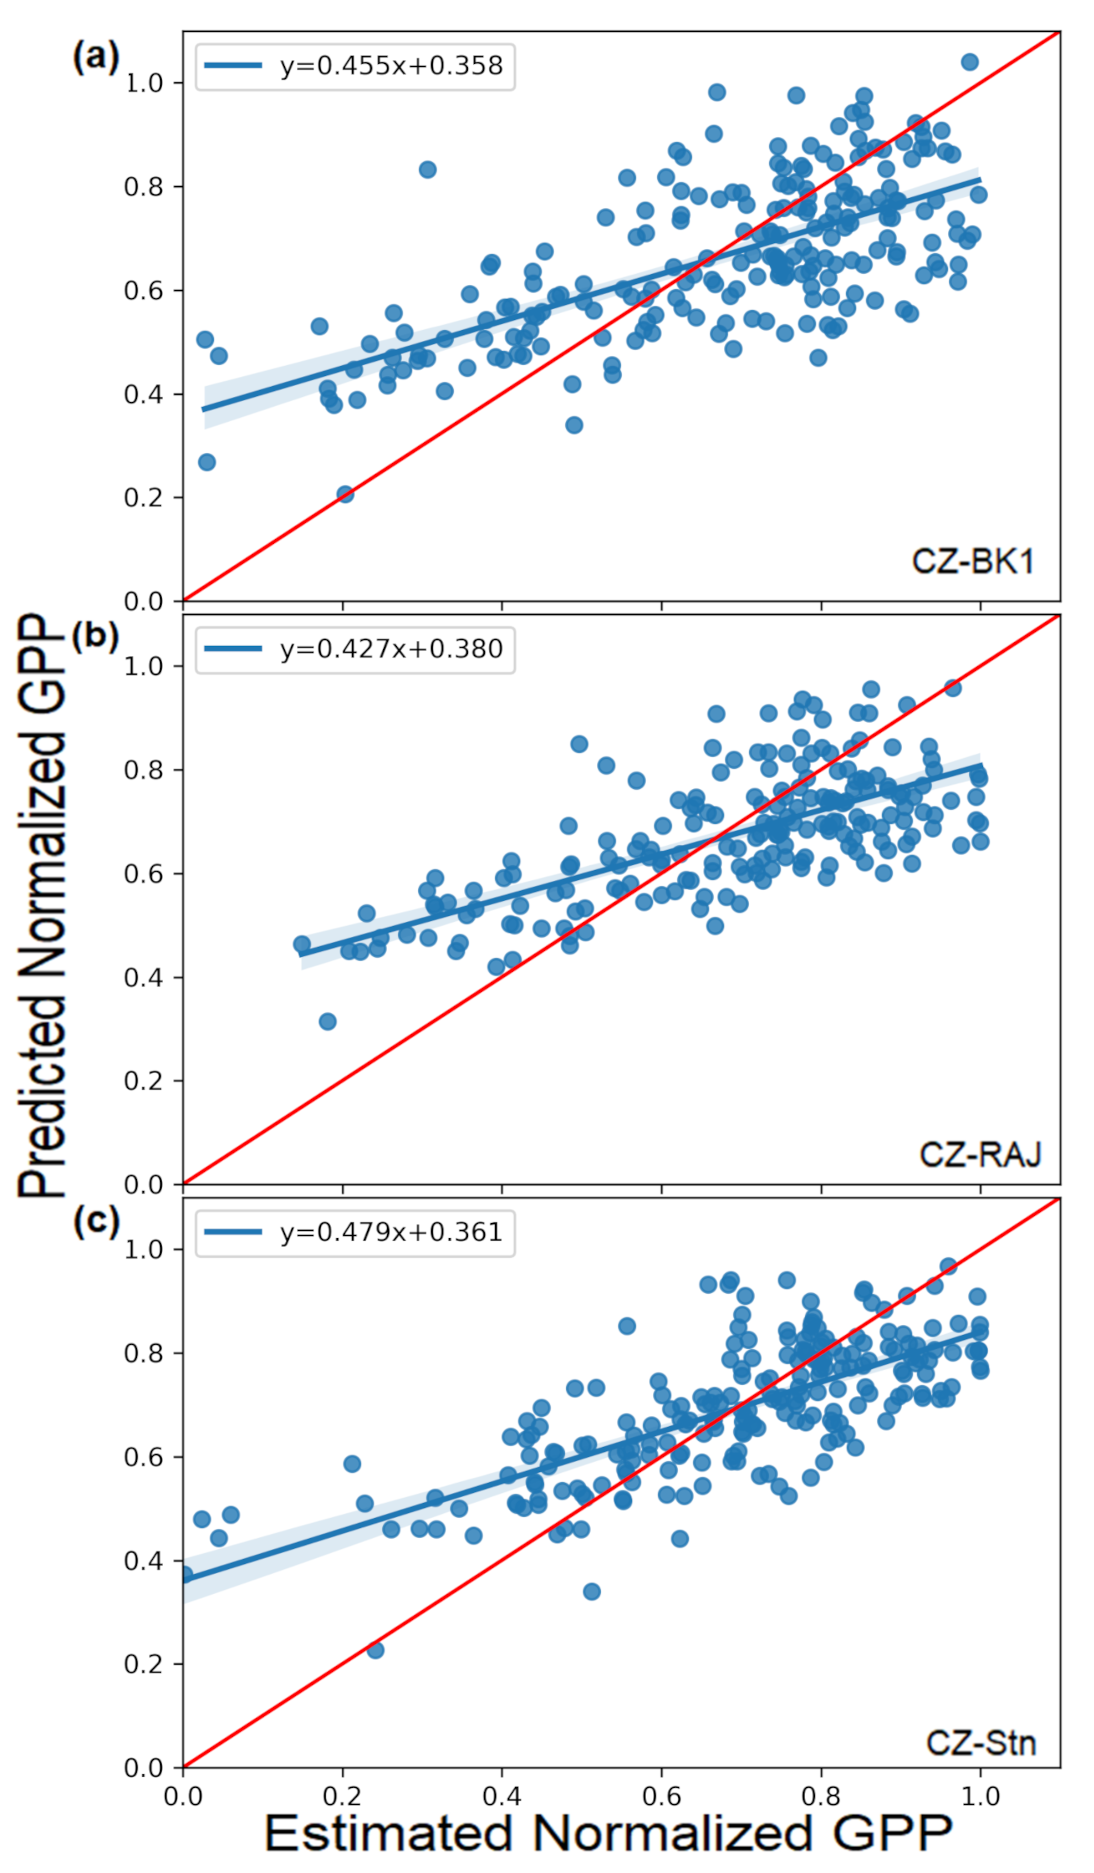
3.2.1. GPPnorm Prediction through Stepwise Multi-Linear Regression (SMLR)

To identify the main environmental variables influencing GPPnorm across the beech and both spruce forest sites, an SMLR model was built and evaluated (Figure 4). The accuracy indicators of the SMLR showed a good model quality in predicting significant environmental variables that influenced GPPnorm values (Table 2). The model over predicted for low GPPnorm values and under predicted for high GPPnorm values for all the three forest sites.
The Pearson correlation for all forest stations shows strong linear relationship between the predicted and estimated GPPnorm values (Table 2). Furthermore, the R2 of the SMLR model used across each forest ecosystem revealed that approximately 40–49% of the variance in GPPnorm was well predicted by the environmental variables used (PAR, CNI, SVWC, VPD, Tair, and Ts). The prediction error RMSE of the interaction model was found to be 0.18, 0.14 and 0.15 for the wet spruce, dry spruce and beech forests, respectively. This shows that model performance was comparable for all sites.
At both spruce forest sites, similar statistically significant (p < 0.01) environmental variables affecting GPPnorm were PAR, SVWC, VPD, and Ts (Table A3 and Table A4). In addition to these similar environmental variables, CNI was also found to have secondary effects on GPPnorm values at the wet spruce forest site in Bílý Kr̆íz̆ (Table A3). At the beech forest site in Štítná, all the environmental variables used in the SMLR analyses were found to be statistically significant (p < 0.01) in influencing GPPnorm values, especially for PAR, Ts, and CNI (Table A5).
Moreover, similar quadratic terms such as PAR2, Ts2, and CNI2 with negative coefficients were found to be statistically significant (p < 0.01) across both spruce forest sites, indicating a decrease in GPPnorm values (downward sloping) with an increase in PAR, Ts and CNI values (Table A3Table A5). Furthermore, at the beech forest site in Štítná, VPD2 and CNI2 proved to be inversely related to GPPnorm and statistically significant (Table A5). However, the positive coefficient value for SVWC2 across all the forest sites showed an increase in GPPnorm values with increasing SVWC values (Table A3, Table A4 and Table A5).
For the statistically significant (p < 0.01) interaction terms of SMLR, the VPD:SVWC term was common across all the forest sites showing the interactive effects of VPD and soil water availability on GPPnorm values. At the wet spruce forest site in Bílý Kr̆íz̆, interactive effects between VPD and other environmental variables such as SVWC, PAR, and Tair were statistically significant. At the dry spruce forest site in Rájec, statistically significant (p < 0.01) interactive terms between SVWC and other environmental variables such as CNI, PAR, and VPD were observed. Furthermore, at the beech forest site in Štítná, statistically significant (p < 0.01) interactive terms such as Ts:SVWC, Tair:SVWC, Tair:PAR, CNI:PAR, VPD:Ts, and VPD:SVWC were all found to have effects on GPPnorm values.

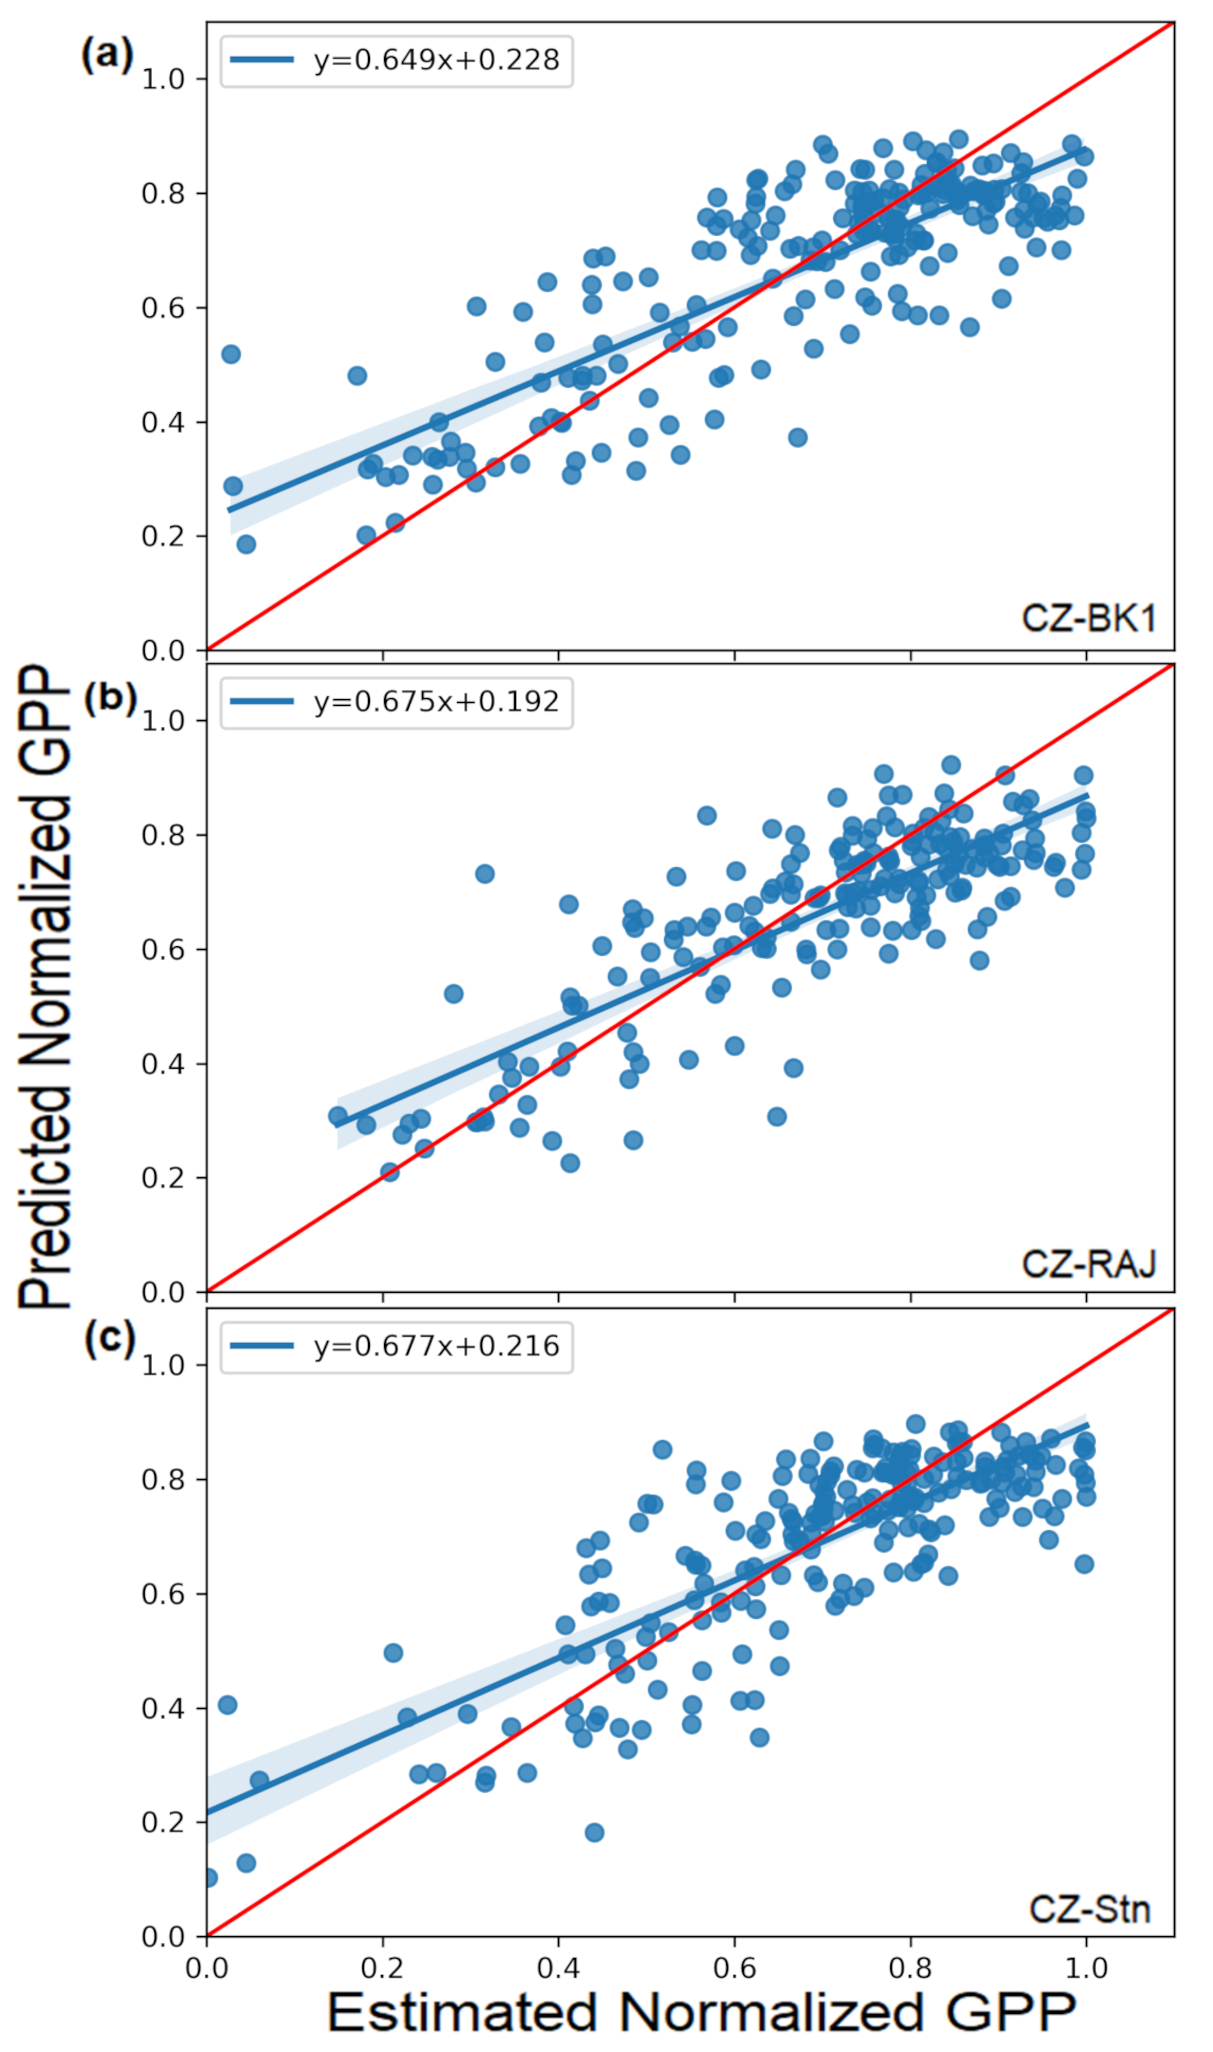
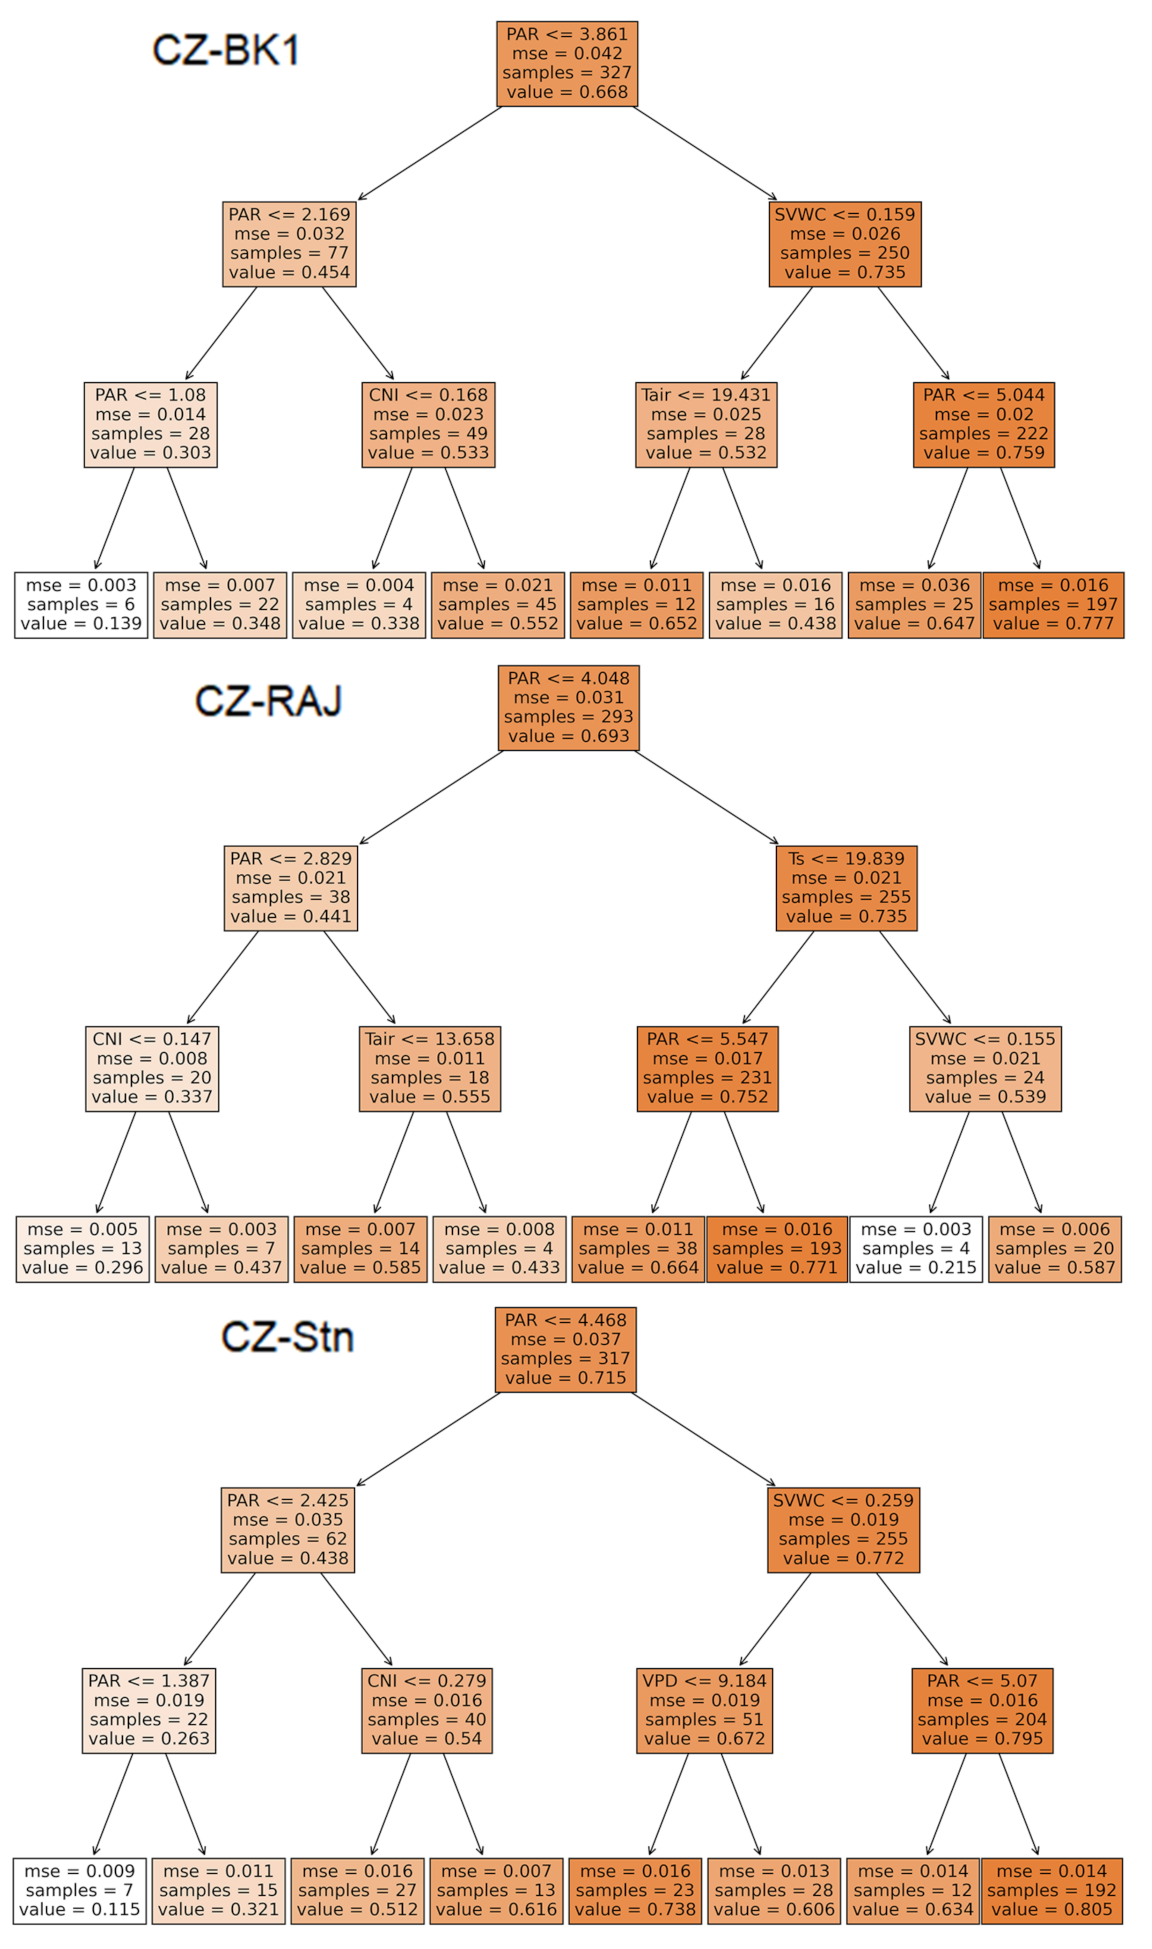
3.2.2. GPPnorm Prediction through Random Forest Analyses (RF)

The validation statistics of the RF modeling are shown in Table 2. Note that higher R2 (>0.54) and Pearson correlation values (>0.70) with low RMSE (<0.15) were obtained in GPPnorm predictions with RF than with SMLR. This suggests that the RF model presents a greater potential for predicting changes in GPPnorm with the environmental factors across the forest ecosystems studied (Figure 5).

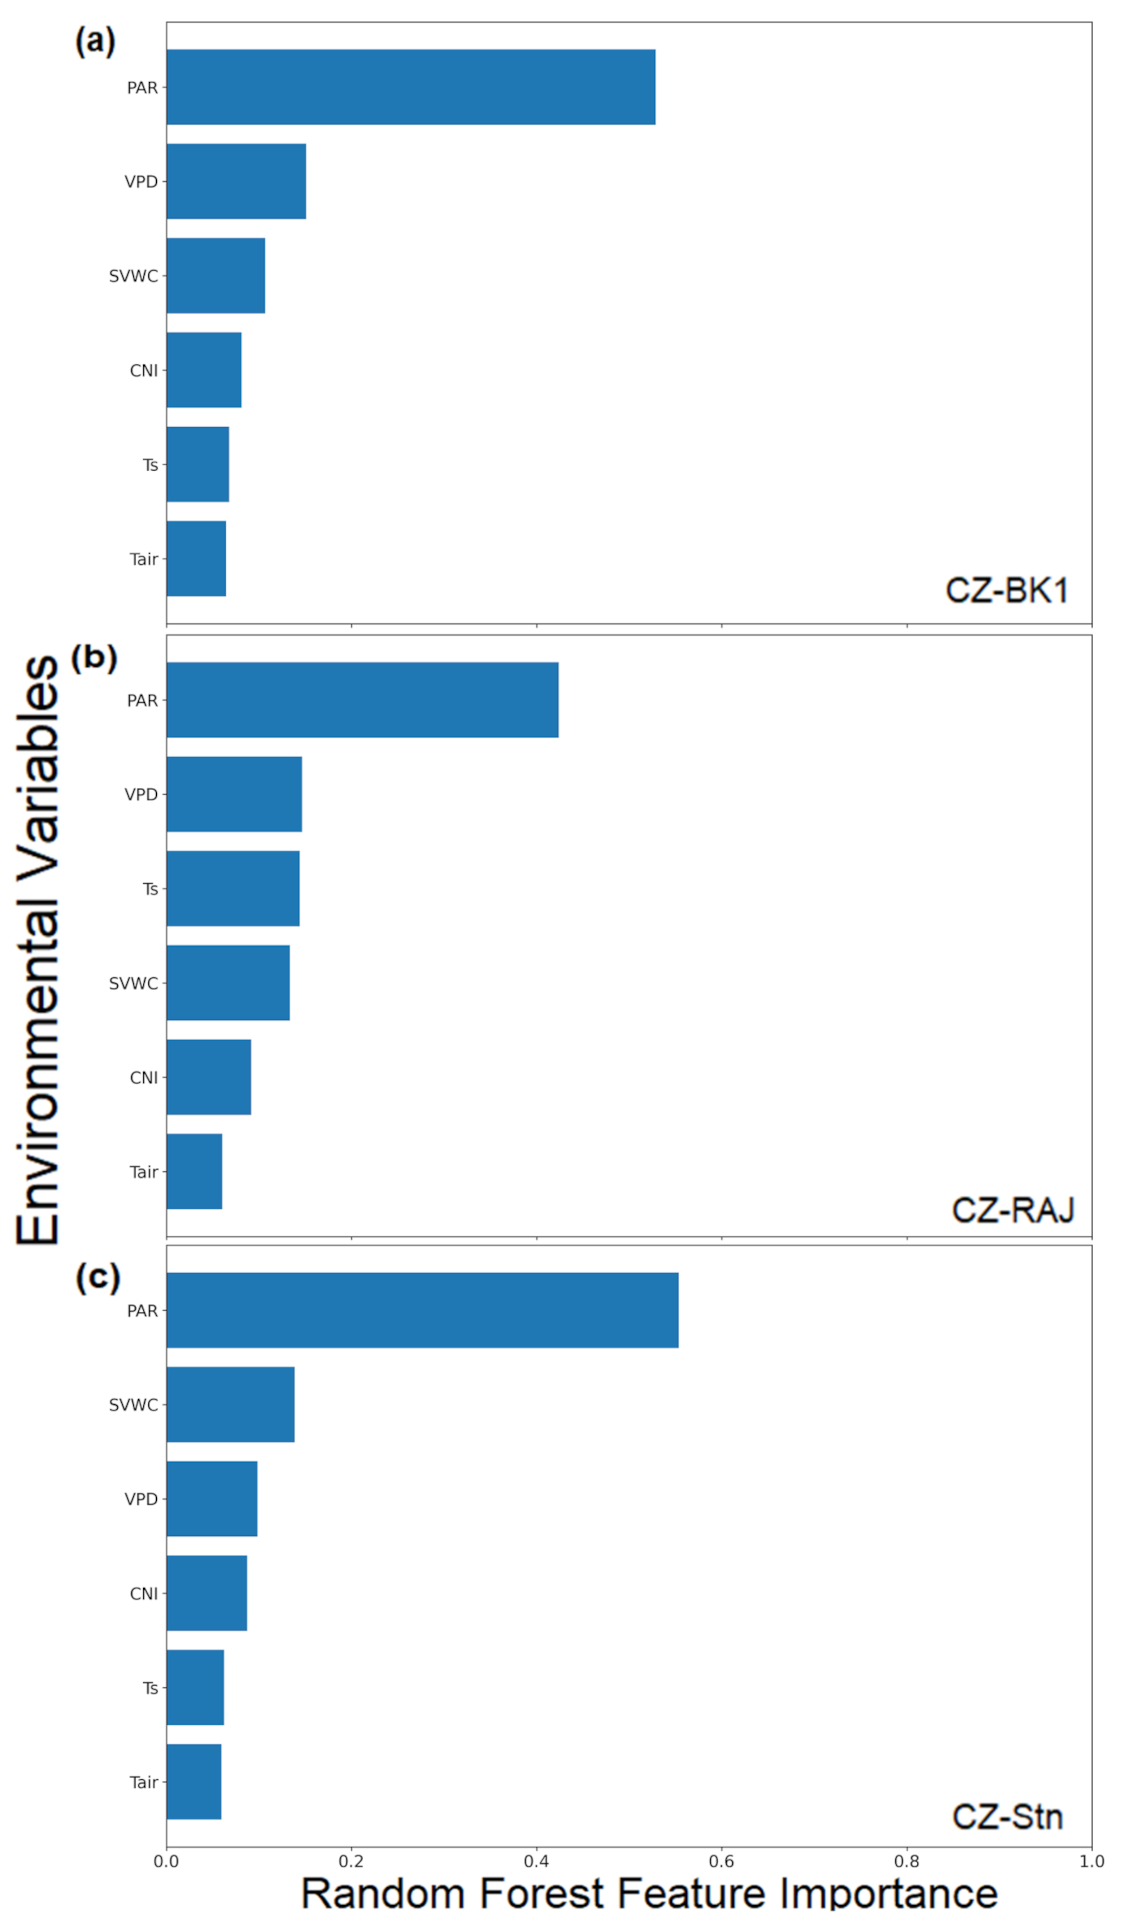
3.2.3. Importance of Environmental Variables in Random Forest Analyses

All the forest ecosystems predicted PAR as the most important environmental variable (Figure 6). The variable importance score of PAR was higher at the beech forest site in Štítná than at both spruce forest sites. Additionally, at the wet spruce forest site in Bílý Kr̆íz̆, the second and third most important environmental variables in GPPnorm prediction were VPD and SVWC. On the other hand, SVWC and VPD were also the second and third most significant environmental variables, respectively, in GPPnorm prediction at the beech forest site in Štítná. This shows the significant effect of VPD at the wet spruce forest site and soil water availability at the beech forest site on GPPnorm prediction. Furthermore, at the dry spruce forest site in Rájec, the second and third most important variables in GPPnorm prediction were VPD and Ts, respectively. Overall, VPD had more significant effect on GPPnorm prediction at both spruce forest sites, especially in Bílý Kr̆íz̆ (with the highest variable importance score of 0.18 for VPD).
A decision tree representation showing regions with high and low GPPnorm daily values from the RF analyses were plotted for each forest ecosystem (Figure 7).
As already observed from both the SMLR and RF analyses, PAR is the most important environmental variable in separating GPPnorm values into two distinct groups (high and low values) across all forest ecosystems (Figure 7). For both spruce forest sites, the group with mostly higher GPPnorm values (right branches in Figure 7) were separated above similar PAR threshold values (approximately 4 MJ m−2 day−1), while high GPPnorm values were attainable at the beech forest in Štítná above a PAR threshold of approximately 4 MJ m−2 day−1. The left branch in Figure 7 likely represents exceptional cases with low PAR and GPPnorm values. Such conditions are the most common in the wet spruce forest in Bílý Kr̆íz̆ with 72 cases as compared to 38 cases in the dry spruce forest and 62 cases in the beech forest. Lower GPPnorm values were realized during periods with extremely low PAR (~1 MJ m−2 day−1) values at the wet spruce forest in Bílý Kr̆íz̆ (6 cases) and the beech forest site in Štítná (7 cases). Unlike in the wet spruce and beech forest sites, lower GPPnorm values were obtained at the dry spruce forest site in Rájec on periods with low SVWC (<0.16 m3 m−3; 4 cases) and CNI (<0.2; 13 cases).
Moreover, apart from PAR, other environmental variables were also observed to be important for group separation. SVWC (≤0.16 m3 m−3; 250 cases) and Tair (≤19 C; 28 cases) values had secondary effects on GPPnorm values at the wet spruce forest Bílý Kr̆íz̆. At the dry spruce forest site in Rájec, other limiting factors for GPPnorm values were also found to be Ts (≤20 C; 255 cases) and SVWC (≤0.16 m3 m−3; 24 cases). There were periods (193 cases) when higher GPPnorm values were realized with Ts< 20 C and PAR threshold value of approximately 6 MJ m−2 day−1 at the dry spruce forest site. As was observed in both Figure 6 and Figure 7, SVWC (≤0.26 m3 m−3; 255 cases) and VPD (≤9 hPa; 51 cases) values were found to have secondary effects on GPPnorm values at the beech forest site. However, at similar PAR threshold values of approximately 5 MJ m−2 day−1 and different SVWC threshold values, higher GPPnorm values were realized at both the wet spruce (SVWC values of approximately 0. 16 m3 m−3; 197 cases) and beech forest sites (SVWC values of approximately 0.26 m3 m−3; 192 cases).

4. Discussion

This study used two sets of regression models (SMLR and RF) to identify the main environmental variables influencing the ratio between actual and optimal gross primary productivity (termed as GPPnorm) across central European beech (at Štítná) and Norway spruce (at Bílý Kr̆íz̆ and Rájec) species growing under contrasting climatic conditions. The presented results illustrate that the RF regression model outperformed SMLR and was highly effective for GPPnorm prediction at all the studied forest ecosystems (Table 2). Though these statistical analyses may not show the mechanistic cause of the observed patterns, the RF model also provided useful information about the variable importance (Figure 6) and the effect of their significant interactions (that are highly correlated; Figure 7) on GPPnorm. Similarly, the authors of [17] used a path analysis approach to evaluate the sensitivity of GPP to environmental drivers during the summer drought of 2018, but our study evaluated in broader terms the general limiting environmental conditions of GPP across each of the studied forest sites.
As PAR is already a well-known primary driver of forest GPP, the results from our study revealed its overall significance in influencing GPPnorm across all the forest sites. However, aside from PAR, there were other site-specific environmental variables that also had significant impact on GPPnorm prediction. It is mostly hard to distinguish the direct impact and importance of Tair, VPD, and SVWC as they are mutually dependent [55,56,57]. However, our results show that the second most important environmental variable in GPPnorm prediction was VPD at the wet spruce forest site and SVWC at the beech forest site. Thus, indicating the contrasting water use strategies of both spruce and beech species. This is in line with earlier findings which show that the isohydric Norway spruce species has tighter stomatal control in response to increasing VPD than the anisohydric European beech species, which can tolerate drought stress better [29,58,59,60]. Therefore, as more frequent heatwaves and drought spells characterize the proceeding climate change, an unavoidable shift of the Central Europe silviculture strategy is expected, providing likely higher opportunity for growing European beech while a higher risk for the coniferous Norway spruce [61,62]. Additionally, GPPnorm reduction within the beech forest site was presumably mainly induced by edaphic drought stress (low soil moisture) conditions, further stressing the significant impact of SVWC on forest GPP, especially at the beech forest stand due to its different soil properties (more clayey soil) from the other forest sites [23,63,64,65,66,67].
Moreover, at both spruce forest sites, a more detailed analysis of the variables splitting branches within RF (Figure 7) showed that Tair or Ts typically grouped subspaces with high and low (drought-reduced) GPPnorm values. Interestingly, at the wet spruce forest site in Bílý Kr̆íz̆, Tair split the subspace with lower values of GPPnorm at high Tair threshold values above 19 C during days with lower SVWC values (<0.16 m3 m−3). This suggests that high Tair values limit the forest productivity at the mountainous wet spruce forest site in Bílý Kr̆íz̆. Furthermore, at the dry spruce forest in Rájec, the three most important variable (VPD, Ts, and SVWC) had the highest scores among all the forest sites (scores > 0.1; Figure 6). This shows that the spruce forest productivity within a drier climate is often significantly impacted by both meteorological and hydrological drought events (decrease in atmospheric water content) [68,69,70,71,72]. Thus, under warmer climatic conditions, the impact of drought stress conditions on forest productivity will be more severe at spruce forests sites situated within drier climates [73].
Comparatively across all forest sites, the variable importance score of PAR was higher at the beech forest site in Štítná than at both spruce forest sites in Bílý Kr̆íz̆ and Rájec (Figure 6). Although incoming PAR with a larger fraction of diffuse light was previously shown to be more effectively utilized by the forest canopy [19,74], generally lower scores of CNI suggest limited modulation of GPPnorm by sky conditions. Relative to other assessed variables, CNI played the most important role at the beech forest site in Štítná. At both the beech and dry spruce forest sites, GPPnorm was observed to increase with CNI until it became saturated at some point (Figure A1 and Figure A2). Thus, high GPPnorm values are realized under partly cloudy conditions, especially within the beech forest ecosystems, possibly due to the deep penetration of light into its canopy due to its west–southwest slope orientation [75]. On the contrary, within the wet spruce forest site in Bílý Kr̆íz̆ with a mountainous ridge, high GPPnorm values were mainly realized under cloudy conditions due to the effective penetration of anisotropic diffuse radiation at all layers within the forest canopy, especially in shaded leaves (Figure A3 and Figure A4) [19,76].

5. Conclusions

In this study, we identified the main environmental variables influencing the ratio between actual and optimal gross primary productivity across Central European beech (at Štítná) and Norway spruce (at Bílý Kr̆íz̆ and Rájec) species by comparing statistical analyses from the traditional Stepwise multiple linear regression model (SMLR) and Random forest (RF) regressional model. Across all the studied forest ecosystems, anisotropic diffuse radiation entering the forest canopy under cloudy conditions within the wet spruce forest and partly conditions within the dry spruce and beech forest was the main limiting environmental factor of photosynthesis. However, other environmental factors relating to water availability, such as the vapour pressure deficit, soil moisture, and temperature (air and soil), also had significant effects on the ecosystem photosynthesis depending on the local conditions and forest type. The sensitivity of both spruce forest sites to the vapour pressure deficit and high temperatures, especially in the drier climate at Rájec, indicate that the Norway spruce is currently one of the most threatened commercial tree species in Central Europe under the recent changes in climatic conditions. Moreover, reduction in forest productivity at the beech forest was presumed to be mainly induced by edaphic drought than meteorological and hydrological drought events, as in the spruce forest sites. Our findings provide useful insights potentially applicable for land surface models and further assessment of the impacts of climate change on forests in the Central Europe and their sequestration capacity. At the same time, our findings call for more studies on forest productivity across different forest types and contrasting climatic conditions, as productivity is strongly dependent on species type and site-specific environmental conditions.

Author Contributions

Conceptualization, C.M. and L.Š.; methodology, C.M., L.Š., M.F., M.P., and M.V.M.; software, C.M., L.F., and L.Š.; validation, M.F., G.J., S.C., and O.U.; formal analysis, C.M., and L.Š.; investigation, C.M., and L.Š.; resources, M.P., L.Š. and E.K.N.; data curation, L.Š., G.J. and S.C.; writing—original draft preparation, C.M.; writing—review and editing, L.Š., O.U., M.F., G.J., L.F., C.S.W., E.K.N., and M.V.M.; visualization, L.F.; supervision, L.Š., and M.V.M.; project administration, M.P. and L.Š.; funding acquisition, M.P. and M.V.M. All authors have read and agreed to the published version of the manuscript.

Funding

This research and the APC was funded by the Ministry of Education, Youth and Sports of the Czech Republic (CR) within the CzeCOS program, grant number LM2018123.

Institutional Review Board Statement

Not applicable.

Informed Consent Statement

Not applicable.

Data Availability Statement

The data presented in this study are available on FLUXNET and could also be made available on request from the corresponding author.

Acknowledgments

The authors wish to thank Radek Czerný who assisted in the eddy covariance data processing. This work was supported by the Ministry of Education, Youth and Sports of the Czech Republic (CR) within the CzeCOS program, grant number LM2018123. L.Š. was supported by the Ministry of Education, Youth and Sports of CR within Mobility CzechGlobe2 (CZ.02.2.69/0.0/0.0/18 053/0016924). M.F. acknowledges the support by SustES- Adaptation strategies for sustainable ecosystem services and food security under adverse environmental conditions (CZ.02.1.01/0.0/0.0/16 019/0000797). M.V.M acknowledges the support by VEGA project 2/0013/17 (Slovak Agency for Scientific Support): The role of ecosystem services in support of landscape conservation under the global change.

Conflicts of Interest

The authors declare no conflict of interest. The funders had no role in the design of the study; in the collection, analyses, or interpretation of data; in the writing of the manuscript; or in the decision to publish the results.

Appendix A

Figure A1. Monthly sums of precipitation for May–September from 2012–2016 at the wet spruce forest in Bílý Kr̆íz̆ (CZ-BK1), the dry spruce forest in Rájec (CZ-RAJ) and the beech forest in Štítná (CZ-Stn) sites.
Atmosphere 12 01128 g0a1
Figure A2. Pearson correlation coefficient matrix showing correlation coefficient between the environmental variables and the normalized gross primary productivity (GPPnorm) across the wet spruce forest in Bílý Kr̆íz̆ (CZ-BK1), the dry spruce forest in Rájec (CZ-RAJ) and the beech forest in Štítná (CZ-Stn) sites for May–September of 2012–2016 (shown in the upper panel). CNI: clearness index; PAR: photosynthetic available radiation; Tair: air temperature; Ts: soil temperature; AWR1: available water resource; VPD: vapour pressure deficit; P: precipitation.
Atmosphere 12 01128 g0a2
Figure A3. Correlation between the estimated Normalized gross primary productivity (GPPnorm) for May–September of 2012–2016 in the wet spruce forest in Bílý Kr̆íz̆ (CZ-BK1), the dry spruce forest in Rájec (CZ-RAJ) and the beech forest in Štítná (CZ-Stn) sites.
Atmosphere 12 01128 g0a3
Figure A4. Correlation of daily Diffusion Index (DI) with daily Clearness Index (CNI) for May–September of 2012–2016 in the wet spruce forest site in Bílý Kr̆íz̆ (CZ-BK1), showing diffuse radiation on partly cloudy days (highest point).
Atmosphere 12 01128 g0a4
Table A1. Description of the eddy covariance systems at the investigated sites.
Site NameCZ-BK1CZ-RAJCZ-Stn
Ultrasonic Anemometer
InstrumentGill HS-50 (Gill Instruments,
UK)
Gill R3-100 (Gill Instruments,
UK) but later changed to Gill
HS-50 on 5 June 2015
Gill R3-100 (Gill Instruments,
UK)
Gas Analyser
InstrumentLI-7200Initially LI-7000 (IRG-0226)
closed-path gas analyser, but
later changed to LI-7200 on 5
June 2015
LI-7000 closed-path gas
analyser
Measurement Height for the
Eddy covaiance set-up (m)
Initially 20.5 m, but later
changed to 25 m on 7 June
2016
41 m44 m
Table A2. Description of ancillary climatic measurements at the investigated sites.
Site NameCZ-BK1CZ-RAJCZ-Stn
Air Temperature and
Humidity Profile
InstrumentEMS33 temperature and
humidity sensor
EMS33 temperature and
humidity sensor
EMS33 temperature and
humidity sensor
Height (m)2.0, 7.6, 12.6, 13.5, 14.3, 14.8, 15.4, 16.5, 18.72.0, 11.0, 23.0, 29.0, 35.0, 42.02.0, 12.0, 22.0, 28.0, 33.0, 38.0, 44.0
Net Radiation
InstrumentCNR1 net radiometer (Kipp &
Zonen)
CNR1 net radiometer (Kipp &
Zonen)
CNR1 net radiometer (Kipp &
Zonen)
Height (m)Initially 20 m, then changed to 22 m in August, 201342 m42 m
Soil Temperature
InstrumentPt 1000Pt 100Pt 1000
Depth (m)0, 0.05, 0.10, 0.20, 0.30, 0.500, 0.050, 0.05, 0.10, 0.20, 0.30, 0.50
Environmental Measuring System—EMS.
Table A3. Results of the stepwise multi-linear regression model on the significant environmental variables that influenced the normalized gross primary productivity (GPPnorm) at the wet spruce forest site in Bílý Kr̆íz̆ (CZ-BK1). CNI: clearness index; PAR: photosynthetic available radiation; Tair: air temperature; Ts: soil temperature; SVWC: the soil volumetric water content; and VPD: vapour pressure deficit.
EstimateStandard Errort ValuePr (>|t|)
(Intercept) 6.397 × 10 1 1.397 × 10 1 −4.581 5.47 × 10 6 ***
PAR 1.659 × 10 1 1.541 × 10 2 10.772< 2 × 10 16 ***
PAR2 8.813 × 10 3 1.025 × 10 3 8.601< 2 × 10 16 ***
SVWC2 1.095 × 10 1 1.938−5.649 2.34 × 10 8 ***
PAR:Tair 5.234 × 10 3 9.454 × 10 4 −5.536 4.36 × 10 8 ***
SVWC 5.048 × 10 1 9.514 × 10 1 5.305 1.51 × 10 7 ***
Ts:PAR 4.884 × 10 3 1.062 × 10 3 4.598 5.04 × 10 6 ***
Ts2 2.002 × 10 3 4.817 × 10 4 −4.155 3.64 × 10 5 ***
VPD:SVWC 9.490 × 10 2 2.389 × 10 2 3.972 7.84 × 10 5 ***
CNI2 3.623 × 10 1 1.025 × 10 1 −3.5330.000437 ***
CNI 4.589 × 10 1 1.326 × 10 1 3.4610.000571 ***
VPD2 2.191 × 10 3 7.005 × 10 4 −3.1280.001830 ***
VPD 3.745 × 10 2 1.525 × 10 2 −2.4560.014300 *
Ts 2.550 × 10 2 1.077 × 10 2 2.3670.018214 *
VPD:PAR 3.094 × 10 3 1.367 × 10 3 2.2640.023906 *
CNI:Tair 1.066 × 10 2 5.007 × 10 3 2.1280.033690 *
CNI:PAR 1.544 × 10 2 7.571 × 10 3 −2.0390.041772 *
VPD:Tair 1.937 × 10 3 9.802 × 10 4 1.9760.048507 *
Signif. code: p < 0.001 ‘***’; p < 0.05 ‘ *’.
Table A4. Results of the stepwise multi-linear regression model on the significant environmental variables that influenced the normalized gross primary productivity (GPPnorm) at the dry spruce forest site in Rájec (CZ-RAJ). CNI: clearness index; PAR: photosynthetic available radiation; Tair: air temperature; Ts: soil temperature; SVWC: the soil volumetric water content; and VPD: vapour pressure deficit.
EstimateStandard Errort ValuePr (> |t|)
(Intercept)1.24166270.28348954.380 1.39 × 10 5 ***
PAR0.19575060.015716512.455< 2 × 10 16 ***
PAR2−0.00558070.0006615−8.436< 2 × 10 16 ***
Ts:SVWC0.29315910.04480896.542 1.25 × 10 10 ***
Tair2−0.00094790.0001752−5.409 8.97 × 10 8 ***
CNI2−0.90903710.1592056−5.710 1.74 × 10 8 ***
Ts2−0.00154520.0002921−5.290 1.68 × 10 7 ***
SVWC:CNI4.07517440.81627364.992 7.71 × 10 7 ***
Ts:Tair0.00161390.00038354.208 2.94 × 10 5 ***
PAR:SVWC−0.3523780.0896162−3.932 9.35 × 10 5 ***
SVWC−8.45371692.2630082−3.7360.000204 ***
VPD−0.03641400.0102154−3.5650.000392 ***
Ts0.04040960.0149492−2.7030.007053 ***
VPD:SVWC0.13778810.05188782.6560.008118 ***
SVWC210.90364925.06618122.1520.031754 *
Signif. code: p < 0.001 ‘***’; p < 0.05 ‘ *’.
Table A5. Results of the stepwise multi-linear regression model on the significant environmental variables that influenced the normalized gross primary productivity (GPPnorm) at the beech forest site in Štítná (CZ-Stn). CNI: clearness index; PAR: photosynthetic available radiation; Tair: air temperature; Ts: soil temperature; SVWC: the soil volumetric water content; and VPD: vapour pressure deficit.
EstimateStandard Errort ValuePr (> |t|)
(Intercept)1.63240510.29132145.603 3.00 × 10 8 ***
PAR0.10354500.008985611.523< 2 × 10 16 ***
Ts:SVWC0.49548050.06275277.896 1.08 × 10 14 ***
Ts−0.17948980.0233970−7.671 5.56 × 10 14 ***
CNI0.82133890.133788865.957 4.04 × 10 9 ***
Tair0.09880820.01785325.534 4.38 × 10 8 ***
SVWC−6.38831301.3261064−4.817 1.78 × 10 6 ***
Tair:SVWC−0.22744740.0467787−4.862 1.43 × 10 6 ***
Tair:PAR−0.00240490.0005103−4.713 2.93 × 10 6 ***
CNI:PAR−0.05588830.0148897−3.7530.000189 ***
VPD2−0.00085600.0002309−3.7080.000225 ***
VPD:Ts0.00210740.00060053.5100.000477 ***
VPD−0.05614660.0176605−3.1790.001540 ***
SVWC24.94095761.56418083.1590.001651 ***
VPD:SVWC0.10488770.03398883.0860.002107 ***
CNI2−0.53767050.2101539−2.5580.010718 ***
Signif. code: p < 0.001 ‘***’.

References

  1. Beer, C.; Reichstein, M.; Tomelleri, E.; Ciais, P.; Jung, M.; Carvalhais, N.; Rödenbeck, C.; Arain, M.A.; Baldocchi, D.; Bonan, G.B.; et al. Terrestrial gross carbon dioxide uptake: Global distribution and covariation with climate. Science 2010, 329, 834–838. [Google Scholar] [CrossRef] [Green Version]
  2. Lal, R.; Smith, P.; Jungkunst, H.F.; Mitsch, W.J.; Lehmann, J.; Nair, P.R.; McBratney, A.B.; de Moraes Sa, J.C.; Schneider, J.; Zinn, Y.L.; et al. The carbon sequestration potential of terrestrial ecosystems. J. Soil Water Conserv. 2018, 73, 145A–152A. [Google Scholar] [CrossRef] [Green Version]
  3. Murthy, I.K.; Varghese, V.; Prasad, K.D. Competing Demands on Land: Implications for Carbon Sink Enhancement and Potential of Forest Sector in Karnataka to Contribute to the INDC Forest Goal of India; KVD Prasad: Telangana, India, 2019. [Google Scholar]
  4. Nayak, R.K.; Patel, N.R.; Dadhwal, V.K. Estimation and analysis of terrestrial net primary productivity over India by remote-sensing-driven terrestrial biosphere model. Environ. Monit. Assess. 2010, 170, 195–213. [Google Scholar] [CrossRef]
  5. Marek, M.V.; Janouš, D.; Taufarová, K.; Havránková, K.; Pavelka, M.; Kaplan, V.; Marková, I. Carbon exchange between ecosystems and atmosphere in the Czech Republic is affected by climate factors. Environ. Pollut. 2011, 159, 1035–1039. [Google Scholar] [CrossRef]
  6. Letchov, G. Carbon-use efficiency of terrestrial ecosystems under stress conditions in South East Europe (MODIS, NASA). Multidiscip. Digit. Publ. Inst. Proc. 2018, 2, 363. [Google Scholar] [CrossRef] [Green Version]
  7. Martin, R.; Muûls, M.; De Preux, L.B.; Wagner, U.J. On the empirical content of carbon leakage criteria in the EU Emissions Trading Scheme. Ecol. Econ. 2014, 105, 78–88. [Google Scholar] [CrossRef] [Green Version]
  8. Wang, B.; Zha, T.S.; Jia, X.; Wu, B.; Zhang, Y.Q.; Qin, S.G. Soil moisture modifies the response of soil respiration to temperature in a desert shrub ecosystem. Biogeosciences 2014, 11, 259–268. [Google Scholar] [CrossRef] [Green Version]
  9. Baldocchi, D.D. Assessing the eddy covariance technique for evaluating carbon dioxide exchange rates of ecosystems: Past, present and future. Glob. Chang. Biol. 2003, 9, 479–492. [Google Scholar] [CrossRef] [Green Version]
  10. Pingintha, N.; Leclerc, M.Y.; Beasley, J.P., Jr.; Durden, D.; Zhang, G.; Senthong, C.; Rowland, D. Hysteresis response of daytime net ecosystem exchange during drought. Biogeosciences 2010, 7, 1159–1170. [Google Scholar] [CrossRef] [Green Version]
  11. Taufarová, K.; Havránková, K.; Dvorská, A.; Pavelka, M.; Urbaniak, M.; Janouš, D. Forest ecosystem as a source of CO2 during growing season: Relation to weather conditions. Int. Agrophys. 2014, 28, 239–249. [Google Scholar] [CrossRef] [Green Version]
  12. Raj, R.; Bayat, B.; Lukeš, P.; Šigut, L.; Homolová, L. Analyzing Daily Estimation of Forest Gross Primary Production Based on Harmonized Landsat-8 and Sentinel-2 Product Using SCOPE Process-Based Model. Remote Sens. 2020, 12, 3773. [Google Scholar] [CrossRef]
  13. Huang, J.; Zhou, Y.; Yin, L.; Wenninger, J.; Zhang, J.; Hou, G.; Zhang, E.; Uhlenbrook, S. Climatic controls on sap flow dynamics and used water sources of Salix psammophila in a semi-arid environment in northwest China. Environ. Earth Sci. 2015, 73, 289–301. [Google Scholar] [CrossRef]
  14. Lesk, C.; Rowhani, P.; Ramankutty, N. Influence of extreme weather disasters on global crop production. Nature 2016, 529, 84–87. [Google Scholar] [CrossRef] [PubMed]
  15. Madani, N.; Kimball, J.S.; Ballantyne, A.P.; Affleck, D.L.; Van Bodegom, P.M.; Reich, P.B.; Kattge, J.; Sala, A.; Nazeri, M.; Jones, M.O.; et al. Future global productivity will be affected by plant trait response to climate. Sci. Rep. 2018, 8, 2870. [Google Scholar] [CrossRef] [PubMed] [Green Version]
  16. Reichstein, M.; Bahn, M.; Ciais, P.; Frank, D.; Mahecha, M.D.; Seneviratne, S.I.; Zscheischler, J.; Beer, C.; Buchmann, N.; Frank, D.C.; et al. Climate extremes and the carbon cycle. Nature 2013, 500, 287. [Google Scholar] [CrossRef] [PubMed]
  17. Fu, Z.; Ciais, P.; Bastos, A.; Stoy, P.C.; Yang, H.; Green, J.K.; Wang, B.; Yu, K.; Huang, Y.; Knohl, A.; et al. Sensitivity of gross primary productivity to climatic drivers during the summer drought of 2018 in Europe. Philos. Trans. R. Soc. B 2020, 375, 20190747. [Google Scholar] [CrossRef]
  18. Urban, O.; Janouš, D.; Acosta, M.; Czerný, R.; Markova, I.; Navratil, M.; Pavelka, M.; Pokorný, R.; Šprtová, M.; Zhang, R.; et al. Ecophysiological controls over the net ecosystem exchange of mountain spruce stand. Comparison of the response in direct vs. diffuse solar radiation. Glob. Chang. Biol. 2007, 13, 157–168. [Google Scholar] [CrossRef]
  19. Urban, O.; Klem, K.; Ač, A.; Havránková, K.; Holišová, P.; Navrátil, M.; Zitová, M.; Kozlová, K.; Pokorný, R.; Šprtová, M.; et al. Impact of clear and cloudy sky conditions on the vertical distribution of photosynthetic CO2 uptake within a spruce canopy. Funct. Ecol. 2012, 26, 46–55. [Google Scholar] [CrossRef]
  20. Zhang, M.; Yu, G.R.; Zhuang, J.; Gentry, R.; Fu, Y.L.; Sun, X.M.; Zhang, L.M.; Wen, X.F.; Wang, Q.F.; Han, S.J.; et al. Effects of cloudiness change on net ecosystem exchange, light use efficiency, and water use efficiency in typical ecosystems of China. Agric. For. Meteorol. 2011, 151, 803–816. [Google Scholar] [CrossRef]
  21. Knohl, A.; Baldocchi, D.D. Effects of diffuse radiation on canopy gas exchange processes in a forest ecosystem. J. Abbr. 2008, 113. [Google Scholar] [CrossRef]
  22. Mette, T.; Dolos, K.; Meinardus, C.; Bräuning, A.; Reineking, B.; Blaschke, M.; Pretzsch, H.; Beierkuhnlein, C.; Gohlke, A.; Wellstein, C. Climatic turning point for beech and oak under climate change in Central Europe. Ecosphere 2013, 4, 1–19. [Google Scholar] [CrossRef]
  23. Krupková, L.; Havránková, K.; Krejza, J.; Sedlák, P.; Marek, M.V. Impact of water scarcity on spruce and beech forests. J. For. Res. 2018, 30, 899–909. [Google Scholar] [CrossRef]
  24. Spiecker, H.; Hansen, J.; Klimo, E.; Skovsgaard, J.; Sterba, H.; von Teuffel, K. Norway Spruce Conversion: Options and Consequences; Research Report 18: S. Brill, Leiden; European Forest Institute: Boston, MA, USA, 2004. [Google Scholar]
  25. Hanewinkel, M.; Hummel, S.; Cullmann, D.A. Modelling and economic evaluation of forest biome shifts under climate change in Southwest Germany. For. Ecol. Manag. 2010, 259, 710–719. [Google Scholar] [CrossRef]
  26. Hlásny, T.; Turčáni, M. Persisting bark beetle outbreak indicates the unsustainability of secondary Norway spruce forests: Case study from Central Europe. Ann. For. Sci. 2013, 70, 481–491. [Google Scholar] [CrossRef] [Green Version]
  27. Zang, C.; Hartl-Meier, C.; Dittmar, C.; Rothe, A.; Menzel, A. Patterns of drought tolerance in major European temperate forest trees: Climatic drivers and levels of variability. Glob. Chang. Biol. 2014, 20, 3767–3779. [Google Scholar] [CrossRef] [PubMed]
  28. Jocher, G.; Fischer, M.; Šigut, L.; Pavelka, M.; Sedlák, P.; Katul, G. Assessing decoupling of above and below canopy air masses at a Norway spruce stand in complex terrain. Agric. For. Meteorol. 2020, 294, 108149. [Google Scholar] [CrossRef]
  29. McGloin, R.; Šigut, L.; Fischer, M.; Foltýnová, L.; Chawla, S.; Trnka, M.; Pavelka, M.; Marek, M.V. Available energy partitioning during drought at two Norway spruce forests and a European Beech forest in Central Europe. J. Geophys. Res. Atmos. 2019, 124, 3726–3742. [Google Scholar] [CrossRef]
  30. Sánchez, G.; Serrano, A.; Cancillo, M.L. Effect of cloudiness on solar global, solar diffuse and terrestrial downward radiation at Badajoz (Southwestern Spain). Opt. Pura Appl. 2012, 45, 33–38. [Google Scholar] [CrossRef]
  31. Monteith, J.; Unsworth, M. Principles of Environmental Physics: Plants, Animals, and the Atmosphere; Academic Press: Cambridge, MA, USA, 2013. [Google Scholar]
  32. Thimijan, R.W.; Heins, R.D. Photometric, radiometric, and quantum light units of measure: A review of procedures for interconversion. HortScience 1983, 18, 818–822. [Google Scholar]
  33. Mensah, C.; Šigut, L.; Fischer, M.; Foltýnová, L.; Jocher, G.; Acosta, M.; Kowalska, N.; Kokrda, L.; Pavelka, M.; Marshall, J.D.; et al. Water requirements of short rotation poplar coppice: Experimental and modelling analyses across Europe. Agric. For. Meteorol. 2018, 250, 343–360. [Google Scholar]
  34. Hartig, F.; Minunno, F.; Paul, S. BayesianTools: General-Purpose MCMC and SMC Samplers and Tools for Bayesian Statistics. R Package Version 0.1.6. 2019. Available online: https://CRAN.R-project.org/package=BayesianTools (accessed on 20 March 2021).
  35. Gelman, A.; Rubin, D.B. Inference from iterative simulation using multiple sequences. Stat. Sci. 1992, 7, 457–472. [Google Scholar] [CrossRef]
  36. Brooks, S.P.; Gelman, A. General methods for monitoring convergence of iterative simulations. J. Comput. Graph. Stat. 1998, 7, 434–455. [Google Scholar]
  37. Jackson, R.B.; Canadell, J.; Ehleringer, J.R.; Mooney, H.A.; Sala, O.E.; Schulze, E.D. A global analysis of root distributions for terrestrial biomes. Oecologia 1996, 108, 389–411. [Google Scholar] [CrossRef]
  38. Oren, R.; Sperry, J.S.; Katul, G.G.; Pataki, D.E.; Ewers, B.E.; Phillips, N.; Scháfer, K.V.R. Survey and synthesis of intra-and interspecific variation in stomatal sensitivity to vapour pressure deficit. Plant Cell Environ. 1999, 22, 1515–1526. [Google Scholar] [CrossRef] [Green Version]
  39. Aubinet, M.; Vesala, T.; Papale, D. (Eds.) Eddy Covariance: A Practical Guide to Measurement and Data Analysis; Springer Science and Business Media: Berlin, Germany, 2012. [Google Scholar]
  40. Foken, T.; Leuning, R.; Oncley, S.R.; Mauder, M.; Aubinet, M. Corrections and data quality control. In Eddy Covariance; Springer: Dordrecht, The Netherlands, 2012; pp. 85–131. [Google Scholar]
  41. Wilczak, J.M.; Oncley, S.P.; Stage, S.A. Sonic anemometer tilt correction algorithms. Bound.-Layer Meteorol. 2001, 99, 127–150. [Google Scholar] [CrossRef]
  42. Moncrieff, J.B.; Jarvis, P.G.; Valentini, R. Canopy fluxes. In Methods in Ecosystem Science; Springer: New York, NY, USA, 2000; pp. 161–180. [Google Scholar]
  43. Ibrom, A.; Dellwik, E.; Larsen, S.E.; Pilegaard, K.I.M. On the use of the Webb-Pearman-Leuning theory for closed-path eddy correlation measurements. Tellus B Chem. Phys. Meteorol. 2007, 59, 937–946. [Google Scholar] [CrossRef]
  44. Horst, T.W.; Lenschow, D.H. Attenuation of scalar fluxes measured with spatially-displaced sensors. Bound.-Layer Meteorol. 2009, 130, 275–300. [Google Scholar] [CrossRef]
  45. Wutzler, T.; Lucas-Moffat, A.; Migliavacca, M.; Knauer, J.; Sickel, K.; Šigut, L.; Menzer, O.; Reichstein, M. Basic and extensible post-processing of eddy covariance flux data with REddyProc. Biogeosciences 2018, 15, 5015–5030. [Google Scholar] [CrossRef] [Green Version]
  46. Papale, D.; Reichstein, M.; Aubinet, M.; Canfora, E.; Bernhofer, C.; Kutsch, W.; Longdoz, B.; Rambal, S.; Valentini, R.; Vesala, T.; et al. Towards a standardized processing of Net Ecosystem Exchange measured with eddy covariance technique: Algorithms and uncertainty estimation. Biogeosciences 2006, 3, 571–583. [Google Scholar] [CrossRef] [Green Version]
  47. Reichstein, M.; Falge, E.; Baldocchi, D.; Papale, D.; Aubinet, M.; Berbigier, P.; Bernhofer, C.; Buchmann, N.; Gilmanov, T.; Granier, A.; et al. On the separation of net ecosystem exchange into assimilation and ecosystem respiration: Review and improved algorithm. Glob. Chang. Biol. 2005, 11, 1424–1439. [Google Scholar] [CrossRef]
  48. McGloin, R.; Šigut, L.; Havránková, K.; Dušek, J.; Pavelka, M.; Sedlák, P. Energy balance closure at a variety of ecosystems in Central Europe with contrasting topographies. Agric. For. Meteorol. 2018, 248, 418–431. [Google Scholar] [CrossRef]
  49. R Core Team. R: A Language and Environment for Statistical Computing; R Foundation for Statistical Computing: Vienna, Austria, 2018; Available online: https://www.R-project.org/ (accessed on 22 January 2021).
  50. Gu, L.; Post, W.M.; Baldocchi, D.D.; Black, T.A.; Suyker, A.E.; Verma, S.B.; Vesala, T.; Wofsy, S.C. Characterizing the seasonal dynamics of plant community photosynthesis across a range of vegetation types. In Phenology of Ecosystem Processes; Springer: New York, NY, USA, 2009; pp. 35–58. [Google Scholar]
  51. Ripley, B. Choose a Model by AIC in a Stepwise Algorithm; R Documentation; AIC: Westborough, MA, USA, 2015. [Google Scholar]
  52. Liaw, A.; Wiener, M. Breiman and Cutler’s Random Forests for Classification and Regression Version (4.6–12); R Foundation for Statistical Computing: Vienna, Austria, 2015. [Google Scholar]
  53. Liaw, A.; Wiener, M. Classification and regression by randomForest. R News 2002, 2, 18–22. [Google Scholar]
  54. Breiman, L. Breiman and Cutler’s Random Forests for Classification and Regression: Package ’randomForest’; Institute for Statistics and Mathematics, Vienna University of Economics and Business: Vienna, Austria, 2013. [Google Scholar]
  55. Ciais, P.; Reichstein, M.; Viovy, N.; Granier, A.; Ogée, J.; Allard, V.; Aubinet, M.; Buchmann, N.; Bernhofer, C.; Carrara, A.; et al. Europe-wide reduction in primary productivity caused by the heat and drought in 2003. Nature 2005, 437, 529. [Google Scholar] [CrossRef]
  56. Chapin, F.S.; Matson, P.A.; Vitousek, P. Principles of Terrestrial Ecosystem Ecology; Springer Science & Business Media: Berlin, Germany, 2011. [Google Scholar]
  57. Ågren, G.I.; Andersson, F.O. Terrestrial Ecosystem Ecology: Principles and Applications; Cambridge University Press: Cambridge, MA, USA, 2011. [Google Scholar]
  58. Leuschner, C. Die Trockenheitsempfindlichkeit der Rotbuche vor dem Hintergrund des prognostizierten Klimawandels; Walter de Gruyter GmbH & Co. KG: Berlin, Germany, 2009. [Google Scholar]
  59. Nikolova, P.S.; Raspe, S.; Andersen, C.P.; Mainiero, R.; Blaschke, H.; Matyssek, R.; Häberle, K.H. Effects of the extreme drought in 2003 on soil respiration in a mixed forest. Eur. J. For. Res. 2009, 128, 87–98. [Google Scholar] [CrossRef]
  60. Pretzsch, H.; Grams, T.; Häberle, K.H.; Pritsch, K.; Bauerle, T.; Rötzer, T. Growth and mortality of Norway spruce and European beech in monospecific and mixed- species stands under natural episodic and experimentally extended drought; Results of the KROOF throughfall exclusion experiment. Trees 2020, 34, 957–970. [Google Scholar] [CrossRef]
  61. Dobrovolny, L. Density and spatial distribution of beech (Fagus sylvatica L.) regeneration in Norway spruce (Picea abies (L.) Karsten) stands in the central part of the Czech Republic. iForest-Biogeosci. For. 2016, 9, 666. [Google Scholar] [CrossRef] [Green Version]
  62. Krejza, J.; Cienciala, E.; Světlík, J.; Bellan, M.; Noyer, E.; Horáček, P.; Štěpánek, P.; Marek, M.V. Evidence of climate-induced stress of Norway spruce along elevation gradient preceding the current dieback in Central Europe. Trees 2021, 35, 103–119. [Google Scholar] [CrossRef]
  63. Nishimura, P.H.; Laroque, C.P. Observed continentality in radial growth–climate relationships in a twelve site network in western Labrador, Canada. Dendrochronologia 2011, 29, 17–23. [Google Scholar] [CrossRef]
  64. Zang, C.; Pretzsch, H.; Rothe, A. Size-dependent responses to summer drought in Scots pine, Norway spruce and common oak. Trees 2012, 26, 557–569. [Google Scholar] [CrossRef]
  65. Boden, S.; Kahle, H.P.; von Wilpert, K.; Spiecker, H. Resilience of Norway spruce (Picea abies (L.) Karst) growth to changing climatic conditions in Southwest Germany. For. Ecol. Manag. 2014, 315, 12–21. [Google Scholar] [CrossRef]
  66. Novick, K.A.; Ficklin, D.L.; Stoy, P.C.; Williams, C.A.; Bohrer, G.; Oishi, A.C.; Papuga, S.A.; Blanken, P.D.; Noormets, A.; Sulman, B.N.; et al. The increasing importance of atmospheric demand for ecosystem water and carbon fluxes. Nat. Clim. Chang. 2016, 6, 1023–1027. [Google Scholar] [CrossRef] [Green Version]
  67. Sulman, B.N.; Roman, D.T.; Yi, K.; Wang, L.; Phillips, R.P.; Novick, K.A. High atmospheric demand for water can limit forest carbon uptake and transpiration as severely as dry soil. Geophys. Res. Lett. 2016, 43, 9686–9695. [Google Scholar] [CrossRef]
  68. Kodrik, J.; Kodrik, M. Root biomass of beech as a factor influencing the wind tree stability. J. For. Sci 2002, 48, 549–564. [Google Scholar] [CrossRef]
  69. Lopes de Gerenyu, V.O.; Rozanova, L.N.; Kudeyarov, V.N. Effect of Soil Temperature and Moisture on CO2 Evolution Rate of Cultivated Phaeozem: Analyses of a Long-Term Field Experiment. Plant Soil Environ.-UZPI Czech Repub. 2005, 51, 213–219. [Google Scholar] [CrossRef] [Green Version]
  70. Gu, L.; Meyers, T.; Pallardy, S.G.; Hanson, P.J.; Yang, B.; Heuer, M.; Hosman, K.P.; Riggs, J.S.; Sluss, D.; Wullschleger, S.D. Direct and indirect effects of atmospheric conditions and soil moisture on surface energy partitioning revealed by a prolonged drought at a temperate forest site. J. Geophys. Res. Atmos. 2006, 111. [Google Scholar] [CrossRef]
  71. Jassal, R.S.; Black, T.A.; Novak, M.D.; Gaumont-Guay, D.A.; Nesic, Z. Effect of soil water stress on soil respiration and its temperature sensitivity in an 18-year-old temperate Douglas-fir stand. Glob. Chang. Biol. 2008, 14, 1305–1318. [Google Scholar] [CrossRef]
  72. Gu, L.; Meyers, T.; Pallardy, S.G.; Hanson, P.J.; Yang, B.; Heuer, M.; Hosman, K.P.; Riggs, J.S.; Sluss, D.; Wullschleger, S.D. Climatic drivers of forest productivity in Central Europe. Agric. For. Meteorol. 2002, 234, 258–273. [Google Scholar]
  73. Mensah, C.; Šigut, L.; Fischer, M.; Foltýnová, L.; Jocher, G.; Acosta, M.; Kowalska, N.; Kokrda, L.; Pavelka, M.; Marshall, J.D.; et al. Assessing the Contrasting Effects of the Exceptional 2015 Drought on the Carbon Dynamics in Two Norway Spruce Forest Ecosystems. Atmosphere 2021, 12, 988. [Google Scholar] [CrossRef]
  74. Leuchner, M.; Hertel, C.; Rötzer, T.; Seifert, T.; Weigt, R.; Werner, H.; Menzel, A. Solar radiation as a driver for growth and competition in forest stands. In Growth and Defence in Plants; Springer: Berlin/Heidelberg, Germany, 2012; pp. 175–191. [Google Scholar]
  75. Čater, M.; Diaci, J. Divergent response of European beech, silver fir and Norway spruce advance regeneration to increased light levels following natural disturbance. For. Ecol. Manag. 2017, 399, 206–212. [Google Scholar] [CrossRef]
  76. Lichtenthaler, H.K.; Ač, A.; Marek, M.V.; Kalina, J.; Urban, O. Differences in pigment composition, photosynthetic rates and chlorophyll fluorescence images of sun and shade leaves of four tree species. Plant Physiol. Biochem. 2007, 45, 577–588. [Google Scholar] [CrossRef]
Figure 1. Monthly averages of (a) air temperature, (b) the soil volumetric water content, and (c) vapour pressure deficit for May–September of 2012–2016 in the spruce forest in Bílý Kr̆íz̆ (CZ-BK1), Rájec (CZ-RAJ) and the beech forest Štítná (CZ-Stn) sites. The thick horizontal line in the box plot represents the median value and the box indicates the upper and lower quartiles, with the vertical dotted lines representing the minimum and maximum values. The error bars (whiskers) portray the standard deviation.
Atmosphere 12 01128 g001
Figure 2. Annual trend of the daily potential gross primary productivity (red line) using daily sums of gross primary productivity (GPP) for (a) the wet spruce forest in Bílý Kr̆íz̆ (CZ-BK1), (b) the dry spruce forest in Rájec (CZ-RAJ), and (c) the beech forest in Štítná (CZ-Stn) from 2012 to 2016. The vertical lines represent the main growing season period of May–September.
Atmosphere 12 01128 g002
Figure 3. Annual variations of estimated Normalized gross primary productivity (GPPnorm) within (a) the wet spruce forest in Bílý Kr̆íz̆ (CZ-BK1), (b) the dry spruce forest in Rájec (CZ-RAJ), and (c) the beech forest in Štítná (CZ-Stn) from May to September of 2012–2016. The smoothing spline curves was depict the trends in seasonal courses of GPPnorm during the growing seasons of 2012–2016. The smoothing spline curves ( λ = 0.95) depict the trends in changes of daily GPPnorm values over the growing seasons of 2012–2016.
Atmosphere 12 01128 g003
Figure 4. Comparison between estimated daily normalized gross primary productivity (GPPnorm) derived from eddy covariance measurements and predicted daily GPPnorm estimated from the stepwise multiple linear regression model (SMLR) within (a) the wet spruce forest in Bílý Kr̆íz̆ (CZ-BK1), (b) the dry spruce forest in Rájec (CZ-RAJ), and (c) the beech forest in Štítná (CZ-Stn). 1:1 relationship between the predicted GPPnorm and estimated GPPnorm values from the SMLR are represented by the red line. The shaded blue area represent the 95% confidence interval.
Atmosphere 12 01128 g004
Figure 5. Comparison between estimated daily normalized gross primary productivity (GPPnorm) derived from eddy covariance measurements and predicted daily GPPnorm estimated from the random forest (RF) analyses within (a) the wet spruce forest in Bílý Kr̆íz̆ (CZ-BK1), (b) the dry spruce forest in Rájec (CZ-RAJ), and (c) the beech forest in Štítná (CZ-Stn). 1:1 relationship between the predicted GPPnorm and estimated GPPnorm values from the RF are represented by the red line. The shaded blue area represent the 95% confidence interval.
Atmosphere 12 01128 g005
Figure 6. Predictor variable importance measures from the random forest analyses for (a) the wet spruce forest in Bílý Kr̆íz̆ (CZ-BK1), (b) the dry spruce forest in Rájec (CZ-RAJ), and (c) the beech forest in Štítná (CZ-Stn). CNI: clearness index; PAR: photosynthetic available radiation; Tair: air temperature; Ts: soil temperature; SVWC: the soil volumetric water content; and VPD: vapour pressure deficit.
Atmosphere 12 01128 g006
Figure 7. Prediction of normalized GPP (GPPnorm) at the wet spruce forest in Bílý Kr̆íz̆ (CZ-BK1), the dry spruce forest in Rájec (CZ-RAJ) and the beech forest in Štítná (CZ-Stn) in a form of a decision tree using random forest analyses. The mean square error (mse) indicates the closeness of the predicted GPPnorm to the estimated GPPnorm. The values are daily GPPnorm values. Light colored and white areas represent regions of low GPPnorm, and areas with deep color represent regions of high GPPnorm. CNI: clearness index; PAR: photosynthetic available radiation; Tair: air temperature; Ts: soil temperature; SVWC: the soil volumetric water content; and VPD: vapour pressure deficit.
Atmosphere 12 01128 g007
Table 1. Characteristics of the investigated sites.
Site NameCZ-BK1CZ-RAJCZ-Stn
LocationMoravian-Silesian Beskids
Mountains
Drahany HighlandWhite Carpathian
Mountains
Coordinates49 30 08 N, 18 32 13 E49 26 37 N, 16 41 48 E49 02 09 N, 17 58 12 E
Elevation (in m a.s.l)875625540
TopographyMountainous (13 slope
with SSW exposure, located
close to a mountain ridge)
Hilly (5 slope with NNE
exposure)
Mountainous (10 slope
with WSW exposure)
Ecosystem TypeConiferous evergreen forestConiferous evergreen forestDeciduous broadleaf forest
Prevailing speciesNorway spruce (Picea abies
(L.) Karst.)
Norway spruce (Picea abies
(L.) Karst.)
European beech (Fagus
sylvatica L.)
Canopy height (m)16 (mean, as of 2015)33 (mean, as of 2015)31 (mean, as of 2015)
Stand age (years)35 (as of 2016)113 (as of 2016)115 (as of 2016)
Mean seasonal air
temperature
(May-September; C)
14 *16 *17 *
Total seasonal precipitation
(May-September; mm)
2730 *1635 *1719 *
Seasonal sum of reference
evapotranspiration
(May-September; mm)
2036 *2325 *2166 *
Soil typeHaplic and Entic PodzolModal Cambisol
oligotrophic
Eutric Cambisol
References[28][29][23]
* 2012–2016 study period.
Table 2. Statistical values from the stepwise multiple linear regression model (SMLR) and random forest (RF) analyses showing the accuracy indicators in predicting the Normalized GPP (GPPnorm) values across the wet spruce forest in Bílý Kr̆íz̆ (CZ-BK1), the dry spruce forest in Rájec (CZ-RAJ) and the beech forest in Štítná (CZ-Stn) for May–September of 2012–2016. The Pearson correlation, R2, and root mean square error (RMSE) values have all been shown.
VariantsCZ-BK1CZ-RAJCZ-Stn
SMLRRFSMLRRFSMLRRF
Pearson correlation0.630.760.710.810.670.75
R20.400.570.490.650.450.55
RMSE0.180.150.140.120.150.13
Publisher’s Note: MDPI stays neutral with regard to jurisdictional claims in published maps and institutional affiliations.

