Article

Yield Formation Parameters of Selected Winter Wheat Genotypes in Response to Water Shortage

1
Department of Climate Change Impacts on Agroecosystems, Global Change Research Institute of the Czech Academy of Sciences, Bělidla 986/4a, 603 00 Brno, Czech Republic
2
Department of Agrosystems and Bioclimatology, Faculty of AgriSciences, Mendel University in Brno, Zemědělská 1, 613 00 Brno, Czech Republic
3
Laboratory of Ecological Plant Physiology, Global Change Research Institute of the Czech Academy of Sciences, Bělidla 986/4a, 603 00 Brno, Czech Republic
4
Plant Phenotyping and Biotechnology Platform, Photon Systems Instruments, Průmyslová 470, 664 24 Drásov, Czech Republic
5
Department of Crop Science, Breeding and Plant Medicine, Faculty of AgriSciences, Mendel University in Brno, Zemědělská 1, 613 00 Brno, Czech Republic
6
VCU Department (Oddělení zkoušek užitné hodnoty), Central Institute for Supervising and Testing in Agriculture, Hroznová 63/2, 656 06 Brno, Czech Republic
7
Department of Agrochemistry, Soil Science, Microbiology and Plant Nutrition, Faculty of AgriSciences, Mendel University in Brno, Zemědělská 1, 613 00 Brno, Czech Republic
*
Author to whom correspondence should be addressed.
Agronomy 2022, 12(4), 831; https://doi.org/10.3390/agronomy12040831
Submission received: 7 March 2022 / Revised: 23 March 2022 / Accepted: 23 March 2022 / Published: 29 March 2022
(This article belongs to the Special Issue Wheat Agronomic and Quality Responses to Environmental Impacts)

Abstract

:
To ensure the selection of wheat genotypes that are resilient to future climatic conditions, with drought already being the most significant and acute problem in many areas, twenty winter wheat cultivars were tested for drought stress tolerance from the beginning of stem elongation (DC 30; Zadoks decimal codes) for 49 days (until the stage of grain development, DC 73–75) within an automatic phenotyping platform. The control plants were regularly irrigated to 70% of soil water capacity (SWC), while the drought-stressed plants were subjected to controlled drying until the permanent wilting point (15% of SWC) was reached. Then, the drought-stressed plants were rewatered again to 70% of the maximum SWC. After they recovered, the plants were again exposed to ambient weather conditions. The final yield formation parameters were assessed at the fully ripe stage. Our results showed that the genotypes originating in Western Europe manifested the highest response to the experimentally set drought in the grain number per spike measurement, while the genotypes originating in the warmer regions of southeastern Europe manifested the highest response to the experimental drought mainly in thousand grain weight measurement. Similar response patterns were evident for late- and early-maturing genotypes. The results indicate the potential of selecting genotypes with increased drought resistance even within the existing set of cultivars.

1. Introduction

Mean precipitation under the scenario of 2 °C global warming is predicted to increase during the winter in central and northern Europe and during the summer in northern Europe, while it is projected to decrease in central and southern Europe in the summer [1,2,3,4,5]. However, observations and projections for mean and heavy precipitation are less robust than for temperature means and extremes [4,5]. Moreover, climate models predict that the most intense warming will occur at the middle latitudes in the warm season (with increases of up to 3 °C for 1.5 °C of global warming), which increases the impact of precipitation reduction through increased evapotranspiration and through the additive effects of both types of abiotic stress [4,5]. When the precipitation pattern was analyzed for the period of 1961–2019 for the Czech Republic, a decreasing trend both for the number of precipitation days and the amount of precipitation from April to June was found [6]. This period represents the transition from the vegetative stage to the generative stage in wheat and includes the most sensitive stage—anthesis [7,8]. A complete analysis of the meteorological data for the same period for the Czech Republic revealed that even locations at relatively high altitudes will face drier and warmer-than-optimum conditions by the 2030s and 2040s if the current rate of climate change continues [9]. These trends and predictions of climate models show that drought spells occurring during the vegetation season are a severe threat to agricultural production. As one of the most widely grown agricultural crop species worldwide [10], wheat provides ~19% of global dietary energy [11]. For this reason, it is crucial to ensure sustainable production despite threats due to climate change [12] and increasing demand caused by an increasing global population, which is estimated to reach 9.73 billion people in 2064 [12,13]. It is estimated that global crop production needs to double by 2050 to meet the needs of the growing human population. However, the current increase in global wheat production is only 0.9% per year [11], with the increasing frequency and intensity of drought episodes being among of the most serious causes of such low yield increases [14]. Drought-induced losses in cereal production across the globe were on average 10.1% for the period from 1964 to 2007 and 3.2% for the period of 2000–2007 [15]. Currently, water shortage is the principal abiotic stress factor responsible for yield losses of wheat worldwide [16,17]. Drought-induced yield losses of wheat were recorded in ~75% of harvested areas worldwide from 1983 to 2009 [18], and wheat yields decreased by ~20.6% from 1980 to 2015 [19] and by 27.5% during the period of 1980–2017 due to drought [20]. The reproductive and grain-filling stages of wheat were identified as the stages most threatened by drought stress, which can lead to significant yield losses [21]. Hence, comprehensive knowledge of the responses of wheat plants to drought during the transition from the vegetative stage to the generative stage is essential for providing new opportunities for breeding programs aimed at developing stress-tolerant genotypes [22]. Although the conditions under which wheat varieties have been bred reflect a greater or lesser need for drought resistance as such, they may also reflect the soil environment in the area of origin combined with the climatic conditions that determine the typical water supply pattern and the relevant root system adaptation [23]. However, understanding the general patterns in the relationships between the origin of genotypes, their phenotypic traits, and drought resistance can be useful for the rapid selection of relevant parent components in the breeding programs focused on drought tolerance.
Therefore, it is vital to experimentally assess the impact of continual soil drying during the period with the most significant effects on wheat productivity and, with the highest frequency of drought events expected in the near future, on a set of wheat genotypes that together represent a complete variation of assortment in terms of both origin and time to maturity. For this reason, we carried out a plant phenotyping experiment focused on drought stress applied from the beginning of stem elongation (DC 30 according to Zadoks decimal codes for the growth stages of cereals by Zadoks et al. [24]) until grain development (DC 73–75 according to Zadoks decimal codes). The main objectives of this study were: (i) to identify the differences among the yield formation parameters of tested winter wheat genotypes in response to drought stress from the beginning of stem elongation (DC 30) until grain development (DC 73–75), (ii) to identify genotypes with the most stable yield formation parameters in both the control and the drought stress treatments (these genotypes would, thus, be promising for cultivation in drought-prone environments), and (iii) to identify the general patterns of response to drought for the plants of the groups from the different sites of origin or with a similar time to maturity.
The main hypotheses of this study were: (1) the genotypes differing in their origin and time to maturity have a different response in terms of individual yield formation elements; (2) after the plants are rewatered, the yield formation elements can mutually compensate more for the reduction in grain number per spike (GNS) due to the increased thousand grain weight (TGW) and less for the reduced TGW, as the formation of these elements is shifted in time; and (3) the larger yield reduction is related more to a reduction in GNS than to a reduction in TGW.

2. Materials and Methods

2.1. Plant and Soil Material

Twenty winter wheat (Triticum aestivum L.) genotypes originating from several European countries (Table 1), thus representing different climatic sites of origin, were sown in the second half of October 2017 into plastic pots with a truncated cone shape and a total volume of 3 L (inner width of the larger upper base, 15 cm; width of the smaller lower base, 11.5 cm; height of the pot, 20.5 cm). The soil used for cultivation in the pots consisted of topsoil (0–30 cm) collected from the Polkovice experimental station (199 m a.s.l.). The soil is a Luvic Chernozem with a silty clay texture (26% clay, 64% loam, 10% sand), with a pH(CaCl2) of 7.16. The Ctot was 2.86%; the Ntot was 0.26%; and the contents of P, Ca, Mg, and K (Mehlich III) were 238, 3497, 236, and 498 mg kg−1, respectively. Two seeds were planted per pot, but only one plant was left in each pot after winter at the beginning of the vegetation season to ensure sufficient space for optimal plant growth. The plants were cultivated under ambient weather conditions in a vegetation hall at Mendel University in Brno (235 m above sea level (a.s.l.); 49°12′36.62892″ N, 16°36′48.64716″ E). The vegetation hall is a space with a concrete floor and wire netting instead of a roof and walls. The plants were irrigated in the vegetation hall regularly to prevent drought stress (the total irrigation was 82 mm vegetation season–1). The plants were fertilized and treated for fungal and insect infestations using recommended fertilizers and plant protection products (see Table S1 in the Supplementary Materials). The air temperature was measured at 2 m above the ground both in the vegetation hall and on the phenotyping platform in Drasov (see below; see also Figure S1 in the Supplementary Materials).

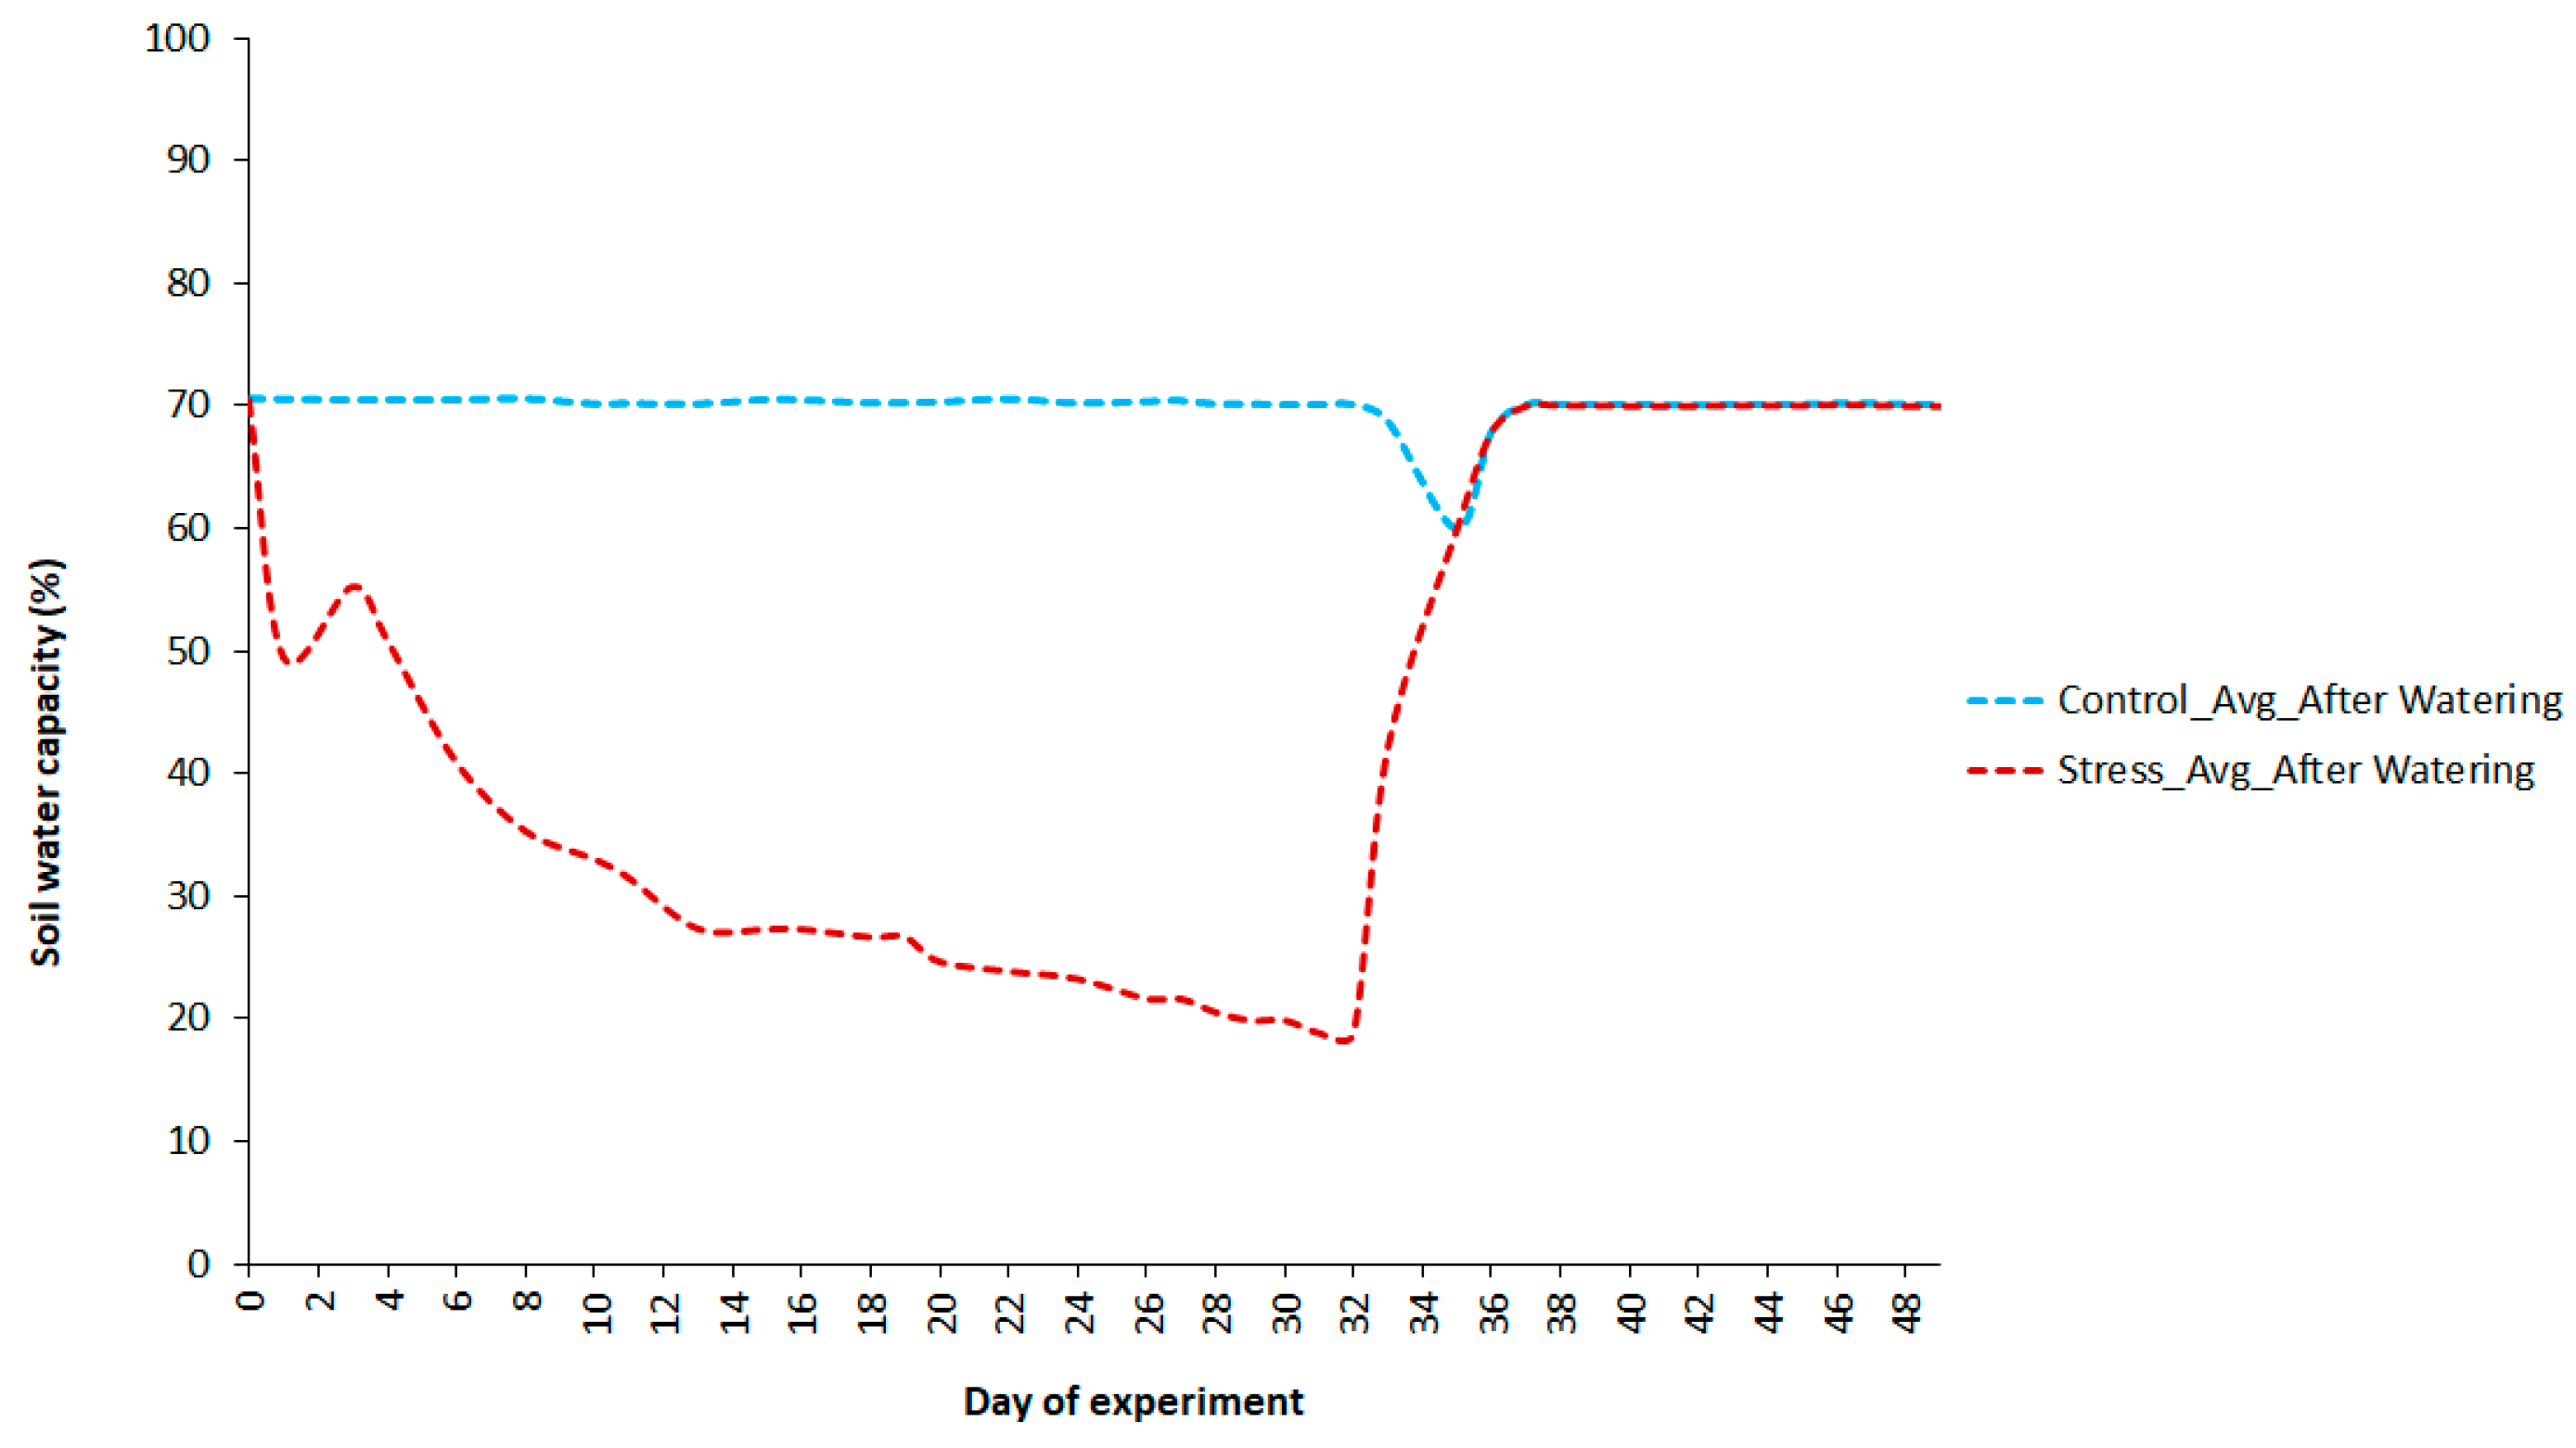
2.2. Control and Drought Stress Treatments

The plants were transported from the vegetation hall to Drasov (265 m a.s.l.; 49°20′14.9″ N, 16°28′34.1″ E) on the phenotyping platform of a PlantScreenTM Modular System (Photon Systems Instruments, Ltd. (PSI), Drasov, Czech Republic) in a greenhouse of PSI at the beginning of stem elongation (DC 30); the experimental phase involving drought stress started at this time. The pots were divided into two experimental treatments, i.e., control and drought stress treatments (see below; n ≥ 4 per 1 treatment of one genotype), and were then placed on the phenotyping platform. The plants were left there for two days to acclimate to the microclimate of the greenhouse and irrigated initially to 70% of the soil water capacity (SWC; calculated on the basis of the soil type amount in the pots). Beginning on the 3rd day, continual drying of the drought stress treatment started, while the pots were irrigated every 2–3 days to the level of the SWC of the pot with the highest soil moisture to ensure the same rate of drying. The pots of the control treatment were weighed daily and irrigated automatically to maintain an SWC of 70% (Figure 1). The drought stress treatment was terminated when the SWC reached 15% of the maximum SWC (the permanent wilting point of the soil used) in the pots of the drought stress treatments (after 32 days; equal to developmental stages DC 61–65), after which the pots were irrigated to 70% SWC, and the plants were allowed to recover for 17 days. The plants were transported back to the vegetation hall after 49 days (at developmental stages DC 73–75) when the experimental phase was completed. The plants were allowed to grow there until they reached fully ripe stage (DC 92), at which time the plants were manually harvested. Afterward, the harvested aboveground biomass was dried for 12 h at 105 °C in an automatic drying oven, and the yield formation parameters (grain number per spike—GNS, grain weight per spike—GWS, thousand grain weight—TGW, and the harvest index—HI) were subsequently assessed.

2.3. Data Processing and Statistical Analyses

The relative drought-induced reduction (DIR) value of a specific parameter was calculated by the equation:
DIR (%) = [(AVGc − D)/AVGc] × 100,
where AVGc is the arithmetic mean of all main spikes within the control treatment of a given genotype and where D is a value of a main spike within the drought stress treatment of that genotype. Analyses of variance (ANOVA; α = 0.05) followed by Tukey’s post hoc tests were performed using STATISTICA 12.0 statistical software (StatSoft, Tulsa, OK, USA). A redundancy analysis (RDA) was performed and a biplot of the RDA results was generated via the software CANOCO 5 [25].

3. Results

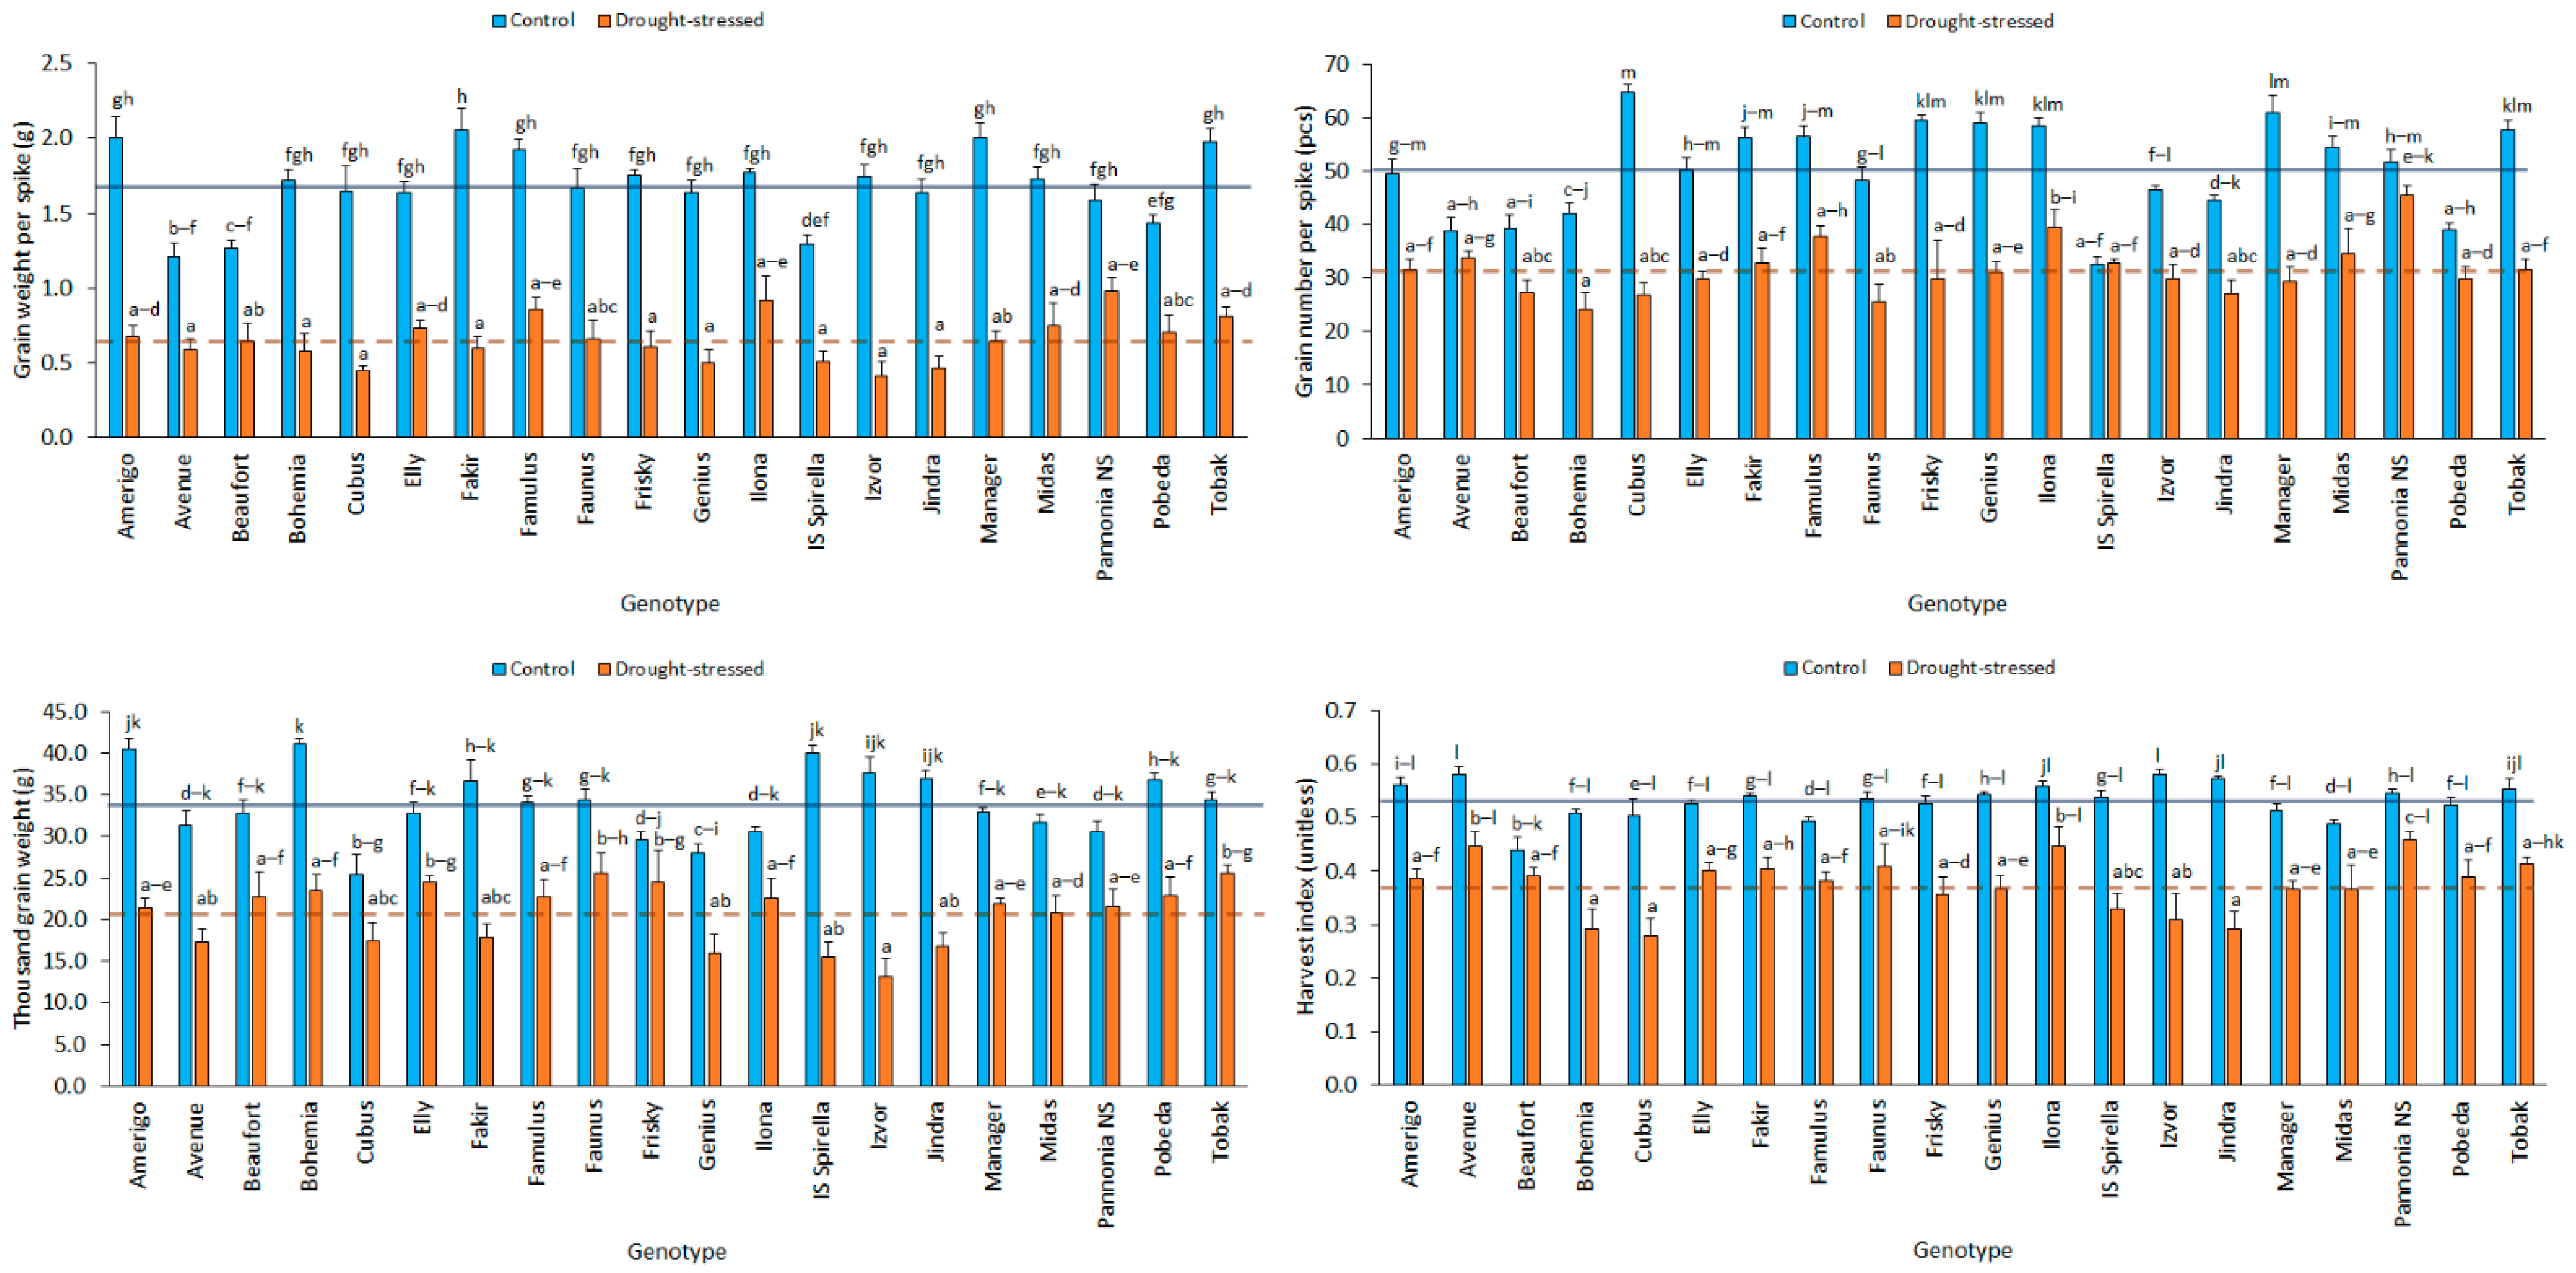
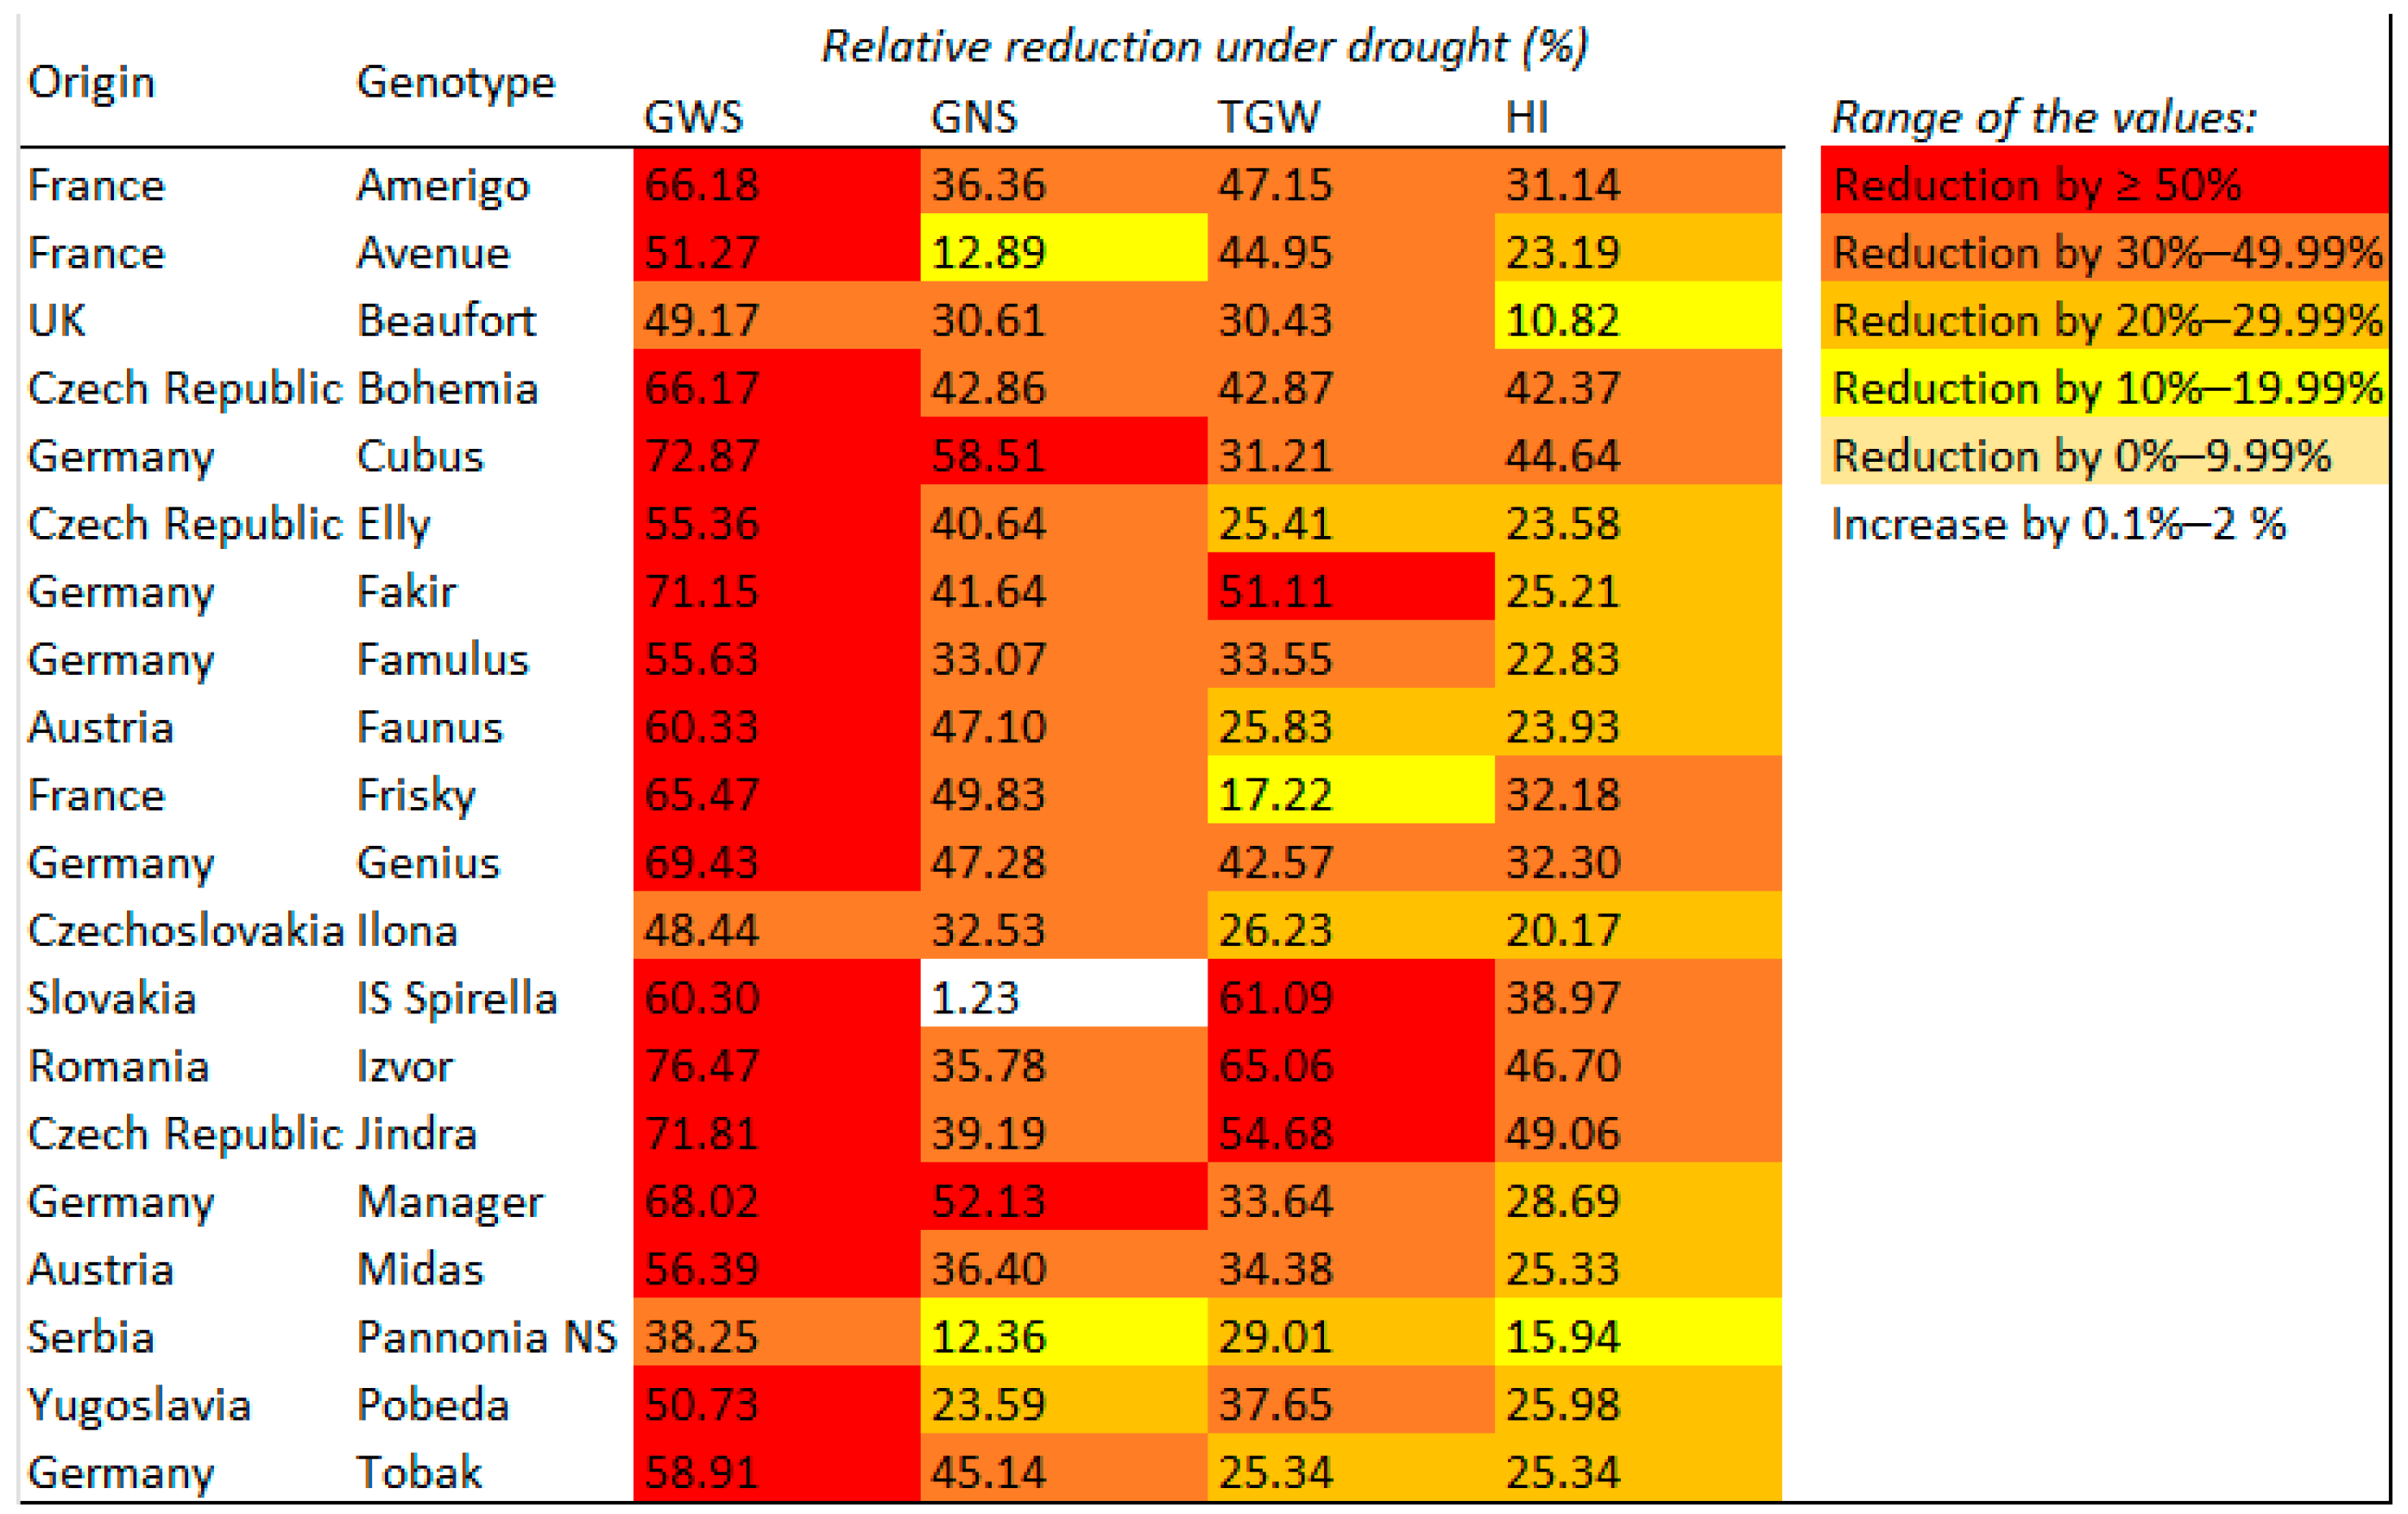
3.1. GWS of Winter Wheat Genotypes under Control and Drought Stress Treatments

The mean relative decline in GWS under drought stress across all tested winter wheat genotypes was 61.3%. GWS was the most affected trait among all the yield formation parameters (Table 2). The effect of drought stress on GWS was statistically significant for all tested winter wheat genotypes when they were analyzed separately (Figure 2). The mean value of a genotype’s GWS was greater than the mean value of all the genotypes in the control and in the drought stress treatments, as well in the case of the genotypes Amerigo, Famulus, Ilona, Midas, and Tobak (Figure 2). The relative reduction in GWS under drought stress ranged from 38.3 to 76.5%, with the smallest reduction in the Pannonia NS variety and the highest in the Izvor variety (Figure 3).

3.2. GNS of Winter Wheat Genotypes under Control and Drought Stress Treatments

The relative decline in the mean GNS value under drought stress was 37.61% (Table 2). There were statistically significant differences among the drought stress and control treatments for all tested winter wheat genotypes, except for Avenue, IS Spirella, and Pannonia NS (Figure 2). Drought stress treatment and the genotype exerted statistically significant effects on GNS values (Figure 2). The mean GNS of the genotypes Fakir, Famulus, Ilona, Midas, Pannonia NS, and Tobak reached values greater than the total GNS mean in both the control and the drought stress treatments (Figure 2).

3.3. TGW of Winter Wheat Genotypes under Control and Drought Stress Treatments

The relative decline in the mean TGW value under drought stress compared to the control was 39%. TGW was the yield formation parameter second most affected by drought (Table 2). Above-average TGW values were achieved for genotypes Amerigo, Bohemia, Famulus, Faunus, Pobeda, and Tobak in both the control and the drought stress treatments (Figure 2). In contrast, statistically nonsignificant differences in mean TGW values between the control and drought stress treatments were found for genotypes Cubus and Frisky (Figure 2).

3.4. HI of Winter Wheat Genotypes under Control and Drought Stress Treatments

The relative decline in the mean HI under drought stress was 29.7%, and the HI was the least affected parameter (Table 2). Statistically significant differences in the HI were found for all the tested genotypes, except Beaufort, between the control and drought stress treatments (Figure 2). Following the ANOVA (Figure 2), the final HI values were found to be statistically significantly affected by genotype and drought stress. HI values greater than the total mean in both the control and the drought stress treatments were found in the case of genotypes Amerigo, Avenue, Fakir, Faunus, Ilona, Pannonia NS, and Tobak (Figure 2). The interaction effects between genotype and drought stress treatment were statistically significant for the HI, GWS, GNS, and TGW (Figure 2).

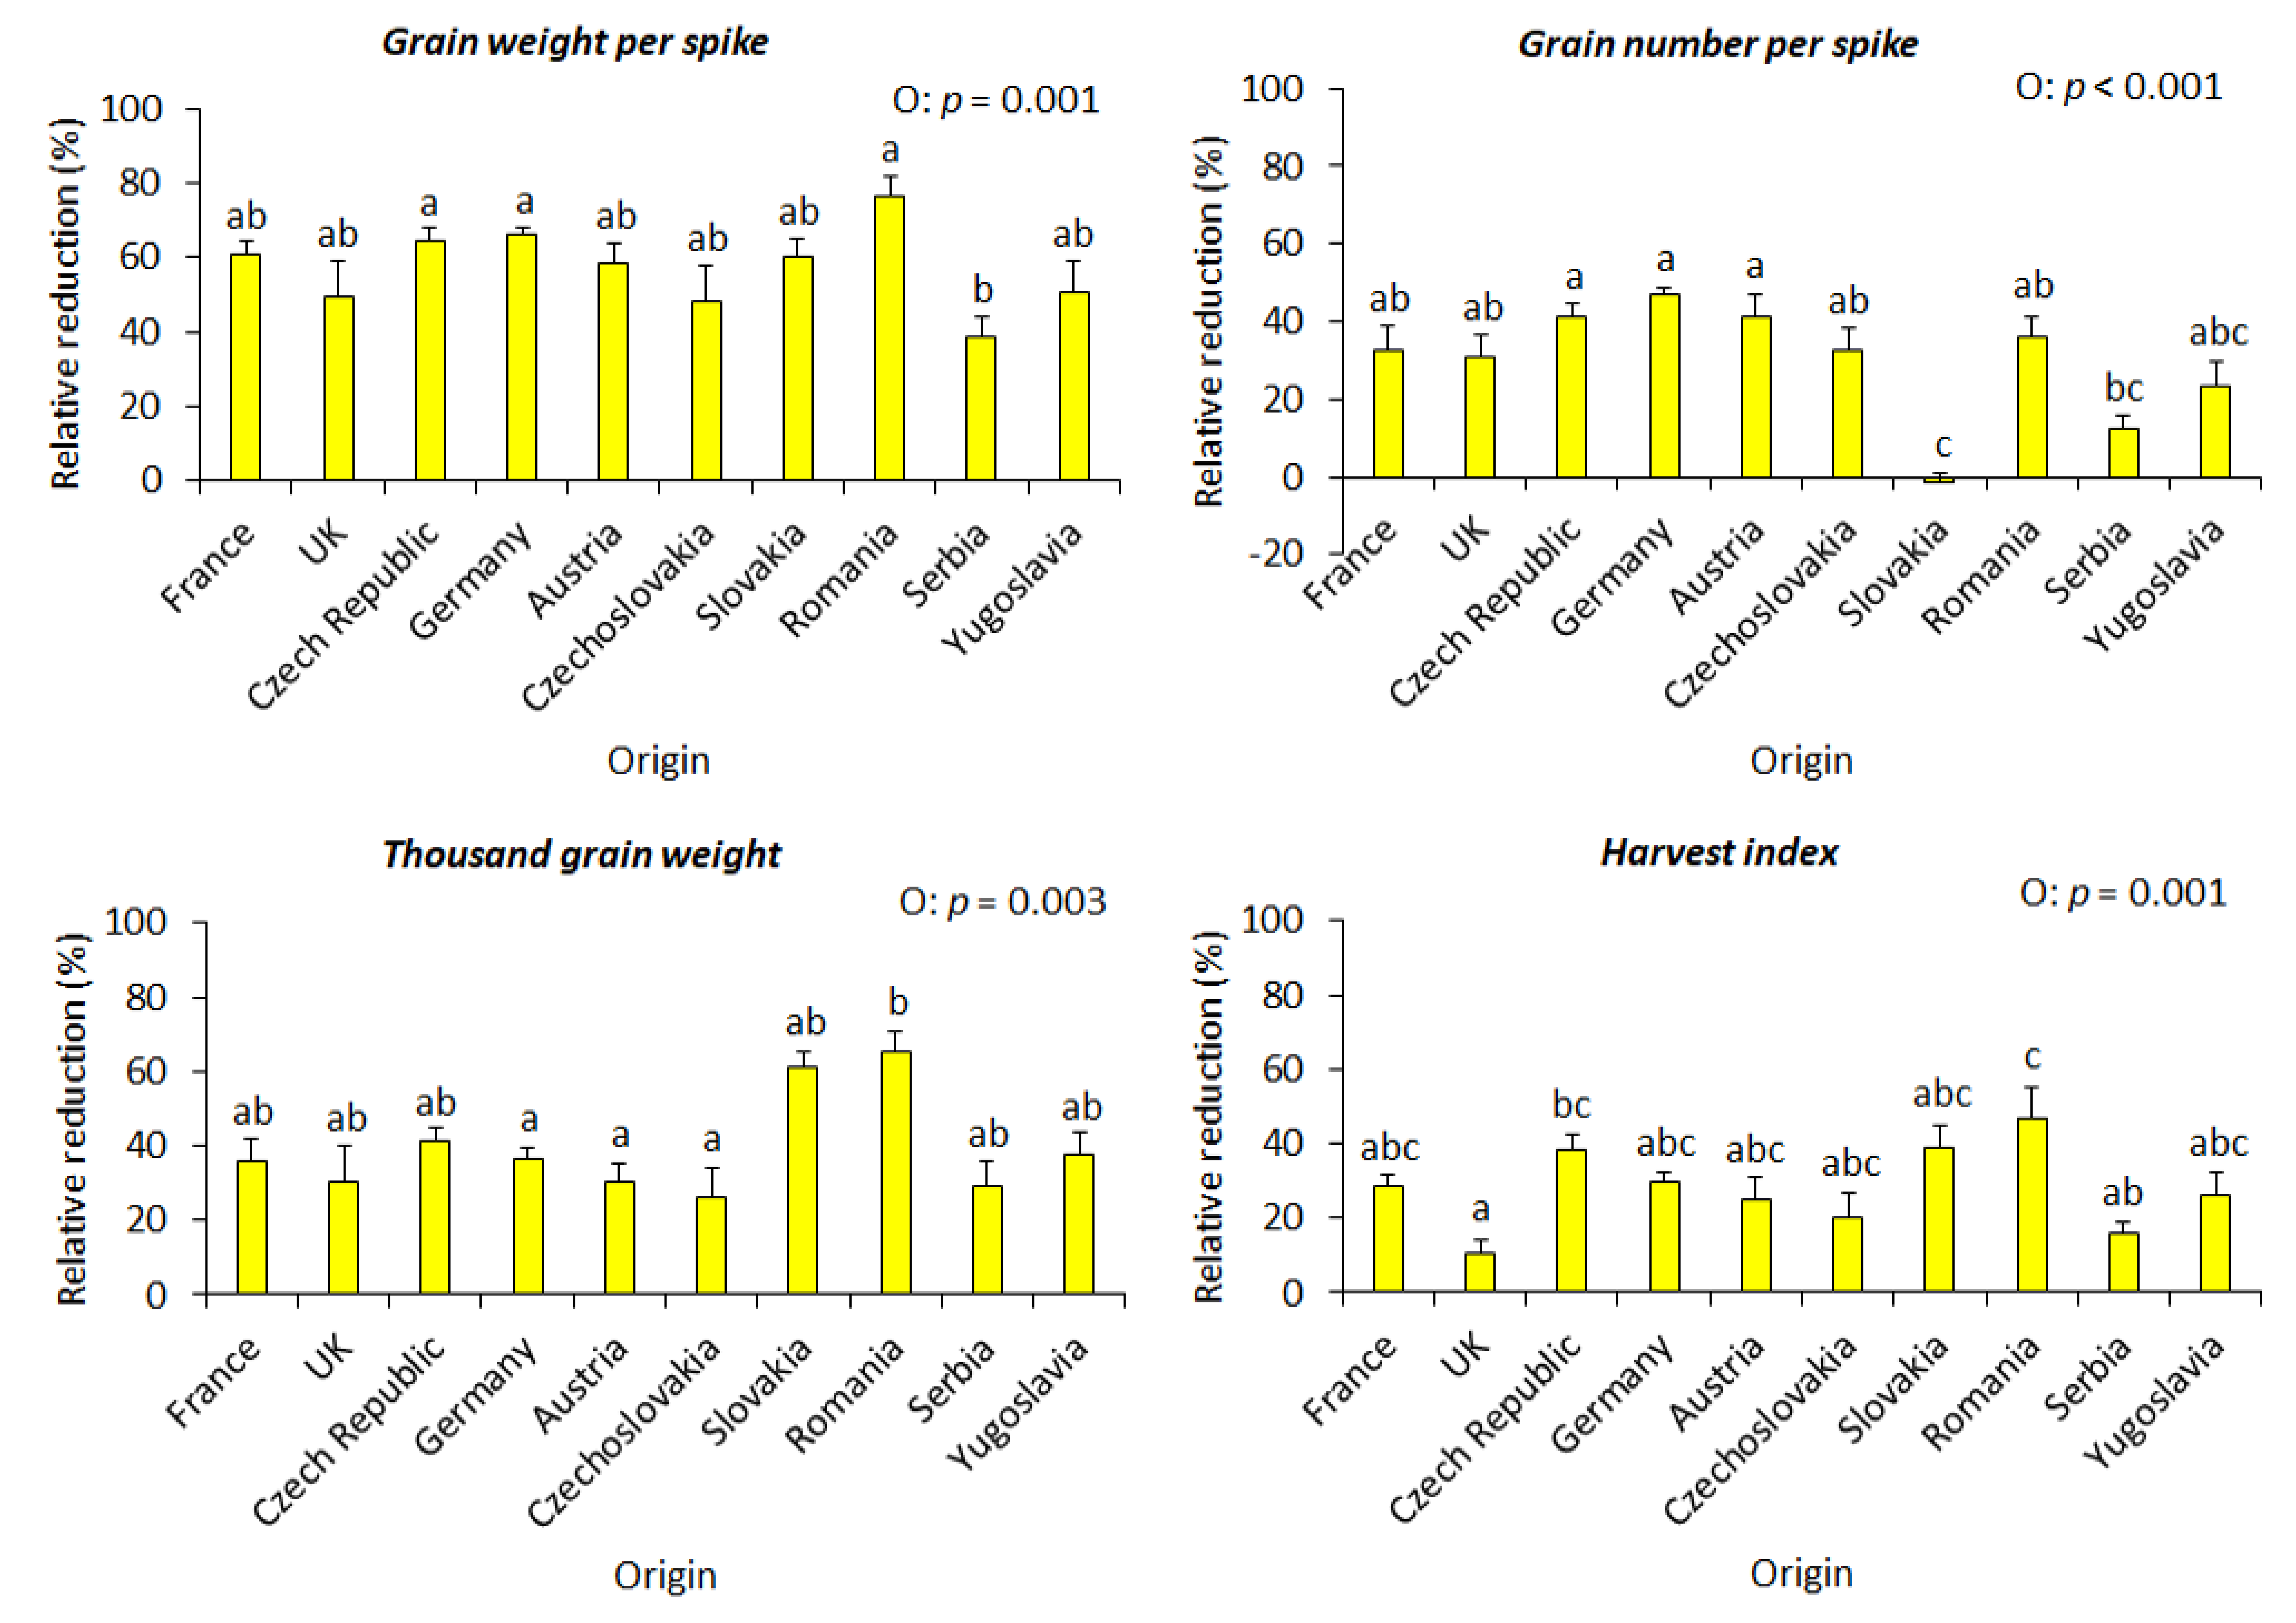
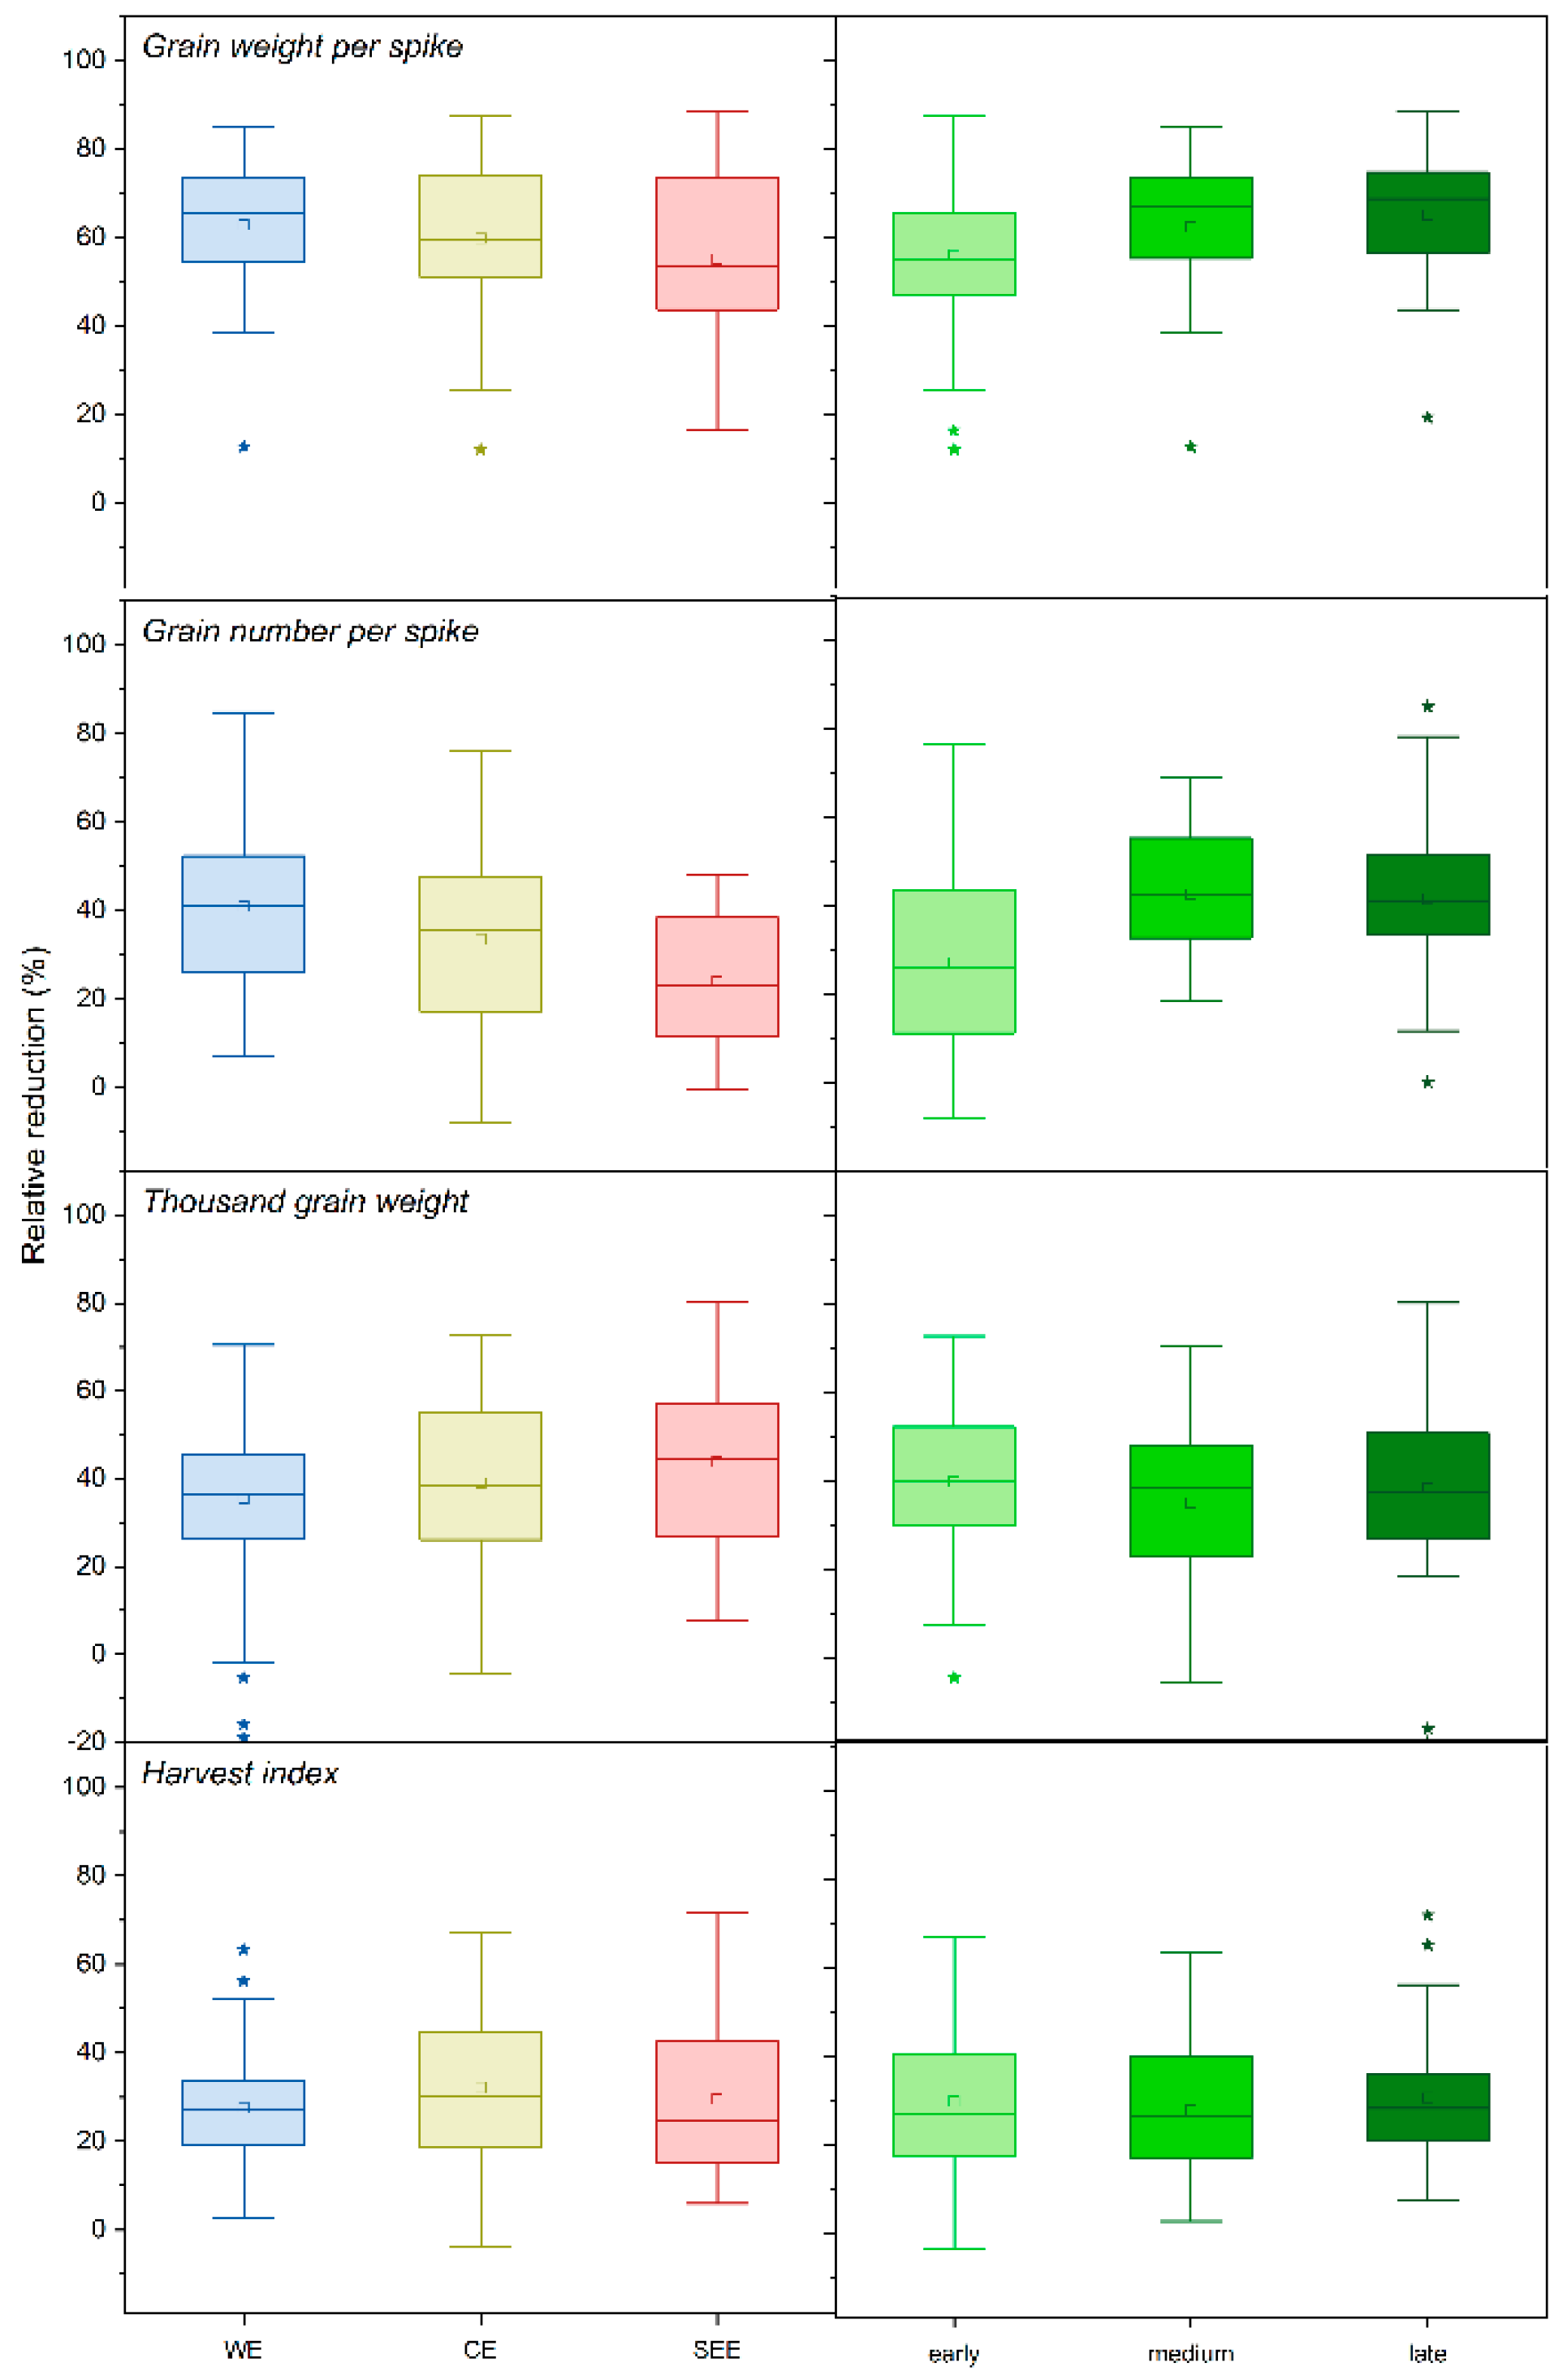
3.5. Yield Formation Parameters in Relation to the Country of Origin, Site of Origin, and Maturity
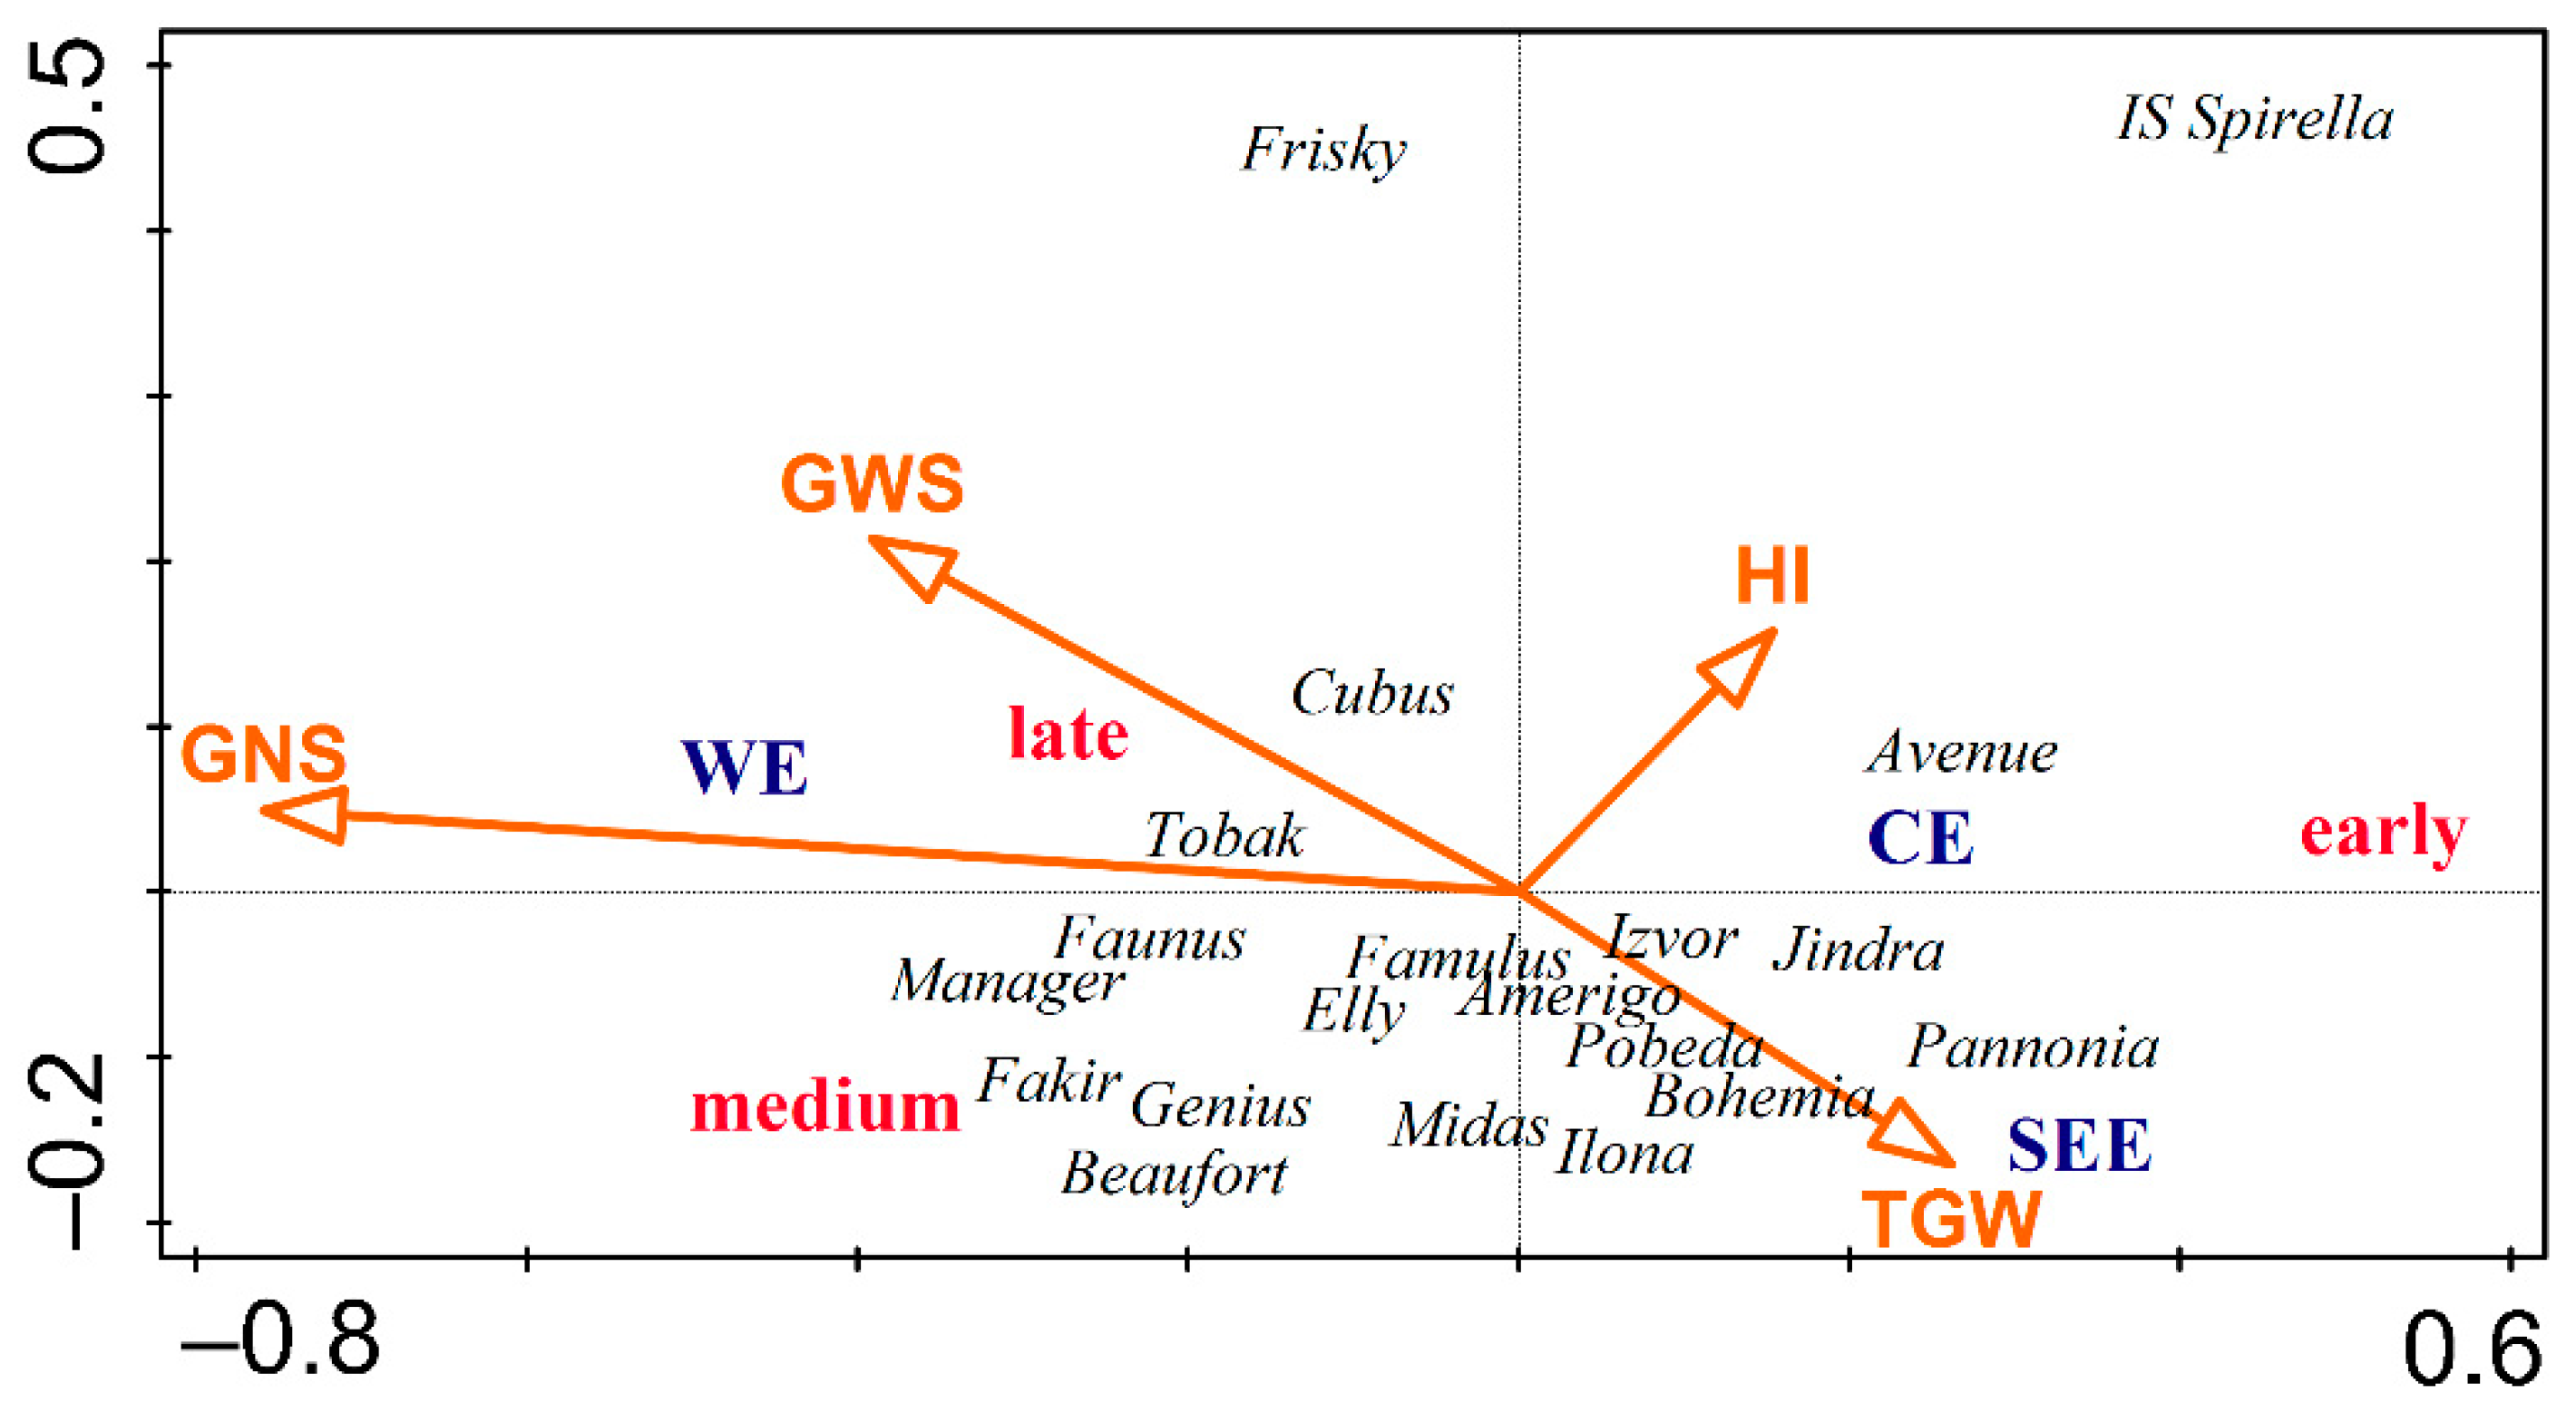
The country of origin was found to be a statistically significant parameter for all yield formation parameters (Figure 4) when the data sets of the yield formation parameters of the winter wheat genotypes were divided into groups by the country of origin (see Table 1). While the mean drought-induced relative reductions in TGW among countries of origin were quite similar for all categories (except for the Izvor genotype from Romania and the IS Spirella genotype from Slovakia, both of which presented markedly larger drought-induced declines compared to those of all the other genotypes), more pronounced differences in drought-induced relative reductions in GWS, GNS, and HI data were found among the categories (Figure 4). The genotypes in the categories of Serbia (Pannonia NS genotype) and former Czechoslovakia (Ilona genotype) presented the smallest drought-induced relative reductions in GWS and TGW (Figure 4).
When yield formation parameters were assessed according to the site of origin of the genotypes tested (Western Europe, Central Europe, and southeastern Europe), the largest drought-induced relative reductions in GWS and GNS were recorded for Western European (WE) genotypes, followed by Central European (CE) genotypes and southeastern European (SEE) genotypes. The opposite trend was observed for TGW, where the SEE genotypes showed the largest mean relative reductions caused by drought stress, followed by CE genotypes and then the WE genotypes. The lowest values of drought-induced relative reductions occurred for TGW compared to the other yield formation parameters, with the largest reductions in CE genotypes followed by SEE genotypes and then WE genotypes (Figure 5). The origin of genotypes was determined to be a statistically significant parameter only in the case of GNS (p = 0.007; data not shown).
When genotypes were assessed according to their time to maturity (early-, medium-, or late-maturing types), the smallest mean drought-induced relative reductions in GWS and GNS were found for early-maturing genotypes. In contrast, the largest drought-induced relative reductions in TGW were observed for early-maturing genotypes. The highest DIR values of GWS and HI parameters were observed for late-maturing genotypes (Figure 5). Time to maturity was determined to be a statistically significant parameter only for GNS data (p < 0.001; data not shown).

3.6. RDA

Multifactorial RDA (Figure 6) revealed associations between the relative reduction in individual yield formation parameters and the region of origin or time to maturity. These results show that a large reduction in GNS under drought stress is associated with WE and late-maturing genotypes, while a reduction in TGW is mainly associated with SEE and early-maturing genotypes. It is also evident that, compared with the TGW reduction, the GNS reduction under drought stress is more pronounced; hence, these results suggest that the final associations between GWS and the region of genotype or time to maturity follow the effect on GNS, although the effect is partly compensated by TGW.

4. Discussion

This study focused on the simulation of continual soil drying during the period of the transition from the vegetative stage to the generative stage of wheat, which is predicted to be the period most affected by the reduction in precipitation in Europe [14] and which, at the same time, represents the most sensitive stage for winter wheat, as most yield parameters are formed sequentially during this period [26]. A PlantScreenTM Modular System phenotyping platform that automatically controls irrigation schedules for individual pots was used to identify the commonalities within European wheat genotypes in their responses to drought, particularly with respect to the region of origin and the earliness of maturity (length of vegetation period). Although the use of such a platform is limited to pot-grown plants where the limited soil volume in the pots could limit plant growth (especially for the roots), such a type of experiment with controlled drought induction allows the identification of the general patterns in responses of yield formation parameters to drought. However, the origin of genotypes can greatly modify their drought resistance also by adapting the root system architecture to the conditions of typical plant water supply. These are basically determined by a combination of soil and climatic conditions, ranging from storage-driven water supply, typical for deeper soils with higher organic matter content, to supply-driven conditions, characteristic of shallow soils with sand-dominated texture or higher stone content [23]. This work did not aim to reveal these differences in the response of wheat genotypes to drought due to root architecture, because the objective was to assess the association of drought response to genotype earliness or the potential physiological or biochemical mechanisms related to the conditions of genotype origin. However, we can suggest that the escape strategy of early-maturing genotypes can be potentially more successful for storage-driven conditions, where deeper or dense roots bring only a minor advantage.
The yield formation of wheat is substantially influenced by the drought stress applied during reproductive growth stages, as reported by Pradhan et al. [27], Trnka et al. [14], Farooq et al. [7], and Iqbal et al. [28]. Sarto et al. [26] identified three critical stages in wheat development, wherein the occurrence of drought most affects the wheat yield: floral initiation and inflorescence development, anthesis, and the beginning of grain formation, which were the targeted stages of our phenotyping experiment. The aim of this study was to determine the contribution of individual yield formation parameters to the overall yield response to drought in selected winter wheat genotypes representing the current range of variability in the region of origin and the length of the vegetation period. Such a study, which would allow us to gain an understanding of the general patterns in the response of yield formation parameters to drought and which would help with the better targeting of wheat breeding, or the evaluation of the potential for the cultivation of specific groups of genotypes in drought-prone environments, is still lacking.
There are many studies that involve assessments of yield formation parameters under drought stress at various developmental stages, i.e., at anthesis [8,29], at the anthesis and grain-filling stages [7,8], and at the grain-filling stage [30,31], but only a few studies [32,33] have focused on the responses of wheat exposed to drought stress treatments starting from the stem elongation stage. However, both changes in precipitation pattern and increasing temperatures driving non-linear increases in vapor pressure deficit (VPD), and the subsequent depletion of water from the soil [34], result in a shift of drought episodes to the earlier growth stages and their prolongation up to the stage of grain development [35,36]. At the same time, the period starting with the beginning of stem elongation and ending with grain development is the period with the highest water consumption [26].
Due to a considerable range of winter wheat earliness (days to maturity or days to flowering) within both the currently grown varieties and genetic resources, drought escape represents one of the most commonly used mechanisms of drought resistance [37]. Drought escape is generally the ability of plants to complete their life cycles before the onset of drought or before the drought causes several damages to the yield [38]. The drought escape mechanism through earliness has been recognized in wheat as a key criterion for breeding for combined drought and high-temperature tolerance [39]. Earliness can be very important for wheat production in conditions of terminal drought, since this can minimize exposure to dehydration during the sensitive flowering and post-anthesis grain-filling periods [37]. A gradual shift toward a shorter vegetation period has been observed over the last century of wheat breeding in countries with a Mediterranean-type climate and frequent terminal drought, which was considered to be a successful strategy against terminal drought [40]. On the other hand, if mild drought occurs early in the pre-anthesis stage, it can cause, in genotypes with a drought escape strategy, a strong negative effect on growth and yield as the plants trigger the processes, leading to the premature termination of vegetation [41]. A shorter vegetation period may also mean a trade-off for yield potential under favorable moisture conditions [42].
Our results indicate that early-maturing genotypes show a generally higher sensitivity of TGW and a lower sensitivity of GNS and GWS to drought in comparison with both medium-maturing and late-maturing genotypes. A lower relative response to drought was particularly evident in early-maturing genotype Pannonia NS. However, the early-maturing genotypes also showed a rather lower level of GWS and, thus, also a lower yield potential under well-watered conditions. However, it is evident that the drought escape mechanism can be a relatively effective strategy, even if drought starts during the vegetative phase, because the highest absolute values of GWS under drought were, in our experiment, reached in the early-maturing genotypes (particularly Pannonia NS and Ilona). Early-maturing wheat genotypes seem to maintain higher productivity (GWS) under drought stress mainly through a lower sensitivity of GNS. GNS is considered to be the primary contributor to yield losses caused by drought stress at early reproductive stages, e.g., [43], and as reported earlier, GNS was more affected by drought stress at DC 31 in comparison to the beginning of anthesis (DC 61) and the medium milk-ripening stage (DC 75) [8]. A very contrasting response to drought within the early-maturing genotypes was represented by the genotype IS Spirella, in which practically no decrease in GNS, and, on the contrary, a very large reduction in TGW, was observed under drought stress. However, this strategy does not seem to be appropriate for maintaining a high yield under drought, as both the relative and absolute values of GWS indicate the high drought susceptibility of this genotype. Our results also proved that from the point of view of yield reduction (GWS), the reduction of GNS is essential. This trait is more affected by the drought in late-maturing genotypes and, more generally, in genotypes originating from Western Europe. Although the results show that the sensitivity of both yield formation parameters GNS and TGW to drought has to be balanced, the importance of GNS stability under drought stress will become more important in breeding strategies, and such stability is associated with early-maturing genotypes (with the drought escape strategy).
Our results also showed that HI represents relatively high stability in response to drought and is less reduced compared to yield formation parameters. While GWS was reduced by drought on average by 61.3%, HI showed a reduction of 29.7%. Similar results were observed in pot-grown wheat genotypes in Pakistan, where 45% and 37% reductions were observed for grain yield and HI data, respectively, when drought stress was applied from the heading stage until maturity and the soil moisture content was maintained at 30% field capacity [33]. Given the results of the drought stress and control treatments (Figure 2), owing to its stable values of all yield formation parameters under both water treatments, the early-maturing genotype Ilona, along with Pannonia NS, represented the most promising genotype for cultivation under water-deficit conditions, while for cultivation under well-watered conditions, the late-maturing genotypes Manager, Fakir, and Tobak, along with medium-maturing genotype Amerigo, revealed the highest yield potential. As reported in a meta-analysis conducted by Li et al. [44], a smaller reduction in aboveground biomass and yield can be attributed to drought avoidance mechanisms in old hexaploid wheat genotypes [44], leading to a reduced transpiration rate [45,46]. In contrast, unlike modern cultivars, older cultivars were found to be low-yielding and less responsive to favorable environments for grain yield and yield components in a study in which hard red winter wheat genotypes were cultivated under ambient field conditions across various cultivation areas in Nebraska [47]. The yield formation parameters of all winter wheat genotypes tested in this study presented substantially decreased values under the drought stress treatment compared to the well-watered control treatment, the results of which were caused by the acceleration of plant development and the shortening of the growth stage [48]; thus, the reproductive potentials of plants were hardly attainable [49].
The data presented in this study can be used to improve crop models through better parametrization of yield formation under drought stress and, particularly, through incorporating the effect of earliness on yield response to drought. The results obtained also have importance for the breeding strategy formulation aimed at improving crop productivity in drought-prone areas through conventional breeding [50,51]. Yield stability under water-deficient conditions and water use efficiency should be key targets, as reviewed by Nezhadahmadi et al. [52].

5. Conclusions

This study shows that drought stress during the transition from the vegetative stage to the generative stage results primarily in a reduction in GWS, which is more associated with WE and late-maturing genotypes. The RDA indicated that the larger GWS reduction is associated particularly with late-maturing genotypes, and that GWS reduction under drought stress is related to a reduction in GNS. The smallest reduction in GWS and also the highest absolute GWS under drought stress was revealed for old and early-maturing genotypes Ilona (reduction 48%) and Pannonia NS (38%), while the largest GWS reduction was manifested in late-maturing genotype Izvor (76%), and medium-maturing Cubus (73%). Thus, it has been confirmed that the drought escape mechanism (early-maturing genotypes) can be an effective strategy for overcoming drought stress during the transition from the vegetative stage to the generative stage. However, the highest absolute GWS under well-watered conditions was achieved in late-maturing genotypes Fakir, Manager, and Tobak and the medium-maturing genotype Amerigo. We suggest that future breeding for drought-prone conditions should focus primarily on the increased stability of the GNS under drought but, at the same time, also on a balanced tolerance of the TGW response, as high GNS tolerance to drought alone (as shown in genotype IS Spirella) can be associated with a large TGW reduction and, therefore, also with the resulting lower GWS resistance to drought. The results of this study also suggest that potentially suitable genotypes for environments facing water scarcity could be found among older winter wheat genotypes, which, however, are not able to achieve the productivity of modern late-maturing wheat genotypes under well-watered conditions. However, it should also be emphasized that this study does not include genotypic differences in the adaptation of the root system to different types of droughts as defined by soil conditions. Within the breeding of new genotypes, it is, therefore, necessary to consider whether these are genotypes for storage-driven conditions where the escape strategy of early-maturing genotypes can provide success or supply-driven conditions, where a deep and dense root system is needed. These results can contribute to improving crop growth model parametrization through understanding the role of the drought escape strategy in yield formation under drought stress, and they can serve as tools for defining the new wheat breeding strategies.

Supplementary Materials

The following supporting information can be downloaded at: https://www.mdpi.com/article/10.3390/agronomy12040831/s1, Figure S1: Mean daily air temperatures at a height of 2 m among the experimental plants in the vegetation hall in Brno and on the phenotyping platform of the greenhouse in Drasov. Minimal (MIN), maximal (MAX), and mean (AVG) air temperatures for (1) daily measurements (from 0:00 to 24:00) and for (2) original 10 min measurement increments (in the vegetation hall) or original 1 min measurement increments (in the greenhouse) are presented; Table S1: Applications of fertilizers and plant protection products on wheat plants.

Author Contributions

Conceptualization, K.K. and M.T.; Data curation, M.H., K.K. and M.T.; Formal analysis, M.H. and K.K.; Investigation, M.H., K.K., J.P., B.V. and M.T.; Methodology, K.K. and M.T.; Project administration, M.H., K.K., J.P. and M.T.; Resources, J.P., B.V., P.H., P.S., V.H. and P.Š.; Supervision, K.K. and M.T.; Visualization, M.H. and K.K.; Writing—original draft, M.H.; Writing—review and editing, K.K. and M.T. All authors have read and agreed to the published version of the manuscript.

Funding

The research was financially supported by “SustES—Adaptation strategies for sustainable ecosystem services and food security under adverse environmental conditions” (CZ.02.1.01/0.0/0.0/16_019/0000797).

Data Availability Statement

The data presented in this study are available upon request from the corresponding author.

Conflicts of Interest

The authors declare no conflict of interest.

References

  1. Vautard, R.; Gobiet, A.; Sobolowski, S.; Kjellström, E.; Stegehuis, A.; Watkiss, P.; Mendlik, T.; Landgren, O.; Nikulin, G.; Teichmann, C.; et al. The European climate under a 2 °C global warming. Environ. Res. Lett. 2014, 9, 034006. [Google Scholar] [CrossRef]
  2. Jacob, D.; Kotova, L.; Teichmann, C.; Sobolowski, S.P.; Vautard, R.; Donnelly, C.; Koutroulis, A.G.; Grillakis, M.G.; Tsanis, I.K.; Damm, A.; et al. Climate impacts in Europe under +1.5 °C global warming. Earth’s Future 2018, 6, 264–285. [Google Scholar] [CrossRef] [Green Version]
  3. Kjellström, E.; Nikulin, G.; Strandberg, G.; Christensen, O.B.; Jacob, D.; Keuler, K.; Lenderink, G.; van Meijgaard, E.; Schär, C.; Somot, S.; et al. European climate change at global mean temperature increases of 1.5 and 2 °C above pre-industrial conditions as simulated by the EURO-CORDEX regional climate models. Earth Syst. Dynam. 2018, 9, 459–478. [Google Scholar] [CrossRef] [Green Version]
  4. IPCC (The Intergovernmental Panel on Climate Change). Summary for policymakers. In Global Warming of 1.5 °C. An IPCC Special Report on the Impacts of Global Warming of 1.5 °C above Pre-Industrial Levels and Related Global Greenhouse Gas Emission Pathways, in the Context of Strengthening the Global Response to the Threat of Climate Change, Sustainable Development, and Efforts to Eradicate Poverty; Masson-Delmotte, V., Zhai, P., Pörtner, H.-O., Roberts, D., Skea, J., Shukla, P.R., Pirani, A., Moufouma-Okia, W., Péan, C., Pidcock, R., et al., Eds.; World Meteorological Organization: Geneva, Switzerland, 2018; pp. 3–26. [Google Scholar]
  5. IPCC (The Intergovernmental Panel on Climate Change). Summary for policymakers. In Climate Change 2021: The Physical Science Basis. Contribution of Working Group I to the Sixth Assessment Report of the Intergovernmental Panel on Climate Change; Masson-Delmotte, V., Zhai, P., Pirani, A., Connors, S.L., Péan, C., Berger, S., Caud, N., Chen, Y., Goldfarb, L., Gomis, M.I., et al., Eds.; Cambridge University Press: Cambridge, UK, 2021; pp. 4–41. [Google Scholar]
  6. Brázdil, R.; Zahradníček, P.; Dobrovolný, P.; Štěpánek, P.; Trnka, M. Observed changes in precipitation during recent warming: The Czech Republic, 1961–2019. Int. J. Climatol. 2021, 41, 3881–3902. [Google Scholar] [CrossRef]
  7. Farooq, M.; Hussain, M.; Siddique, K.H.M. Drought stress in wheat during flowering and grain-filling periods. Crit. Rev. Plant Sci. 2014, 33, 331–349. [Google Scholar] [CrossRef]
  8. Hlaváčová, M.; Klem, K.; Rapantová, B.; Novotná, K.; Urban, O.; Hlavinka, P.; Smutná, P.; Horáková, V.; Škarpa, P.; Pohanková, E.; et al. Interactive effects of high temperature and drought stress during stem elongation, anthesis and early grain filling on the yield formation and photosynthesis of winter wheat. Field Crops Res. 2018, 221, 182–195. [Google Scholar] [CrossRef]
  9. Trnka, M.; Brázdil, R.; Balek, J.; Dubrovský, M.; Eitzinger, J.; Hlavinka, P.; Chuchma, F.; Možný, M.; Prášil, I.; Růžek, P.; et al. Observed changes in the agroclimatic zones in the Czech Republic between 1961 and 2019. Plant Soil Environ. 2021, 67, 154–163. [Google Scholar] [CrossRef]
  10. Fischer, T.; Byerlee, D.; Edmeades, G. Crop Yields and Global Food Security: Will Yield Increase Continue to Feed the World? ACIAR Monograph No. 158; Australian Centre for International Agricultural Research (ACIAR): Canberra, Australia, 2014.
  11. Ray, D.K.; Mueller, N.D.; West, P.C.; Foley, J.A. Yield trends are insufficient to double global crop production by 2050. PLoS ONE 2013, 8, e66428. [Google Scholar] [CrossRef] [PubMed] [Green Version]
  12. Slafer, G.A.; Savin, R.; Pinochet, D.; Calderini, D.F. Chapter 3—Wheat. In Crop Physiology: Case Histories for Major Crops; Sadras, V.O., Calderini, D.F., Eds.; Academic Press (Imprint of Elsevier Inc.): London, UK, 2021; pp. 98–163. [Google Scholar]
  13. Vollset, S.E.; Goren, E.; Yuan, C.W.; Cao, J.; Smith, A.E.; Hsiao, T.; Bisignano, C.; Azhar, G.S.; Castro, E.; Chalek, J.; et al. Fertility, mortality, migration, and population scenarios for 195 countries and territories from 2017 to 2100: A forecasting analysis for the Global Burden of Disease Study. Lancet 2020, 396, 1285–1306. [Google Scholar] [CrossRef]
  14. Trnka, M.; Rötter, R.P.; Ruiz-Ramos, M.; Kersebaum, K.C.; Olesen, J.E.; Žalud, Z.; Semenov, M.A. Adverse weather conditions for European wheat production will become more frequent with climate change. Nat. Clim. Chang. 2014, 4, 637–643. [Google Scholar] [CrossRef]
  15. Lesk, C.; Rowhani, P.; Ramankutty, N. Influence of extreme weather disasters on global crop production. Nature 2016, 529, 84–87. [Google Scholar] [CrossRef]
  16. Ding, H.; Liu, D.; Liu, X.; Li, Y.; Kang, J.; Lv, J.; Wang, G. Photosynthetic and stomatal traits of spike and flag leaf of winter wheat (Triticum aestivum L.) under water deficit. Photosynthetica 2018, 56, 687–697. [Google Scholar] [CrossRef]
  17. de Oliveira Silva, A.; Slafer, G.A.; Fritz, A.K.; Lollato, R.P. Physiological basis of genotypic response to management in dryland wheat. Front. Plant Sci. 2020, 10, 1644. [Google Scholar] [CrossRef] [PubMed]
  18. Kim, W.; Iizumi, T.; Nishimori, M. Global patterns of crop production losses associated with droughts from 1983 to 2009. J. Appl. Meteorol. Climatol. 2019, 58, 1233–1244. [Google Scholar] [CrossRef]
  19. Daryanto, S.; Wang, L.; Jacinthe, P.-A. Global synthesis of drought effects on maize and wheat production. PLoS ONE 2016, 11, e0156362. [Google Scholar] [CrossRef] [PubMed]
  20. Zhang, J.; Zhang, S.; Cheng, M.; Jiang, H.; Zhang, X.; Peng, C.; Lu, X.; Zhang, M.; Jin, J. Effect of drought on agronomic traits of rice and wheat: A meta-analysis. Int. J. Environ. Res. Public Health 2018, 15, 839. [Google Scholar] [CrossRef] [PubMed] [Green Version]
  21. Sehgal, A.; Sita, K.; Siddique, K.H.M.; Kumar, R.; Bhogireddy, S.; Varshney, R.K.; HanumanthaRao, B.; Nair, R.M.; Prasad, P.V.V.; Nayyar, H. Drought or/and heat-stress effects on seed filling in food crops: Impacts on functional biochemistry, seed yields, and nutritional quality. Front. Plant Sci. 2018, 9, 1705. [Google Scholar] [CrossRef] [Green Version]
  22. Hein, N.T.; Ciampitti, I.A.; Jagadish, S.V.K. Bottlenecks and opportunities in field-based high-throughput phenotyping for heat and drought stress. J. Exp. Bot. 2021, 72, 5102–5116. [Google Scholar] [CrossRef]
  23. Bodner, G.; Nakhforoosh, A.; Kaul, H.-P. Management of crop water under drought: A review. Agron. Sustain. Dev. 2015, 35, 401–442. [Google Scholar] [CrossRef]
  24. Zadoks, J.C.; Chang, T.T.; Konzak, C.F. A decimal code for the growth stages of cereals. Weed Res. 1974, 14, 415–421. [Google Scholar] [CrossRef]
  25. Šmilauer, P.; Lepš, J. Multivariate Analysis of Ecological Data Using Canoco 5, 2nd ed.; Cambridge University Press: Cambridge, UK, 2014. [Google Scholar]
  26. Sarto, M.V.M.; Sarto, J.R.W.; Rampim, L.; Rosset, J.S.; Bassegio, D.; da Costa, P.F.; Inagaki, A.M. Wheat phenology and yield under drought: A review. Aust. J. Crop Sci. 2017, 11, 941–946. [Google Scholar] [CrossRef]
  27. Pradhan, G.P.; Prasad, P.V.V.; Fritz, A.K.; Kirkham, M.B.; Gill, B.S. Effects of drought and high temperature stress on synthetic hexaploidy wheat. Funct. Plant Biol. 2012, 39, 190–198. [Google Scholar] [CrossRef] [PubMed]
  28. Iqbal, M.; Raja, N.I.; Yasmeen, F.; Hussain, M.; Ejaz, M.; Shah, M.A. Impacts of heat stress on wheat: A critical review. Adv. Crop Sci. Technol. 2017, 5, 251. [Google Scholar] [CrossRef]
  29. Mahrookashani, A.; Siebert, S.; Hüging, H.; Ewert, F. Independent and combined effects of high temperature and drought stress around anthesis on wheat. J. Agron. Crop Sci. 2017, 203, 453–463. [Google Scholar] [CrossRef]
  30. Prasad, P.V.V.; Pisipati, S.R.; Momčilović, I.; Ristic, Z. Independent and combined effect of high temperature and drought stress during grain filling on plant yield and chloroplast EF-Tu expression in spring wheat. J. Agron. Crop Sci. 2011, 197, 430–441. [Google Scholar] [CrossRef]
  31. Saedi, M.; Abdoli, M. Effect of drought stress during grain filling on yield and its components, gas exchange variables, and some physiological traits of wheat cultivars. J. Agric. Sci. Technol. 2015, 17, 885–898. [Google Scholar]
  32. Shamsi, K.; Kobraee, S. Bread wheat production under drought stress conditions. Ann. Biol. Res. 2011, 2, 352–358. [Google Scholar]
  33. Qaseem, M.F.; Qureshi, R.; Shaheen, H. Effects of pre-anthesis drought, heat and their combination on the growth, yield and physiology of diverse wheat (Triticum aestivum L.) genotypes varying in sensitivity to heat and drought stress. Sci. Rep. 2019, 9, 6955. [Google Scholar] [CrossRef] [Green Version]
  34. Webber, H.; Ewert, F.; Olesen, J.E.; Müller, C.; Fronzek, S.; Ruane, A.C.; Bourgault, M.; Martre, P.; Ababaei, B.; Bindi, M.; et al. Diverging importance of drought stress for maize and winter wheat in Europe. Nat. Commun. 2018, 9, 4249. [Google Scholar] [CrossRef] [Green Version]
  35. Brázdil, R.; Trnka, M.; Dobrovolný, P.; Chromá, K.; Hlavinka, P.; Žalud, Z. Variability of droughts in the Czech Republic, 1881–2006. Theor. Appl. Climatol. 2009, 97, 297–315. [Google Scholar] [CrossRef]
  36. Řehoř, J.; Brázdil, R.; Trnka, M.; Lhotka, O.; Balek, J.; Možný, M.; Štěpánek, P.; Zahradníček, P.; Mikulová, K.; Turňa, M. Soil drought and circulation types in a longitudinal transect over central Europe. Int. J. Climatol. 2021, 41, 2834–2850. [Google Scholar] [CrossRef]
  37. Shavrukov, Y.; Kurishbayev, A.; Jatayev, S.; Shvidchenko, V.; Zotova, L.; Koekemoer, F.; de Groot, S.; Soole, K.; Langridge, P. Early flowering as a drought escape mechanism in plants: How can it aid wheat production? Front. Plant Sci. 2017, 8, 1950. [Google Scholar] [CrossRef] [PubMed]
  38. Meyre, D.; Leonardi, A.; Brisson, G.; Vartanian, N. Drought-adaptive mechanisms involved in the escape/tolerance strategies of Arabidopsis Landsberg erecta and Columbia ecotypes and their F1 reciprocal progeny. J. Plant Physiol. 2001, 158, 1145–1152. [Google Scholar] [CrossRef]
  39. Yashavanthakumar, K.J.; Baviskar, V.S.; Navathe, S.; Patil, R.M.; Bagwan, J.H.; Bankar, D.N.; Gite, V.D.; Gopalareddy, K.; Mishra, C.N.; Mamrutha, H.M.; et al. Impact of heat and drought stress on phenological development and yield in bread wheat. Plant Physiol. Rep. 2021, 26, 357–367. [Google Scholar] [CrossRef]
  40. Isidro, J.; Álvaro, F.; Royo, C.; Villegas, D.; Miralles, D.J.; García del Moral, L.F. Changes in duration of developmental phases of durum wheat caused by breeding in Spain and Italy during the 20th century and its impact on yield. Ann. Bot. 2011, 107, 1355–1366. [Google Scholar] [CrossRef] [PubMed] [Green Version]
  41. Chaves, M.M.; Maroco, J.P.; Pereira, J.S. Understanding plant responses to drought—From genes to the whole plant. Funct. Plant Biol. 2003, 30, 239–264. [Google Scholar] [CrossRef] [PubMed]
  42. Bidinger, F.R.; Witcombe, J.R. Evaluation of specific drought avoidance traits as selection criteria for improvement of drought resistance. In Drought Resistance in Cereals; Baker, F.W.G., Ed.; CAB International: Wallingford, UK, 1989; pp. 151–164. [Google Scholar]
  43. Fischer, R.A. The effect of water stress at various stages of development on yield processes in wheat. In Plant Response to Climatic Factors, Proceedings of the Uppsala Symposium 1970: Ecology and Conservation, Uppsala, Sweden, 15–20 September 1970; Slatyer, R.O., Ed.; UNESCO: Paris, France, 1973; Volume 5, pp. 233–241. [Google Scholar]
  44. Li, P.; Ma, B.; Palta, J.A.; Ding, T.; Cheng, Z.; Lv, G.; Xiong, Y. Wheat breeding highlights drought tolerance while ignores the advantages of drought avoidance: A meta-analysis. Eur. J. Agron. 2021, 122, 126196. [Google Scholar] [CrossRef]
  45. Levitt, J. Stress terminology. In Adaptation of Plants to Water and High Temperature Stress; Turner, N.C., Kramer, P.J., Eds.; J. Wiley: New York, NY, USA, 1980; pp. 437–439. [Google Scholar]
  46. Anyia, A.O.; Herzog, H. Water-use efficiency, leaf area and leaf gas exchange of cowpeas under mid-season drought. Eur. J. Agron. 2004, 20, 327–339. [Google Scholar] [CrossRef]
  47. Fufa, H.; Baenziger, P.S.; Beecher, B.S.; Graybosch, R.A.; Eskridge, K.M.; Nelson, L.A. Genetic improvement trends in agronomic performances and end-use quality characteristics among hard red winter wheat cultivars in Nebraska. Euphytica 2005, 144, 187–198. [Google Scholar] [CrossRef] [Green Version]
  48. Barnabás, B.; Jäger, K.; Fehér, A. The effect of drought and heat stress on reproductive processes in cereals. Plant Cell Environ. 2008, 31, 11–38. [Google Scholar] [CrossRef]
  49. Prasad, P.V.V.; Staggenborg, S.A.; Ristic, Z. Impacts of drought and/or heat stress on physiological, developmental, growth, and yield processes of crop plants. In Response of Crops to Limited Water: Understanding and Modeling Water Stress Effects on Plant Growth Processes, Advances in Agricultural Systems Modeling; Ahuja, L.R., Reddy, V.R., Saseendran, S.A., Yu, Q., Eds.; ASA, CSSA, SSSA: Madison, WI, USA, 2008; pp. 301–355. [Google Scholar]
  50. Munns, R.; Richards, R.A. Recent advances in breeding wheat for drought and salt stresses. In Advances in Molecular Breeding Toward Drought and Salt Tolerant Crops; Jenks, M.A., Hasegawa, P.M., Jain, S.M., Eds.; Springer: Dordrecht, The Netherlands, 2007; pp. 565–585. [Google Scholar]
  51. Tariq, M.; Mahmood, A.; Mian, M.A.; Cheema, N.M.; Sabar, M.; Ihsan, M.; Rehman, A.U. Dharabi-11: A new high yielding drought and disease tolerant wheat variety. Int. J. Agric. Biol. 2013, 15, 701–706. [Google Scholar]
  52. Nezhadahmadi, A.; Prodhan, Z.H.; Faruq, G. Drought tolerance in wheat. Sci. World J. 2013, 2013, 610721. [Google Scholar] [CrossRef] [Green Version]
Figure 1. SWC (%) of pots after they were irrigated on the phenotyping platform from 29 April 2018 (day 0; both drought-stressed and control plants were irrigated to the same level of 70% of the maximum SWC) to 17 June 2018 (day 49). The soil of the drought-stressed plants continually dried to the permanent wilting point (15% of the SWC) on the 32nd day of the experiment, at which point the pots were irrigated to the level of 70% of the SWC, and the plants were allowed to recover for 17 days. The plants were subsequently transported to the vegetation hall after 49 days of being on the phenotyping platform.
Agronomy 12 00831 g001
Figure 2. Mean values of GWS (g), GNS (pcs), TGW (g), and the HI (unitless) for each genotype, with standard errors of the means displayed as error bars. Two-way ANOVAs with Tukey’s post hoc tests were performed for all tested winter wheat genotypes for each yield formation parameter separately under control and drought stress treatments (α = 0.05, n ≥ 4). Different letters above error bars denote statistically significant differences among treatments using Tukey’s post hoc tests. The blue lines represent the total mean values of the control treatments, and the orange dashed lines represent the total mean values of the drought stress treatments.
Agronomy 12 00831 g002
Figure 3. Drought-induced relative reductions (%) in GWS, GNS, TGW, and HI per genotype.
Agronomy 12 00831 g003
Figure 4. Mean drought-induced relative reductions (%) in specific yield formation parameters for genotypes by country of origin, with the standard errors displayed as error bars. One-way ANOVAs with Tukey’s post hoc tests were performed for all genotypes within each country of origin (O) per yield formation parameter separately (α = 0.05, n ≥ 5). Different letters above error bars denote statistically significant differences among treatments using Tukey’s post hoc tests.
Agronomy 12 00831 g004
Figure 5. Boxplots showing differences in yield formation parameters between wheat genotypes grouped according to site of origin (left) and time to maturity (right). The medians (central line), means (squares), 25th and 75th percentiles (boxes), 1.5 interquartile ranges (error bars), and outliers (stars) are presented (n ≥ 15).
Agronomy 12 00831 g005
Figure 6. RDA of the responses of winter wheat genotypes to drought stress treatment through an analysis of the relative reductions in (1) GNS, (2) GWS, (3) TGW, and (4) HI via a categorization of the genotypes into groups according to time to maturity (early, medium, late) and site of origin (Central Europe, Western Europe, southeastern Europe).
Agronomy 12 00831 g006
Table 1. List of genotypes by origin, time to maturity, and apparent tolerance to drought stress.
OriginGenotype—MaturityOriginGenotype—Maturity
Czechoslovakia */Czech Republic/Slovakia, CEIlona—EGermany, WECubus—M
Bohemia—EFakir —L
Elly—EFamulus—M
Jindra—EGenius—M
IS Spirella—EManager—L
Tobak—L
Austria, CEFaunus—M
Midas—EUnited Kingdom, WEBeaufort—M
France, WEAmerigo—MRomania, SEEIzvor—L
Avenue—E
Frisky—LYugoslavia */Serbia, SEEPobeda —L
Pannonia NS —E
* Currently no longer a country, good drought stress tolerance (information from the Plant Variety Rights and National List Database: http://eagri.cz/public/app/sok/odrudyNouQF.do?lang=en_US (accessed on 6 March 2022)), high adaptability (information on Pobeda was obtained from websites of the genotype maintainer (the Institute of Field and Vegetable Crops): https://nsseme.com/en/products/small-grains/wheat/#pobeda (accessed on 6 March 2022)), the maturity of a specific genotype (this classification was based on the long-term testing of the genotypes in the Central Institute for Supervising and Testing in Agriculture (Brno, Czech Republic); https://eagri.cz/public/web/en/ukzuz/portal/ (accessed on 6 March 2022) combined with available information on the genotypes): E—early, M—medium, L—late; WE—Western Europe, CE—Central Europe, SEE—southeastern Europe.
Table 2. Results of a two-way ANOVA for individual yield formation parameters and their relative reductions due to drought stress.
GWSGNSTGWHI
Two-way ANOVA p-valuesGenotype (G)<0.0001<0.0001<0.0001<0.0001
Treatment (T)<0.0001<0.0001<0.0001<0.0001
G × T<0.0001<0.0001<0.00010.0005
Relative reduction due to drought stress (%)61.2637.6138.9829.71
Publisher’s Note: MDPI stays neutral with regard to jurisdictional claims in published maps and institutional affiliations.

