3.1. Synthesis of the Physically Crosslinked PolyMEA Nanocomposites
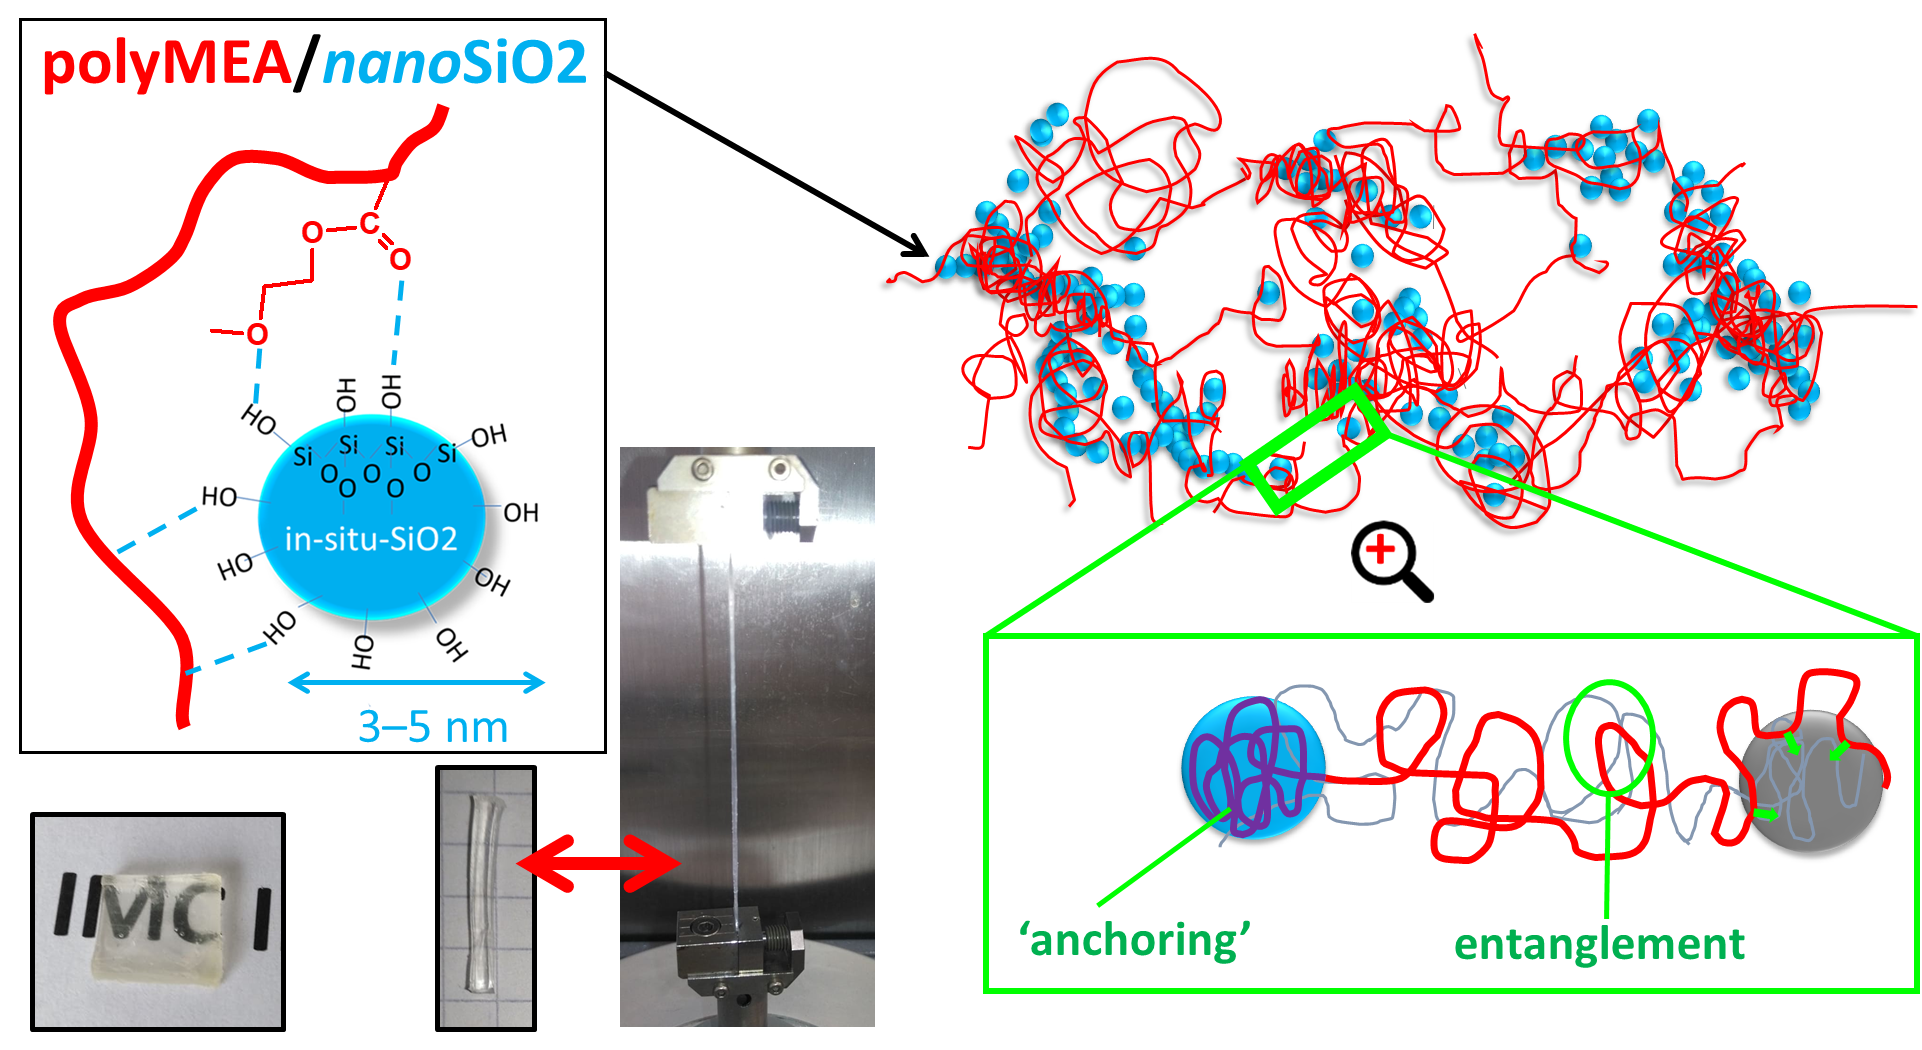
In this work, novel highly transparent elastomeric stiff and tough poly(2-methoxyethylacrylate) (polyMEA) nanocomposites with in-situ-formed fine-grained nano-silica were synthesized, as well as their derivatives doubly filled with nano-silica and clay nanoplatelets (see
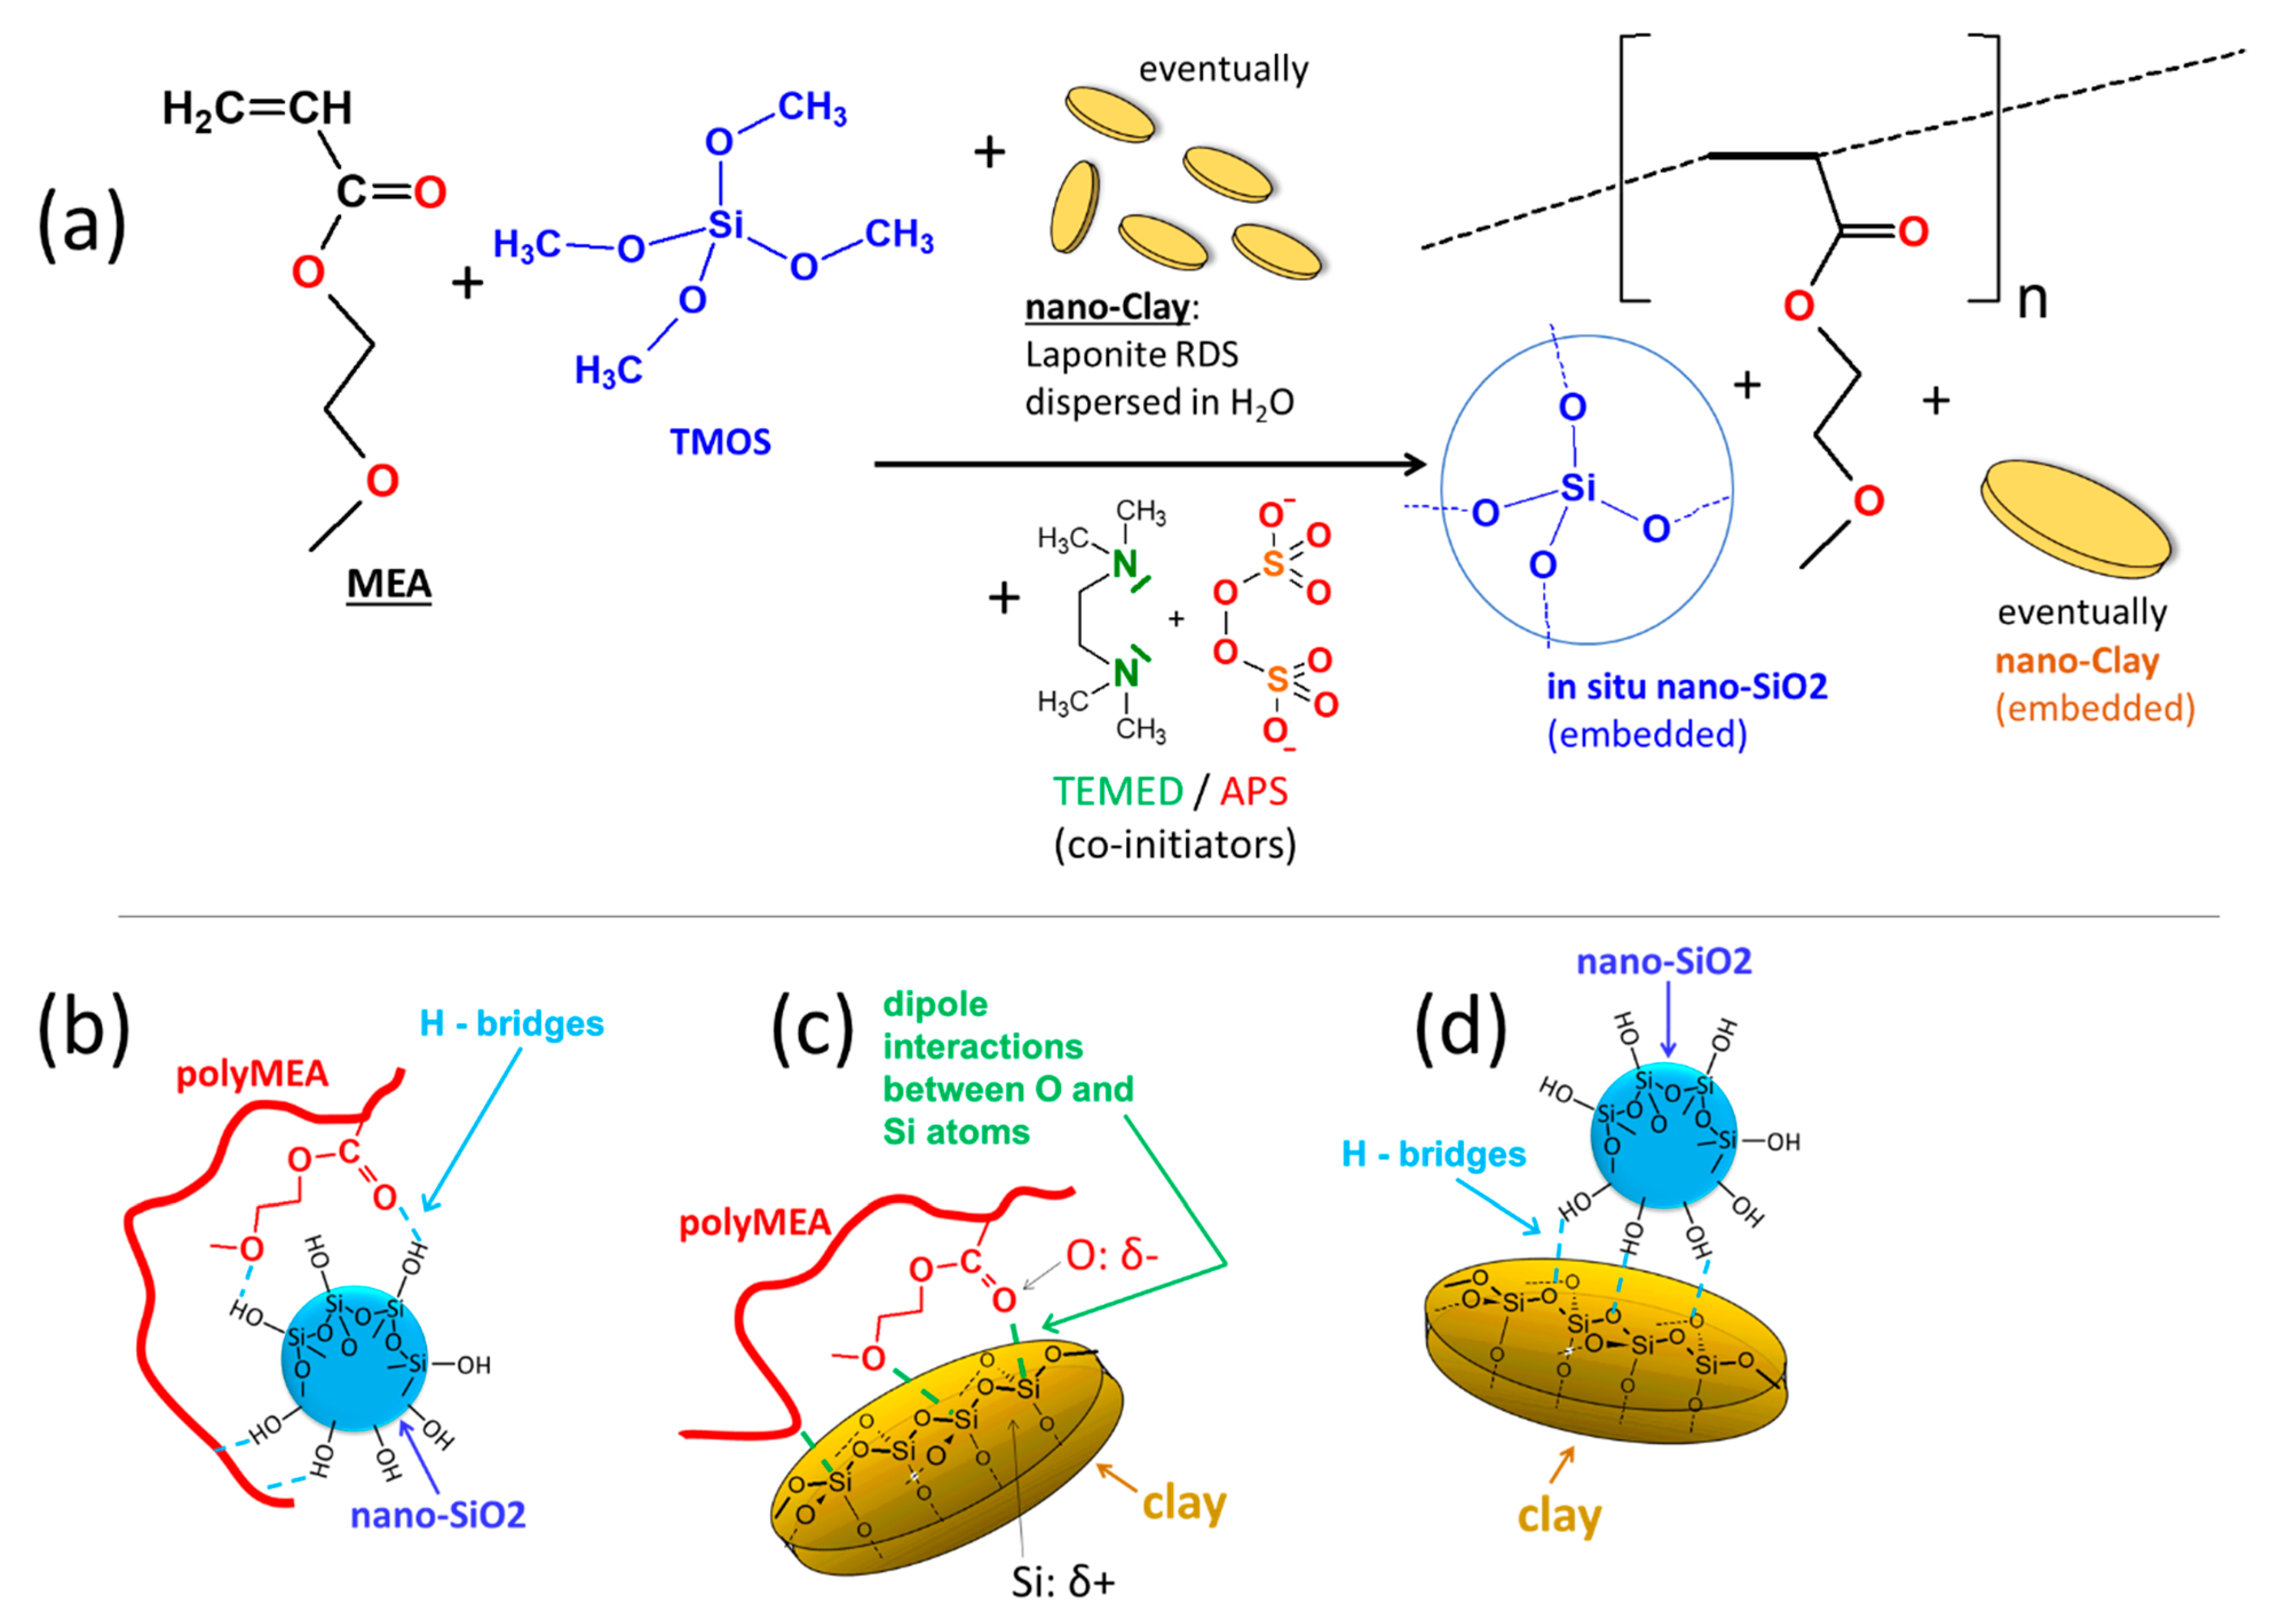
Figure 1, and the discussion of Micro-phase-separation vs. homogenization further below). This was done by means of simultaneous redox-initiated free-radical polymerization of MEA and sol-gel process of TMOS (studied in more detail in [
59]) in aqueous solution (
Figure 1a). In the doubly filled derivatives, clay (“RDS”) nanoplatelets were additionally dispersed in the reaction medium. During the synthesis, phase-separation was observed (see discussion further below), which is typical for polyMEA formation in water. Soft opaque hydrated samples were first obtained, which after drying become highly transparent (see discussion further below).
In-situ-nano-silica, whose surface is covered by non-protected Si-OH groups, was chosen as physical crosslinker, because it should form relatively strong hydrogen bridges to oxygen atoms of the MEA repeat units (see
Figure 1b). This should contribute to permanent crosslinks generated by collective adsorption of large chain segments during early stages of polymerization (‘anchoring’ segments of elastic chains), as well as to ‘normal’ random and reversible bridging between repeat units of a polyMEA chain and a neighbouring SiO
2 particle (see structure details in
SI-Figure S1c in the Supplementary Information File). The ‘soft physical crosslinking’ was expected to provide sacrificial bonds during large deformations, which can dynamically rearrange, dissipating energy and recovering quickly, thus generating an increase in toughness. Additionally, the ‘soft crosslinking’ could raise the modulus at small deformations. The expectations indeed were confirmed by further-below discussed mechanical tests. In contrast to polyMEA/SiO
2, the strong and soft crosslinking in the already known polyMEA/clay nanocomposites is based on dipole-dipole interactions between partly negatively charged O atoms of polyMEA and the partly positively charged atoms of Si in the clay platelets (see
Figure 1c). Such elastomers also were prepared as reference samples, using ca. circular 25-nm-wide “RDS clay” platelets. In the doubly filled nanocomposites, H-bridging between silica particles and clay (see
Figure 1d)—if sufficiently strong—could generate a hierarchical filler structure, which indeed was observed by TEM (see further below).
The size of the nano-silica filler employed in this work (as well as in previous studies with polyacrylamide matrix [
62,
63]) was expected to be similar or comparable like the one of nano-clay used to prepare the literature-known polyMEA/clay networks (e.g., in [
46,
66]). Hence, a very similar principle of self-assembly and physical crosslinking can be assumed for the novel polyMEA/SiO
2 nanocomposites, like for polyMEA/clay (see discussion further below and details in
SI-Figure S1). The doubly filled derivatives were expected to display a hybrid structure mixed from both simple ones (shown in
SI-Figure S1a,b). These assumptions were indeed confirmed by TEM- and X-ray morphology analyses (see further below).
3.1.1. Micro-Phase Separation during Synthesis and Subsequent Homogeneization
The
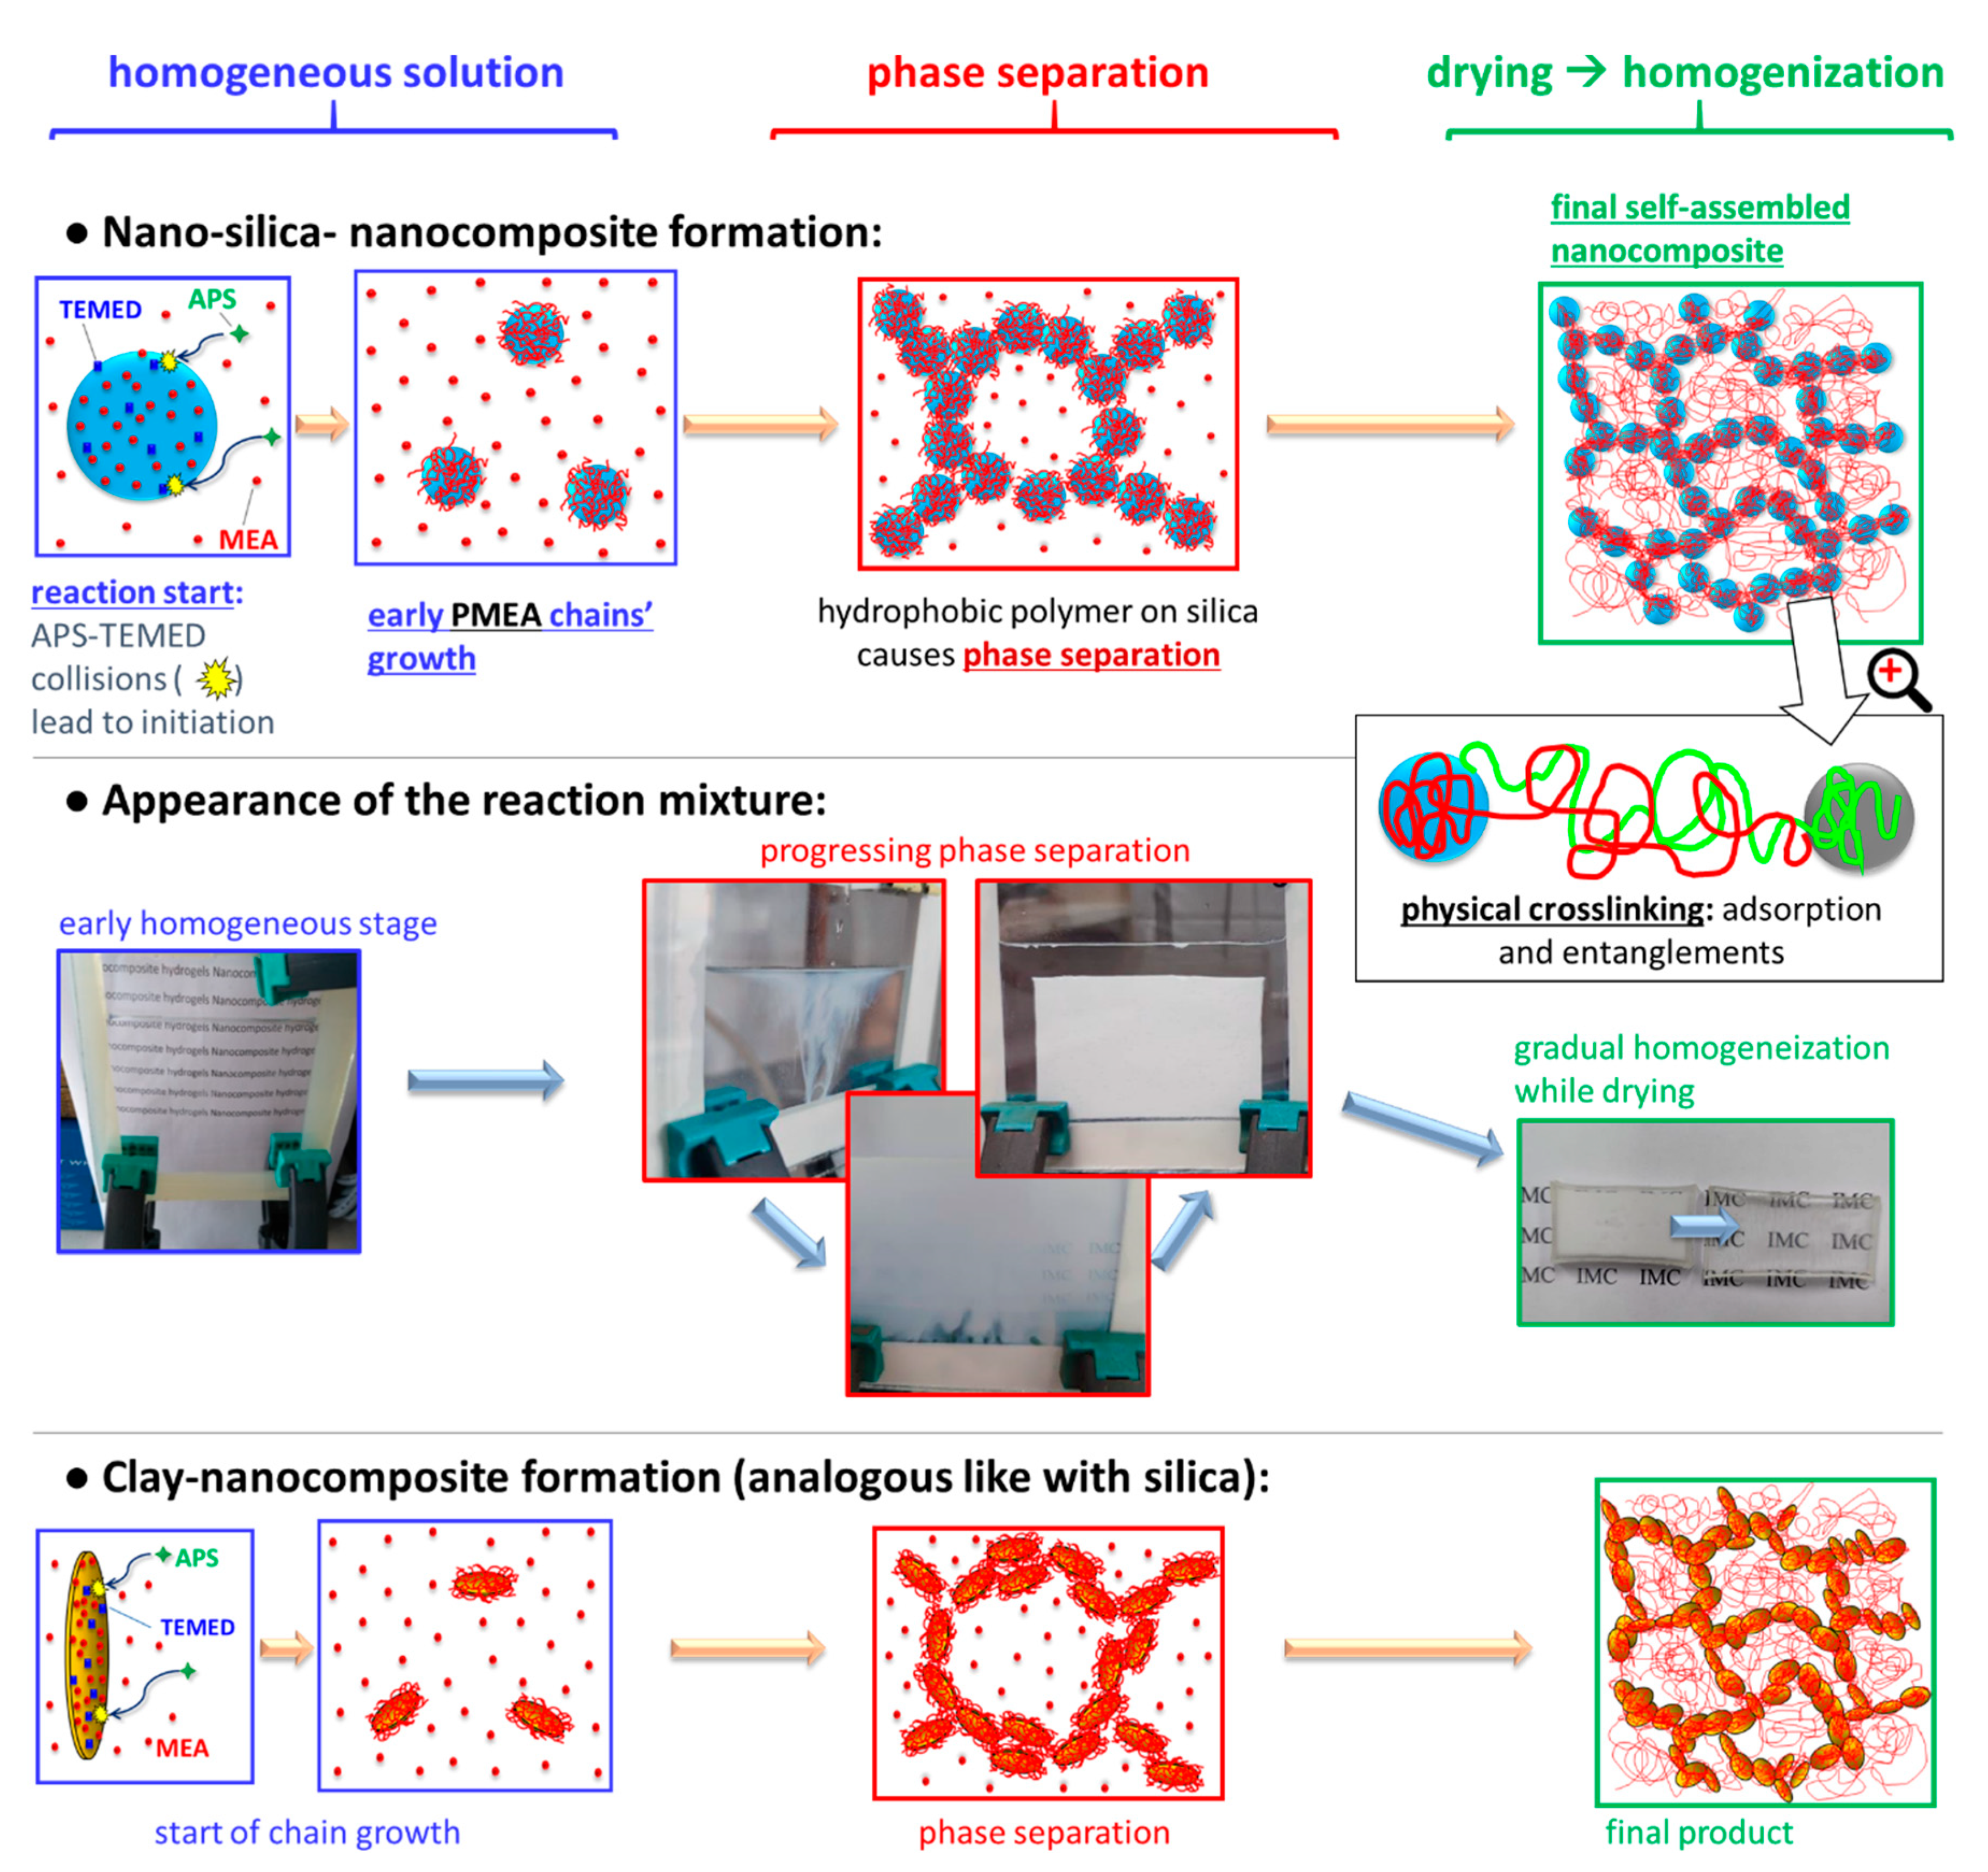
Figure 2 (central row) shows the development of the outward appearance of the aqueous synthesis mixture of the studied nanocomposites, which is connected with their phase structure (also illustrated in
Figure 2: top, and bottom row).
The development of phase separation was nearly identical in case of all filler combinations, independently whether the filler was in-situ-nano-silica, nano-clay, or a combination of both (see
Figure 2). Even the polymerization of neat MEA displayed a similar behaviour. At first, the reaction mixture is outwardly fully homogeneous (
Figure 2, start of middle row): This stage corresponds to the rapid formation (if TMOS is present) of small SiO
2 nanoparticles via hydrolysis/condensation (sol-gel process) of TMOS—as part of the process shown in
Figure 1a further above. This sol-gel reaction was found to be very fast in a previous study, at analogous conditions: less than 1 min (see [
59]). Subsequently, MEA monomer, still intact, due to induction time, as well as TMED and APS co-initiators are likely adsorbed on the nano-SiO
2 particles (
Figure 2 top row, start), in analogy to the already known polyMEA/clay nanocomposite formation (see [
46,
66]). After an induction time of ca. 10 min, polyMEA chain growth starts on the surface of the nanoparticles, initiated by radical generation through collisions of APS and TEMED. The induction time of the MEA polymerization is attributed to the specific behaviour of the used redox initiating system, which yields analogous results like in case of the kinetics of the related poly(N-isopropylacrylamide) (“PNIPAm”)/clay system in [
62]. The sudden progress of MEA polymerization coincides with the appearance of turbidity in
Figure 2 central row: After initial growth on nanofiller surface (over the adsorbed MEA molecules), the polyMEA chains start to propagate into the surrounding solution (see
Figure 2 top), which eventually causes phase-separation. The latter occurs, because in contrast to monomeric MEA, the polyMEA macromolecules are hydrophobic. In the water-rich domains, some filler nanoparticles which are poorly covered, or not covered by polyMEA could accumulate, together with (temporarily) still unreacted MEA.
The mentioned phase-separation manifests itself as increasing turbidity which eventually dominates the reacting mixture (
Figure 2 middle row, centre). Finally, after finished polymerization (and previous SiO
2 generation), the opaque product displays a white colour and a consistence somewhat similar to cottage cheese (
Figure 2, middle row, centre). Drying of this material in air (
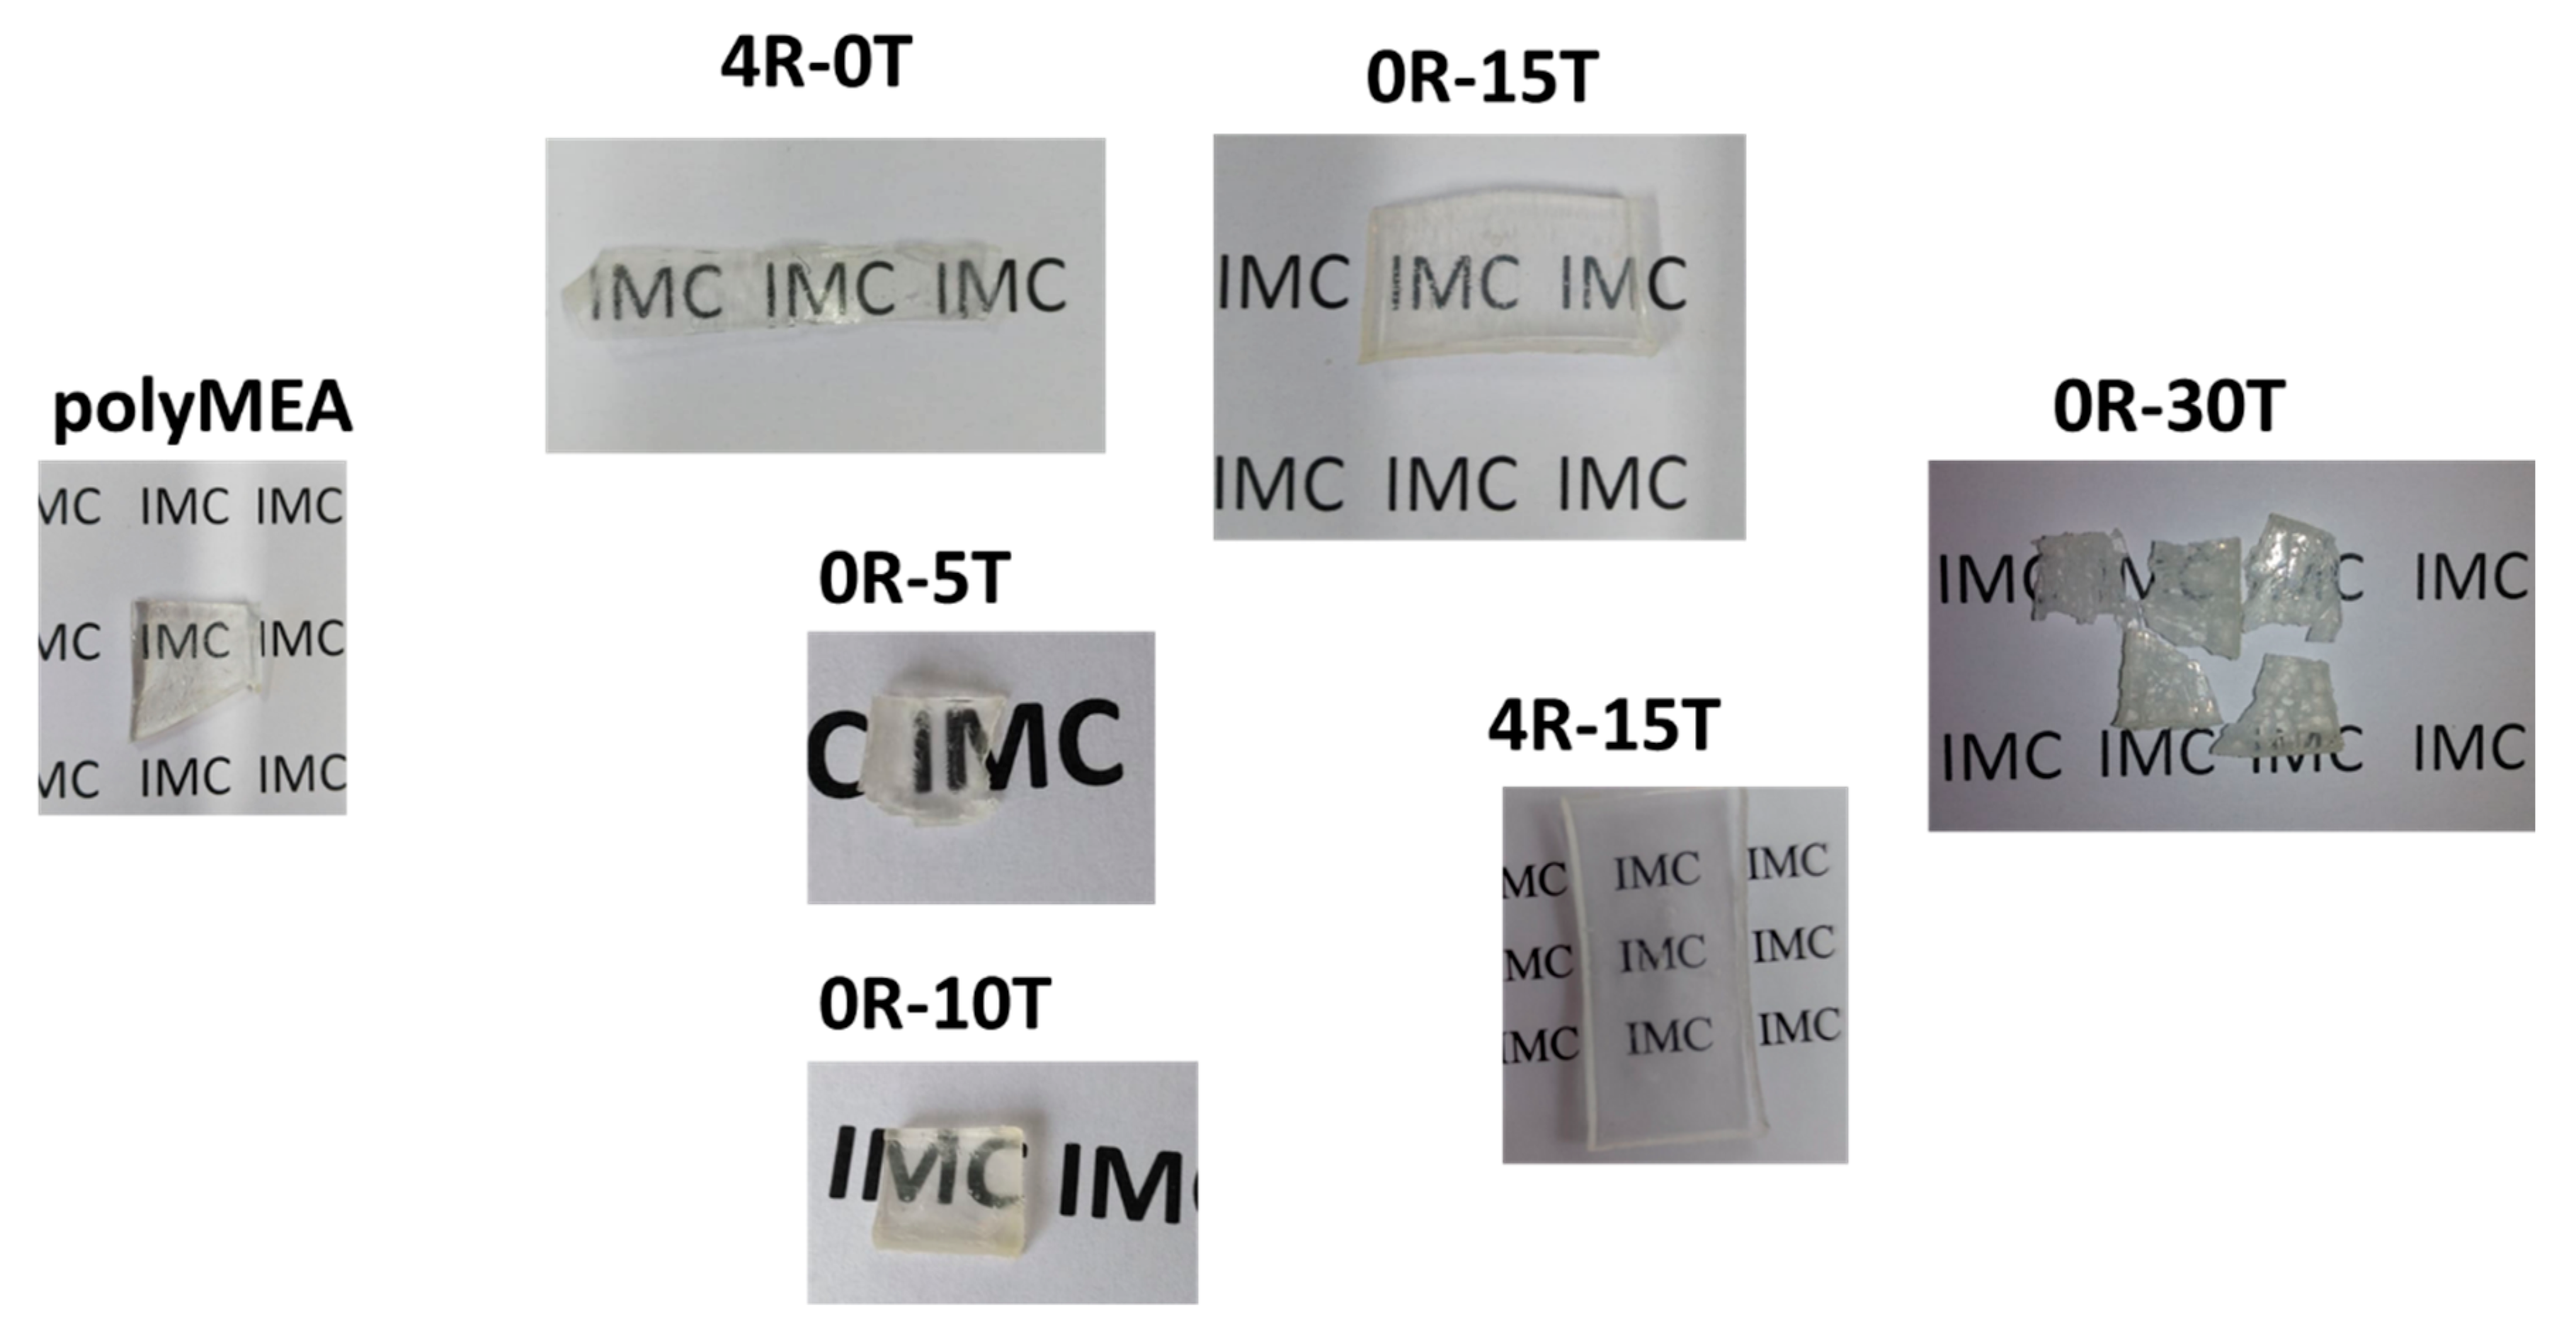
Figure 2, end of middle row) yields elastomers which are fully transparent—if non-filled, or filled only with SiO
2, and fairly transparent if nano-clay is present (see
Figure 3). In case that the nano-silica content was 15 wt.% or more, the reaction mixture shrunk distinctly and symmetrically towards the end of polymerization, thus releasing a considerable amount of water (see
Figure 2 middle row, centre). At 15 wt.% of SiO
2, also the drying behaviour of the wet product was very attractive, and large crack-free monolithic pieces could be easily obtained by simple drying in air. Below 15 wt.% of SiO
2 (e.g., at 10%, see
SI-Figure S2 in the Supplementary Information File), the polymerization-induced shrinking was not observed, and larger monolithic specimens underwent cracking upon drying. At very high silica contents (30 wt.%, see
Figure 3) the nanocomposites become brittle in the dry state, and they also tend to cracking while drying-up (see
Figure 3). In case of doubly filled elastomers (with clay + silica), the SiO
2 content has analogous effects as described above.
3.1.2. Conversion, Gel Fraction and Content of Incorporated Nano-Fillers
The full
conversion of the MEA monomer during the synthesis was verified by means of infrared spectroscopy (FTIR): The disappearance of the intense C=C stretching peaks of monomeric MEA (at 1620 and 1638 cm
−1), in the prepared nanocomposites (prior to drying, as well as after drying) indicates full monomer conversion. This is in good agreement with the above-mentioned kinetics investigations by the authors of the chemically related system PNIPAm/clay [
62], which contained the same initiator pair and used analogous synthesis conditions (concentration, temperature) like in the present work. The results of the study in [
62] suggest that also the polymerization of MEA should be practically finished in ca. 30 min after initiation. The ‘synthesis time’ of 24 h was nevertheless applied, in order to ensure a large reserve of time for the formation of entanglements (additional physical crosslinks), which was found to be somewhat delayed in respect to the acrylate polymerization in [
62].
The
real filler content in the prepared nanocomposites, which was determined via ash analysis, is shown in
Table 2. It can be seen that nano-silica (if it is the only filler) is incorporated practically quantitatively, while in case of doubly filled nanocomposites containing also the RDS clay, the filler content is somewhat smaller than expected: this deviation is the greatest in case of the sample 4R-5T.
Both the quantitative monomer conversion and the ash contents suggest, that in case of the synthesis of polyMEA/SiO2, the gel fraction is practically 100%, also for the individual components. In case of doubly filled nanocomposites it is somewhat smaller, due to loss of not embedded nanofiller (expulsed together with water during the phase separation stage).
Generally, the results confirm very efficient crosslinking between nano-SiO2 and the polyMEA matrix. Also, the affinity of nano-SiO2 to polyMEA seems to be stronger than that of RDS clay to the same polymer.
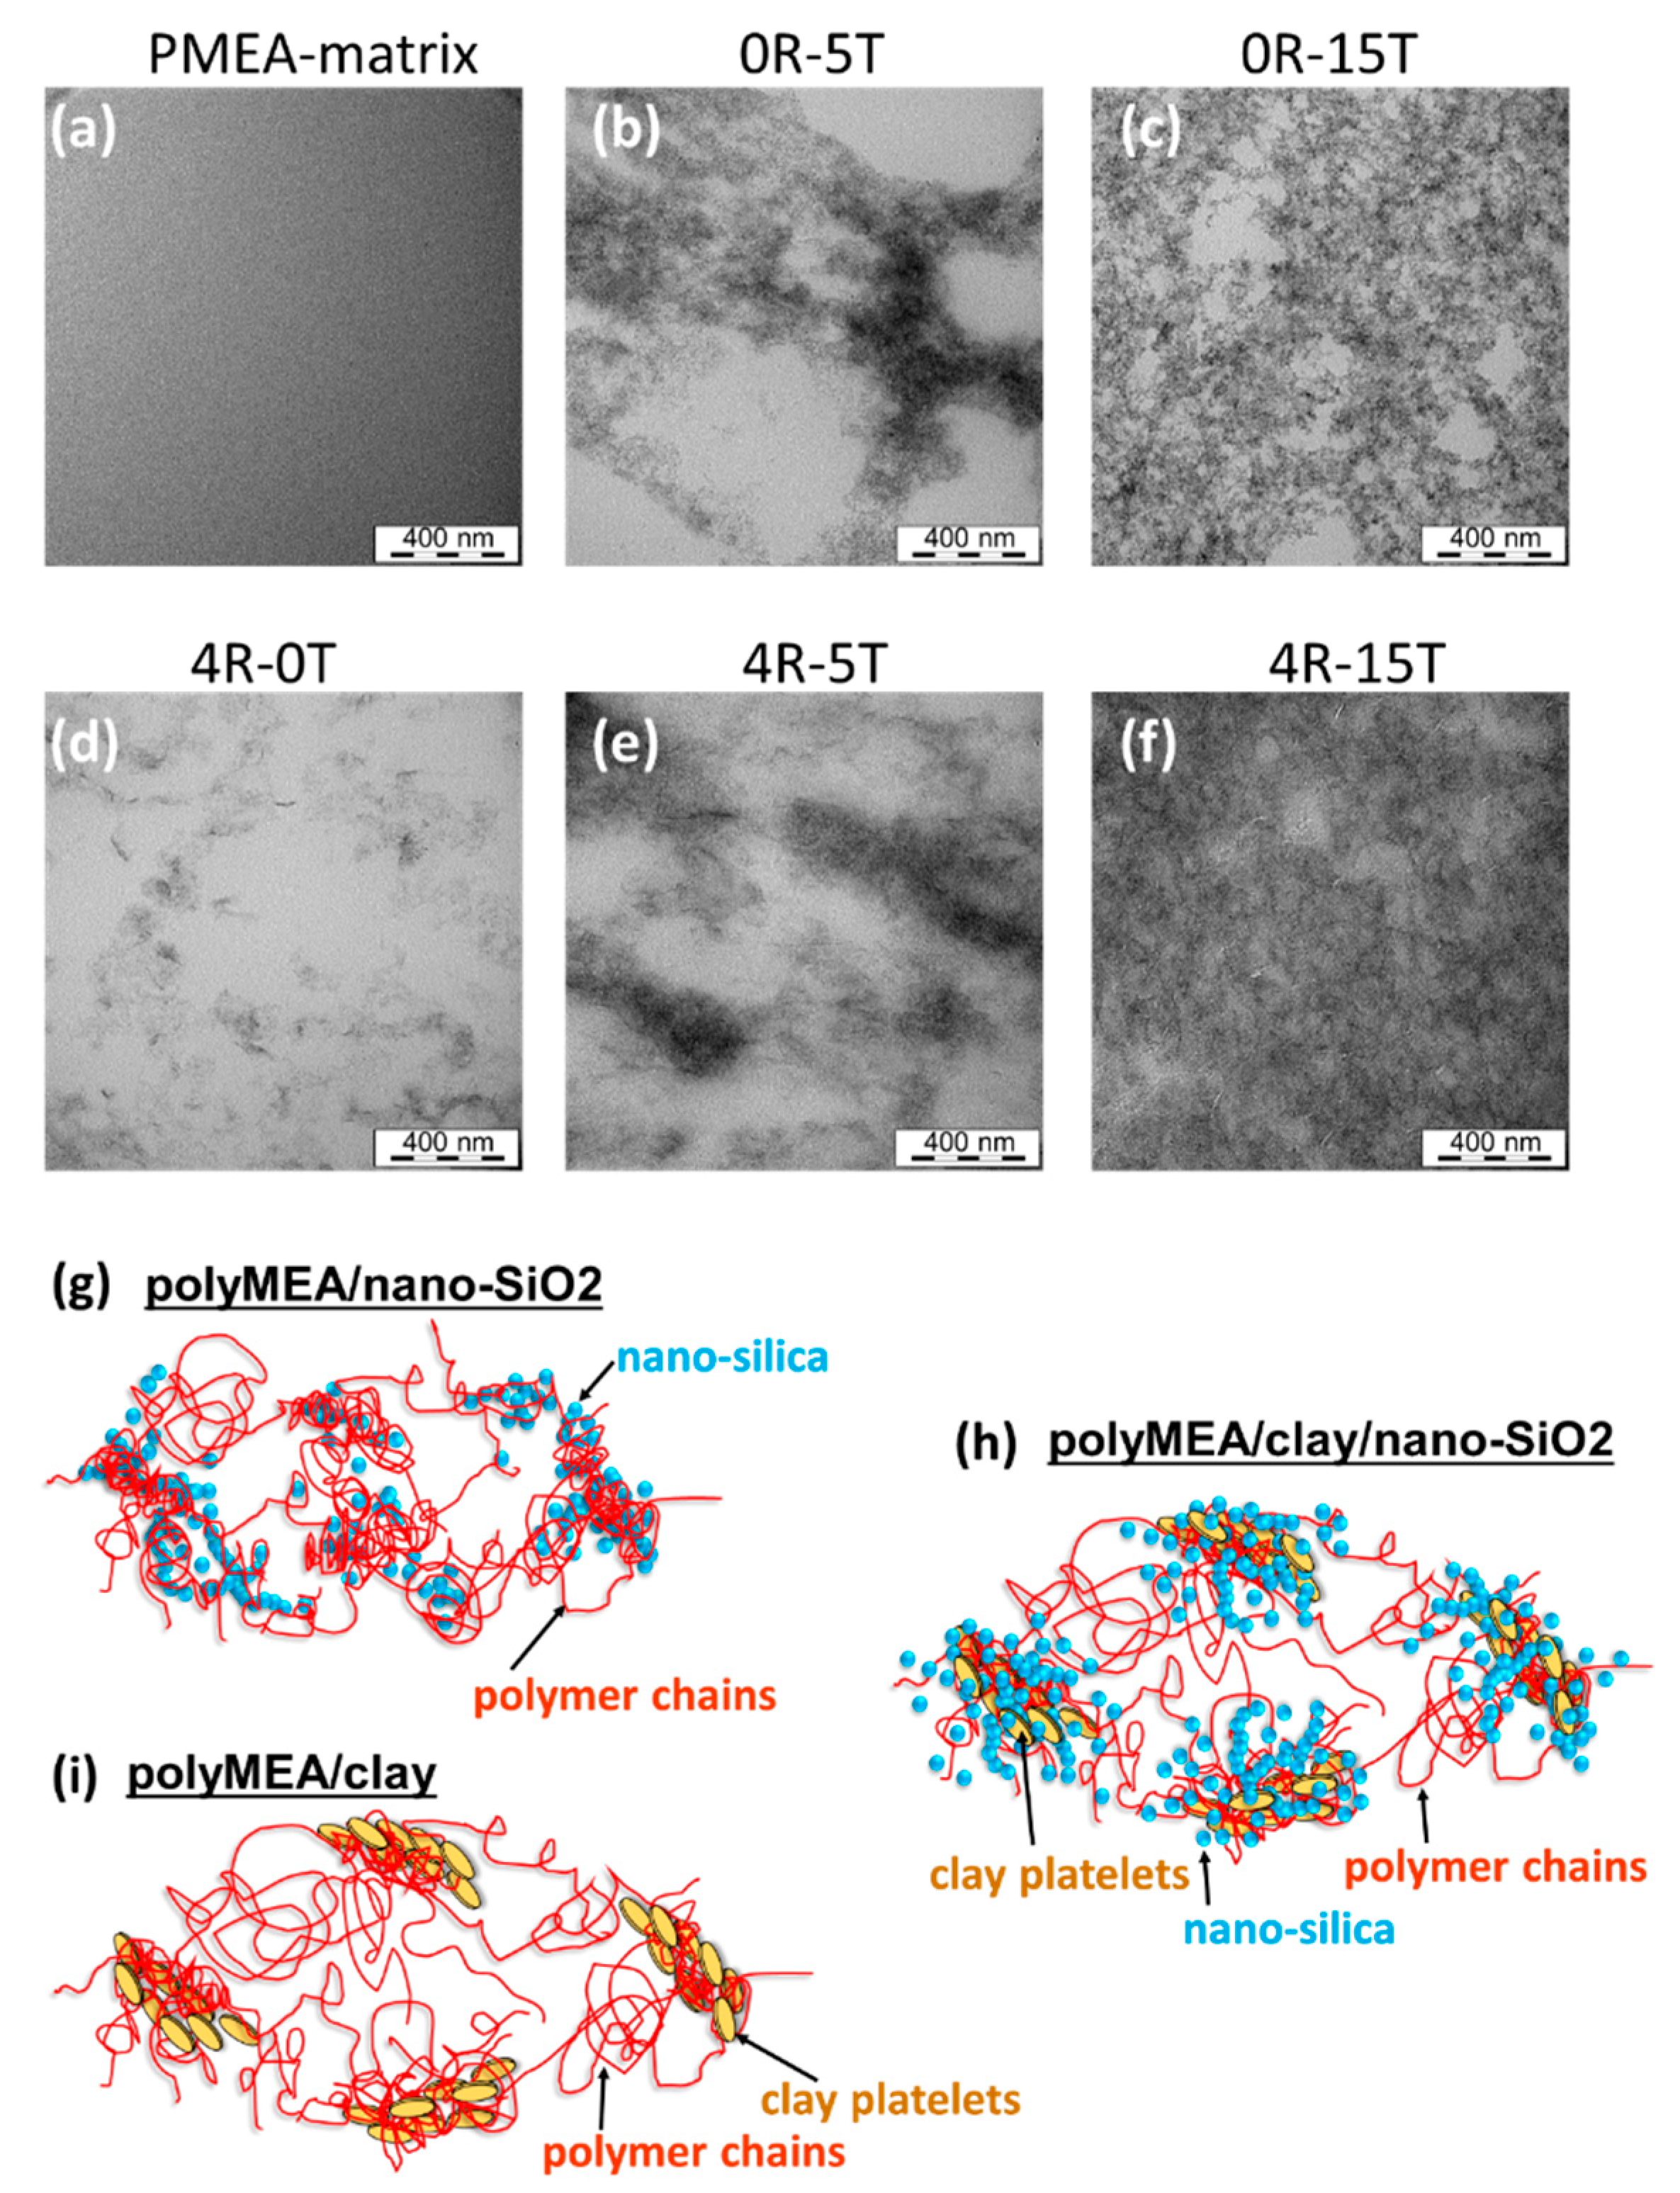
3.1.3. Dispersion of the Fillers: TEM
The dispersion of nano-silica or of clay combined with nano-SiO
2 in the polyMEA matrix was analysed by means of transmission electron microscopy (TEM) (see
Figure 4a–f). High-resolution micrographs are shown in
SI-Figure S3. In all cases it can be observed, that both nano-SiO
2 and the clay nano-platelets are evenly distributed on the larger scale.
The primary silica particles were found to be very small and thus poorly visible by TEM; their size eventually was determined to be 3–6 nm by X-ray diffraction (see further below). The diameter of a single clay platelet was observed to be 20–30 nm in
Figure 4d, which well corresponds with data from the supplier. The single particles of both fillers are arranged to larger patterns, but are not grown-together or stacked (see
Figure 4g–i). However, at low contents of silica, e.g., at 5 wt.% (
Figure 4b), a visible nano-phase-segregation of the latter filler in polyMEA can be observed, into silica-rich and silica-deficient domains. The silica-deficient regions have the shape of 400–800-nm-wide ‘bubbles’, separated by up to 200-nm-thick layers which are rich in nano-silica grains. At 15 wt.% of silica (
Figure 4c), the distribution of the nano-SiO
2 grains is much more even also on the fine scale, and there are much fewer and much smaller silica-deficient domains.
In case that
silica and clay are combined in doubly filled nanocomposites, it can be seen (
Figure 4e,f vs.
Figure 4b,c) that the general morphology is similar to the one of nanocomposites filled exclusively by silica. Additionally, the clay platelets (or more precisely their groups) are always buried in the SiO
2-richer domains in the doubly filled nanocomposites. This indicates the mutual affinity of both fillers, as illustrated in
Figure 1d (further above). The more detailed structure of the self-assembled elastomeric networks hence can be described by the
Figure 4g–i, in view of the morphology images.
An interesting finding was, that in spite of the periodic fluctuations in nanofiller concentration, which were close to the micrometre scale in the extreme case (see
Figure 4b,e further above), no decrease in optical clarity was observed for the low-filled polyMEA/silica elastomers (see
Figure 3 further above). This is in contrast with the results obtained for the distantly related nanocomposite based on PMEO2MA-silica (mentioned in Introduction: Asai, Takeoka and co-workers: [
67,
68]), where filler particles were much larger (110 nm) and where high optical clarity was observed only for highly regular distributions of the filler spheres. In case of polyMEA/nano-SiO
2 studied in this work, the surprising independence of the nanocomposite transparency from fluctuations of filler distribution can be explained by the close match in the refraction indices of filler and matrix: both are given as 1.46 in the literature (amorphous SiO
2: [
70], polyMEA: [
71]).
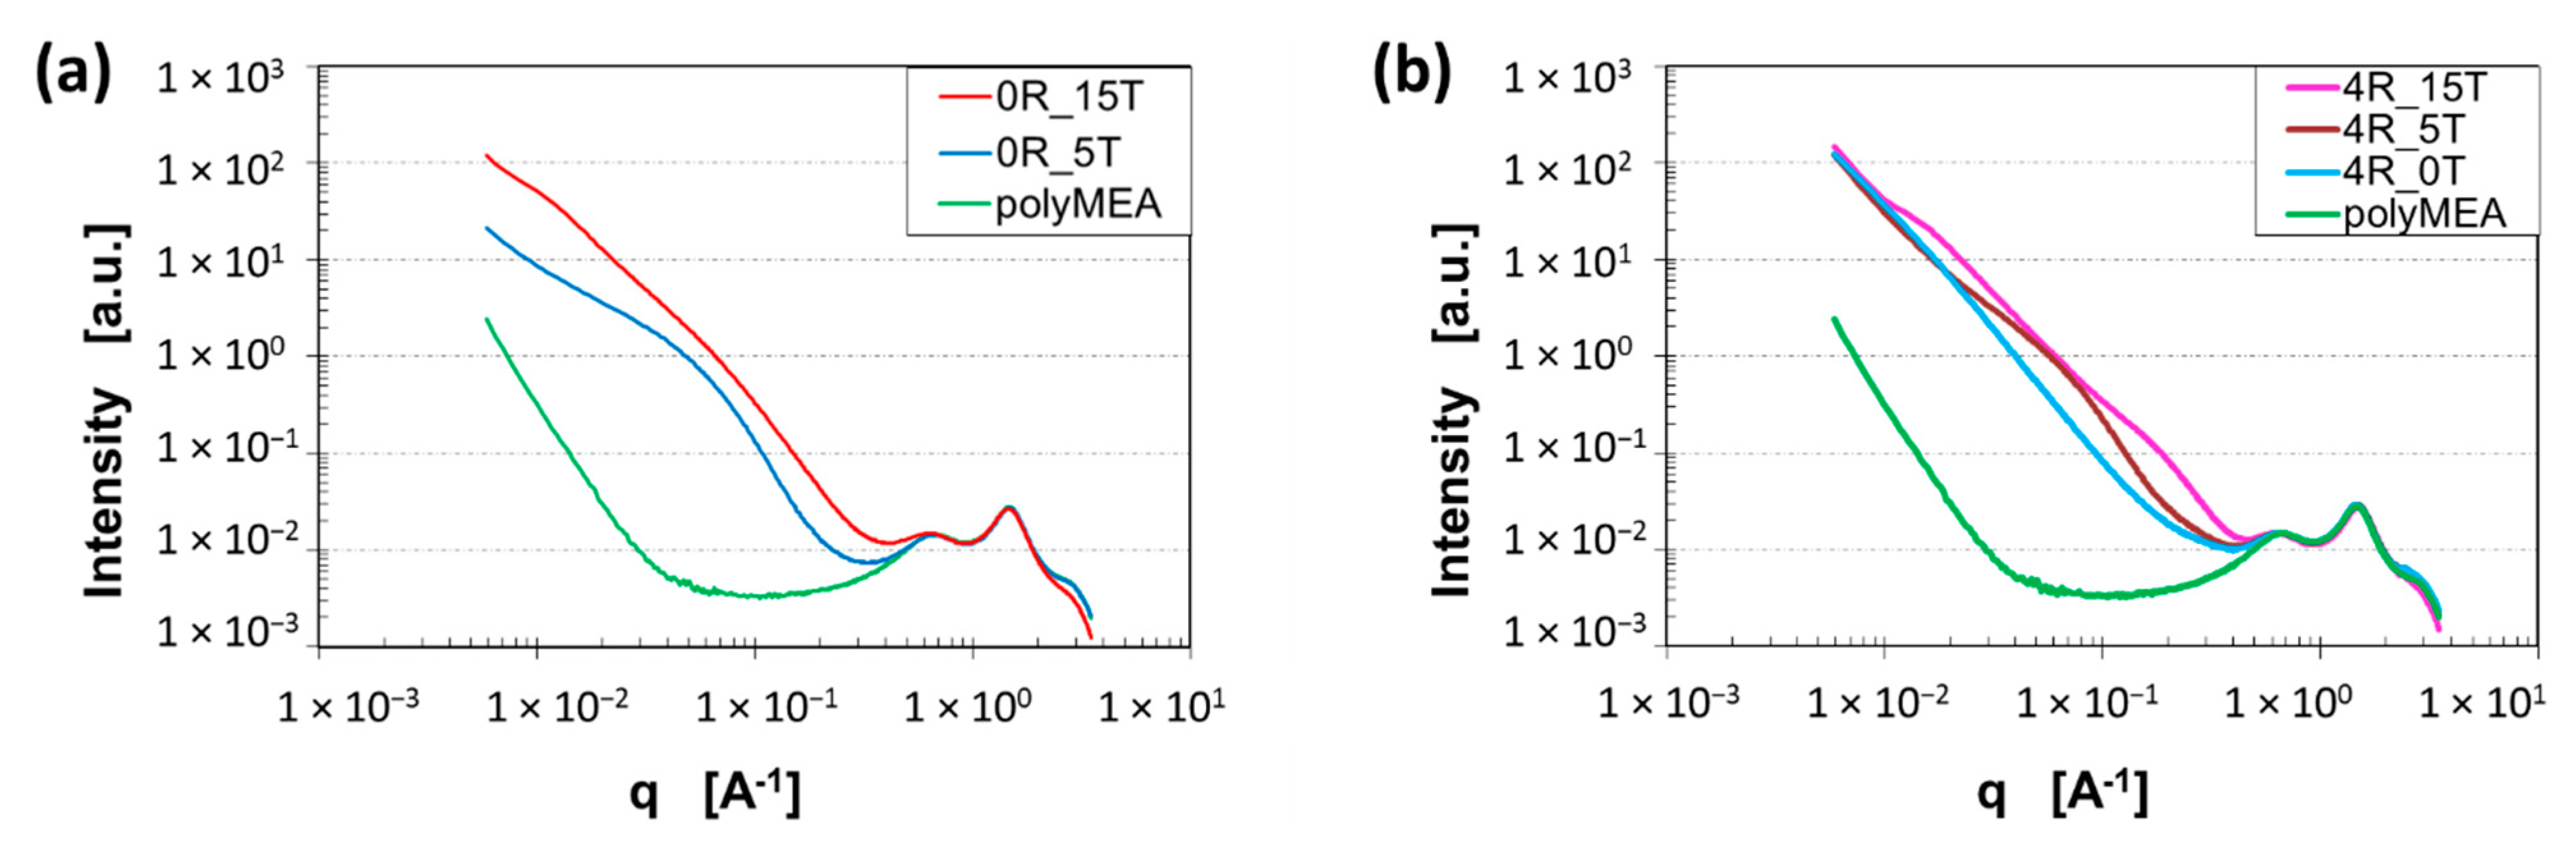
3.1.4. Morphology Observed by X-ray
In order to characterize the morphology of the prepared nanocomposite elastomers in more detail and to obtain some average structural parameters, X-ray scattering analysis (SAXS, WAXS) was performed (see
Figure 5).
In all diffractograms, three characteristic amorphous-halo-type reflections of the
polyMEA matrix are well visible, namely in the WAXS region, at the right in the respective graphs, between scattering vector (
q) values of 0.4 and 4 Å
−1. The central broad peak with maximum at 1.5 Å
−1 corresponds to the ‘normal’ inter-molecular distance in organic materials (0.425 nm, corresponds to 2 θ = 21° with Cu K
α source). The peak at 0.7 Å
−1 (≡ 0.90 nm ≡ 9.8°) can be assigned to a larger intermolecular distance, most likely the distance between polymer chains which are ‘spaced’ by the pendant methoxyethyl carboxylate groups. Finally, the peak at 3.0 Å
−1 (≡0.209 nm ≡ 43.2°) might be associated with some short intramolecular distance most likely related to the pendant groups: It was namely found to change in intensity if silica loading was increased to high values, e.g., to 15 wt.% (see
Figure 5a,b), or after an intense deformation. The pendant groups are involved in H-bridging to nano-SiO
2 (see
Figure 1b).
In the
low-angle (SAXS) region of the diffractograms (see
Figure 5—left part of the respective graphs; or see zoomed and background-subtracted views in
SI-Figures S4 and S5), at
q values below 0.4 Å
−1 (down to 0.006 Å
−1), some features characteristic of the phase structure of the nanocomposites can be observed: In case of the neat polyMEA matrix at
q below 0.05 Å
−1, a straight increase of scattering intensity with decreasing
q is observed. The slope of the change in intensity is relatively steep (−3.8), which suggests some spherical fluctuations in density—probably a residuum of the phase separation during the synthesis in aqueous solution (prior to final drying). If polyMEA is filled with in-situ SiO
2, with clay nano-platelets (RDS), or with a combination of both fillers, the steep change in intensity begins already at higher
q values, namely below 0.4–0.3 Å
−1.
In case of
nano-SiO2-filled samples, this straight slope in is always overlaid with one or more broad maxima. In the clay-free sample filled with 5 wt.% of SiO
2, the slope sets on near q = 0.3 Å
−1, and the overlaid maximum is relatively intense (see
SI-Figure S4b). The fit for rigid polydisperse spheres and the Guinier analysis suggest an average size of primary particles to be 3.4 nm, while the smallest secondary domains should be sized 9.7 nm. Both results are in good agreement with the TEM image in
Figure 4b, where the smallest secondary particle groups can be recognized in the large pattern of the filler. The slope at the highest angles of the SAXS region is −3.8, which confirms spherical primary particles. At the lowest q values (lowest angles) the slope is relatively flat, which corresponds to a lower-dimensional shape of the larger filler patterns (as seen in TEM:
Figure 4b). The nanocomposite with 15 wt.% of SiO
2 (see
Figure 5a and SAXS detail in
SI-Figure S4c), which possesses very attractive mechanical properties, displays a more intense SAXS pattern (than 0R-5T) which begins already below q = 0.3 Å
−1: there are two overlaid fairly flat maxima, and the course of the scattering intensity in the SAXS region is closer to a straight line. The evaluation by fits (see marks and labels in
SI-Figure S4c) yields the following results: a larger size of the primary SiO
2 nanoparticles at 5.4 nm (and their less spherical shape: initial slope at −3.3), as well as the sizes of larger nanofiller groups: 17 and 45 nm. (Larger domains could not be observed by the employed equipment). The straighter and steeper course of the curve in the SAXS region is in good agreement with the observed percolating-3D-domains morphology and with the higher homogeneity on the small scale (TEM:
Figure 4c).
In case of the
clay-filled and doubly filled nanocomposites (see
Figure 5b), the following morphological effects in the SAXS-region-patterns were observed: 4 wt.% of clay generate a nearly straight change in intensity, which begins below ca.
q = 0.3 Å
−1, and which has a slope of −2.5, thus indicating 2D domains. This is in good agreement with TEM (
Figure 4d: isolated groups of approximately parallelly oriented nano-platelets, exfoliated, but relatively close to each other). In case that nano-silica is present together with clay nano-platelets (RDS), similar maxima like in silica-filled samples are overlaid with the (straight) scattering intensity of the platelets, thus yielding information about the grouping of SiO
2 particles. Fits yield the following results (see labels in detailed views in
SI-Figure S4): In case of 5 wt.% of SiO
2 in addition to 4% of clay, the size of the smallest secondary aggregates appears to be 10 nm, very similar like in the clay-free sample with 5% of silica. Similarly, the nanocomposite with 15 wt.% of SiO
2 in addition to 4% of clay displays two flat SAXS maxima (like the related clay-free sample), the primary SiO
2 particle size appears to be 2.9 nm (smaller than in the clay-free analogue) and the sizes of larger groups are 6.3 and 37 nm. In context of these trends, the size of SiO
2 particles in the system with 5 wt.% of SiO
2 + 4% of clay can be estimated to also be somewhat smaller than in the clay-free sample (i.e., smaller than 3.4 nm).
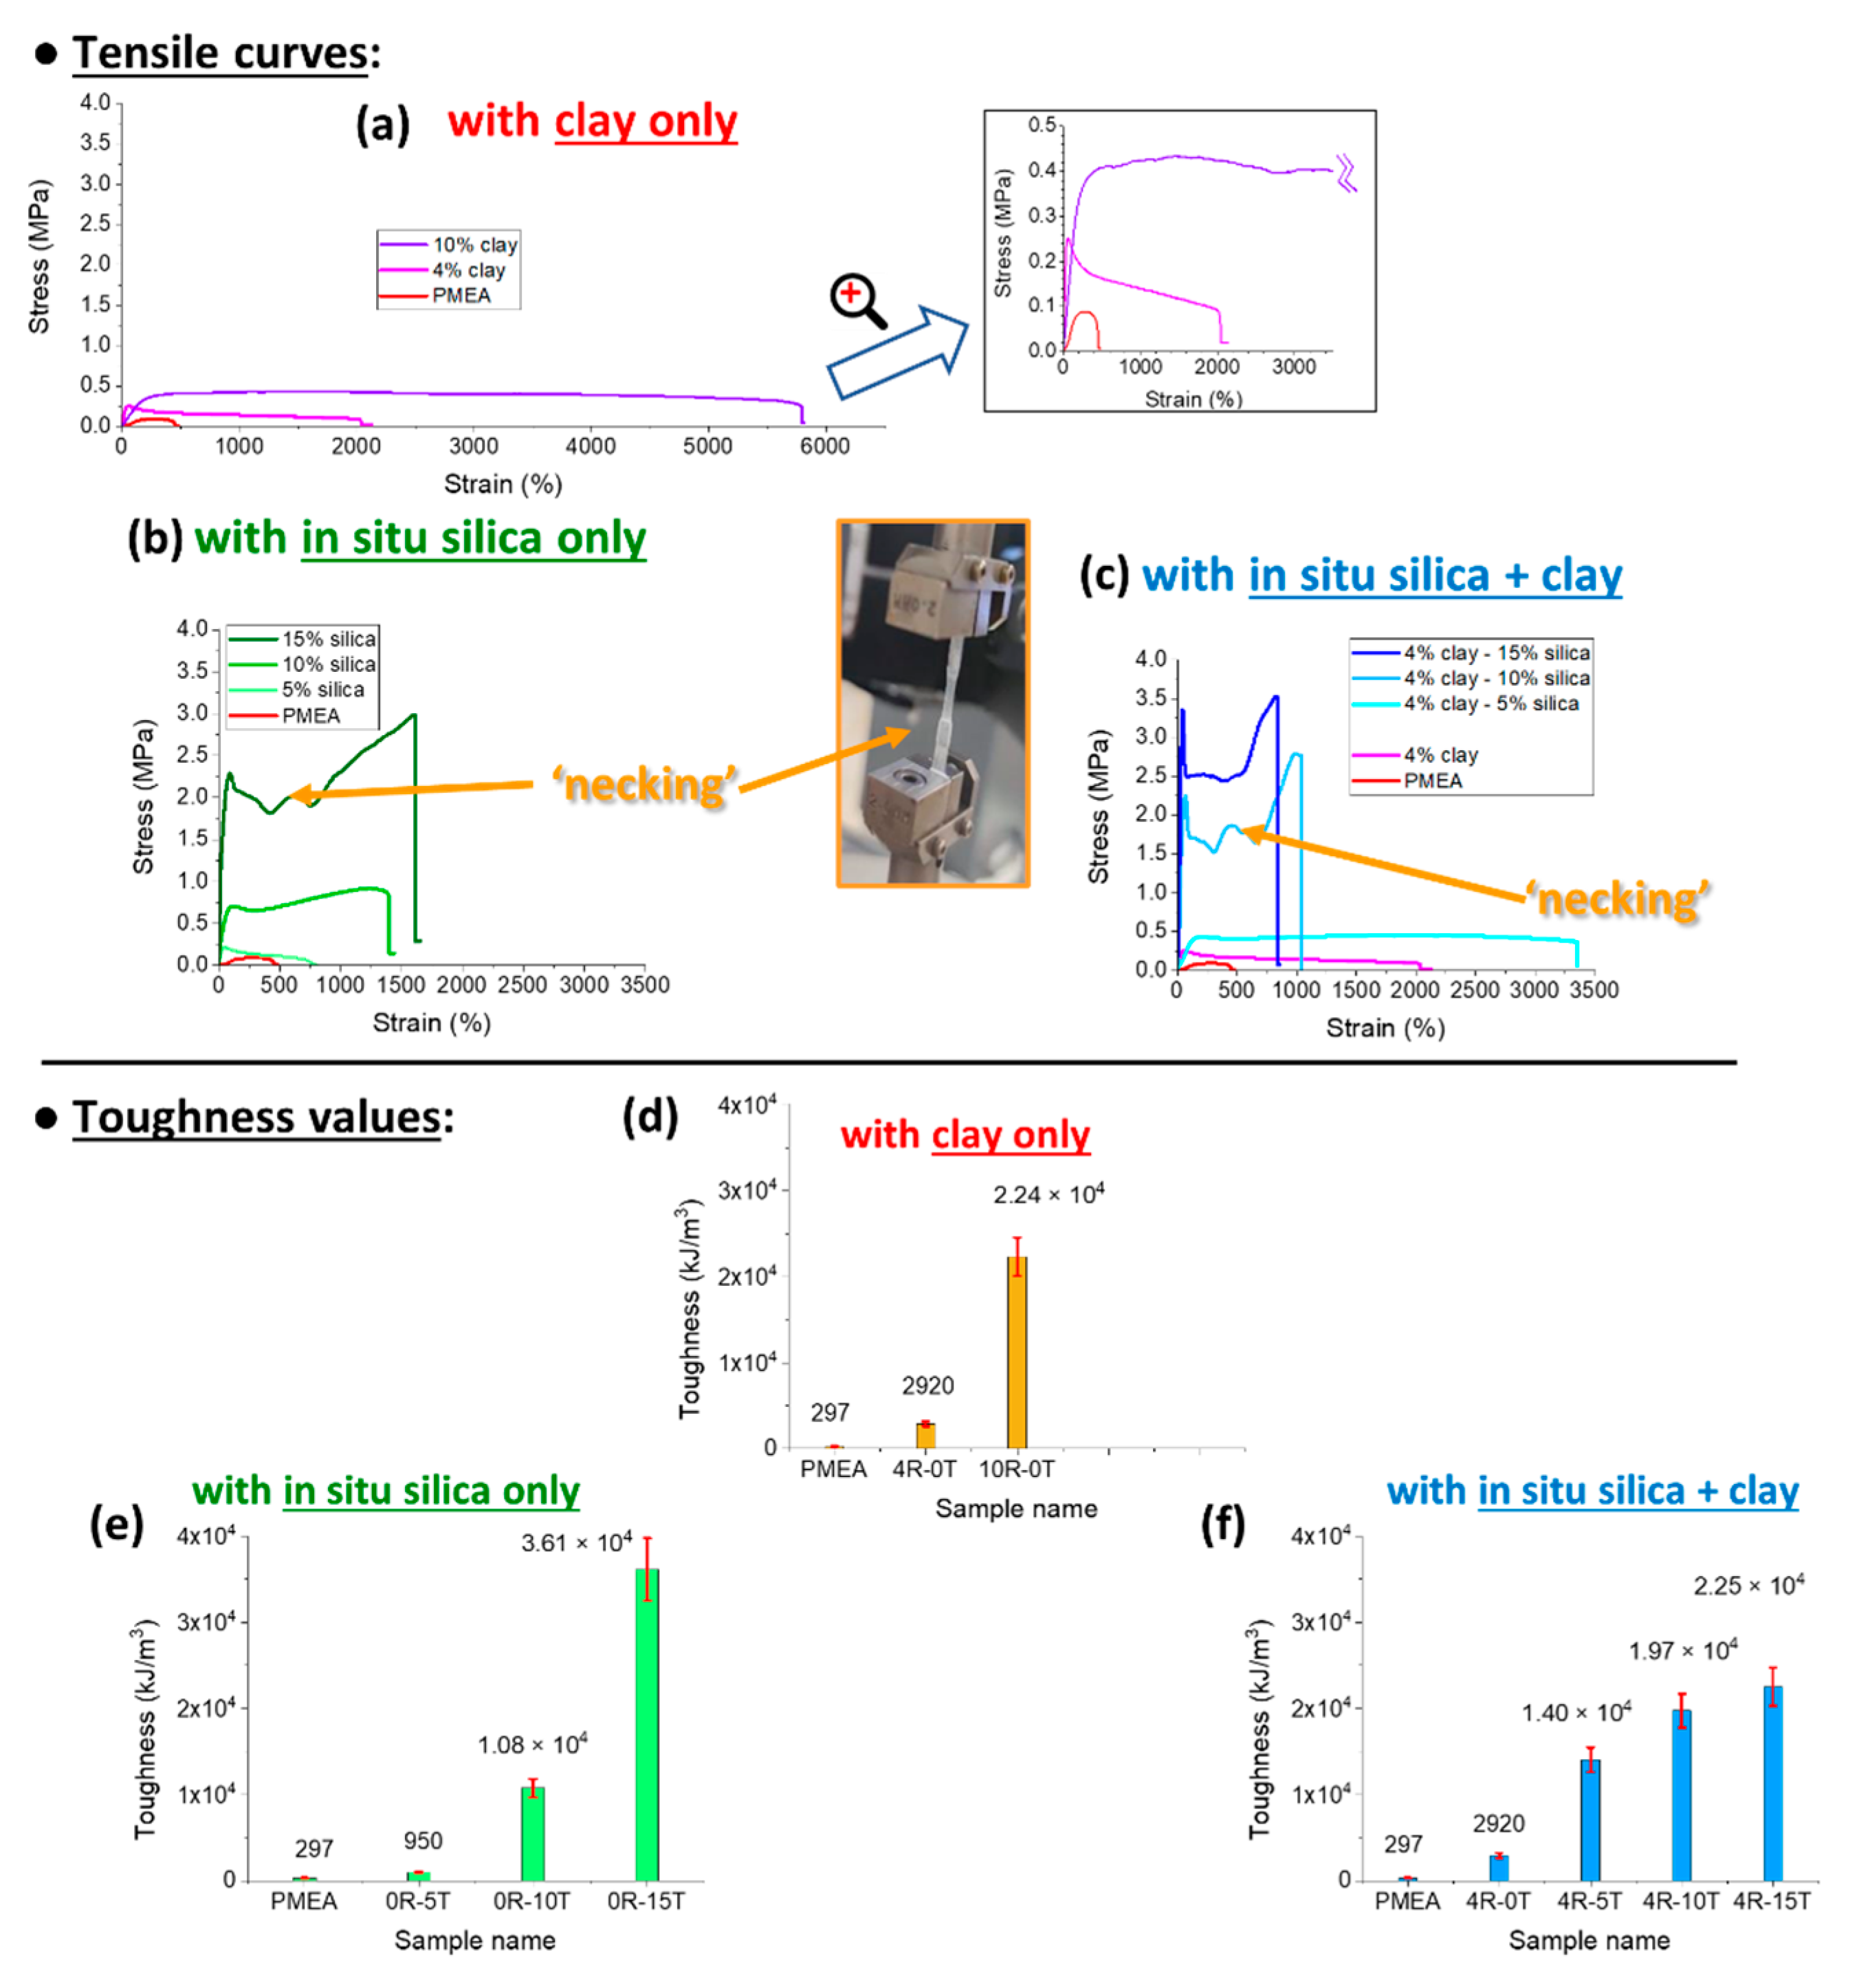
3.2. Tensile Properties of the polyMEA Nanocomposites
The most attractive property of the studied novel polyMEA nanocomposite elastomers—besides their high transparency—is their ultra-extensibility combined with a high modulus. The latter corresponds to stiff rubbers in case of the most interesting samples (shear modulus 10 MPa, see also further below: Thermo-mechanical properties, or comparison of moduli in
SI-Figure S6). Additionally, the nanocomposites were found to display an interesting mechanically-induced transformation from ‘plasto-elastic’ to ‘real elastomeric’ behaviour. The below-discussed investigations focused on determining the basic tensile characteristics in the post-synthesis state, on studying the degree of elasticity and plasticity before and after the mentioned transformation (via cyclic loading tests), on stress-relaxation phenomena (which illustrate the physical nature of crosslinkinng in the studied elastomers), as well as on the effect of ‘mechanical history’ on the tensile behaviour and on the structural features which made possible the transformation ‘plasto-elastic’ → ‘real elastomer’.
In
Figure 6, the tensile curves are shown and compared for nanocomposites filled with silica, for doubly filled ones (silica + clay nanoplatelets), and for some reference materials (with clay filler only, or neat polyMEA). Toughness values are compared in
Figure 6d–f.
Tensile curves of the
reference samples are compared in
Figure 6a: It can be seen, that the addition of clay nano-platelets to ultra-high-molecular-weight polyMEA (synthesized according the authors’ previous work [
66]) tremendously improves the extensibility (at least until 10 wt.% of clay) and thus the toughness of the polyMEA-based material, but not its tensile strength, or its yield stress (at which the plateau in the tensile curve in
Figure 6a begins). This behaviour can be attributed to the effects of supramolecular assembly (polyMEA + clay). Nanocomposites with more than 10 wt.% of RDS were not tested, because in [
66] it was found, that RDS amounts distinctly higher than 10% generally lead to problematic synthesis and products.
In-situ-formed and strongly hydrogen-bonding silica nanoparticles as new physical crosslinker markedly change the tensile curves of the polyMEA nanocomposites (
Figure 6b). It can be observed that the nanoparticles tremendously improve the toughness (see comparison in
Figure 6e), yield stress, and stress at break in comparison with neat polyMEA, or with polyMEA/clay. Nano-silica additionally also very markedly improves the extensibility of polyMEA (the improvement grows with the loading until 15%; but at 30% the samples become brittle). The improvement in extensibility is smaller than the one achieved by RDS in polyMEA/10% clay, but the clay nanocomposite, on the other hand, is markedly ‘softer’: it displays a lower modulus, yield stress and tensile strength (see discussion of DMTA results further below, and also
Figure 6). Also the shape of the tensile curves of silica-filled nanocomposites is visibly different from the ones of polyMEA/clay, especially at higher nano-SiO
2 amounts: ‘Plastic-like’ curves are observed, with ‘yield peaks’, with plateau regions affected by ‘necking’ phenomena, and with a tensile stiffening region prior to rupture (
Figure 6b). This behaviour can be attributed to reversible crosslinking (‘soft crosslinks’: see
SI-Figure S1c) between polyMEA and nano-SiO
2 via H-bridges (see
Figure 1b further above), which appears to be fairly strong, as also confirmed by results discussed further below.
Tensile curves of
doubly filled (silica + clay) polyMEA elastomers are shown in
Figure 6c (toughness values: in
Figure 6f). It can be seen, that combining the fillers leads to a further improvement of yield stress and stress at break. In case of low nano-SiO
2 content (see polyMEA/4% clay/5% SiO
2 in
Figure 6c), also the extensibility is greatly increased.
At the highest practical nano-silica content (15%), however, the nanocomposite filled exclusively by silica is tougher and more extensible than the doubly-filled one (with 19% of nanofillers in total). This seems to be the result of an ‘over-filling effect’, which can originate in more frequent morphological defects, and hence in easier crack formation and propagation. The doubly filled polyMEA nanocomposites thus are the strongest (yield stress, tensile strength), but their elongations at break are markedly smaller (1038% with 10% of SiO2, and 832 with 15% of SiO2) than in case of their analogues filled with silica only.
To sum up, it can be concluded, that
in-situ-formed SiO2 nanoparticles as a novel physical crosslinker lend the nanocomposites
excellent values of elongation at break: 1390% with 10%, and 1610% with 15% of SiO
2. This compares well with hydrogels (see [
2,
15]) and with solvent-free nanocomposite elastomers (see [
46]) of Haraguchi-type, which are physically crosslinked with a larger 2D filler (25-nm-sized nano-clay). The
doubly filled elastomers achieved the
highest extensibility among all the silica-containing ones, namely 3 350% in case of 4R-5T. The latter sample also has a high shear modulus (7 MPa), but is ‘soft’ in terms of yield stress and tensile strength (both ca. 0.5 MPa, similar like in samples filled exclusively by clay). Also the
highest yield stress and tensile strength (3.4 and 3.6 MPa, respectively) were achieved by doubly filled products, namely by 4R-15T.
3.2.1. Elasticity vs. Plasticity: HYSTERESIS Tests in the ‘as Prepared’ State
The
tensile curves of polyMEA nanocomposites with nano-SiO
2 but also with clay, which are compared in
Figure 6, display a
shape typical for plastic deformation (like polyethylene), and the SiO
2-rich ones (with 10–15%) also display the necking effect—even multiple necking, as shown in the inlay photograph in
Figure 6.
However, all the materials compared inFigure 6 (further above)
are elastomers, because they display a marked and sometimes even dominant (albeit never quantitative) recovery of tensile deformation (e.g., rapid elastic shrinking of the fragments after the disruption tests). This
‘plasto-elastic’ behaviour was characterized in more detail by means of repeated hysteresis experiments with large maximal deformations (ca. 50% of elongation at break).
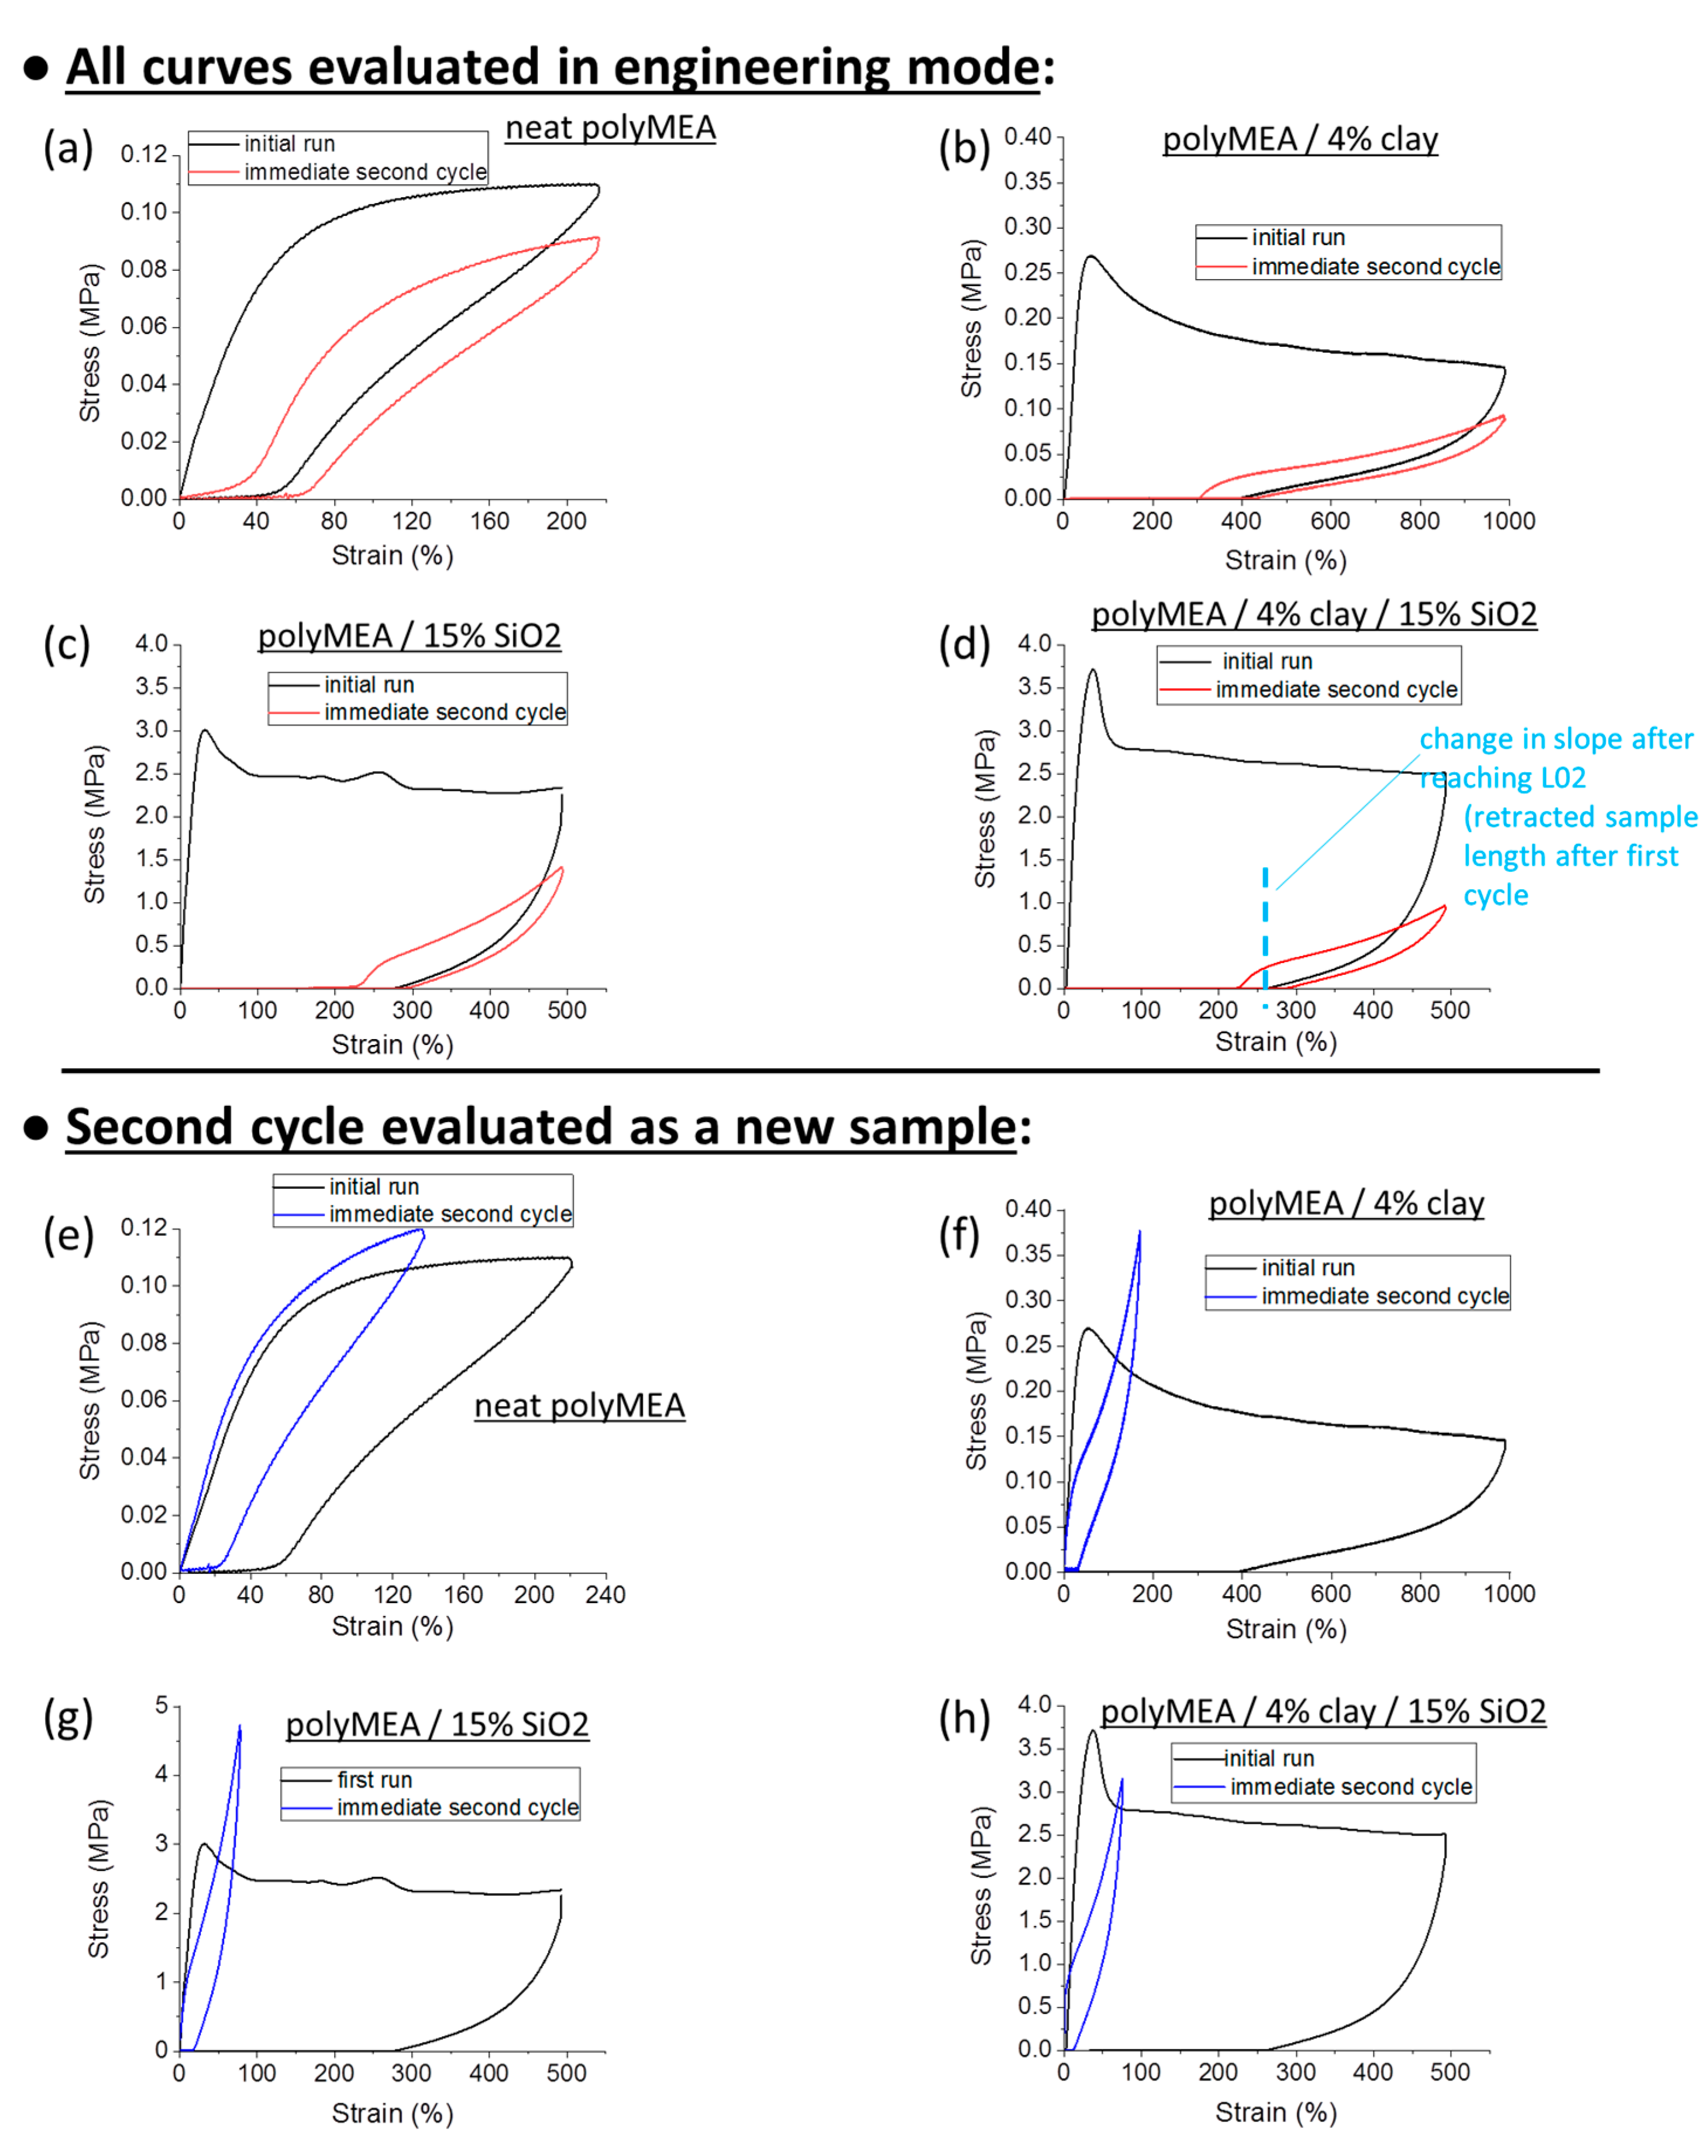
Figure 7a,b and
Figure S7 show the results obtained for the most important samples.
Figure 7e–h shows another interesting result, namely the data from the same experiments like in
Figure 7a,b, but with evaluation of the second tensile cycle as a new specimen with a new initial geometry (which it acquired by creep while enduring the first cycle).
It can be seen in
Figure 7a, that the
neat polyMEA matrix (a relatively soft material with shear modulus = 0.14 MPa) displays a behaviour, which is closest to full elastic recovery, albeit with a considerable hysteresis (effect of molecular friction): After the stretching, the sample was unloaded, and 77% of the previous deformation (or ¾ of the maximum x-value in
Figure 7a) were recovered. The recovery improved to 85% upon start of the subsequent hysteresis cycle, whose immediate recovery upon unloading was 71% of the second applied deformation.
The next best degree of elastic recovery is observed in the nanocomposite
polyMEA/4% clay (see
Figure 7b). Upon unloading from the first stretching, 61% of the initial deformation is recovered, and this value improves to 70% in the moment when the immediately following second loading cycle starts; 57% is recovered immediately upon unloading this latter cycle.
4R-15T is more plastic, the recovery is 48, 55, and 43%, respectively, for the first unloading, start of the second cycle, and the second unloading, respectively.
0R-15T displays a similar behaviour like 4R-15T, but is even more plastic, with recovery percentage of 43, 52 and 39% in analogous situations like above. However, even in this case, more than 50% of the tensile deformation is elastic, in spite of the ‘plastic shape’ of the tensile curve.
An important circumstance in the above hysteresis tests of ‘plasto-elasticity’ (
Figure 7) was, that prior to the first deformation loading,
all the samples were in the ‘as prepared’ (post-synthesis) state. As will be discussed further below, it was found by more detailed investigations, that an extensive deformation ‘switches’ the ‘as-prepared’ sample from the ‘plasto-elastic’ to a ‘real elastomeric’ state, which is much more elastic and much less plastic than the initial ‘as prepared’ state.
In the same context, another important observation from
Figure 7 is, that the area between the curves of the first hysteresis cycle is very large, especially in the nano-filled samples. In case of each second loading cycle, the area between the curves is much smaller. This means, that in the first cycle, the
‘as-prepared’ material acts as a very efficient energy absorber. The ‘plasto-elastic’ and energy-absorbing behaviour in the ‘as prepared’ state is attributed to
reversible hydrogen bridging between polyMEA and silica (see
Figure 1b further above), and to
its destruction and subsequent ‘reorganization’ during the first hysteresis cycle. The mechanism is discussed in detail in the section “Assumed mechanism of the change in the tensile behaviour” (see further below). The irreversible rearrangement of the nanofiller/matrix contacts (the energy absorption effect) is much more pronounced, if the filler is nano-SiO
2, and not clay, with which the same effect is considerably smaller in energy units. This apparently is due to the fact, that in contrast to clay, SiO
2 can bond via H-bridges to polyMEA. The latter difference also is illustrated by the increasing plastic character of the ‘as prepared’ nanocomposites with increasing SiO
2 content, as noted in the further-above discussion of the hysteresis cycles results in
Figure 7b–d.
Multi-Cyclic Loading
It was noted in
Figure 7b–d, that the nanocomposite products (containing at least one filler) display a distinctly different shape of the second cyclic deformation curve: it is elastomer-like in contrast to the ‘plastic-like’ curve of the first loading, prior to which the sample was in the ‘as prepared state’. An exception was the neat polyMEA matrix, which is not a nanocomposite: the shape, and partly even the stress values of its second deformation cycle are very similar to the first one. In order to further evaluate changes in tensile behaviour caused by previous deformations, repeated cyclic loading tests (6 cycles) were carried out with the nanocomposite 4R-15T (see
SI-Figure S7a). It was observed that the second cycle, as well as next following ones, yield mutually very similar elastic curves, and that
practically no significant creep occurs between the second and the next cycles. In contrast to the initial ‘plasto-elastic’ cycle, the hysteresis is relatively slim in all these later cycles.
Another effect, which was evaluated, was an
eventual slow self-recovery: The
SI-Figure S7b compares the initial loading cycle with a second loading cycle, which was applied either immediately after the first one, or after a rest time of 30 min. The results in
SI-Figure S7b indicate that no slow deformation recovery occurs in 4R-15T (or in similar samples). This is illustrated by identical strain values at which resistance (stress) sets-on during the immediately following, or during the delayed second loading cycle. It was also noted (not illustrated in the
SI-Figure), that the silica-filled (including doubly filled) polyMEA nanocomposites do not display any significant self-healing if disrupted or cut, in contrast to some polyMEA/clay compositions (see [
66]). Both second cycles (with rest, or no rest) in
SI-Figure S7b are fairly similar. However, it can be observed, that in the cycle recorded after 30 min of rest, the (flat) slope in the region of large deformations is less steep in comparison to the second cycle recorded immediately after the initial one. The trend to temporarily somewhat higher moduli, generated by immediately preceding large deformation, was observed systematically in all the tested samples (effect of time needed for ‘soft’ filler-matrix contacts to rearrange after deformation).
In
Figure 7 and
Figure S7, the local moduli (slopes), as well as the yield-stress-, and stress-at-break values in different regions of the curves of the second and eventual subsequent loading cycles, appear markedly lower than in the initial loading cycle (‘as prepared’ state). This seeming softening, however, can be partly due to creep, which changed the starting geometry of the samples (initial length, as well as cross-section), prior to the second and subsequent deformation cycles.
‘True Properties’ Using Corrected Starting Geometry
The above-mentioned ‘geometry effect’ on data evaluation was eliminated in
Figure 7e–h, which shows the same data (first and second deformation cycle) of the same samples which were compared in
Figure 7a–d, but with the second cycle
evaluated as a new specimen with a new initial geometry. In case of such an evaluation, it can be seen, that polyMEA (
Figure 7e) displays practically identical curves in subsequent deformation cycles. But in case of the nanocomposite samples (
Figure 7f–h), however, their curves in the second cycle still stay strongly different from the first cycle, also in case of eliminated ‘geometry effect’ (
Figure 7f–h: blue curves). These elastic-like curves of the second cycles are similar-shaped but much steeper than the second-cycle-curves in
Figure 7b–d (red curves), which were evaluated using the original geometry prior to the first cycle. The initial slopes (moduli) of the ‘geometry-corrected’ second curves in
Figure 7e–h are always identical (not flatter) like in the first run. This finding was additionally confirmed by measuring moduli in small-deformation oscillatory shear experiments, in different states of the samples (see
SI-Figure S6). After the ‘yield region’, the ‘geometry-corrected’ curves of the second cycles in
Figure 7e–h continue to show an elastomeric shape, with a relatively steep slope (but flatter than in the small-deformation region), in contrast to the plateau in the curve of the first (‘plasto-elastic’) cycle. All the inorganic-filled samples show this described trend. Multiple cyclic deformations also were evaluated using the respective new initial geometries (see
SI-Figure S8), and yield the same conclusion like
SI-Figure S7a: the material properties display little change, once the nanocomposite has endured the first large deformation cycle, and the plasto-elastic → elastic transformation is permanent (assigned to above-mentioned rearrangement of filler-matrix contacts).
3.2.2. Stress Relaxation in the Nanocomposite Elastomers
The ‘plasto-elastic’ behaviour of the polyMEA nanocomposites in the ‘as-prepared’ state was further elucidated in stress relaxation tests. The results are summarized in
Figure 8 (relaxation of 4R-15T) and in the
Supplementary Information File, in
SI-Figures S9–S11 (relaxation of neat polyMEA, 4R-0T, and 0R-15T).
The graph in
Figure 8a illustrates the stress build-up upon sample stretching till half the value of elongation at break (red line), as well as the subsequent relaxation of the stress during a period of rest in the stretched state (blue line). The changes in sample length are depicted in
Figure 8b. The
Figure 8c compares the effects of relaxation (using relative stress values in %, normalized in respect to the initial stress) at three characteristic time points, for the most important nanocomposite samples: 0R-15T (filled only with 15% of silica), 4R-15T (with 4% of RDS clay + 15% of silica), as well as for the reference materials polyMEA and 4R-0T. The comparison in
Figure 8c shows, that all the tested samples display a nearly identical kinetics of stress relaxation: The stress relaxes down to 27–20% of its original value in 25 min. Most of this drop (by ca. 50%, or ca. ¾ of the whole relaxation process) occurs in the first minute, and after 5 min of relaxation, the changes are already very small. The nearly identical relaxation kinetics independently of the presence or absence of the nano-sized crosslinker(s) indicates, that the polyMEA chains (their entanglements and their friction) are the main source of the observed kinetics behaviour.
3.2.3. Permanent Change of Tensile Behaviour after Enduring Large Deformations
The repeatedly discussed switch of tensile behaviour of the polyMEA nanocomposites, from ‘plasto-elastic’ to ‘real elastomeric’, as consequence of intense deformations, is an interesting property, which was investigated in a more detailed way. The results of additional explanatory (mechanical-history-dependent) tensile tests are summarized in
Figure 9 (additional results, namely for 0R-15, are shown in
SI-Figure S12).
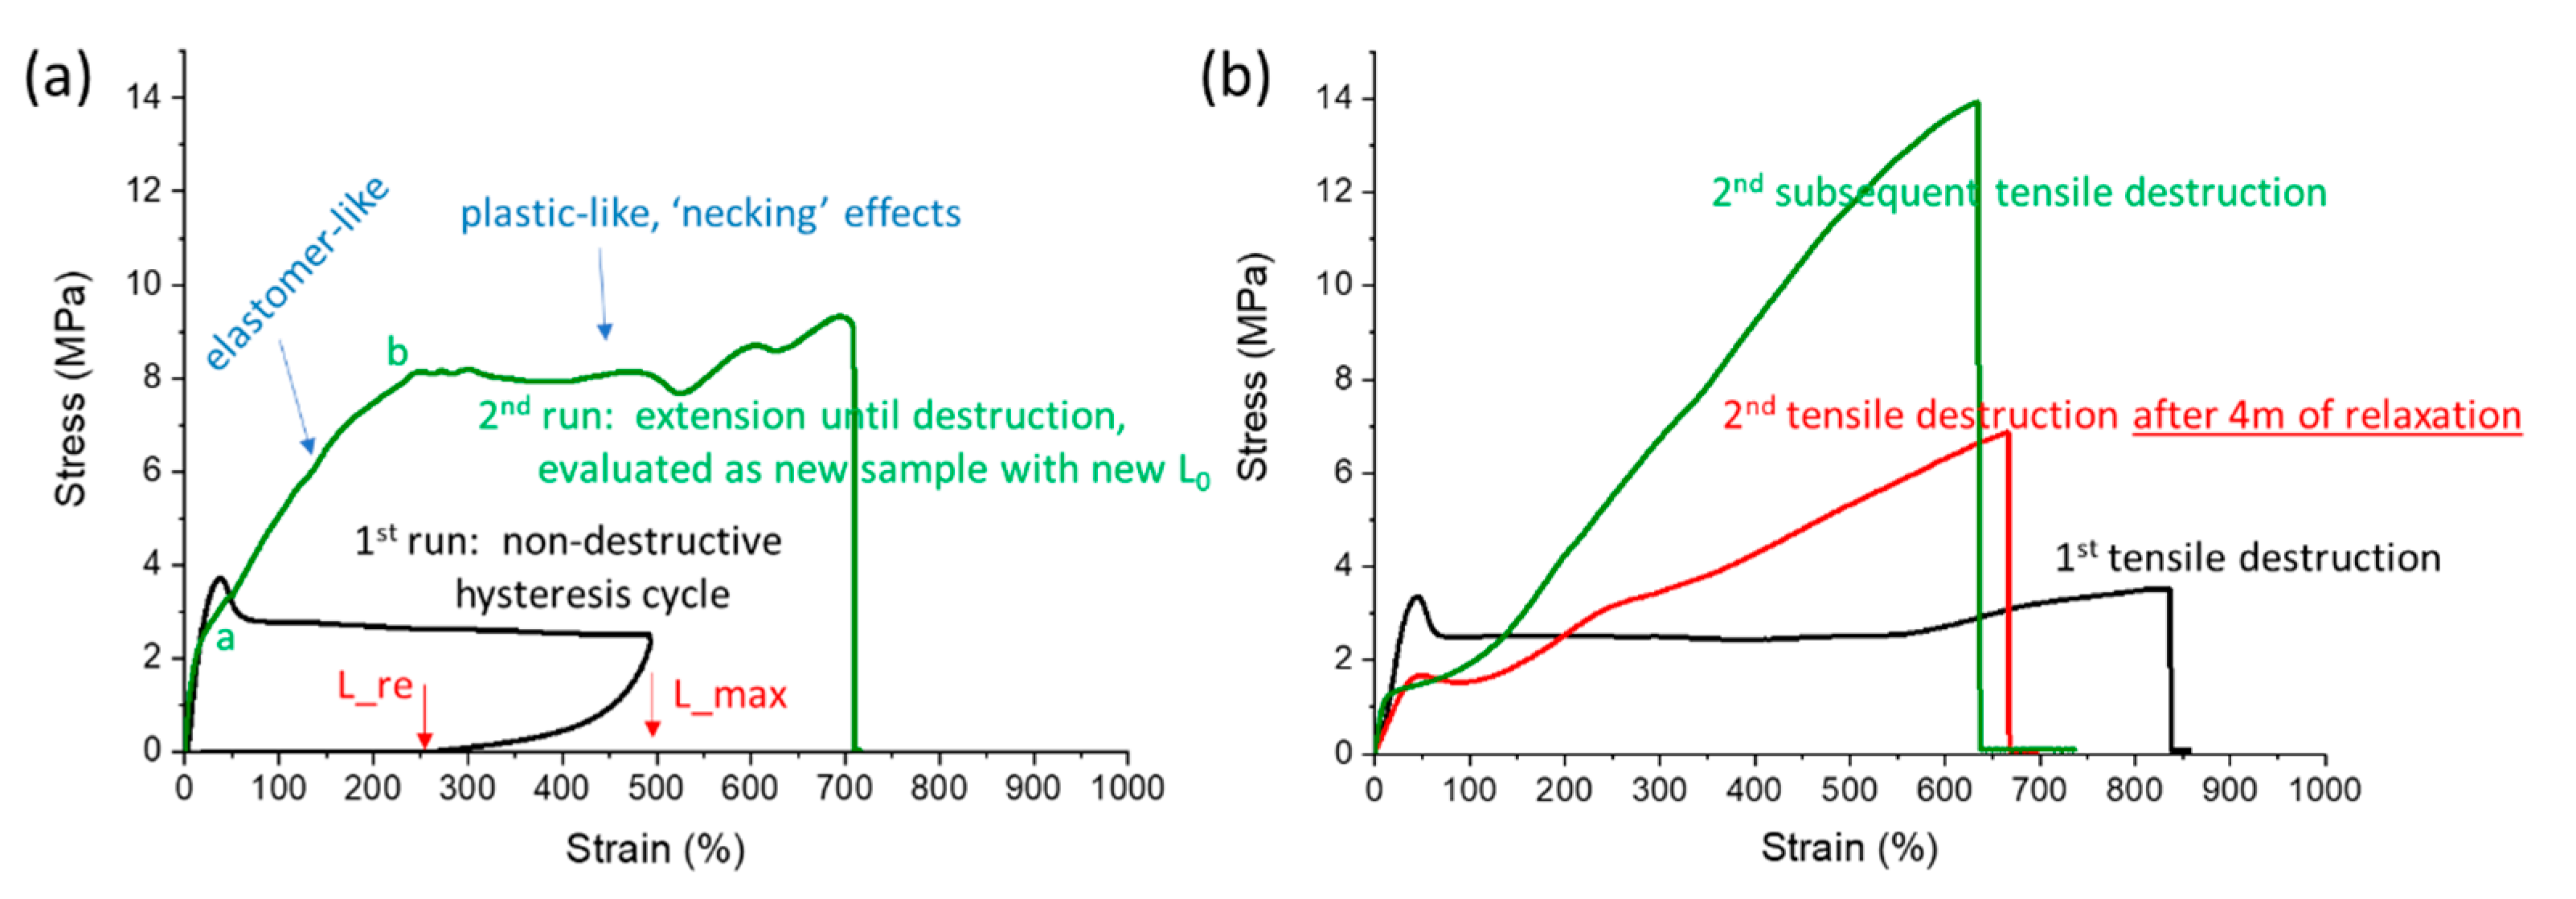
In
Figure 9, the second tensile run was always evaluated using the sample’s new geometry, which was acquired due to residual deformation resulting from the previous run.
The results in
Figure 9a (example of 4R-15T) illustrate, that a
moderately large deformation—ca. ½ of the elongation at break in the given case—
does cause only a limited ‘elasticization’ of the so-treated sample, which was previously in the ‘as prepared’ state. If this sample is stretched until disruption in the second run (as shown in
Figure 9a, green curve), and not only to its previous maximum length (as done in the cyclic tests shown further above in
Figure 7), its behaviour is at first elastic-like (analogy to
Figure 7). But after significantly exceeding the previous maximum absolute length “
L_max” in “
Figure 9a—1st run”, which corresponds to a point somewhat preceding the point “b” in “
Figure 9a—2nd run”, the profile of the 2nd-run-curve (in
Figure 9a) changes to a ‘plastic-like’ one (plateau with necking effects), which then persists until sample disruption. Some orientation-stiffening can be suspected near the end of this 2nd-run-curve, where the stress somewhat increases with increasing elongation (similarly like in the ‘plasto-elastic’ curve of the ‘as prepared’ nanocomposite in
Figure 6c further above). An interesting detail is, that the specific deformation region, where the slope of the 2nd-run-curve somewhat flattens for the first time, labelled with “a” in
Figure 9a, is relatively close to the length value (in mm) of the ‘true’ residual deformation endured after the first run (point “L_re” in
Figure 9a). An analogous feature also is observed in the cyclic curves of the second hysteresis run for all the polyMEA nanocomposites in the further-above discussed
Figure 7f–h (where the maximum elongation in the second cycle was limited, however).
In the experiments shown in
Figure 9b, the
complete transition from ‘plasto-elastic’ to ‘real elastomeric’ tensile behaviour was achieved: In the first run, a tensile curve was measured for a 4R-15T specimen in the ‘as prepared state’, until its disruption (black curve, plastic-like). Immediately thereafter, a fragment of the disrupted specimen was again subjected to tensile testing until disruption (green elastomeric-like curve, the steeper one). In another experiment, a fragment of the disrupted sample from the initial (‘plasto-elastic’) tensile test was left to rest for 4 months. After such a rest, this fragment was subjected to a tensile test until disruption, thus yielding the red curve in
Figure 9b (elastomeric, but flatter than the green curve). It can be seen, that
after enduring the maximum possible stretching, the polyMEA nanocomposite is converted into an exclusively elastomer-like-behaving material. Also, no necking during tensile tests is observed anymore after such a previous treatment. In case that the sample went through a longer rest time after the first disruption, the shape of its second tensile curve (
Figure 9b: red curve) is practically identical with the ‘immediate second tensile test’ (
Figure 9b: green curve), but the slopes at larger deformations are visibly flatter in the ‘relaxed sample’ (red curve). A similar flattening was observed also in
SI-Figure S7b in case of repeated hysteresis tests with a 30-min-delay for relaxation before the second cycle. For comparison, the ‘geometry-corrected’ maximum elongation in the second deformation cycles in
SI-Figure S7b corresponds to ca. 100% in
Figure 9.
If
toughness is
considered, it can be estimated from
Figure 9b, that the curve integral of the ‘immediate second disruption test’ (
Figure 9b: green curve) yields a ca. 2 times higher toughness, and a similar but somewhat smaller extensibility than the curve (black) of the ‘as prepared’ sample. In case of the ‘relaxed sample’ (red curve), its toughness is practically identical like in case of the ‘as prepared’ sample (see also toughness values in
SI-Figure S13).
If the
‘initial moduli’ are compared, which are observed
at the smallest deformations in
Figure 9, they appear to be very similar. Small-strain-torsion experiments (see
SI-Figure S6) verified this finding: the shear moduli were
always practically identical for a given composition,
independently of its previous mechanical history, in contrast to local moduli (slopes) in regions of large deformations, which are well-visible in
Figure 9b.
The partial or full transformation of the polyMEA nanocomposites from ‘plasto-elastic’ to ‘real elastomeric’ state can be explained by the already mentioned reversible hydrogen bridging between polyMEA and silica, and by its temporary destruction and subsequent reconnection and ‘reorganization’ (which is fast but not immediate, see above sample relaxation effects) during large deformations of the ‘as prepared’ (‘plasto-elastic’) specimens. The mechanism will be discussed in detail in the section “Assumed mechanism of the change in the tensile behaviour” (see further below).
3.2.4. Hysteresis Tests of ‘Elasticized’ Samples
The transformation of polyMEA nanocomposites from ‘plasto-elastic’ into ‘real elastomeric’ materials was further studied by hysteresis tests, analogous to the ones presented in
Figure 7. Samples which underwent ‘full elasticization’ via stretching until disruption, and which subsequently went through a period of rest (4 months), were used for this purpose. The
SI-Figure S14 summarizes the results of these investigations for the most important silica-filled nanocomposites 0R-15T and 4R-15T.
The sets of hysteresis curves of elasticized samples in
SI-Figure S14 (two subsequent cycles were recorded with each sample) are superficially similar to the ones obtained for ‘as prepared’ samples in the same type of test (see further above,
Figure 7c,d,g,h). However, the curves of the first loading cycles of the ‘elasticized’ specimens are steeper than in case of the ‘as prepared’ ones: they are elastomer-like instead of plastic-like: no plateau in case of the first run in
SI-Figure S14a,b, in contrast to
Figure 7c,d further above.
If the second deformation cycle is evaluated using the corrected starting geometry (
SI-Figure S14c,d), its elastic-like curves become markedly steeper, with initially identical (4R-15T), or even with slightly steeper (0R-15T) slopes at the lowest strains, than in case of the first run. The latter steepness of the ‘immediate second-run-cycles’ seems to partly stem from a non-equilibrium state, similarly like the steeper curve of the immediately repeated tensile destruction test in
Figure 9b.
The
stronger elastomeric character after previous stretching until destruction is illustrated also by the
improved degrees of deformation recovery, which can be extracted from the curves in
SI-Figure S14:
The highest elastic recovery is observed in the nanocomposite
0R-15T (polyMEA with 15% of silica) (see
SI-Figure S14a), which was the most plastic of the polyMEA nanocomposites in the ‘as prepared’ state. Upon unloading from the first stretching, 64% of the initial deformation is recovered, and this value improves to 75% in the moment when the immediate second loading cycle starts; 61% is recovered immediately upon unloading this second cycle. The recovery in the ‘as prepared’ state was 43, 52, and 39% in analogous situations.
‘Elasticized’ 4R-15T displays a similar but slightly smaller recovery like ‘elasticized’ 0R-15T, namely 60, 71, and 57% in analogous situations like above. (In the as-prepared state, the values were 48, 55, and 43%, respectively).
The recovery value at the start of the second loading cycle seems to be the most representative one for assessing the ‘degree of elasticity’. Hence, 75 and 71% are achieved in 0R-15T and 4R-15T, respectively (vs. 52 and 55% in the ‘as prepared’ state). The stronger improvement in case of 0R-15T also correlates with its steeper cycle in
SI-Figure S14b.
The hysteresis results further confirm a thorough ‘elasticization’ of the polyMEA nanocomposites, which was documented in the history-dependent tensile tests in
Figure 9, as well as a residual small plasticity (creep), which seems to be connected with the physical nature of the crosslinking. The differences between the initial and the geometry-corrected second loading cycles suggest, that small and reversible reorganizations of hydrogen bridging between matrix and filler (which are discussed just below) play a role also in the permanently elasticized state (the filler-free neat polyMEA practically does not display such differences, see
Figure 7a,e).
3.2.5. Assumed Mechanism of the Change in the Tensile Behaviour
Molecular Level
The mechanism of the further-above discussed huge energy-absorption ability in the ‘as prepared’ state of the polyMEA nanocomposites, as well as the phenomenologically related ‘elasticization’ seems to be connected with the phase separation processes during their synthesis. Analyses of morphology of ‘elasticized’ samples, which are discussed just below (and illustrated by
SI-Figures S15 and S16), did not indicate any marked changes in the nanofiller patterns, but only slight ones. It seems that the nanofillers, especially the strongly hydrogen-bridging silica, are not optimally covered by the polymer molecules in the moment of the phase-separation: Concerned are especially the secondary adsorptions (H-bridging) of the free-to-move polyMEA segments (
SI-Figure S1c). This situation is postulated to be a consequence of the relatively abrupt phase separation during the polymerization (which was discussed in context of the further-above-shown
Figure 2). Also the formation of a part of polymer-polymer entanglements (see
SI-Figure S1c) might be adversely affected by the abrupt precipitation of polyMEA from the aqueous solution. During the extensive deformations in the course of tensile tests (and during a short rest time after them), the supramolecular elastic network structure (see further-above
Figure 4g–i and
Figure S1c) seems to undergo repeated dissociation and reconnection processes, which lead to subsequently more efficient physical crosslinking (‘switching to real elastomeric behaviour’), but only to slight alterations in morphology. The irreversible break-up of the initially present ‘non-ideal’ but mechanically strong morphological features then corresponds to the large hysteresis areas of the initial deformation cycles of the nanocomposites in the ‘as prepared’ state (see
Figure 7 further above). The originally present partly plastic internal structures do not seem to re-appear (due to the higher stability of the newly connected ‘optimal’ polymer-filler crosslink system): The tensile curve measured immediately after previous disruption, as well as the one measured after disruption and 4 months of rest, both have the same shape (after rest, the slopes at large deformations are even flatter and not steeper).
The elasticity of the material ‘homogenized’ by large deformation, as well as the stiff-plasto-elastic-like behaviour of the ‘as prepared’ one, might both be of value for practical applications. The strong affinity of in-situ-nano-silica to polyMEA chains also might be responsible for the absence of self-healing in the studied silica-containing polyMEA nanocomposites (disentangled chains rapidly adsorb on SiO
2), in contrast to at least some polyMEA/clay systems (see [
66]).
Morphology Changes Visible by TEM
The morphology of the samples, which were subjected to stretching until destruction, and hence to ‘internal homogenization’, but probably also to some degree of aligning, was investigated by TEM (see
SI-Figure S15). The stretching direction was always in the plane of the recorded images. It can be seen from the comparison in
SI-Figure S15, that at the first glance the morphology did not markedly change. However, at closer inspection, it can be noted (4R-15T in
SI-Figure S15c vs.
Figure S15f) that most of the sharp lines disappear, which were associated with groups of clay platelets, so that the latter seem to be less often oriented perpendicularly to the image plane (hence more often parallel). Also, the largest groups of filler are broken to more regularly sized smaller ones (this correlates with reduced plasticity). But in case of the sample with 15% of SiO
2 as the only filler, differences are practically invisible. In case of the sample filled exclusively with clay (4% RDS), the overall pattern also does not change, but the platelets seem to be more often oriented parallel to the image plane, in which also laid the stretching axis.
Morphology Changes Visible by X-ray
If the effect of stretching until break on the morphology is observed by X-ray diffraction (see
SI-Figure S16), the changes in pattern also are moderate, but more clearly visible than by TEM. In case of samples containing 15 wt.% of silica (with or without clay), a change in the position of the maxima caused by the SiO
2 phase can clearly be observed: the maximum generated by the smallest secondary domains moves to higher angles (smaller domain size) in a nearly identical way in both the mentioned samples. In case of the sample filled by clay only (4 wt.%), no significant pattern change can be observed in the 1D diffractograms in
SI-Figure S16. But if the 2D images used to obtain the scattering patterns are evaluated (
SI-Figure S17), some orientation effects can be recognized in case of the clay-containing samples, especially a variation in the intensity of diffraction rings (marked in 4R-0T: see
SI-Figure S17a). This confirms the mentioned impression gained from TEM (see
SI-Figure S15a vs.
SI-Figure S15d). On the other hand, the exclusively SiO
2-filled samples do not display notable anisotropy in 2D diffractograms after they endured stretching.
Morphology analyses hence confirm, that changes in filler patterns are small after the ‘elasticization’ of the nanocomposites, which resulted from very large deformations. This also means, that the reorganization of hydrogen bonding between SiO2 and polyMEA (and of the less energetic polyMEA-clay interactions) is the main mechanism of the ‘elasticization’ of the polyMEA nanocomposites, as well as of the energy absorption by them in the ‘as prepared’ state.
3.4. Stability against Oxidative and Thermal Degradation (TGA)
The stabilization of the polyMEA elastomers against oxidation and thermolysis, which is provided by the inorganic nanofillers, was evaluated by means of thermogravimetric analysis (TGA). The most important results are summarized in
Table 5 and
Table 6, and shown in
SI-Figures S19 and S20.
Generally, it was found, that the nanofillers exerted only a small influence on the thermal stability in air and in nitrogen, at least in the investigated range of filler loadings. This small nanofiller effect was stronger in case of the oxidative degradation in air.
In case of the nanocomposite elastomers filled with silica only, it can be seen, that the small amount of 5 wt.% of nano-SiO2 slightly stabilizes the elastomer against oxidation by air (most probably via less permeable (stiffer) H-bridged supramolecular structure): both the decomposition onset, as well as the temperature of the maximum oxidation rate are very modestly improved. At 15% of SiO2, however, the nanocomposite is slightly destabilized, especially concerning the temperature of the maximum oxidation rate. Possibly, the nano-SiO2 filler itself supports the diffusion of oxygen into the sample, because no analogous destabilization is observed under nitrogen.
In case of the clay- and doubly filled nanocomposites, the clay filler—if it is alone (e.g., in the sample 4R-0T)—displays the strongest stabilizing effect against oxidation by air among the studied filler combinations. Increasing the content of nano-SiO2 added with the clay causes a decrease in the mentioned stabilizing effect. In case of 4 wt.% of clay and 15 wt.% of silica (4R-15T), the nanocomposite is already less stable than the neat matrix. The anti-oxidative action of the RDS clay likely is based on the barrier effect of the inorganic nano-platelets.
In case of the
TGA analyses carried out under nitrogen (see
Table 6, as well as
SI-Figures S19 and S20), the differences between the nanocomposites are very small. Nevertheless, in case of nano-SiO
2 as the exclusive filler, a moderate stabilizing effect can be observed, which increases with filler content. This is probably due to matrix immobilization by the SiO
2 filler via H-bridging (the above-mentioned support of oxygen transport by SiO
2 does not play a role in the inert atmosphere). In case of the clay-filled elastomers, the clay seems to moderately catalyse the thermolysis (while the above-mentioned barrier effect (anti-oxidative stabilization) is useless under inert atmosphere)—the temperature of decomposition onset is lowered by it—but the overall stability is similar like in case of neat polyMEA. Addition of 5 wt.% of nano-SiO
2 (which tends to concentrate around the clay platelets) cancels the decomposition catalysis by clay, and up-shifts the onset temperature, as well as the temperature of the maximum oxidation rate in comparison to neat polyMEA. With 15 wt.% of SiO
2 in addition to 4 wt.% of clay, the stabilization effect of SiO
2 somewhat recedes, possibly due to the already mentioned (tensile properties, DMTA) ‘over-filling’ effect.


 ,
, 


