
Thermophysical Properties of Kaolin–Zeolite Blends up to 1100 °C
by
 ,
,
Ján Ondruška
1, 
Tomáš Húlan
1,
Ivana Sunitrová
1,
Štefan Csáki
2,
Grzegorz Łagód
3,
Alena Struhárová
4 and
Anton Trník
1,5,* 1
Department of Physics, Faculty of Natural Sciences, Constantine the Philosopher University in Nitra, Tr. A. Hlinku 1, 94974 Nitra, Slovakia
2
Institute of Plasma Physics, Czech Academy of Sciences, Za Slovankou 3, 18200 Prague, Czech Republic
3
Faculty of Environmental Engineering, Lublin University of Technology, Nadbystrzycka 40B, 20-618 Lublin, Poland
4
Department of Materials Engineering and Physics, Faculty of Civil Engineering, Slovak University of Technology, Radlinskeho 11, 81005 Bratislava, Slovakia
5
Department of Materials Engineering and Chemistry, Faculty of Civil Engineering, Czech Technical University in Prague, Thákurova 7, 16629 Prague, Czech Republic
*
Author to whom correspondence should be addressed.
Crystals 2021, 11(2), 165; https://doi.org/10.3390/cryst11020165
Submission received: 4 January 2021
/
Revised: 2 February 2021
/
Accepted: 3 February 2021
/
Published: 7 February 2021
(This article belongs to the Special Issue Zeolites)
Abstract
:In this study, the thermophysical properties such as the thermal expansion, thermal diffusivity and conductivity, and specific heat capacity of ceramic samples made from kaolin and natural zeolite are investigated up to 1100 °C. The samples were prepared from Sedlec kaolin (Czech Republic) and natural zeolite (Nižný Hrabovec, Slovakia). Kaolin was partially replaced with a natural zeolite in the amounts of 10, 20, 30, 40, and 50 mass%. The measurements were performed on cylindrical samples using thermogravimetric analysis, a horizontal pushrod dilatometer, and laser flash apparatus. The results show that zeolite in the samples decreases the values of all studied properties (except thermal expansion), which is positive for bulk density, porosity, thermal diffusivity, and conductivity. It has a negative effect for thermal expansion because shrinkage increases with the zeolite content. Therefore, the optimal amount of zeolite in the sample (according to the studied properties) is 30 mass%.
1. Introduction
Ceramic production is known as one of the oldest sectors of human activity. Commonly used materials in the production of traditional ceramics are kaolin, illitic clays, feldspars, quartz, and Al2O3. Traditional ceramics are usually used in the building industry, such as bricks and tiles. The partial substitution of raw materials with waste or new materials can improve the properties of ceramic products and also reduce the cost of their production [1]. Nowadays, many published studies deal with partial substitution of traditional input raw materials for production of ceramics by waste materials such as fly or bottom ash [2,3,4,5,6,7,8,9,10,11,12], waste glass [13,14,15,16], waste calcite [17], etc. Húlan et al. [7] determined that a higher Young’s modulus was reached after sintering with a lower amount of fly ash. The Young’s modulus and the flexural strength decreased linearly with the amount of fly ash. Hasan et al. [14] observed an increase in the compressive strength and a decrease in water absorption of the samples with the addition of waste glass. They also found that the partial replacement of natural clay in a brick with waste soda-lime glass made the brick production sustainable and eco-friendly. Kováč et al. [17] showed that a high content of waste calcite may double the energy consumption during the creation of anorthite at a temperature of 950 °C and also that the waste calcite had a slight positive effect on the final contraction of samples.
In this study, kaolin and natural zeolite were used for the preparation of blends. Kaolin is the most commonly used material in the ceramic and paper industries, cosmetics, medicine, etc. It mainly consists of mineral kaolinite (Si2Al2O5(OH)4) with about 80 mass%, depending on its origin and type [18]. Kaolinite belongs to the group of phyllosilicates and it crystalizes in the triclinic crystal system. Kaolinite has a 1:1 sheet structure composed of tetrahedral [Si2O5]2− sheets and octahedral [Al2(OH)4]2+ sheets. It has a pseudo-hexagonal symmetry with the lattice parameters a = 0.515 nm, b = 0.895 nm, c = 0.740 nm, α = 91.68°, β = 104.87°, and γ = 89.9° [19,20,21]. The distance between layers is 0.72 nm [22]. During heating up to 1100 °C, three important thermal reactions take place in kaolinite. The first is the dehydration, which occurs in the temperature interval from 35 to 250 °C, where physically bound water is removed from the surface of crystals and pores [23]. The second reaction is the dehydroxylation of kaolinite [19,21,24,25,26], where the chemically bound water escapes from its structure and kaolinite is transformed into a new phase, metakaolinite. It may be described by the following equation:
Al2O3 ⋅ 2SiO2 ⋅ 2H2O → Al2O3 ⋅ 2SiO2 + 2H2O(g).
This reaction takes place in the temperature interval from 450 to 700 °C. Metakaolinite (Al2Si2O7) has a similar structure to kaolinite, but the lattice parameter c is changed to 0.685 nm (it is smaller by about 0.055 nm). The structure of metakaolinite does not contain OH− ions, and the distance between the layers is shorter than in kaolinite. In addition, metakaolinite is more defective and less stable than kaolinite [24,25,27]. The third and last process begins above 925 °C and is connected with the transformation of metakaolinite to an Al-Si spinel, γ–Al2O3, and amorphous SiO2, according to the following equation [28,29]:
2(Al2O3 ⋅ 2SiO2) → 2Al2O3 ⋅ 3SiO2 + SiO2(amorphous).
Moreover, above the temperature of 700 °C, solid-state sintering occurs, which is a high-temperature technological process that transforms individual ceramic particles into a compact polycrystalline body. For traditional, kaolin-based ceramics (earthenware, stoneware or pottery), solid-state sintering occurs when the powder compact is densified entirely in the solid state [24,25,30,31].
Zeolites are microporous, hydrated crystalline aluminosilicates which are porous and widely used due to their structure and absorption properties. Many studies deal with natural or synthetic zeolites [32,33,34,35,36,37,38,39,40,41]. Usually, zeolites contain alkaline metals or metals of alkaline earth and frequently (e.g., in the case of clinoptilolite) crystallize in a monoclinic crystal system [32]. The three-dimensional structure of zeolites consists of tetrahedral silicate and aluminum, which are interconnected by oxygen atoms. The charge of their structure is negative and this charge can balance between monovalent and divalent cations [33,34]. Zeolites are porous and they are widely used due to their absorption properties (for example, in agriculture, ecology, the rubber industry, the building industry, households, and medicine [35,36,37,38]). Several important processes occur in zeolites during heating. Above the temperature of 100 °C, physically bound water escapes from the crystal surface and pores (capillaries) [39]. During heating up to 900 °C, the infrared spectral features attributed to the Si (Al)-O stretching and bending vibration modes do not show significant differences from the features for unheated (raw) zeolite. These spectral results are consistent with the fact that the three-dimensionally rigid crystal structure of zeolite is more stable than the layer structure of phyllosilicates [40]. Above the temperature of 1000 °C, the structure of zeolite is definitely destroyed and an amorphous phase is formed [21,33,41].
Our previous study [42] concerned the thermal expansion and Young’s modulus of samples made from kaolin and zeolite. The samples were not studied in-situ; instead, they were preheated at different temperatures from room temperature up to 1100 °C, and selected properties were measured after cooling at room temperature. The next study [43] focused on comparing the thermal expansion of the kaolin–zeolite and illite–zeolite samples. Our previous paper [39] aimed at conducting a thermogravimetric analysis and differential scanning calorimetry of a kaolin–zeolite sample. The aim of this paper was to estimate the influence of natural zeolite in the kaolin–zeolite samples on their thermophysical properties, such as the thermal expansion, thermal diffusivity and conductivity, and specific heat capacity, during heating up to 1100 °C and to determine the possible usage of natural zeolite in ceramic materials.
2. Materials and Methods
Samples were prepared from Sedlec kaolin (Czech Republic) and natural zeolite (Nižný Hrabovec, Slovakia). The major mineral in Sedlec kaolin is kaolinite (77.8%). In addition, there are impurities such as mica clay (17.4%) and quartz (1.5%) [44]. Natural zeolite mainly contains mineral clinoptilolite (58.2%) from the group of heulandite and has impurities such as cristobalite (12.2%), illite with mica and feldspar (albite) (9.6%), quartz (0.7%), and also amorphous phase (19.3%) [45]. The chemical compositions of the Sedlec kaolin and natural zeolite are given in Table 1.
The samples were prepared as follows. Kaolin was partially replaced with natural zeolite in the amounts of 10, 20, 30, 40, and 50 mass%. Pure kaolin and zeolite samples were also prepared. The studied samples were labeled as KZ10, KZ20, KZ30, KZ40, and KZ50, according to the natural zeolite content, whereas the pure kaolin and zeolite samples were labeled as SLA and ZEO (see Table 2). The kaolin pellets were crushed and milled to pass a 100-μm sieve. Zeolite was used as a powder, passing a 50-μm sieve. After these procedures, the powders were mixed with deionized water to obtain a plastic mass. Cylindrical samples with a diameter of 14 mm were extruded from this mass. Then, the samples were dried in open air until an equilibrium of moisture was reached (from 1.4 to 2.9 mass% of the physically bound water). The dry samples were cut to the lengths needed for the analyses.
Differential thermal analysis (DTA) and thermogravimetry (TG) of the compact samples (∅14 × 16 mm) with a mass of 3.5 g were performed by means of a Derivatograph 1000 analyzer (MOM Budapest, Budapest, Hungary) [46], in which a pressed alumina reference sample with similar dimensions to the studied sample was used. Thermodilatometry (TDA) was carried out using a horizontal pushrod alumina dilatometer [47] on samples with dimensions of ∅14 × 35 mm. All measurements were performed in the temperature interval from 30 to 1100 °C in static air atmosphere at a heating rate of 5 °C·min−1.
Differential scanning calorimetry (DSC) was performed on a Netzsch DSC 404 F3 Pegasus apparatus (NETZSCH Holding, Selb, Germany) in dynamic argon atmosphere with a flow rate of 40 ml/min. Al2O3 crucibles with a lid and powder samples with mass of ~30 mg were used. The temperature increased linearly with the heating rate of 5 °C/min and in the temperature interval from 30 up to 1100 °C. In order to determine the enthalpy of reactions, a baseline of the tangential type was selected.
The bulk density was calculated from thermogravimetric and thermodilatometric results to obtain its actual values during firing, according to the following equation:
where ρ0 is the bulk density of green samples at room temperature.
The open porosity was calculated with the help of the experimentally determined bulk density and matrix density. The bulk density was obtained from the volume and mass of the cylindrical samples. The matrix density was measured by means of helium pycnometry (Pycnomatic ATC, Thermo Fisher Scientific, Waltham, MA USA).
Measurements of the thermal diffusivity (a), thermal conductivity (λ), and specific heat capacity (cp) of samples were performed by means of the flash method using a Netzsch LFA 427 LaserFlash apparatus (NETZSCH Holding, Selb, Germany) in the temperature interval from 30 to 1000 °C at a heating rate of 5 °C/min and in nitrogen atmosphere with a flow rate of 100 mL/min. The dimensions of samples were ∅12.5 × 2.5 mm. The samples were covered by graphite on both sides before measurements. Measuring the heat capacity of a sample required an additional measurement of a reference material with a known heat capacity and density. The basis of this method is in the application of a laser pulse with the same parameters as the measured and reference samples. In this way, the same amount of heat is provided to both samples. Next, the limit of adiabatic temperature is calculated for both measurements. The specific heat capacity of measured sample is calculated according to the formula:
where mR is the mass of the reference sample (in software, the mass of a sample is calculated from its bulk density and dimensions), cpR is the heat capacity of the reference sample, ΔT∞R is the adiabatic temperature of the reference sample after the amount of thermal energy is received, m is the mass of the studied sample, and ΔT∞ is the adiabatic temperature of the studied sample after the same amount of thermal energy as for reference sample is received.
Microstructure observations were carried out by means of a scanning electron microscope (FEI QuantaTM FX200, Thermo Fisher Scientific, Waltham, MA, USA) in low vacuum mode (100 Pa) with an accelerating voltage of 10 kV on the compact polished raw samples, and the samples were heated at 1100 °C.
3. Results and Discussion
3.1. Differential Thermal Analysis
The DTA results of the studied samples are shown in Figure 1. Three significant peaks are visible. The first peak (up to 300 °C) corresponds to the process of dehydration, where the liberation of physically bound water from pores and surface of crystals occurs [23]. This peak is endothermic and its magnitude increases with the amount of zeolite. The second peak (from 450 to 700 °C) is also endothermic and belongs to the dehydroxylation of kaolinite [19,48]. During this reaction, the chemically bound water is evaporated, and this causes the structure of kaolinite to transform into metakaolinite. The last peak (from 940 to 1030 °C) is exothermic and has been interpreted as the result of the formation of an Al-Si spinel or of spinel and/or mullite by [28] and by many papers extensively discussed in [31]. The magnitudes of last two peaks decrease with the amount of zeolite in the samples. In natural zeolite, only one reaction is observed and it is endothermic (up to 450 °C). This peak corresponds to dehydration, where the physically bound water evaporates from pores and surface of crystals [21].
3.2. Differential Scanning Calorimetry
The DSC results of the kaolin–zeolite samples are shown in Figure 2. Three peaks can be observed, as it was in the DTA results (see Figure 1). The first endothermic peak (from 30 to 200 °C) represents the liberation of physically bound water [23]. The second endothermic peak (from 400 to 600 °C) corresponds to the dehydroxylation of kaolinite [19,48]. The third peak (from 950 to 1000 °C), which is exothermic, is related to the crystallization of high-temperature phases, as indicated before [28,31]. In zeolite and natural clinoptilolite, only two peaks are observed in the curve. The first is the endothermic peak corresponding with dehydration. This means that physically bound water evaporates from the pores and surface of crystals. The second peak is also endothermic, and this reaction begins above 850 °C, when the structure of clinoptilolite is definitely destroyed and an amorphous phase is formed [33,41].
The influence of zeolite in the samples is visible on the enthalpy of reactions (dehydroxylation of kaolinite and Al-Si spinel formation) occurring in the kaolin–zeolite samples during thermal treatment (see Figure 3). The enthalpies were determined from the DSC results (peaks) (see Figure 2). A tangential baseline, which most realistically represents the progress of reactions, was used. The first studied reaction was the dehydroxylation of kaolinite, which is associated with the evaporation of chemically bound water [19,48]. The enthalpy of this reaction decreases linearly with the amount of zeolite in the samples from 248.9 (sample SLA) to 128.1 J/g (sample KZ50). The second reaction was the transformation of metakaolinite into an Al-Si spinel [28]. The values of enthalpy also decrease linearly with the zeolite content, from 58.8 (sample SLA) to 34.4 J/g (sample KZ50).
As can be seen from the enthalpy results for both reactions, the enthalpies decrease along with the amount of kaolinite. Therefore, it can be concluded that zeolite has no significant influence on both reactions in the studied samples.
3.3. Thermogravimetric Analysis
The relative mass changes of the kaolin–zeolite samples are shown in Figure 4. Two significant mass losses occur. The first loss is in the temperature interval from 30 to 250 °C and corresponds to the process of dehydration, during which physically bound water evaporates [23]. The process of dehydration is the least significant for sample SLA (1.56%) and increases with the amount of zeolite (3.98% for sample KZ50). The second mass loss, in the temperature interval from 450 to 700 °C, corresponds to the dehydroxylation of kaolinite [19,48]. The mass loss for sample SLA is 11.35% and it decreases with the amount of zeolite (6.12% for sample KZ50). The mass loss of the zeolite sample decreases continuously up to 800 °C and reaches 11.27%. Then, the mass loss remains almost constant. During the dehydroxylation, the mass loss is only 0.98%. This is because the dehydroxylation does not occur in zeolite. The reason is that zeolite does not have OH− ions in the matrix structure. The DTA, DSC, and TG results of kaolin and natural zeolite are very similar to the results presented in [21,26,49]. In these studies, the mass losses of the kaolinite subgroup and clinoptilolite are in good agreement with our results. For kaolinite, it is in the interval from 11.8% to 13.31% (we obtained 11.35%, but the kaolinite content in kaolin was only 77.8%), and for clinoptilolite, it is 9.54% at 1000 °C (we achieved 11.27%). The obtained difference can be explained by a different content of water in the prepared sample from kaolin or natural zeolite. Moreover, the studied zeolite was not pure clinoptilolite as it also contained the amount of cristobalite, illite with mica, and feldspar.
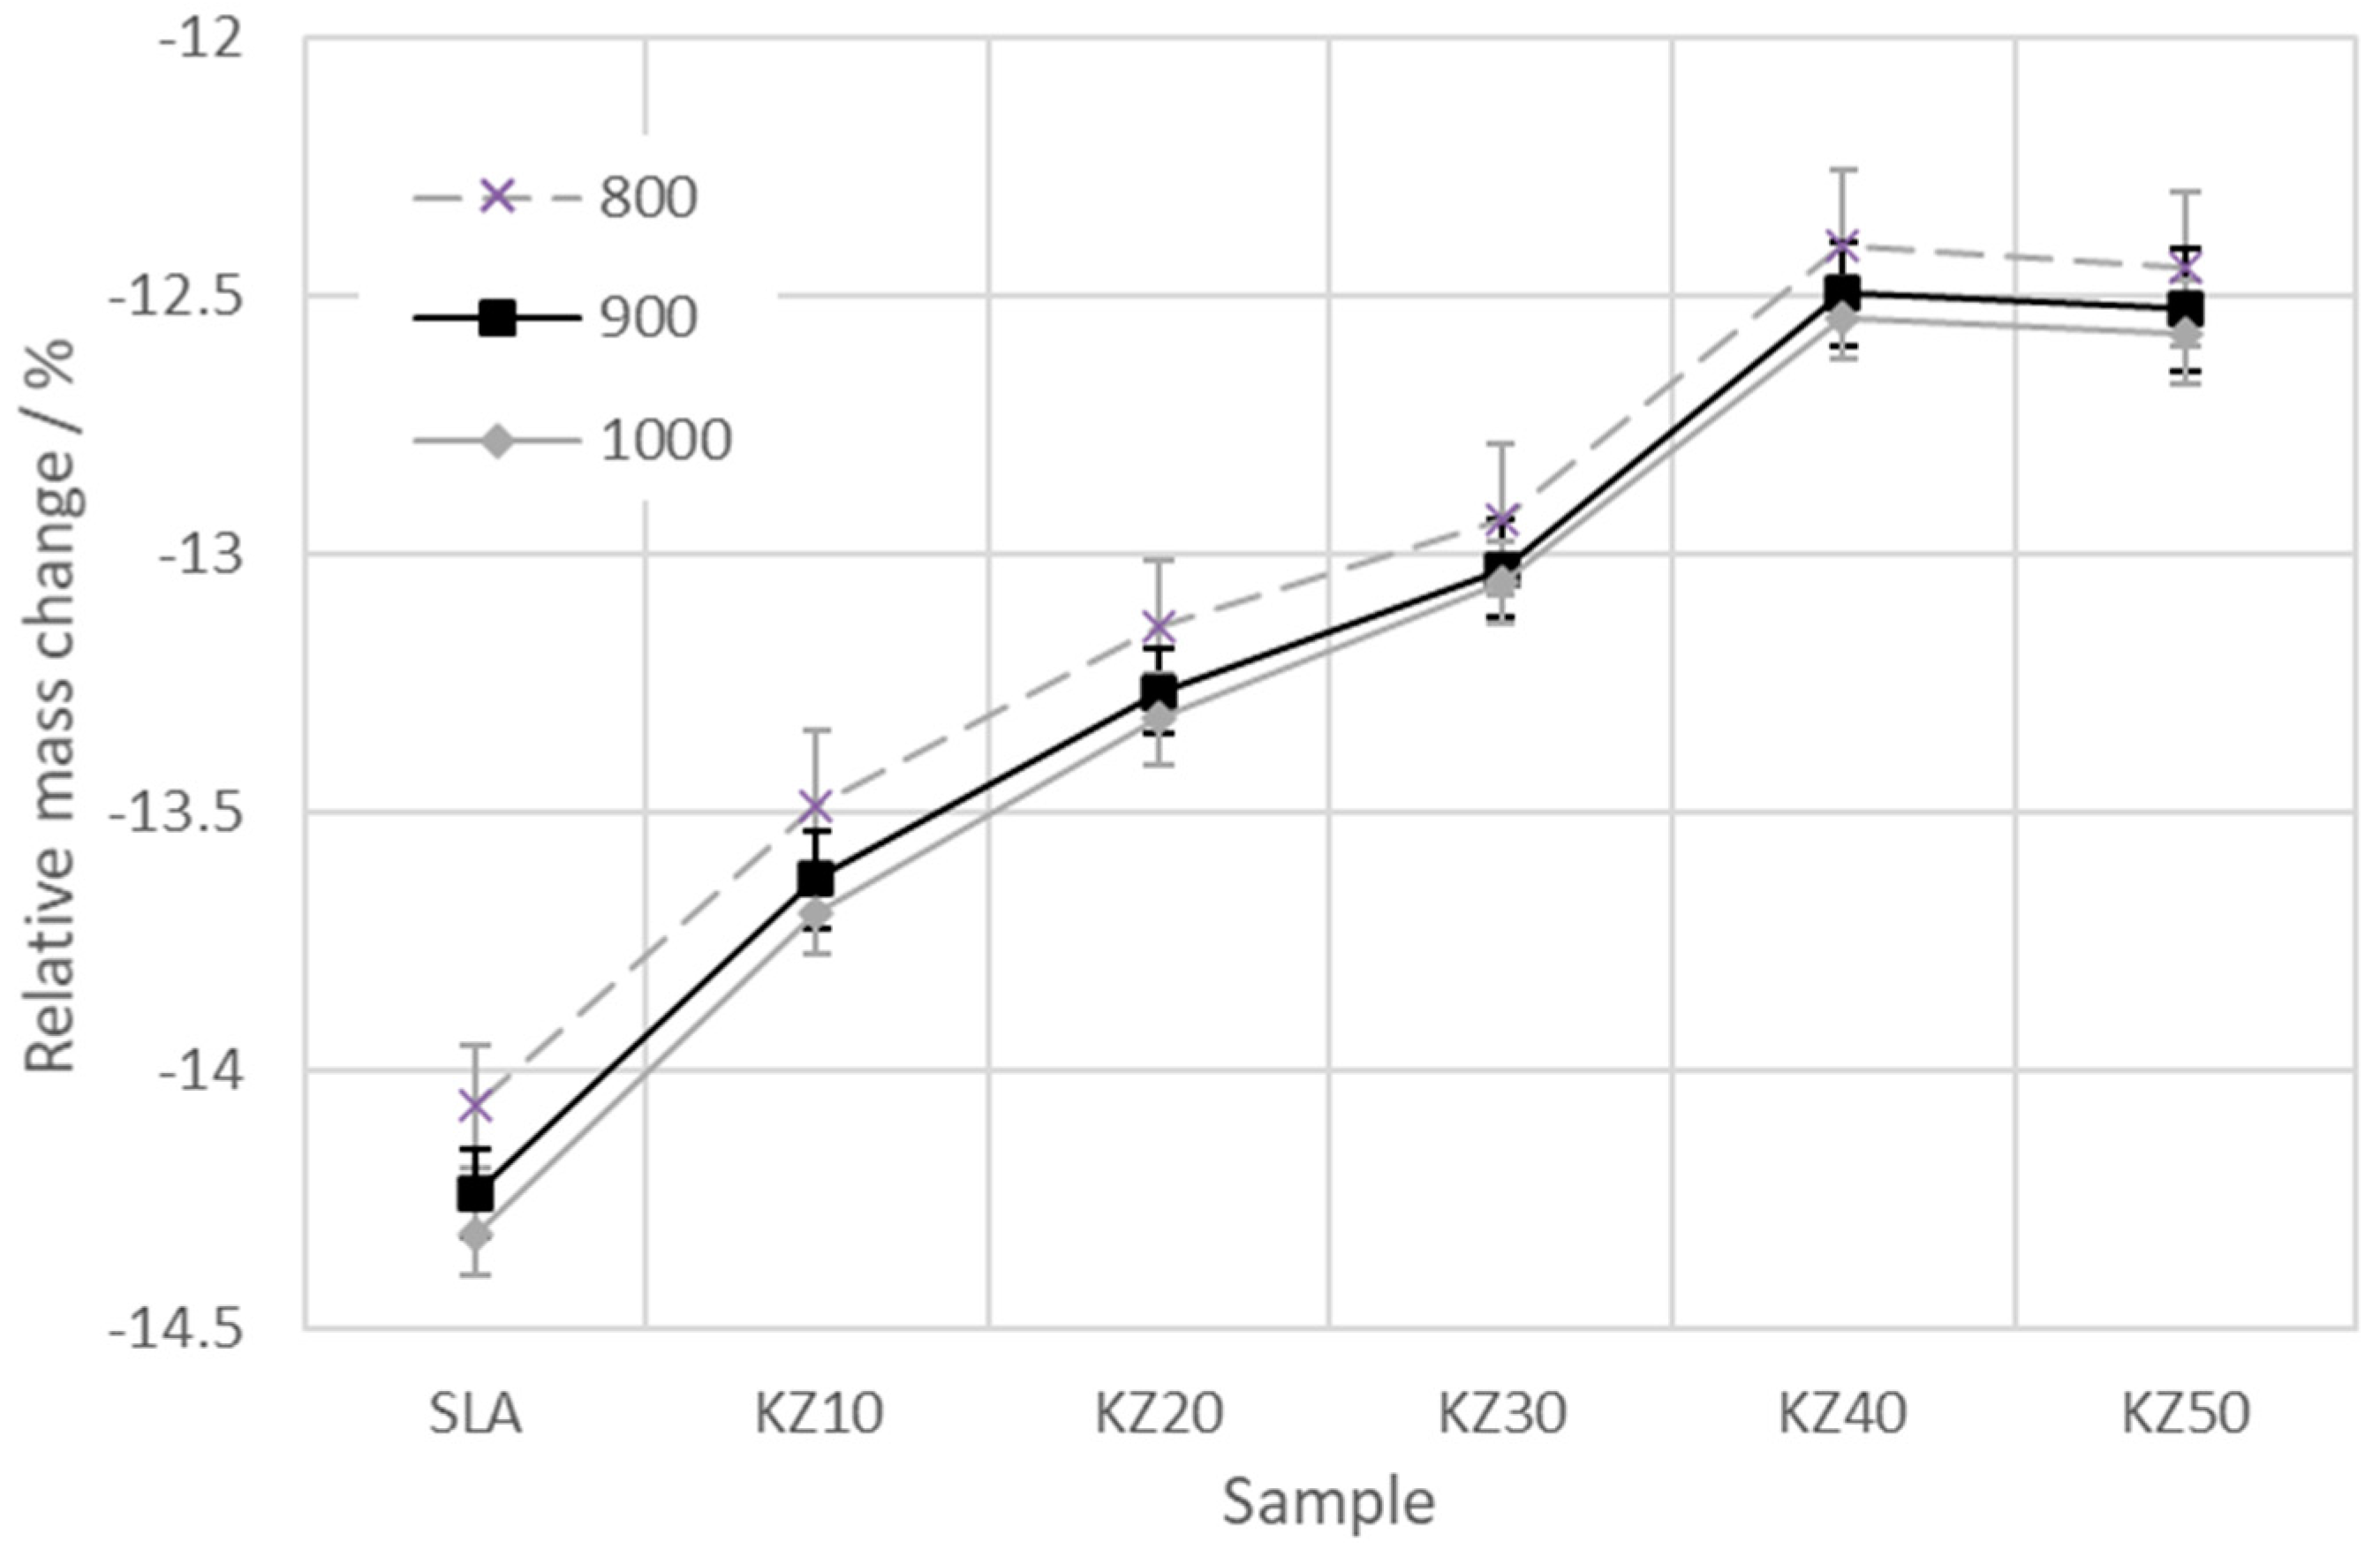
The results of the relative mass change of the kaolin–zeolite samples at temperatures of 800, 900, and 1000 °C are plotted in Figure 5. It is visible that the mass loss of the samples increases with temperature and decreases with the amount of zeolite. At a temperature of 1000 °C, it ranges from 14.3% to 12.6%. The trend of decrease is identical for all three selected temperatures and it is almost linear up to 40 mass% of zeolite. Then, the mass loss for samples KZ40 and KZ50 is comparable (the difference is only 0.04%).
3.4. Thermodilatometric Analysis
The relative thermal expansion of the kaolin–zeolite samples is shown in Figure 6. In the temperature interval from 30 to 250 °C, the process of dehydration occurs, where physically bound water escapes from the pores and surface of crystals. The length of all samples, except the zeolite sample, increases linearly and reaches about 0.07%. The length of the zeolite sample decreases and its shrinkage is about 0.14%. The expansion of samples decreases with the amount of zeolite. The next process occurring in the studied samples starts at about 500 °C, when the chemically bound water escapes and the structure of kaolinite is transformed into metakaolinite [19,48]. The structure of metakaolinite is similar to the structure of kaolinite. The lattice parameters a and b remain the same, but the parameter c is changed to 0.685 nm. The distance between layers is shorter (about 0.055 nm) than in kaolinite. In addition, it is more defective and less stable than kaolinite [19]. Therefore, the shrinkage of samples in the temperature interval from 500 to 700 °C is observed. Nevertheless, after the dehydroxylation is finished, the contraction continues up to 950 °C due to the sintering process [30]. As a result of the reactions above ~950 °C, there is a rapid contraction of the produced bodies. In the temperature interval from 700 to 1100 °C, the sintering process occurs as well. Therefore, this shrinkage is caused by both processes. The total shrinkage of the kaolin–zeolite products increases with the amount of zeolite from 2.59% for sample SLA to 3.91% for sample KZ50. Similar behavior of thermal expansion of kaolin samples was also obtained in [50,51]. The shrinkage of kaolin samples reached 2.5% and 3.2% at 1100 °C, respectively, which is in good agreement with our results.
Different results were obtained for the zeolite sample because the structure of zeolite does not contain free OH− ions (zeolite is just a hydrate). The liberation of the physically bound water from the zeolite sample proceeds until up to 850 °C (the shrinkage reaches 1.82%). Above the temperature of 850 °C, very intensive sintering and the formation of a glassy phase occur. The total shrinkage of the zeolite sample at 1100 °C reaches 14.59%. Dell’Agli et al. [52] also studied the thermal expansion and mass loss of different types of clinoptilolite, but only up to 700 °C. They found out that the final shrinkage was in the interval from 0.6% to 3%. The shrinkage of our zeolite sample reached 1.2% at 700 °C. Nevertheless, the trend of the measured curves is similar.
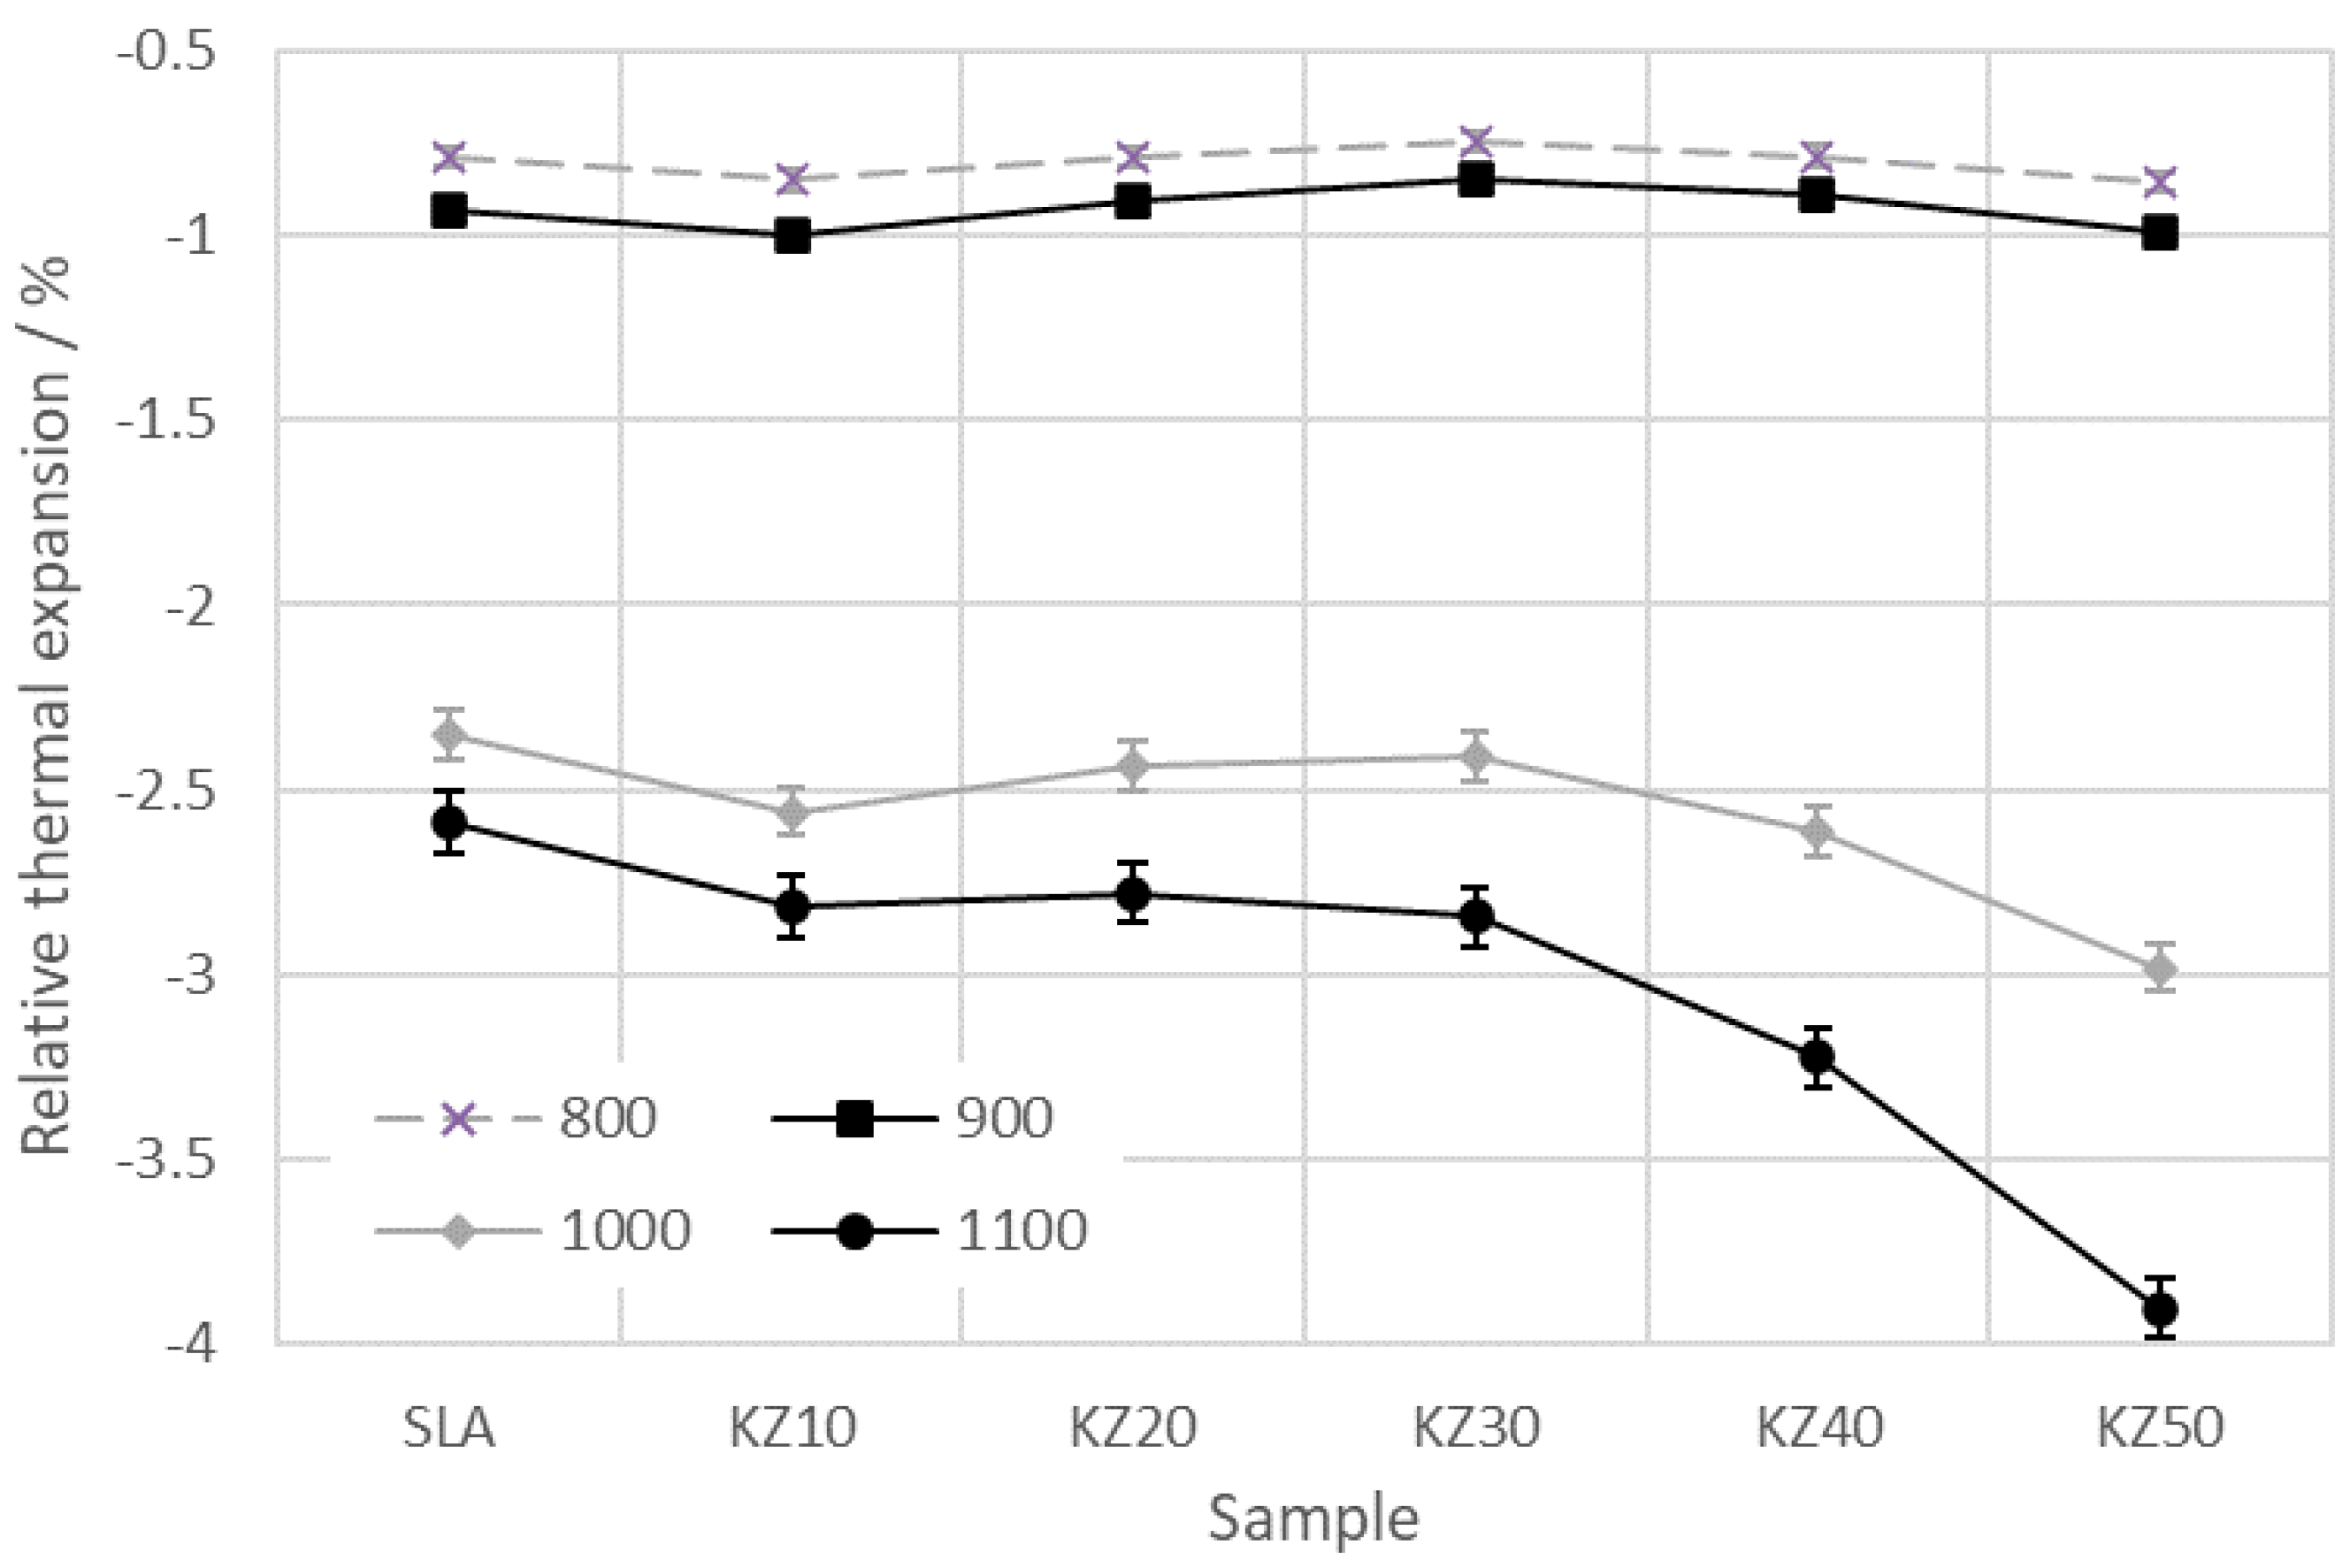
The linear shrinkage of the kaolin–zeolite samples at different temperatures is shown in Figure 7. The results show that the linear shrinkage at temperatures of 800 and 900 °C with the increasing amount of zeolite is almost constant (the differences are very small, about 0.15%). The curves at the temperatures of 1000 and 1100 °C exhibit a different trend. The shrinkage increases with the amount of zeolite, but the samples with 10, 20, and 30 mass% of zeolite reach almost the same values of shrinkage. Above 30 mass% of zeolite, the linear shrinkage increases. Those results show that the most intensive changes occur when the Al-Si spinel crystallization is finished and the sintering process starts.
3.5. Bulk Density
The results of the bulk density of the kaolin–zeolite samples are shown in Figure 8. The bulk density decreases with the amount of zeolite and also with the temperature increase to 650 °C. The bulk density for the green SLA sample is 1464 kg·m−3, and for the green KZ50 sample, it amounts to 1340 kg·m−3. The first significant decrease is up to 250 °C, which is caused by the liberation of physically bound water [23]. Then, the bulk density decreases almost linearly until the dehydroxylation of kaolinite starts (at about 500 °C) [19,48]. The structural changes (transformation of kaolinite into metakaolinite) cause the decrease in the bulk density. This decrease occurs due to an intensive mass loss (11.35% for sample SLA) (see Figure 4) and contraction (0.68% for sample SLA) (see Figure 6). During dehydroxylation, the bulk density decreases from 135 kg·m−3 for sample SLA to 50 kg·m−3 for sample KZ50. After dehydroxylation, the bulk density slightly increases for all studied samples up to 950 °C. Then, a sharp increase occurs due to the transformation of metakaolinite into the spinel phase [28]. Above 1000 °C, the bulk density increases only slightly. At 1100 °C, the values of the bulk density are lower than for the green samples. The differences are from 11 kg·m−3 for sample KZ50 up to 106 kg·m−3 for sample SLA, which means that the difference decreases with the zeolite content.
The bulk density of the zeolite sample decreases up to 550 °C, then a slight increase occurs, and above 900 °C, a sharp increase is visible. Finally, the bulk density reaches 1760 kg·m−3 at 1100 °C, which is about 42% higher than for the green sample.
The bulk density of kaolin–zeolite samples at different temperatures is shown in Figure 9. The results show that the bulk density at temperatures of 800 and 900 °C decreases with the amount of zeolite. The differences between the SLA and KZ50 samples are about 40 kg·m−3 at 800 °C and about 60 kg·m−3 at 900 °C. The values of the bulk density at the temperatures of 1000 and 1100 °C also decrease, almost linearly in this case, except for sample KZ10. Those results show that the bulk density decreases with the zeolite content by about 6%.
3.6. Thermal Diffusivity
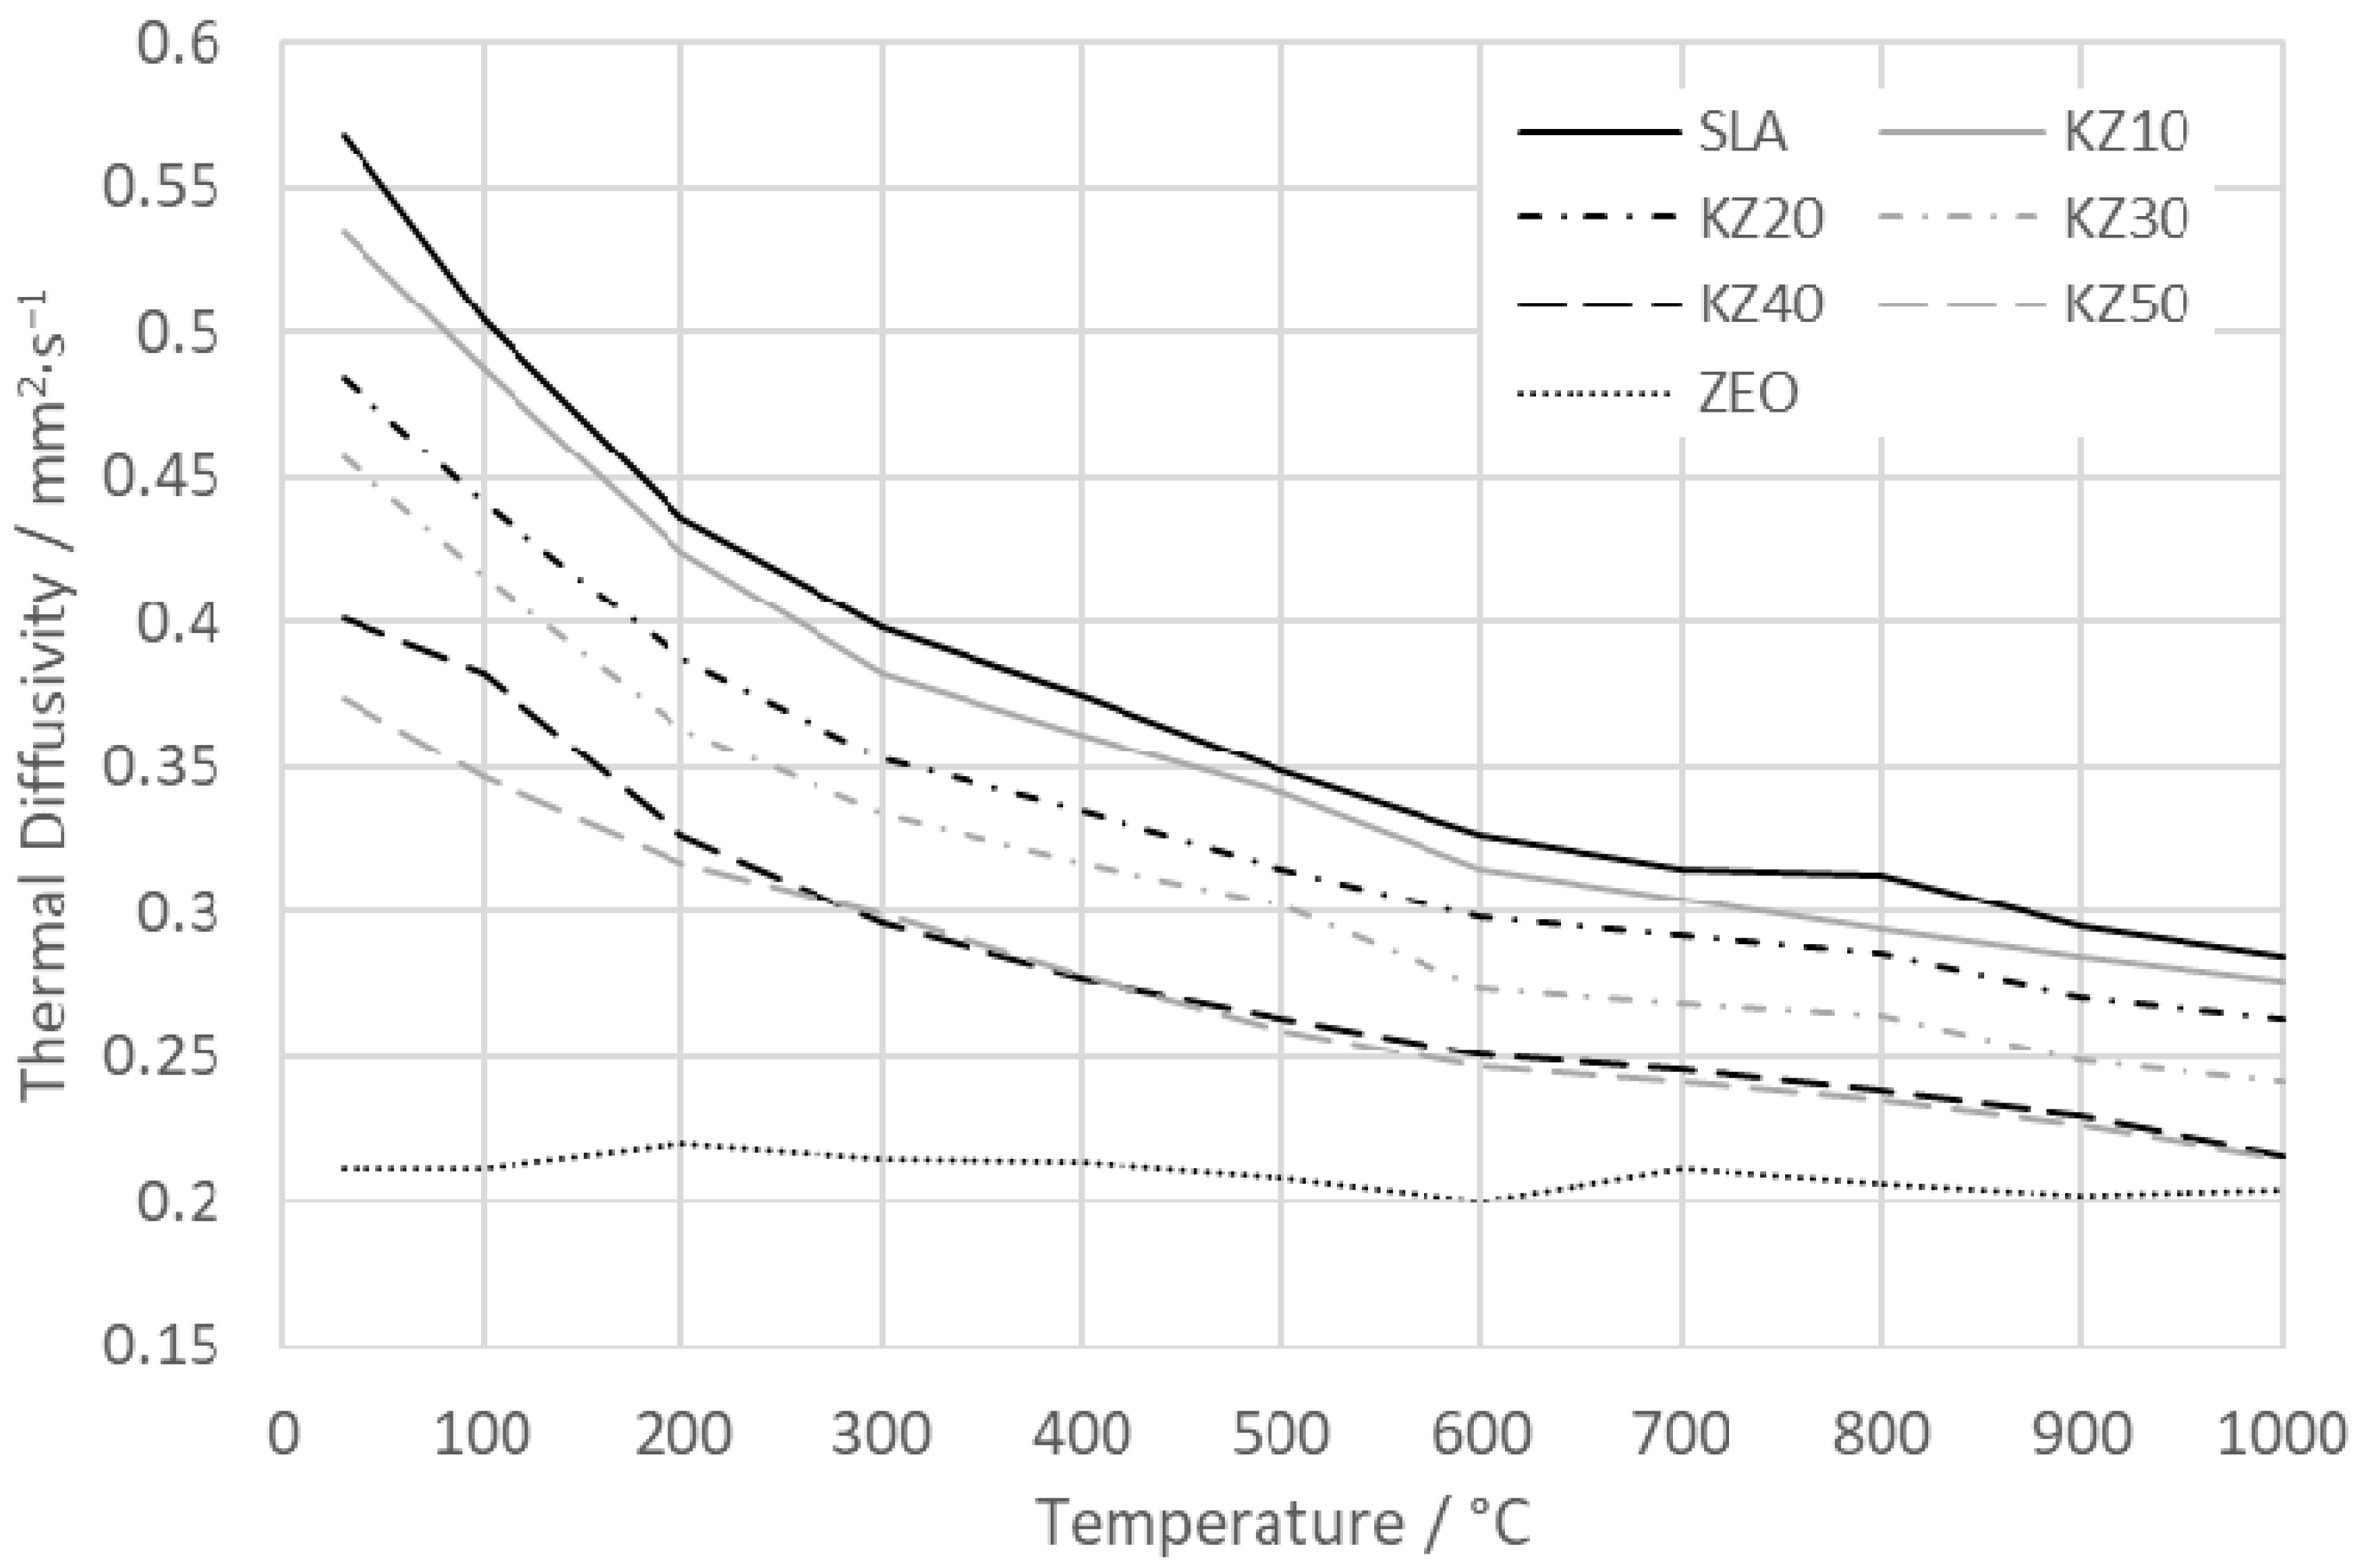
The results of the thermal diffusivity of the kaolin–zeolite samples in the temperature interval from 30 to 1000 °C are plotted in Figure 10. The thermal diffusivity of the green samples decreases with the amount of zeolite from 0.57 mm2∙s−1 for sample SLA to 0.37 mm2∙s−1 for sample KZ50. The green zeolite sample has a thermal diffusivity of only 0.21 mm2∙s−1. The thermal diffusivity of all studied samples decreases with temperature, except for the zeolite sample. The thermal diffusivity of the zeolite sample is almost the same in the whole temperature range (0.21 mm2∙s−1). The decrease in thermal diffusivity is caused by the escape of physically and chemically bound water in the samples (dehydration and dehydroxylation) [19,23,48]. The differences in thermal diffusivity between samples also decrease with temperature. They are 0.20 mm2∙s−1 for the green samples at room temperature and 0.07 mm2∙s−1 for the samples measured at 1000 °C. A similar decreasing trend of the thermal diffusivity of clays was obtained in [17,49]. The values were from 0.17 to 0.27 mm2∙s−1. A more interesting study was published by Antal et al. [49], where the thermal diffusivity of textured kaolin samples was assessed. It is visible that the thermal diffusivity of kaolin samples depends significantly on the direction of crystal orientation. The results showed that thermal diffusivity is in the interval from 0.2 to 0.75 mm2∙s−1 measured at room temperature and from 0.15 to 0.4 mm2∙s−1 at the temperature of 1100 °C.
The thermal diffusivity of the kaolin–zeolite samples at different temperatures is shown in Figure 11. The thermal diffusivity decreases with the amount of zeolite up to 40 mass%. Sample KZ50 has almost the same value of thermal diffusivity as sample KZ40. All three curves (the results at 800, 900, and 1000 °C) exhibit the same trend. At a temperature of 1000 °C, samples KZ40 and KZ50 have values of thermal diffusivity similar to the zeolite sample. The difference is only 0.01 mm2∙s−1.
3.7. Specific Heat Capacity
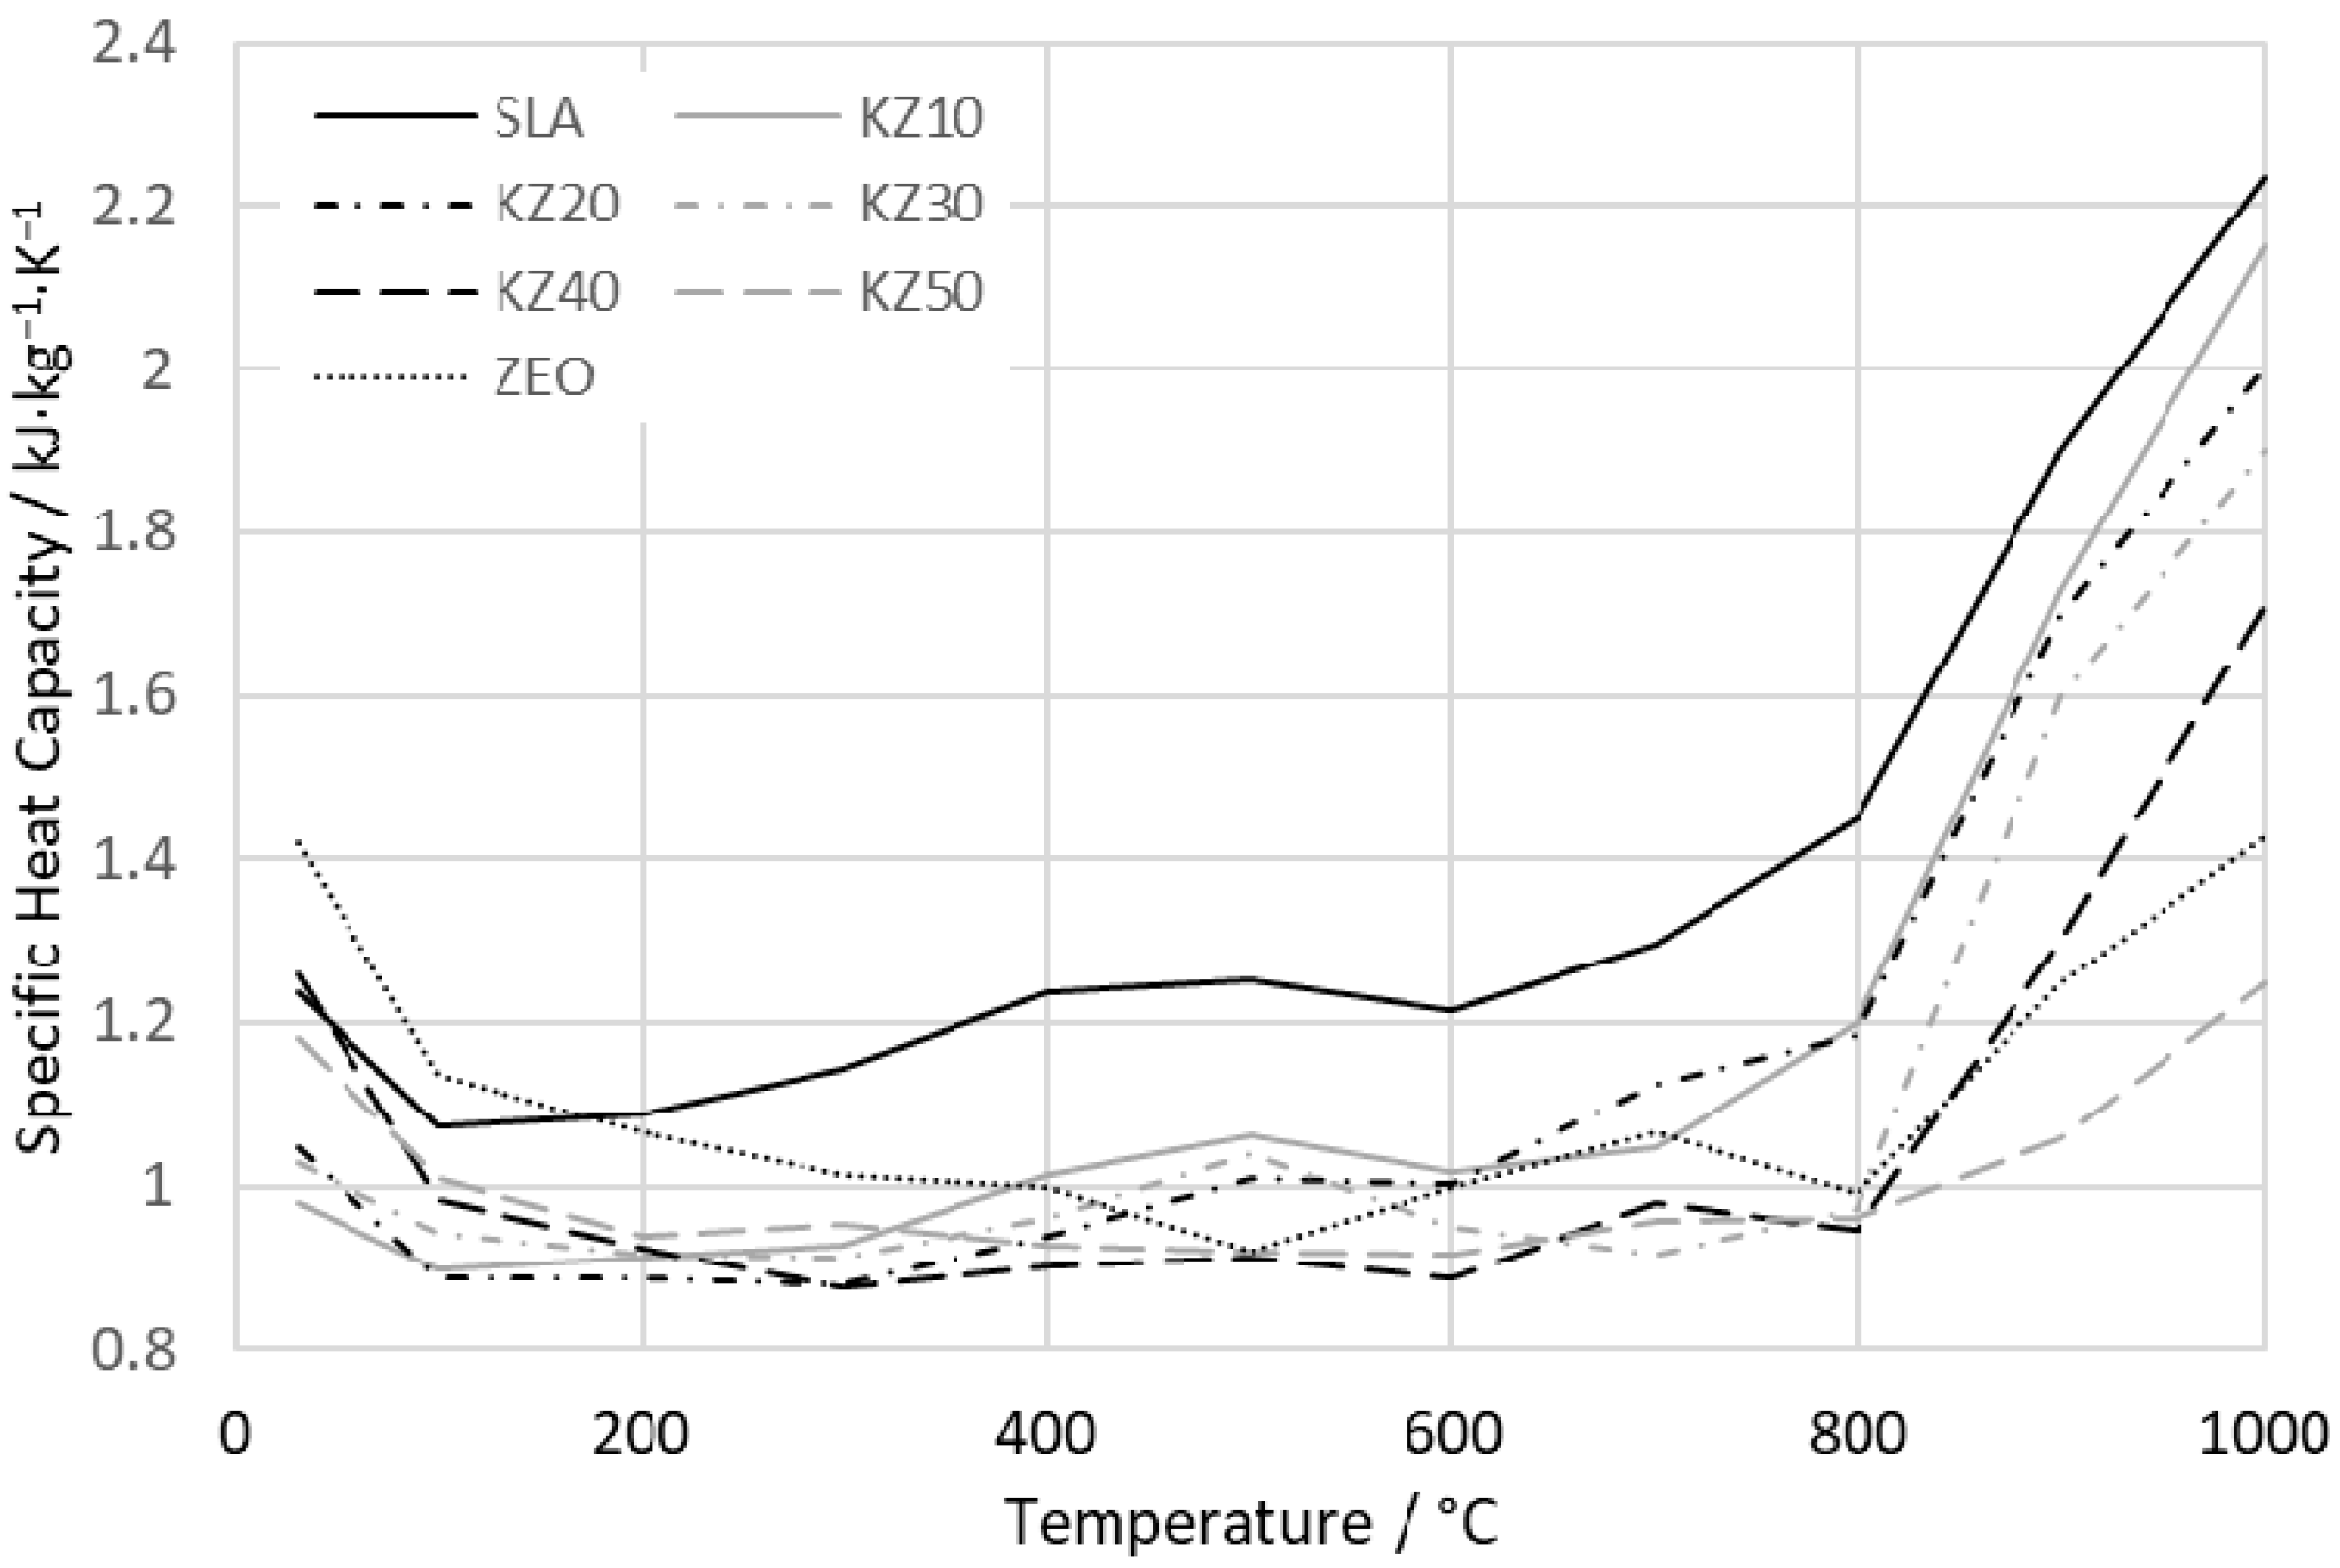
The results of the specific heat capacity of the kaolin–zeolite samples during thermal treatment up to 1000 °C are shown in Figure 12. The heat capacity of the green samples is in the interval from 1.02 to 1.42 kJ∙kg−1∙K−1. The values of the heat capacity for all samples decrease when the liberation of physically bound water is finished. The heat capacity of water is 4.2 kJ∙kg−1∙K−1 (much higher than for solid materials); therefore, its decrease was expected in the temperature interval up to 300 °C. Then, the specific heat capacity of samples slightly increases up to 800 °C. The values are in the interval from 0.88 to 1.45 kJ∙kg−1∙K−1. The dehydroxylation of kaolinite also influences the heat capacity of samples. The OH− groups are removed from the structure of kaolinite, and therefore, the heat capacity does not increase, as it is excepted from the Debye model. Above 800 °C, a sharp increase in the heat capacity occurs due to crystallization of spinel [28] and a normal characterization of the heat capacity at higher temperatures. At a temperature of 1000 °C, the specific heat capacity of the samples ranges from 1.25 up to 2.24 kJ∙kg−1∙K−1, which is about 50% higher than it was for the green samples. Michot et al. [53] studied the heat capacity and thermal conductivity of kaolinite/metakaolinite in the temperature interval from room temperature up to 1000 °C. Their results showed that the heat capacity of metakaolinite above the temperature of 700 °C is about 1.2 kJ∙kg−1∙K−1, which is lower than our values. This can be explained by a different content of kaolinite in our kaolin sample and the application of a method which is not accurate for measurement of heat capacity.
The specific heat capacity of the kaolin–zeolite samples at temperatures of 800, 900, and 1000 °C is presented in Figure 13. The heat capacities of samples KZ30, KZ40, and KZ50 at 800 °C are almost the same. At temperatures of 900 and 1000 °C, the trend of the heat capacity is similar. Zeolite in the samples causes a decrease iin the specific heat capacity. The difference between samples SLA and KZ50 at 1000 °C is 0.99 kJ∙kg−1∙K−1, which is about 80%.
3.8. Thermal Conductivity
The results of the specific heat capacity of the zeolite–kaolin samples during thermal treatment up to 1000 °C are shown in Figure 14. The thermal conductivity of the green samples (at 30 °C) is the highest for sample SLA (1.03 W∙m−1∙K−1) and the lowest for the zeolite sample (0.37 W∙m−1∙K−1). It decreases with the amount of zeolite. Then, in the temperature interval from 30 to 300 °C, the thermal conductivity of all studied samples decreases due to the liberation of physically bound water from the pores and crystal surfaces (water has a higher thermal conductivity than ceramic materials) [23]. Significant changes are observed in the temperature interval from 400 to 700 °C. This decrease is caused by dehydroxylation of kaolinite [19,48] and it is smaller with higher zeolite content in the samples. At 700 °C, all samples reach the lowest values of thermal conductivity, which range from 0.52 (sample SLA) to 0.25 W∙m−1∙K−1 (the zeolite sample). Above the temperature of 800 °C, a sharp increase in the thermal conductivity occurs due to the sintering process and crystallization of spinel [28]. The final values at 1000 °C are from 0.86 W∙m−1∙K−1 for sample SLA to 0.35 W∙m−1∙K−1 for sample KZ50. The results obtained by Michot et al. [53] showed a thermal conductivity of the green kaolin body of up to 0.5 W∙m−1∙K−1, which is in good agreement with the value of 0.52 W∙m−1∙K−1 obtained in this study. On the other hand, our values of thermal conductivity were not measured but calculated from density, heat capacity, and thermal diffusivity. The surface of samples was coated by graphite before the analysis, and above 800 °C, graphite could burn out, although the analysis was performed in nitrogen atmosphere. Therefore, greater uncertainties are expected.
The thermal conductivity of the kaolin–zeolite samples at temperatures of 800, 900, and 1000 °C is shown in Figure 15. At a temperature of 800 °C, thermal conductivity has a decreasing trend up to 40 mass% of zeolite. Nevertheless, samples KZ40 and KZ50 have similar values of thermal conductivity (the difference is only 0.003 W∙m−1∙K−1). At temperatures of 900 and 1000 °C, thermal conductivity decreases with the amount of zeolite and this decrease is almost linear. The difference between samples SLA and KZ50 at 1000 °C amounts to 0.45 W∙m−1∙K−1, which is about 53%. Typically, values of the thermal conductivity of ceramic materials are in the interval from 0.28 to 1.2 W∙m−1∙K−1 [53]. Therefore, the obtained results of the thermal conductivity are in good agreement with the literature.
3.9. The Open Porosity and Scanning Electron Microscopy
The results of bulk density were also confirmed with the results of the porosity of kaolin–zeolite samples at temperatures of 800, 900, 1000, and 1100 °C (see Figure 16). The porosity of the studied samples decreases and the bulk density increases with temperature. The porosity at 800 and 900 °C decreases when the sample contains 10 mass% of zeolite. Then, the porosity increases and reaches about 50% for samples KZ30, KZ40, and KZ50. The porosity of sample KZ10 at temperatures of 800, 900, and 1000 °C is almost the same. At a temperature of 1100 °C, porosity decreases from 48.5% (sample SLA) down to 43.0% (sample KZ50). The decrease in the porosity with temperature is caused by the sintering process in the samples [30]. This process causes a decrease in the sample volumes and vanishing of pores. The results show that the porosity decreases with the amount of zeolite in the samples.
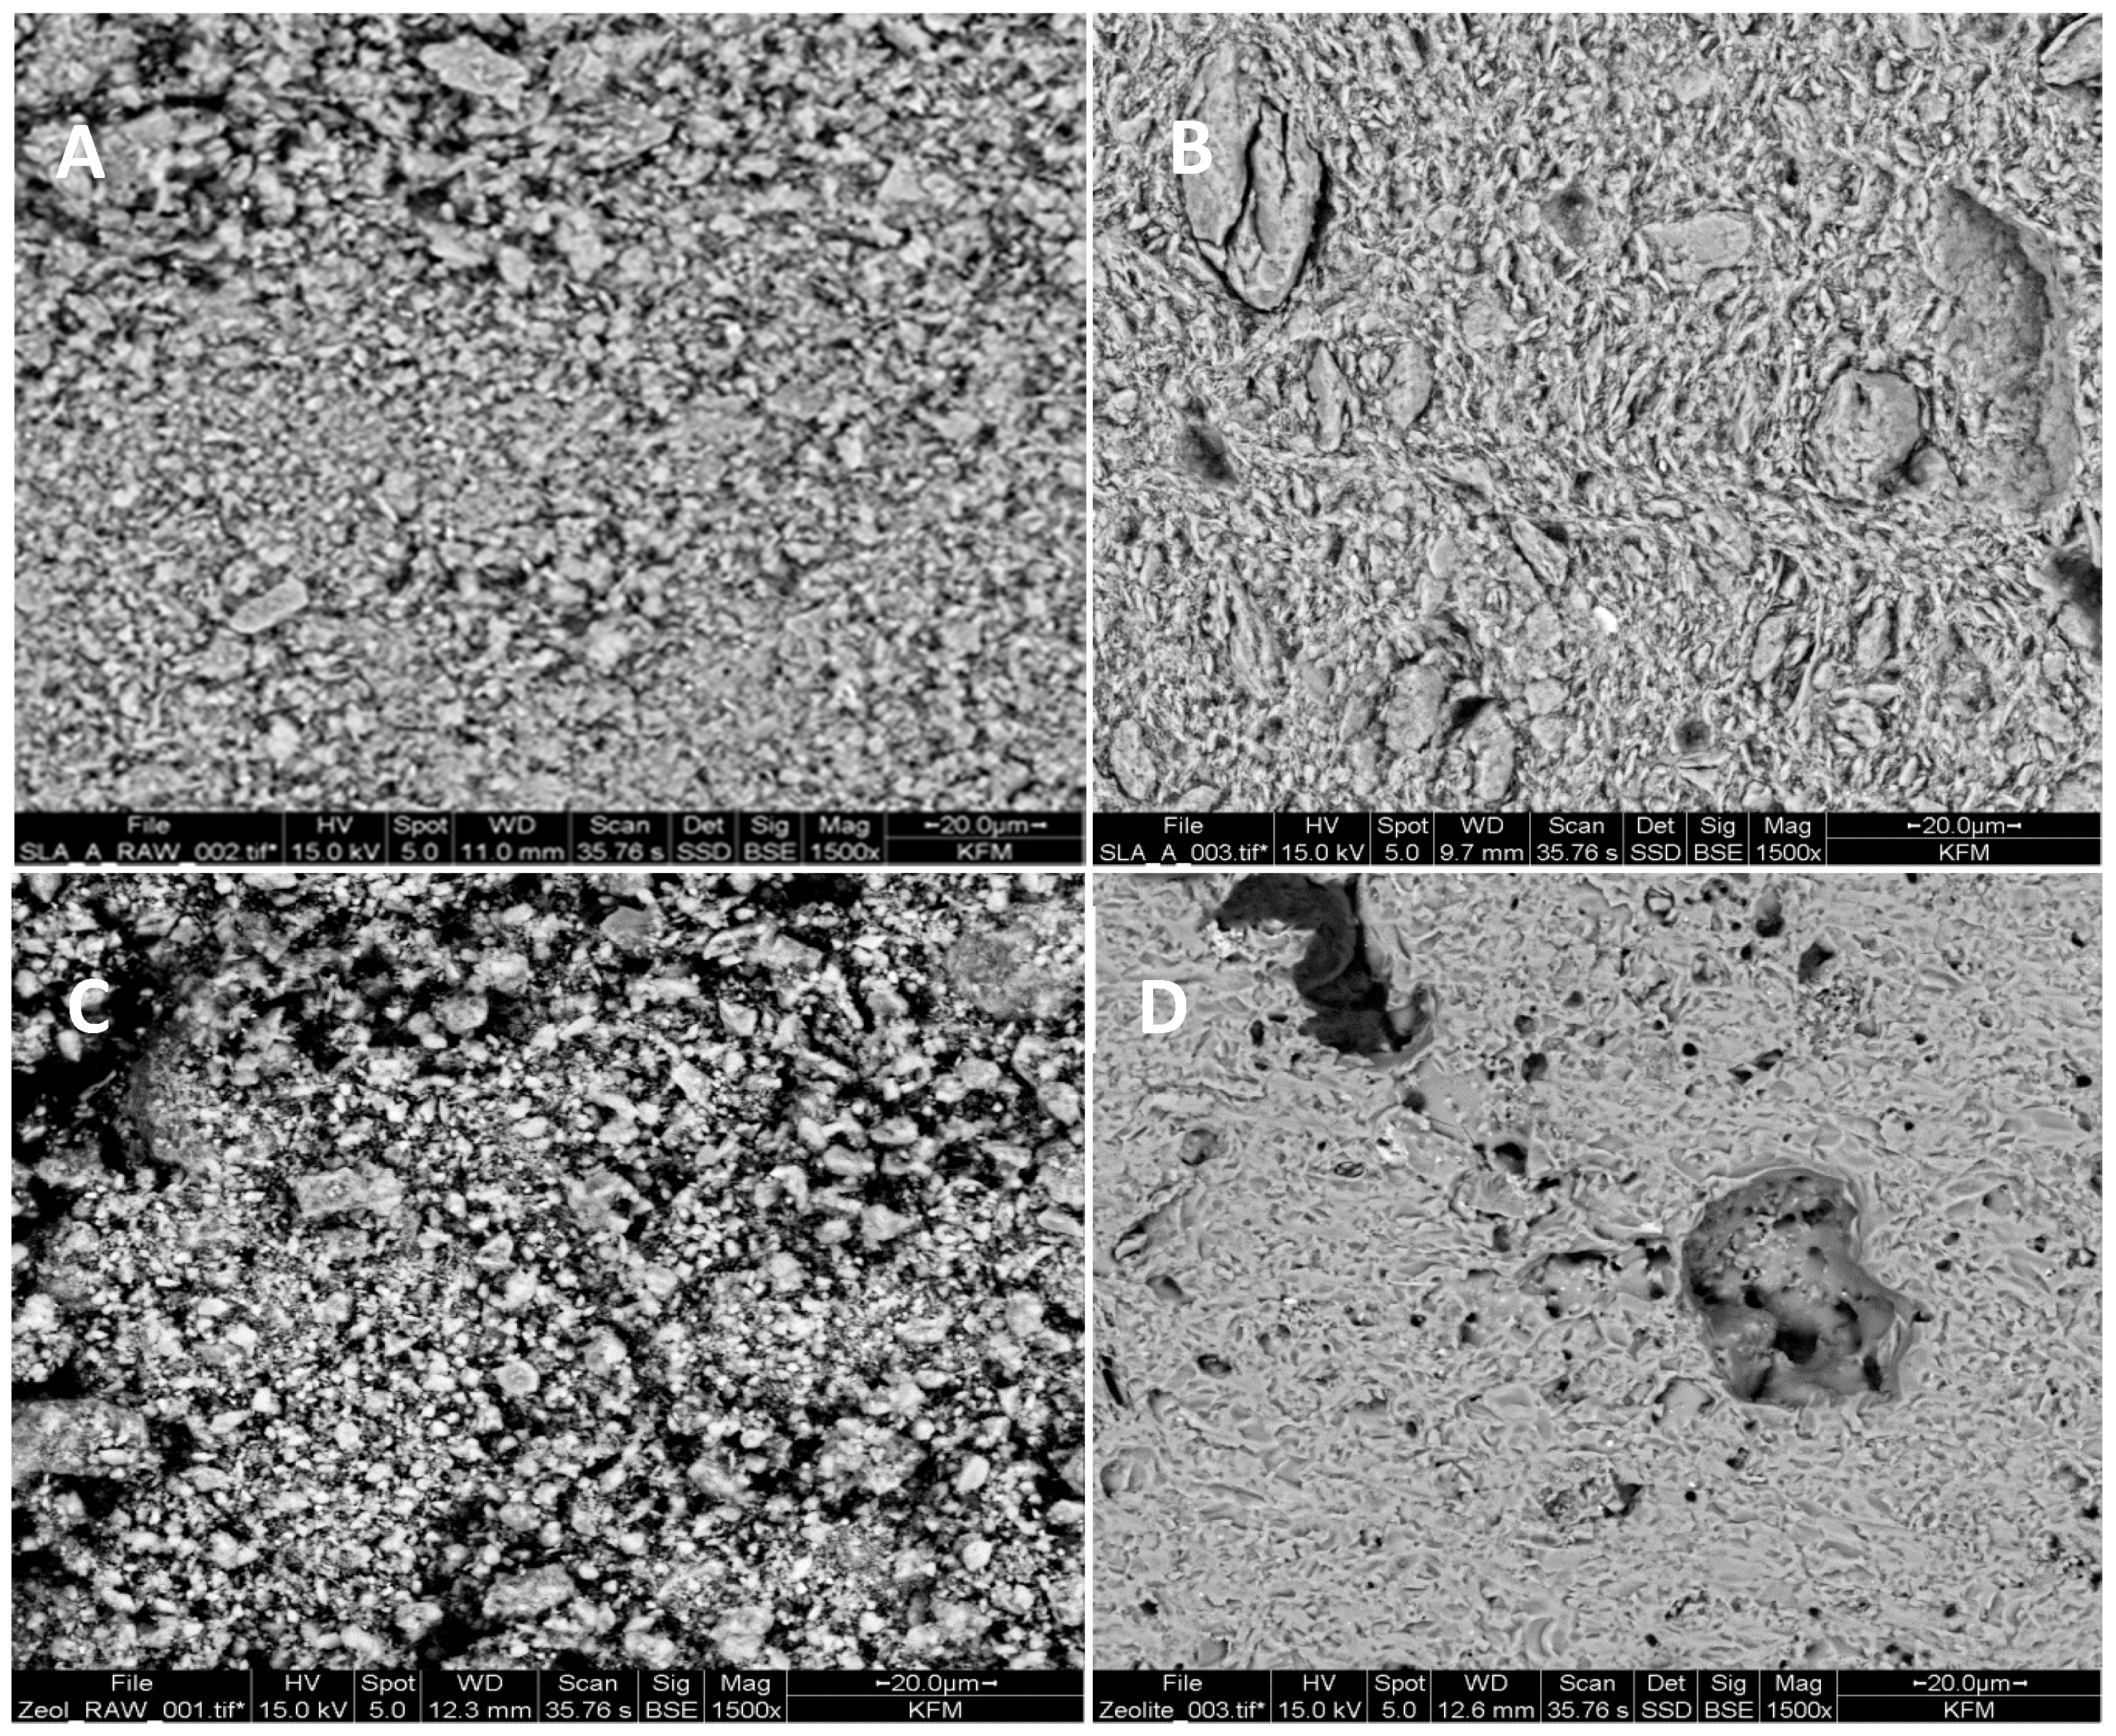
An SEM picture of the green kaolin sample is presented in Figure 17A. Grains of kaolinite with a different size and also agglomerates are visible. Kaolinite crystals have a plate-like shape and they are ordered randomly. The samples contain also many small pores. This is confirmed with high values of the porosity (black or dark points). A picture of the kaolin sample heated at 1100 °C is shown in Figure 17B. The porosity decreased and the kaolin sample stayed more compact. The structure remains in the same condition up to 1100 °C. Moreover, the pseudoamorphous shape of a grain of initial agglomerates is still the same.
An SEM picture of the green zeolite sample is presented in Figure 17C. Grains as well as agglomerates (clusters of grains) with different sizes and shapes can be seen. A picture of the zeolite sample heated at 1100 °C is shown in Figure 17D, where large pores (black or dark points) are mainly visible. The initial shape of grains is not preserved. The samples are more compact (higher density (see Figure 8) and smaller porosity), and the melting of grains is visible.
4. Conclusions
The thermophysical properties (thermal expansion, thermal diffusivity and conductivity, and specific heat capacity) of kaolin–zeolite samples were investigated during a heating stage of the firing. The samples were prepared from Sedlec kaolin (Czech Republic) and natural zeolite (Nižný Hrabovec, Slovakia). Kaolin was partially replaced with a natural zeolite in the amounts of 10, 20, 30, 40, and 50 mass%. Pure kaolin and zeolite samples were also prepared. From the obtained values for the thermophysical properties (thermal expansion, thermal diffusivity and conductivity, and specific heat capacity) of Sedlec kaolin and blends of that kaolin with natural zeolite, we can conclude that increasing zeolite content of the blends decreases the values of all studied properties (except thermal expansion), which is positive for bulk density, porosity, thermal diffusivity, and conductivity. Zeolite has a negative effect on thermal expansion due to an increased shrinkage. Therefore, the optimal amount of zeolite in the blends (for the studied properties) is 30 mass%.
Author Contributions
Conceptualization, A.T.; methodology, T.H., J.O., Š.C. and A.T.; investigation, I.S., T.H., Š.C., J.O., G.Ł., A.S. and A.T.; writing—original draft preparation, A.T.; writing—review and editing, J.O., T.H., Š.C., I.S., G.Ł., A.S. and A.T.; visualization, A.T.; supervision, A.T.; funding acquisition, T.H. and J.O. All authors have read and agreed to the published version of the manuscript.
Funding
This research was funded by Ministry of Education of Slovak Republic, grant numbers VEGA 1/0810/19 and VEGA 1/0425/19, by RVO: 11000.
Acknowledgments
Authors wish to thank the company ZEOCEM, a.s. (Slovakia), for the supply of natural zeolite.
Conflicts of Interest
The authors declare no conflict of interest. The funders had no role in the design of the study; in the collection, analyses, or interpretation of data; in the writing of the manuscript, or in the decision to publish the results.
References
- Velasco, P.M.; Ortíz, M.M.; Giró, M.M. Fired clay bricks manufactured by adding wastes as sustainable construction material—A review. Constr. Build. Mater. 2014, 63, 97–107. [Google Scholar] [CrossRef]
- Knapek, M.; Húlan, T.; Dobroň, P.; Chmelík, F.; Trnik, A.; Štubňa, I. Acoustic Emission During Firing of the Illite-Based Ceramics with Fly Ash Addition. Acta Phys. Pol. A 2015, 128, 783–786. [Google Scholar] [CrossRef]
- Húlan, T.; Trník, A.; Kaljuvee, T.; Uibu, M.; Štubňa, I.; Kallavus, U.; Traksmaa, R. The study of firing of a ceramic body made from illite and fluidized bed combustion fly ash. J. Therm. Anal. Calorim. 2016, 127, 79–89. [Google Scholar] [CrossRef]
- Lingling, X.; Wei, G.; Tao, W.; Nanru, Y. Study on fired bricks with replacing clay by fly ash in high volume ratio. Constr. Build. Mater. 2005, 19, 243–247. [Google Scholar] [CrossRef]
- Zimmer, A.; Bergmann, C.P. Fly ash of mineral coal as ceramic tiles raw material. Waste Manag. 2007, 27, 59–68. [Google Scholar] [CrossRef] [PubMed]
- Ongwandee, M.; Namepol, K.; Yongprapat, K.; Homwuttiwong, S.; Pattiya, A.; Morris, J.; Chavalparit, O. Coal bottom ash use in traditional ceramic production: Evaluation of engineering properties and indoor air pollution removal ability. J. Mater. Cycles Waste Manag. 2020, 22, 2118–2129. [Google Scholar] [CrossRef]
- Húlan, T.; Štubňa, I.; Ondruška, J.; Trnik, A. The Influence of Fly Ash on Mechanical Properties of Clay-Based Ceramics. Minerals 2020, 10, 930. [Google Scholar] [CrossRef]
- Sokolar, R.; Smetanova, L. Dry pressed ceramic tiles based on fly ash–clay body: Influence of fly ash granulometry and pentasodium triphosphate addition. Ceram. Int. 2010, 36, 215–221. [Google Scholar] [CrossRef]
- Kovac, J.; Trnik, A.; Medved, I.; Štubňa, I.; Vozár, L. Influence of fly ash added to a ceramic body on its thermophysical properties. Therm. Sci. 2016, 20, 603–612. [Google Scholar] [CrossRef]
- Sokolar, R.; Vodova, L. The effect of fluidized fly ash on the properties of dry pressed ceramic tiles based on fly ash–clay body. Ceram. Int. 2011, 37, 2879–2885. [Google Scholar] [CrossRef]
- Chandra, N.; Sharma, P.; Pashkov, G.; Voskresenskaya, E.; Amritphale, S.S.; Baghel, N.S. Coal fly ash utilization: Low temperature sintering of wall tiles. Waste Manag. 2008, 28, 1993–2002. [Google Scholar] [CrossRef] [PubMed]
- Haiying, Z.; Youcai, Z.; Jingyu, Q. Study on use of MSWI fly ash in ceramic tile. J. Hazard. Mater. 2007, 141, 106–114. [Google Scholar] [CrossRef]
- Pontikes, Y.; Esposito, L.; Tucci, A.; Angelopoulos, G. Thermal behaviour of clays for traditional ceramics with soda–lime–silica waste glass admixture. J. Eur. Ceram. Soc. 2007, 27, 1657–1663. [Google Scholar] [CrossRef]
- Hasan, R.; Siddika, A.; Akanda, P.A.; Islam, R. Effects of waste glass addition on the physical and mechanical properties of brick. Innov. Infrastruct. Solut. 2021, 6, 1–13. [Google Scholar] [CrossRef]
- Conte, S.; Zanelli, C.; Molinari, C.; Guarini, G.; Dondi, M. Glassy wastes as feldspar substitutes in porcelain stoneware tiles: Thermal behaviour and effect on sintering process. Mater. Chem. Phys. 2020, 256, 123613. [Google Scholar] [CrossRef]
- Ondruška, J.; Csáki, Š.; Štubňa, I. Influence of waste glass addition on thermal properties of kaolin and illite. AIP Conf. Proc. 2019, 2133, 020028. [Google Scholar] [CrossRef]
- Kovac, J.; Trnik, A.; Medveď, I.; Vozár, L. Influence of calcite in a ceramic body on its thermophysical properties. J. Therm. Anal. Calorim. 2013, 114, 963–970. [Google Scholar] [CrossRef]
- Murray, H.H. Traditional and new applications for kaolin, smectite, and palygorskite: A general overview. Appl. Clay Sci. 2000, 17, 207–221. [Google Scholar] [CrossRef]
- Štubňa, I.; Varga, G.; Trnik, A. Investigation of kaolinite dehydroxylations is still interesting. Építöanyag 2006, 58, 6–9. [Google Scholar] [CrossRef]
- Nemecz, E. Clay Minerals; Akadémiai Kiadó: Budapest, Hungary, 1981. [Google Scholar]
- Foldvári, M. Hanbook of Thermogarvimetric System of Minerals and Its Use in Geological Practice; Geological Institute of Hungary: Budapest, Hungary, 2011. [Google Scholar]
- Ryan, W. Properties of Ceramic Raw Materials; Elsevier BV: Amsterdam, The Netherlands, 1978; pp. 47–50. [Google Scholar]
- Štubňa, I.; Sin, P.; Trnik, A.; Veinthal, R. Mechanical Properties of Kaolin during Heating. Key Eng. Mater. 2012, 527, 14–19. [Google Scholar] [CrossRef]
- Norton, F.H. Fine Ceramics: Technology and Applications; McGraw-Hill: New York, NY, USA, 1970. [Google Scholar]
- Hanykýř, V.; Kutzendorfer, J. Technology of Ceramics; Silis Praha: Praha, Czech Republic, 2008. [Google Scholar]
- Kurovics, E.; Kotova, O.B.; Ibrahim, J.E.F.M.; Tihtih, M.; Sun, S.; Pala, P.; Gömze, A.L. Characterization of phase transformation and thermal behavior of Sedlecky Kaolin. Építöanyag 2020, 72, 144–147. [Google Scholar] [CrossRef]
- Varga, G. The structure of kaolinite and metakaolinite. Építöanyag 2007, 59, 6–9. [Google Scholar] [CrossRef]
- Ptáček, P.; Šoukal, F.; Opravil, T.; Nosková, M.; Havlica, J.; Brandštetr, J. The kinetics of Al–Si spinel phase crystallization from calcined kaolin. J. Solid State Chem. 2010, 183, 2565–2569. [Google Scholar] [CrossRef]
- Ptáček, P.; Šoukal, F.; Opravil, T.; Nosková, M.; Havlica, J.; Brandštetr, J. Mid-infrared spectroscopic study of crystallization of cubic spinel phase from metakaolin. J. Solid State Chem. 2011, 184, 2661–2667. [Google Scholar] [CrossRef]
- Ondruška, J.; Trnik, A.; Keppert, M.; Medveď, I.; Vozár, L. Isothermal Dilatometric Study of Sintering in Kaolin. Int. J. Thermophys. 2012, 35, 1946–1956. [Google Scholar] [CrossRef]
- Chakraborty, A.K. Phase Transformation of Kaolinite Clay; Springer Nature: New Delhi, India, 2014. [Google Scholar]
- Favvas, E.P.; Tsanaktsidis, C.G.; Sapalidis, A.A.; Tzilantonis, G.T.; Papageorgiou, S.K.; Mitropoulos, A.C. Clinoptilolite, a natural zeolite material: Structural characterization and performance evaluation on its dehydration properties of hydrocarbon-based fuels. Microporous Mesoporous Mater. 2016, 225, 385–391. [Google Scholar] [CrossRef]
- Mansouri, N.; Rikhtegar, N.; Panahi, H.A.; Atabi, F.; Shahraki, B.K. Porosity, characteriza-tion and structural properties of natural zeolite-clinoptilolite—As a sorbent. Environ. Prot. Eng. 2013, 39, 139–152. [Google Scholar] [CrossRef]
- Kocak, Y.; Tascı, E.; Kaya, U. The effect of using natural zeolite on the properties and hydration characteristics of blended cements. Constr. Build. Mater. 2013, 47, 720–727. [Google Scholar] [CrossRef]
- Trnik, A.; Scheinherrova, L.; Medved, I.; Černý, R. Simultaneous DSC and TG analysis of high-performance concrete containing natural zeolite as a supplementary cementitious material. J. Therm. Anal. Calorim. 2015, 121, 67–73. [Google Scholar] [CrossRef]
- Bhattacharyya, T.; Chandran, P.; Ray, S.K.; Pal, D.K.; Mandal, C.; Mandal, D.K. Distribution of Zeolitic Soils in India. Curr. Sci. 2015, 109, 1305. [Google Scholar] [CrossRef]
- Lamprecht, M.; Bogner, S.; Steinbauer, K.; Schuetz, B.; Greilberger, J.F.; Leber, B.; Wagner, B.; Zinser, E.; Petek, T.; Wallner-Liebmann, S.; et al. Effects of zeolite supplementation on parameters of intestinal barrier integrity, inflammation, redoxbiology and performance in aerobically trained subjects. J. Int. Soc. Sports Nutr. 2015, 12, 40. [Google Scholar] [CrossRef] [Green Version]
- Laurino, C.; Palmieri, B. Zeolite: “the magic stone”; main nutritional, environmental, experimental and clinical fields of application. Nutr. Hosp. 2015, 32, 573–581. [Google Scholar]
- Sunitrová, I.; Trnik, A. DSC and TGA of a kaolin-based ceramics with zeolite addition during heating up to 1100 °C. AIP Conf. Proc. 2018, 1988, 020046. [Google Scholar] [CrossRef]
- Che, C.; Glotch, T.D.; Bish, D.L.; Michalski, J.R.; Xu, W. Spectroscopic study of the dehydration and/or dehydroxylation of phyllosilicate and zeolite minerals. J. Geophys. Res. Space Phys. 2011, 116, 05007. [Google Scholar] [CrossRef]
- Földesová, M.; Lukac, P.; Dillinger, P.; Balek, V.; Svetík, Š. Thermochemical Properties of Chemically Modified Zeolite. J. Therm. Anal. Calorim. 1999, 58, 671–675. [Google Scholar] [CrossRef]
- Sunitrová, I.; Trnik, A. Young’s modulus and thermal expansion of ceramic samples made from kaolin and zeolite. AIP Conf. Proc. 2016, 1752, 40026. [Google Scholar] [CrossRef]
- Sunitrová, I.; Trnik, A. Thermal expansion of ceramic samples containing natural zeolite. AIP Conf. Proc. 2017, 1866, 040039. [Google Scholar] [CrossRef]
- Ptáček, P.; Křečková, M.; Šoukal, F.; Opravil, T.; Havlica, J.; Brandštetr, J. The kinetics and mechanism of kaolin powder sintering I. The dilatometric CRH study of sinter-crystallization of mullite and cristobalite. Powder Technol. 2012, 232, 24–30. [Google Scholar] [CrossRef]
- Vejmelková, E.; Koňáková, D.; Kulovaná, T.; Keppert, M.; Žumár, J.; Rovnaníková, P.; Keršner, Z.; Sedlmajer, M.; Černý, R. Engineering properties of concrete containing natural zeolite as supplementary cementitious material: Strength, toughness, durability, and hygrothermal performance. Cem. Concr. Compos. 2015, 55, 259–267. [Google Scholar] [CrossRef]
- Podoba, R.; Trník, A.; Podobník, L. Upgrading of TGA/DTA analyzer derivatograph. Építöanyag 2012, 64, 28–29. [Google Scholar] [CrossRef]
- Jankula, M.; Šín, P.; Podoba, R.; Ondruška, J. Typical problems in push-rod dilatometry analysis. Építöanyag 2013, 65, 11–14. [Google Scholar] [CrossRef]
- Ondruška, J.; Trnik, A.; Vozár, L. Degree of Conversion of Dehydroxylation in a Large Electroceramic Body. Int. J. Thermophys. 2010, 32, 729–735. [Google Scholar] [CrossRef]
- Antal, D.; Húlan, T.; Štubňa, I.; Záleská, M.; Trník, A. The influence of texture on elastic and thermophysical properties of kaolin- and illite-based ceramic bodies. Ceram. Int. 2017, 43, 2730–2736. [Google Scholar] [CrossRef]
- Frizzo, R.G.; Zaccaron, A.; Nandi, V.D.S.; Bernardin, A.M. Pyroplasticity on porcelain tiles of the albite-potassium feldspar-kaolin system: A mixture design analysis. J. Build. Eng. 2020, 31, 101432. [Google Scholar] [CrossRef]
- Trnik, A.; Štubňa, I.; Moravčíková, J. Sound Velocity of Kaolin in the Temperature Range from 20 °C to 1100 °C. Int. J. Thermophys. 2009, 30, 1323–1328. [Google Scholar] [CrossRef]
- Dell’Agli, G.; Ferone, C.; Mascolo, G.; Pansini, M. Dilatometry of Na-, K-, Ca- and NH4-clinoptilolite. Thermochim. Acta 1999, 336, 105–110. [Google Scholar] [CrossRef]
- Michot, A.; Smith, D.S.; Degot, S.; Gault, C. Thermal conductivity and specific heat of kaolinite: Evolution with thermal treatment. J. Eur. Ceram. Soc. 2008, 28, 2639–2644. [Google Scholar] [CrossRef]
Figure 1.
Differential thermal analysis (DTA) of the studied samples.

Figure 2.
Differential scanning calorimetry (DSC) of the studied samples.

Figure 3.
The enthalpy of the studied samples during the dehydroxylation of kaolinite (grey) and crystallization of spinel (black).
Figure 3.
The enthalpy of the studied samples during the dehydroxylation of kaolinite (grey) and crystallization of spinel (black).

Figure 4.
Relative mass change of the studied samples.

Figure 5.
Relative mass change of the studied samples at 800, 900, and 1000 °C.

Figure 6.
Relative thermal expansion of the studied samples.

Figure 7.
Relative thermal expansion of the studied samples at 800, 900, 1000, and 1100 °C.

Figure 8.
Bulk density of the studied samples.

Figure 9.
Bulk density of the studied samples at 800, 900, 1000, and 1100 °C.

Figure 10.
Thermal diffusivity of the studied samples.

Figure 11.
Thermal diffusivity of the studied samples at 800, 900, and 1000 °C.

Figure 12.
Specific heat capacity of the studied samples.

Figure 13.
Specific heat capacity of the studied samples at 800, 900, and 1000 °C.

Figure 14.
Thermal conductivity of the studied samples.

Figure 15.
Thermal conductivity of the studied samples at 800, 900, and 1000 °C.

Figure 16.
Porosity of the studied samples at 800, 900, 1000, and 1100 °C.

Figure 17.
SEM pictures. (A) green Sedlec kaolin; (B) Sedlec kaolin fired at 1100 °C; (C) green zeolite; (D) zeolite fired at 1100 °C.
Figure 17.
SEM pictures. (A) green Sedlec kaolin; (B) Sedlec kaolin fired at 1100 °C; (C) green zeolite; (D) zeolite fired at 1100 °C.


Table 1.
The chemical compositions of the Sedlec kaolin and natural zeolite (in mass%).
| Oxides | Kaolin | Zeolite |
|---|---|---|
| SiO2 | 46.9–47.9 | 65.0–71.3 |
| Al2O3 | 36.6–37.6 | 11.5–13.1 |
| Fe2O3 | 1.2 | 0.7–1.9 |
| CaO | 0.7 | 2.7–5.2 |
| MgO | 0.5 | 0.6–1.2 |
| Na2O | 0.1 | 0.2–1.3 |
| K2O | 0.8–1.1 | 2.2–3.4 |
| TiO2 | 0.5 | 0.1–0.3 |
Table 2.
The compositions of the samples made from Sedlec kaolin and natural zeolite (in mass%).
| Sample | SLA | KZ10 | KZ20 | KZ30 | KZ40 | KZ50 | ZEO |
|---|---|---|---|---|---|---|---|
| Kaolin | 100 | 90 | 80 | 70 | 60 | 50 | – |
| Zeolite | – | 10 | 20 | 30 | 40 | 50 | 100 |
Publisher’s Note: MDPI stays neutral with regard to jurisdictional claims in published maps and institutional affiliations. |
© 2021 by the authors. Licensee MDPI, Basel, Switzerland. This article is an open access article distributed under the terms and conditions of the Creative Commons Attribution (CC BY) license (http://creativecommons.org/licenses/by/4.0/).
Share and Cite
MDPI and ACS Style
Ondruška, J.; Húlan, T.; Sunitrová, I.; Csáki, Š.; Łagód, G.; Struhárová, A.; Trník, A. Thermophysical Properties of Kaolin–Zeolite Blends up to 1100 °C. Crystals 2021, 11, 165. https://doi.org/10.3390/cryst11020165
AMA Style
Ondruška J, Húlan T, Sunitrová I, Csáki Š, Łagód G, Struhárová A, Trník A. Thermophysical Properties of Kaolin–Zeolite Blends up to 1100 °C. Crystals. 2021; 11(2):165. https://doi.org/10.3390/cryst11020165
Chicago/Turabian StyleOndruška, Ján, Tomáš Húlan, Ivana Sunitrová, Štefan Csáki, Grzegorz Łagód, Alena Struhárová, and Anton Trník. 2021. "Thermophysical Properties of Kaolin–Zeolite Blends up to 1100 °C" Crystals 11, no. 2: 165. https://doi.org/10.3390/cryst11020165
Note that from the first issue of 2016, this journal uses article numbers instead of page numbers. See further details here.