Direct Decomposition of NO over Co-Mn-Al Mixed Oxides: Effect of Ce and/or K Promoters
by
 ,
,
Květa Jirátová
1,*, 
Kateřina Pacultová
2,
Kateřina Karásková
2,
Jana Balabánová
1,
Martin Koštejn
1 and
Lucie Obalová
2
1
Czech Academy of Sciences, Institute of Chemical Process Fundamentals, Rozvojová 135, 165 02 Prague, Czech Republic
2
VSB-TU of Ostrava, Institute of Environmental Technology, VŠB-TU Ostrava, 17. Listopadu 15/2172, CZ-708 00 Ostrava-Poruba, Czech Republic
*
Author to whom correspondence should be addressed.
Catalysts 2020, 10(7), 808; https://doi.org/10.3390/catal10070808
Submission received: 1 July 2020
/
Revised: 15 July 2020
/
Accepted: 16 July 2020
/
Published: 20 July 2020
(This article belongs to the Special Issue Catalytic Decomposition of N2O and NO)
Abstract
:Co-Mn-Al mixed oxides promoted by potassium are known as active catalysts for the direct decomposition of nitric oxide (NO). In this study, the answer to the following question has been considered: does the presence of cerium in K-promoted Co-Mn-Al catalysts substantially affect the physical-chemical properties, activity, and stability in direct NO decomposition? The Co-Mn-Al, Co-Mn-Al-Ce, and Co-Mn-Al-Ce-K mixed oxide catalysts were prepared by the precipitation of corresponding metal nitrates with a solution of Na2CO3/NaOH, followed by the washing of the precipitate and calcination. Two other catalysts were prepared by impregnation of the Ce-containing catalysts with Co and Co+K nitrates. After calcination, the solids were characterized by chemical analysis, XRD, N2 physisorption, FTIR, temperature-programmed reduction, CO2 and O2 desorption (H2-TPR, CO2-TPD, O2-TPD), and X-ray photoelectron spectrometry (XPS). Cerium and especially potassium occurring in the catalysts affected the basicity, reducibility, and surface concentration of active components. Adding cerium itself did not contribute to the increase in catalytic activity, whereas the addition of cerium and potassium did. Catalytic activity in direct NO decomposition depended on combinations of both reducibility and the amount of stronger basic sites determined in the catalysts. Therefore, the increase in cobalt concentration itself in the Co-Mn-Al mixed oxide catalyst does not determine the achievement of high catalytic activity in direct NO decomposition.
1. Introduction
Anthropogenic activities induce serious environmental problems caused by the presence of produced nitrogen oxides (N2O, NO, NO2) in air. However, in most off-gases, more than 95% of NOx (NO, NO2) emissions consist of NO [1]. The presence of nitrogen monoxide (NO) in air is also undesirable because of its contribution to the formation of acid rains and photochemical smog. Catalytic decomposition is one way to decrease nitrogen oxide concentrations in off-gases. From the compounds mentioned, N2O catalytic decomposition to oxygen and nitrogen is the simplest. However, in the last few years, the direct catalytic decomposition of NO has been intensively studied in the literature, e.g., [2]. Various metals (Pt, Pd, Ag, Rh, Ni, Cu, Mo, Co, Au), metal oxides (Co3O4, Fe2O3, NiO, CuO, and ZrO2), lanthanides, perovskites, and mixed oxides were studied for direct NO decomposition [3,4,5,6]. Since both reactions, N2O and NO decomposition, are spin-forbidden [7] and the cleavage of the N–O bond is necessary in both cases, it is highly probable that similar catalytic systems could catalyze the catalytic decomposition of both N2O and NO. Cobalt spinels are known as active catalysts for N2O catalytic decomposition and the improvement of catalytic activity in Co-Al, Co-Mg-Al, and Co-Mn-Al calcined layered double hydroxides (LDHs) by their modification with potassium promoter has been reported [8,9,10]. The best results were obtained in the presence of Co-Mn-Al mixed oxide with a Co:Mn:Al molar ratio of 4:1:1 modified with 0.9–1.6 wt.% K [10]. Firstly, Pacultová et al. [11] tested the same catalytic system for NO catalytic decomposition. It was found that Co-Mn-Al mixed oxides promoted by alkali metals are active not only in the decomposition of N2O but also in the direct decomposition of NO to N2 and O2 when the reaction is carried out in the temperature range of 500–700 °C. Detailed recent studies confirmed these results [12,13].
Some authors studied the effect of cerium in transition mixed oxides on their activity in various catalytic reactions [14,15,16,17,18,19]. Ceria (CeO2) has demonstrated effectiveness in catalysis due to its redox properties and oxygen storage capacity [14] as well as its ability to approve the Mars–Van Krevelen mechanism of reaction. Since this mechanism occurs through oxygen species from the solid, the mobility of oxygen becomes an important factor for the catalytic reaction. Thus, both the electronic and structural changes caused by the introduction of foreign metals in the ceria lattice seem to be advantageous toward the volatile organic compound oxidation reactions [14]. Interaction between CeO2 and transition metals leads to the increased mobility of lattice oxygen atoms of CeO2 [15], which are mobile, rapidly change the state of surface oxygen vacancies, and enhance the reducibility of the adjacent metal particles. The high mobility of oxygen vacancies of ceria is well-known, as ceria has attracted continuous interest owing to its unique combination of an elevated oxygen transport capacity coupled with the ability to shift easily between reduced and oxidized states Ce3+ ↔ Ce4+ [16]. The importance of oxygen mobility in Co3O4-CeO2 mixed oxides was proven, e.g., in the total oxidation of VOC [17] or three-way catalysts of Pt/CeO2-ZrO2 [18]. The major role of oxygen storage materials is to store oxygen under excess oxygen conditions and release it under deficient oxygen conditions based on the reversible redox reaction between Ce4+ and Ce3+ caused by the formation of oxygen vacancies [19]. Due to the high oxygen storage capacity, ceria and ceria-containing mixed oxides have been proposed to remove deposited carbon on the catalyst’s surface.
Some other authors, e.g., [20,21,22,23,24], studied the effect of CeO2 addition to transition metal oxides on catalytic N2O or NO decomposition. Li Xue et al. found [20,21] that the presence of ceria in cobalt–cerium oxide catalysts was very important because it improved the cobalt catalyst’s activity in N2O decomposition. However, the promotion effect of alkali metals was much greater than that of ceria. Argyle [22] synthesized several Co-K-CeO2 catalysts by coprecipitation to test them in NO decomposition. The resulting catalysts were somewhat more active than the Co-K catalysts supported on alumina, but they still showed insignificant NO decomposition activity at 650 °C (less than 10% of NO conversion). The amount of N2O byproduct was larger than for the CoOx/Al2O3 catalysts. Some activity appeared at reaction temperatures above 650 °C, but NO conversion was only around 5% (based on N2 formation). Based on material balance, the majority of the apparent constant “activity” at 700 °C was a loss of oxygen from the catalyst instead of that from NO decomposition. These results contradict the results presented by Stoyanova et al. [23]. The authors revealed that the catalysts based on lanthanum oxide or cerium oxide (containing 5 wt.% La or 2 wt.% Ce) deposited by impregnation on alumina exhibited high catalytic activity, with over 60% conversion of NO decomposition to N2 at ca. 400 °C in the absence of a reducing agent (CO). A series of CeMeOy/γ-Al2O3 (Me = Mn, Cu, Zn) samples for effective catalytic N2O decomposition were prepared by Zhang et al. [24]. Their results indicated that the addition of CeO2 to samples MeOx/gama-Al2O3 was beneficial for the reduction of catalytic components, desorption of surface oxygen, and the total amount of basic sites on the sample surface. Moreover, the prepared Ce1.2MeOy/γ-Al2O3 catalyst had excellent stability at 600 °C under a practical atmosphere that included water vapor and an excess of oxygen in the mixture. Wong-Jong Hong et al. [25] studied direct NO decomposition over Ce-Mn mixed oxide modified with alkali and alkali earth metals. The authors found out that NO conversion on the Ba/CeMn catalyst met the value of 67% of NO conversion at 800 °C. They correlated catalytic activity with the basicity of the catalysts. In other work [26] by the authors, the Ce0.8Mn0.15Ba0.05Ox catalyst exhibited the highest catalytic activity in NO decomposition to N2 and O2: conversion of NO was 77% at 800 °C. The catalyst had a high population of oxygen vacancies in the ceria lattice, suggesting that Mn species in a low oxidation state contribute to the formation of oxygen vacancies, which play an important role in the reaction.
The auspicious effect of cerium on the properties of transition metal oxide catalysts for various reactions inspired us to study the modification of Co-Mn-Al mixed oxide catalysts by cerium or cerium plus potassium in order to obtain catalysts with high catalytic activity in NO decomposition. We supposed that the incorporation of cerium into the structure of Co-Mn-Al mixed oxide could increase the activity and stability of the catalyst in the reaction due to the ability of cerium to improve the mobility of oxygen in this kind of catalyst.
Therefore, in this work, the effect of Ce and the simultaneous effect of Ce and K was studied, as it was confirmed previously that potassium is a very efficient promotor of catalysts based on transition metal oxides for direct NO decomposition. The Co-Mn-Al mixed oxide catalysts, non-modified and modified by cerium and cerium plus potassium have been synthesized and examined in NO decomposition.
2. Results
2.1. Chemical Analysis
Chemical analysis of the prepared catalysts was determined by MP-AES (atomic emission spectroscopy with microwave plasma) and the results are summarized in Table 1. The bare catalyst contains 52 wt.% Co, 11 wt.% Mn, and 3.7 wt.% Al; therefore, the Co:Mn:Al molar ratio is 4:1:1, as intended. In order to investigate the effect of cerium in Co-Mn-Al mixed oxides on NO decomposition, we decided, in accordance with the paper of Li Xue et al. [21], to prepare two catalysts with ca. 40 wt.% of cerium, the first without potassium (bare-Ce catalyst) and the second with ca. 2 wt.% of K in addition to Ce (bare-Ce,K catalyst). As a consequence of Ce incorporation, concentrations of Co, Mn, and Al decreased to 25, 4.7, and 2.7 wt.%, respectively. The molar ratio of Co:Mn:Al:Ce was 4:0.8:1.0:2.8. As it is known from the previous study [13] that a high concentration of Co is necessary for the achievement of high catalyst activity in direct NO decomposition, we prepared other two samples with higher content levels of Co (labeled as bare-Ce+Co and bare-Ce,K+Co,K) by the impregnation of the bare+Ce and bare+Ce,K catalysts. Additional impregnation of the catalysts resulted in a higher concentration of cobalt (36 wt.%) and lower concentrations of Mn, Al, and Ce. Naturally, the concentration of potassium, another important catalyst component, in the bare-Ce+Co sample was again null, whereas that of the bare-Ce,K+Co,K catalyst increased from 2.0 to 2.5 wt.%. The molar ratios of Co:Mn:Al:Ce changed from 4:0.8:1.0:2.8:0 to 4:0.6:0.7:2.1:0.6.
2.2. XRD
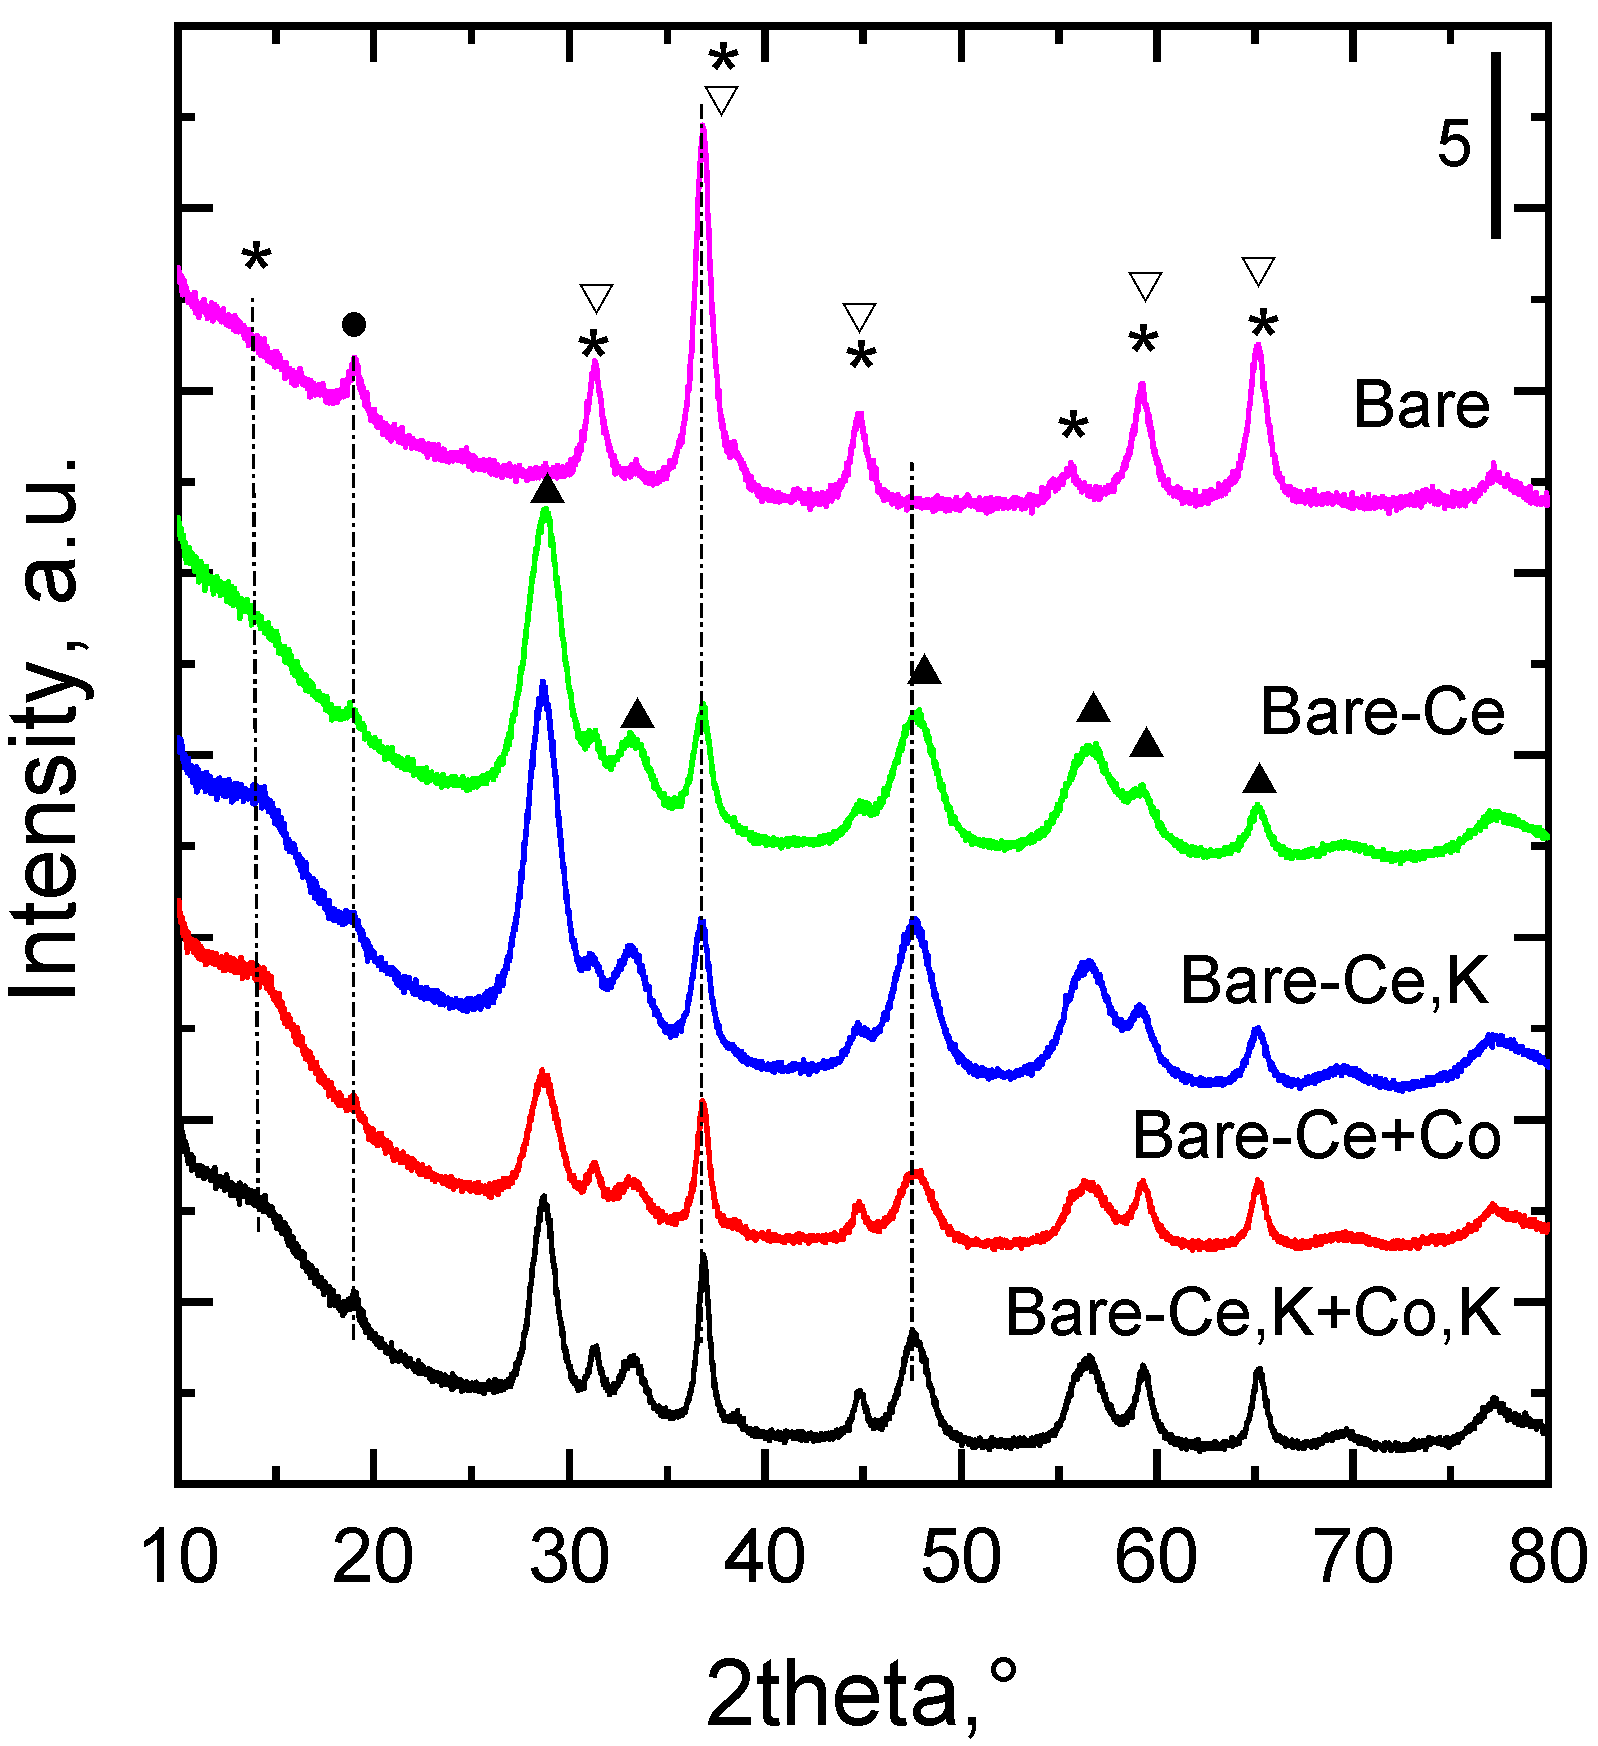
In the catalyst not containing cerium, the XRD patterns of the calcined samples confirmed the presence of two spinel-like oxides, i.e., tricobalt tetraoxide Co3O4 (PDF 01-078-1969) and cobalt aluminum manganese oxide CoMnAlO4 (PDF 00-036-0269). However, the diffraction peaks were relatively wide due to the broadening caused by the nanosize nature of the catalysts; therefore, the mixture of the spinel-like oxides and possibly a small portion of MnO2 (peak at 19° 2 theta) cannot be differentiated by XRD analysis as these structures have very similar diffraction patterns. Similar phase composition was found also in the XRD patterns of other prepared catalysts. In the XRD patterns of the catalysts containing cerium, cerianite-CeO2 (PDF 01-075-8371) was recognized (Figure 1), in addition to the compounds mentioned above.
Scherrer’s formula, D = k λ/(β cosθ), was used for calculation of the mean coherence length of the Co3O4 spinel-like structure and CeO2, where λ is the X-ray wavelength, β is the full width at half maxima (FWHM), θ is the corresponding diffraction angle, and k is the constant (0.9) [27]. Full width at half-maximum (FWHM) values were evaluated from the measured powder XRD patterns, and mean coherence lengths D of both compounds, Co3O4 in (311) direction (peak at 36.8° 2θ) and CeO2 in (111) direction (peak at 28.6° 2θ), were calculated (Table 1).
2.3. Surface Area and Pore Size Distribution
N2 physisorption was used to determine the textural parameters of the prepared catalysts. The obtained results are summarized in Table 2. BET surface areas (SBET) of the catalysts varied between 118 m2 g−1 and 59 m2 g−1. Surface area SBET is included in Table 2 for comparison with data from the literature, though the use of the classic (two-parameter) BET equation for the analysis of adsorption isotherms of microporous–mesoporous samples is not always correct [28]. The nitrogen adsorption–desorption isotherms recorded at −196 °C are depicted in Figure 2a. A small increase in the gas adsorption amount for x = p/p0 → 0 can be registered in the samples, which indicates the presence of a small portion of micropores. Nitrogen isotherms of all catalysts are very similar and correspond to the type II isotherm, according to IUPAC classification [29,30], corresponding to mesoporous solids. Nevertheless, the evaluation of the experimental data by the three-parameter BET equation [31] showed a very low volume of micropores (<5 mm3liq/g). Correspondingly, mesopore surface areas, Smeso, did not differ significantly from the BET surface areas. A steep part of the hysteresis loop (x between 0.80 and 0.985) of the bare catalyst without cerium points to the narrow mesopore size distribution. The bare-Ce catalyst showed the highest value of surface area of all. The catalysts containing cerium exhibited a roughly similar course of isotherms to the bare catalyst. The pore size distributions evaluated from the desorption curves of nitrogen physisorption isotherms are presented in Figure 2b. All catalysts revealed a broad, monodisperse pore structure with the diameter wmax of the peak ranging from 11 to 5 nm. The textural properties of the catalysts obviously reflect their composition, as surface area decreases with increasing K concentration in the catalysts [14]. In the pore size distributions, one can observe some differences. The presence of cerium in the catalysts caused an extension of pore distribution. At the same time, additional impregnation of the cerium containing catalysts with Co or Co+K nitrates induced a shift in pore diameter to smaller values due to the clogging of pores by solids. The decreasing total volume of pores (Table 2) can confirm this idea.
2.4. Reducibility of the Catalysts
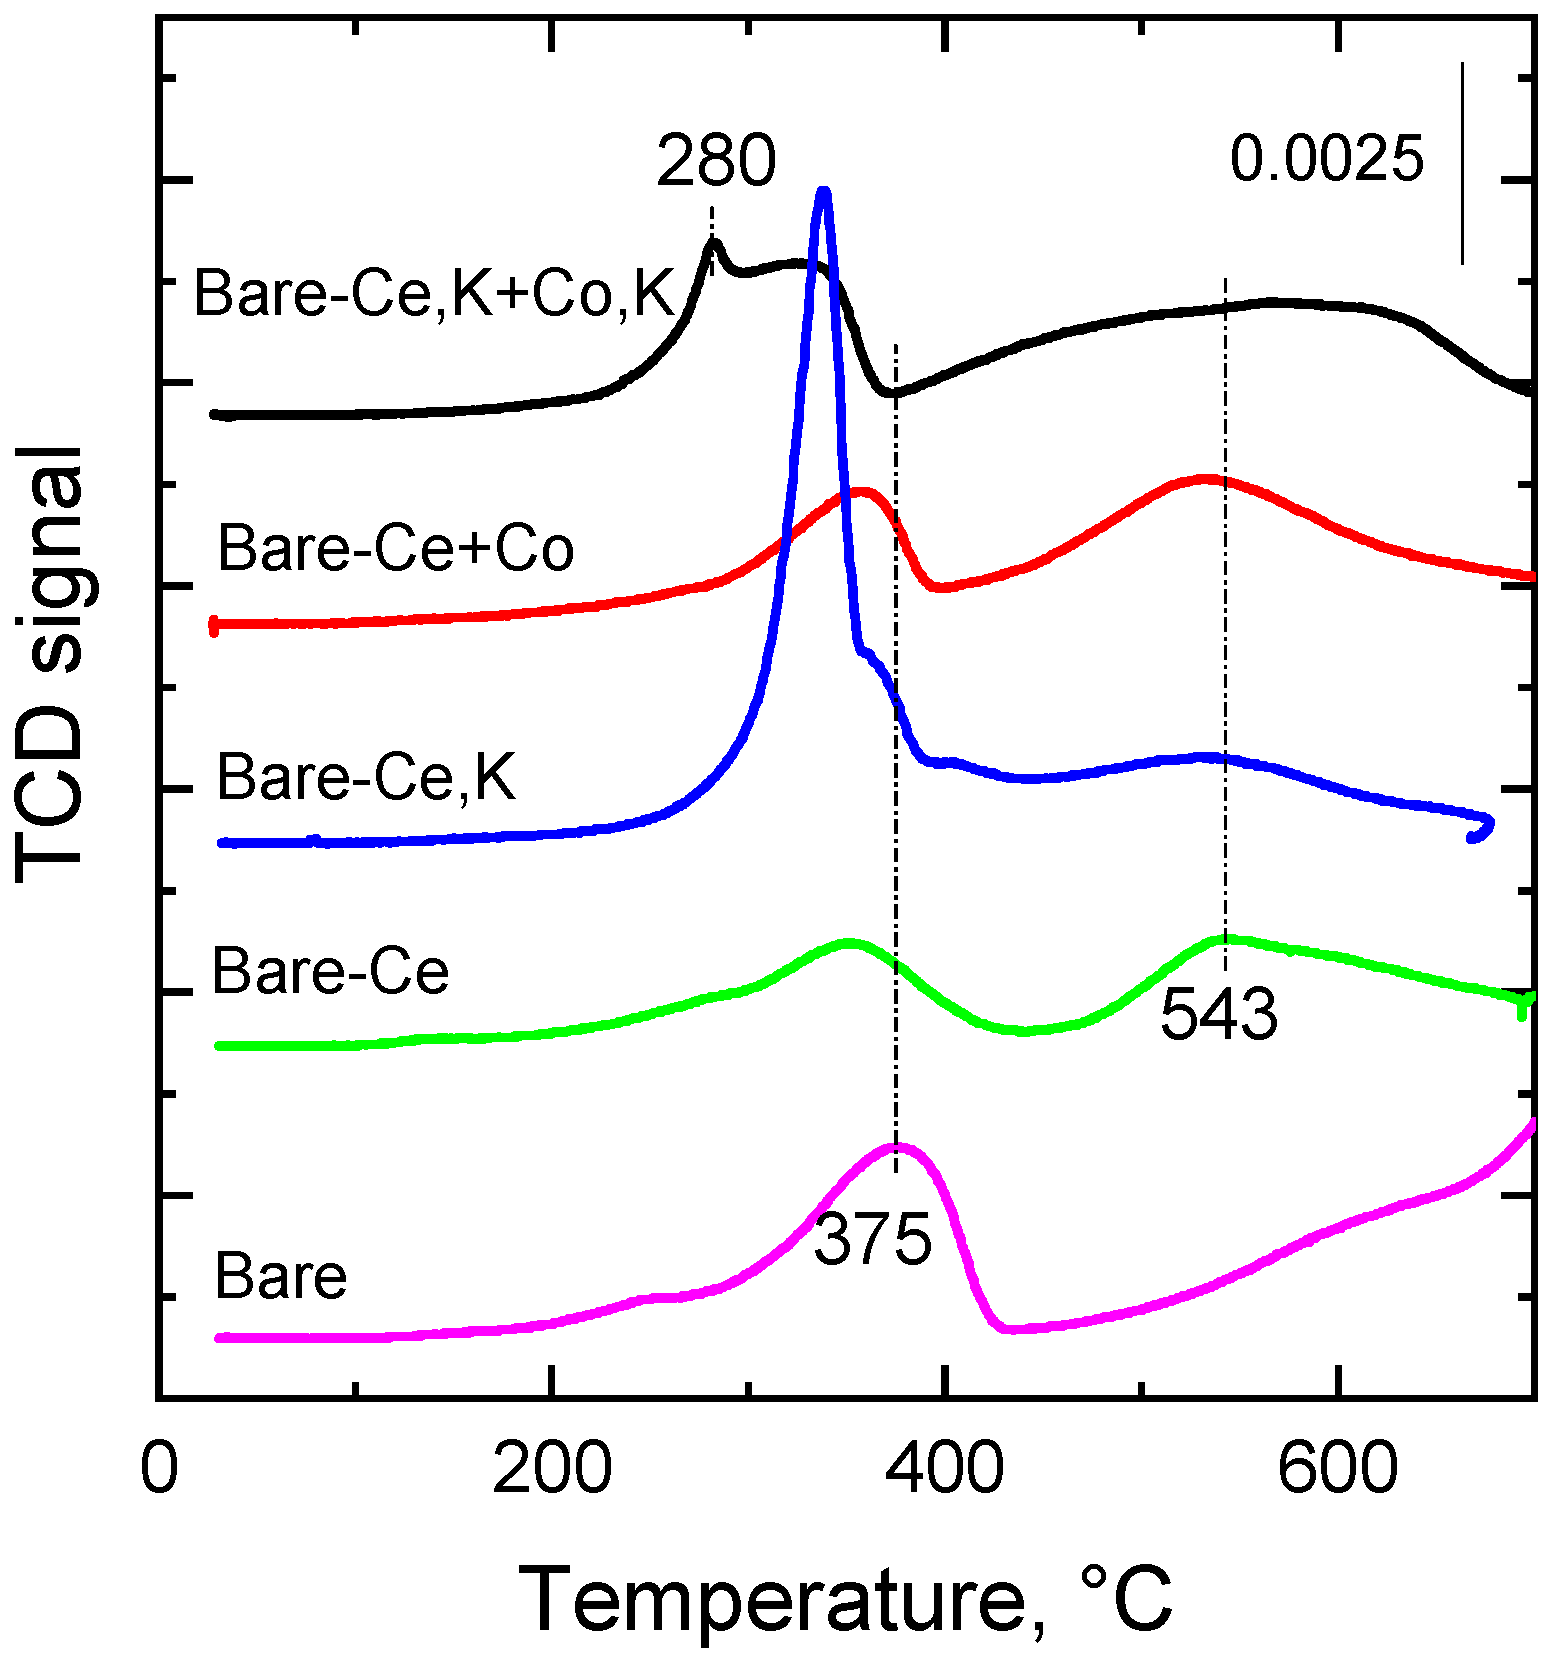
The reducibility of a catalyst is an important factor for the direct decomposition of NO [13]. This is why the reducibility of the investigated catalysts was examined by the temperature-programmed reduction, using hydrogen as a reduction component. The reduction procedure was completed at 650 °C in order to protect a mass spectrometer from the deposits of potassium, which is volatilizing at temperatures higher than 650 °C [13]. Figure 3 demonstrates the rather complex reduction profiles of the prepared catalysts. Reduction of the bare catalyst proceeded in two main temperature regions: 200–450 °C and >500 °C. Positions of the reduction peak maxima and the shoulders appearing in the TPR profiles of the catalysts reflect two main zones of reduction, as the reduction of pure Co3O4 (main component of the catalysts) proceeds in two successive steps: Co3O4 + H2 → 3CoO + H2O and CoO + H2 → Co + H2O. Tang et al. [32] and Chromčáková et al. [33] also registered two temperature maxima at 300 °C and 367 °C for unsupported Co3O4. K-promoted Co4MnAl mixed oxide catalysts showed a similar course of reduction profiles [13] as the examined catalysts. The low temperature reduction peak can also comprise the reduction of some small amount of MnO2 (whose presence in the catalysts was indicated in the XRD patterns), i.e., the reduction of Mn4+ to Mn3+. Reduction of Mn3+ to Mn2+ proceeds mainly in the second temperature region, together with the reduction of CoMnAlO4 as distinguished by XRD. The position of Tmax of the first reduction peak in H2-TPR (Figure 3) also reflected the concentration of K in the catalysts: an increasing concentration of K led to decreasing values of reduction temperature Tmax. Reduction of pure ceria proceeds at temperatures around 485 and 730 °C [34]. The authors also observed a shift in reduction temperature maxima towards lower temperatures due to the presence of transition metals (Mn, Fe) in ceria creating structural defects and thus enhancing oxygen migration in the lattice. This higher mobility and diffusion of bulk oxygen causes the increase in the redox properties of the samples. Similarly, the combination of transition metals (Co, Mn) with ceria in our catalysts shifted the reduction temperature maxima to lower temperatures (from ca. 700 °C to ~543 °C).
The observed reduction patterns were integrated in the temperature range of 25–650 °C, potentially related to catalytic NO decomposition, and the amounts of reducible components were calculated based on the calibration using CuO. Quantitative data are summarized in Table 3, together with theoretical values of H2 consumption (assuming reduction of Co3O4 to Co, Mn2O3 to MnO, and CeO2 to Ce2O3). Theoretical consumption of H2 is the highest for the bare catalyst, which has the highest concentration of cobalt. The high amount of cerium in the catalysts resulted in the lowest theoretical consumption of H2. Experimental data showed that the catalyst with a lower content of cobalt (bare-Ce) exhibited the lowest amount of reducible components of all catalysts. This fact can be explained by the presence of a relatively large amount of CeO2 compared to the bare catalyst. Naturally, the increased concentration of cobalt in the bare-Ce+Co catalyst led to a higher amount of reducible components. The highest amount of hydrogen consumed in the temperature range 25–650 °C was found with the catalysts containing potassium, the bare-Ce+K catalyst (7.3 mmol g−1), followed by the bare-Ce,K+Co,K catalyst (6.2 mmol g−1).
2.5. FTIR
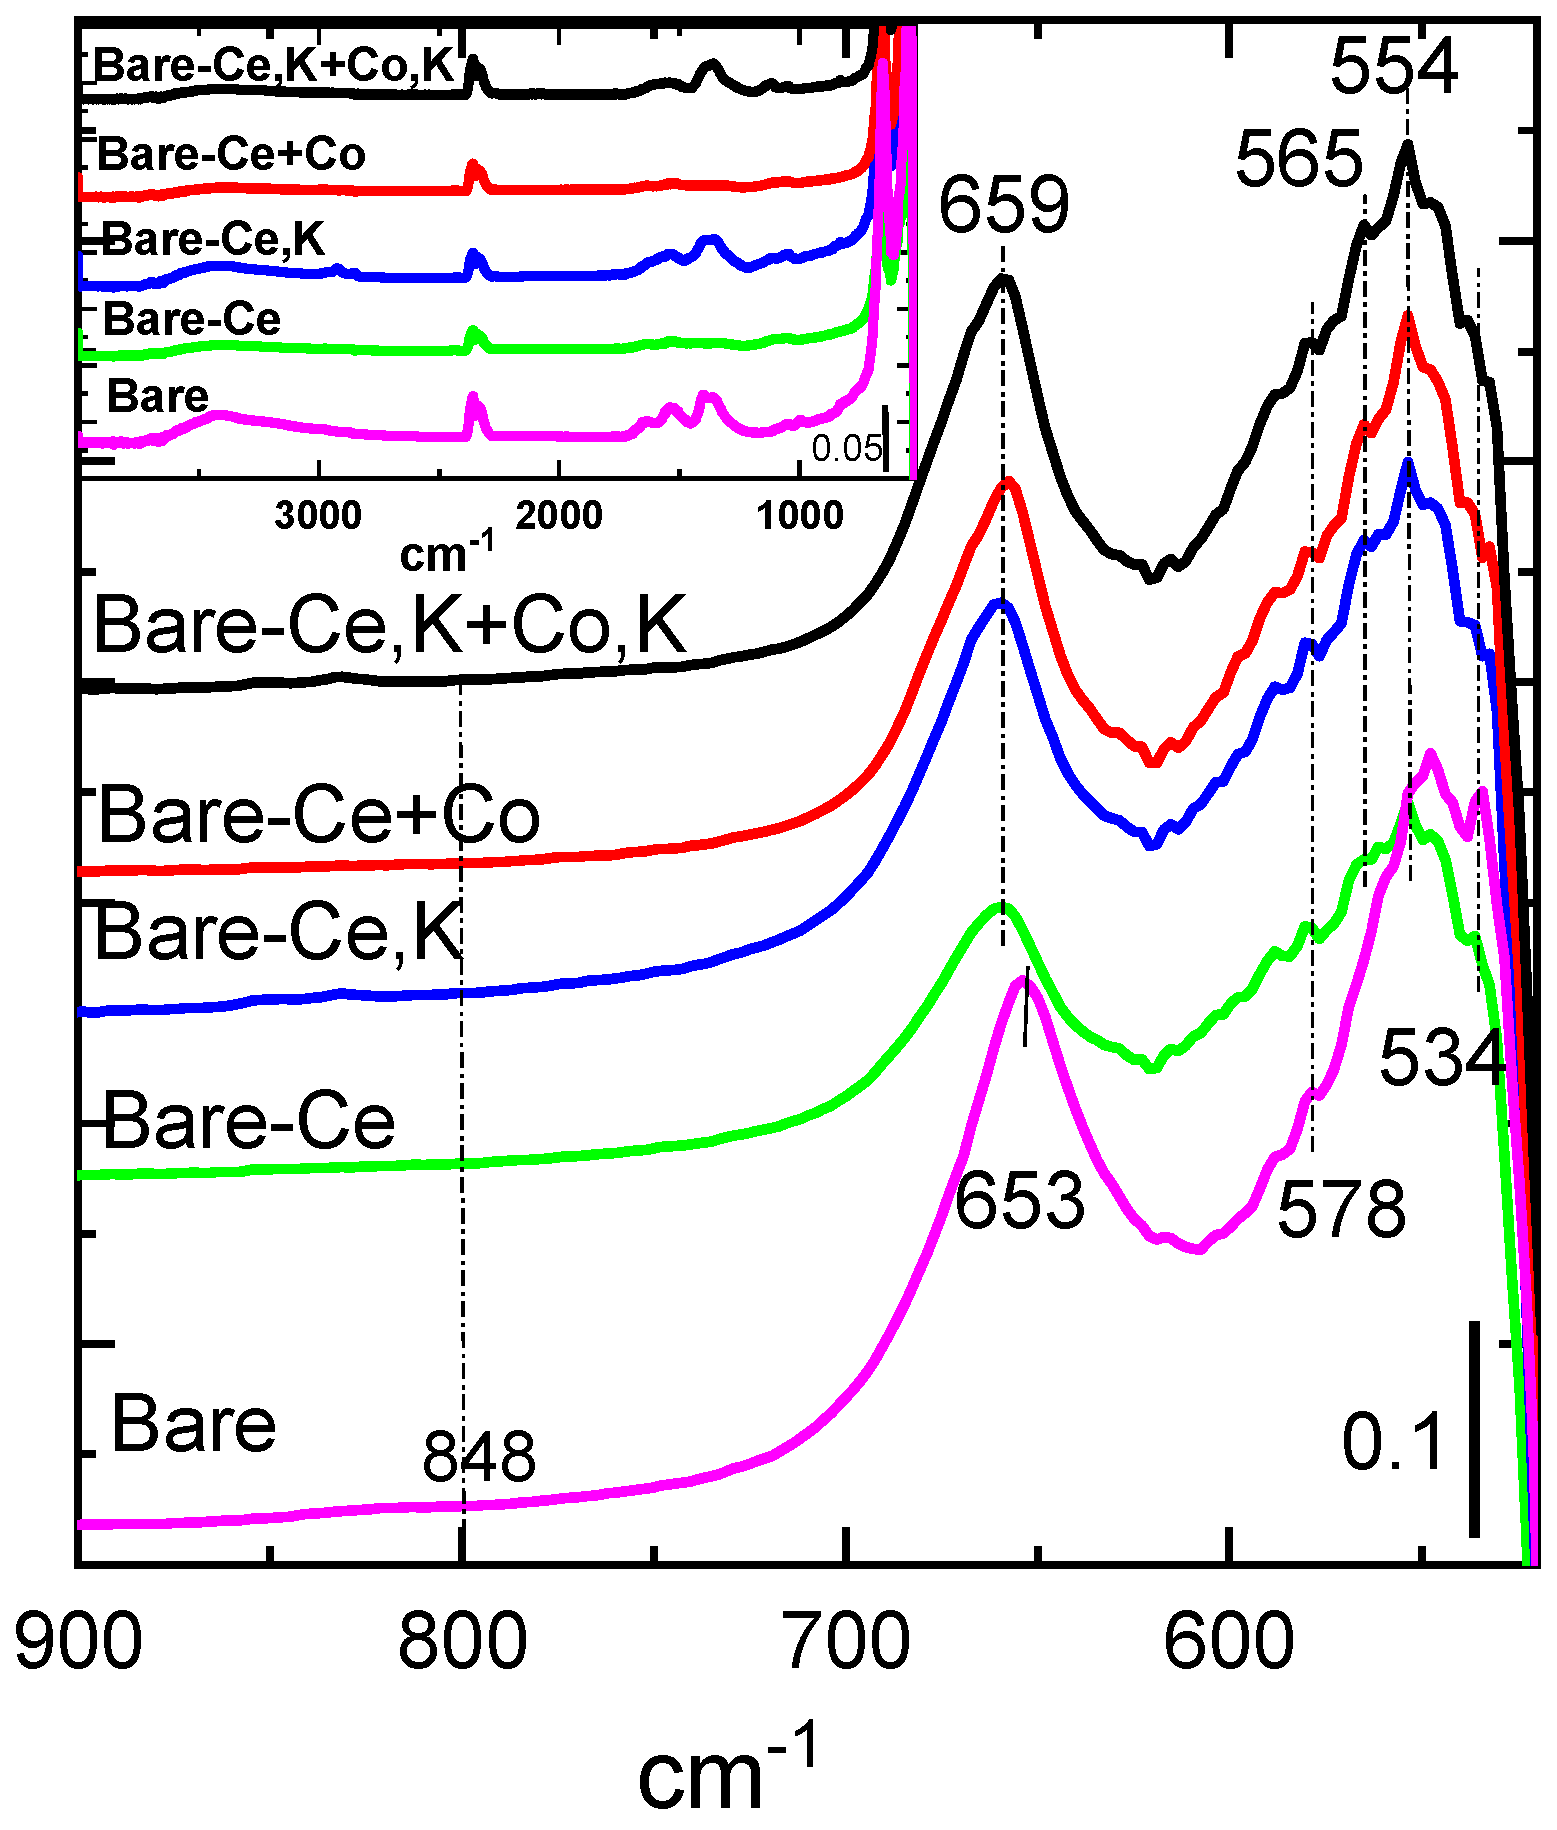
Fourier transform infrared spectroscopy (FTIR) can identify various kinds of molecular bonds existing in solid samples. The obtained FTIR spectra of all catalysts are shown in Figure 4. The spectra have several significant absorption bands recorded in the range of 4000 to 400 cm−1 (inset of Figure 4). The band at 1634 cm−1 and broad absorption band at 2800–3600 cm−1, with a maximum at 3424 cm−1, can be attributed to the OH stretching vibrations of H2O present in the samples [35]. The absorption band at 1643 cm−1 probably corresponds to physically adsorbed water molecules [36,37,38]. Vibration at 1360 cm−1 likely belongs to the rest of the nitrates remaining in the catalysts from the initial components that were precipitated or added to the catalysts by impregnation, which were either not thoroughly washed after precipitation or not fully decomposed during calcination at 500 °C. Similarly, vibrations at 1400 and 1532 cm−1 correspond to CO3 vibrations of the initial sodium carbonate, as it seems that they are connected to each other. Vibrations at 2359 cm−1 can be assigned to non-compensated CO2.
FTIR stretching vibrations of the metal–oxygen bonds can be found in the region of 400–850 cm−1. Stretching vibrations at 554 and 659 cm−1 dominate in the spectra of all catalysts. The positions of both bands (with variations between 560 and 574 cm−1 for the first band and 659 and 661 cm−1 for the second band) were confirmed by many researchers for the spinel structure of Co3O4, which is the main component of our catalysts [39]. The first band ν1 at 554 cm−1 is associated with the vibrations in the spinel lattice, where Co cations appear in octahedral sites, i.e., Co3+ ions. However, it seems that in the IR spectra of our samples, the first band is composed of more than one band. The second band in the IR spectra, ν2 at 658 cm−1, is ascribed to the Co–O bond in Co3O4, where Co appears in tetrahedral sites. In spinel cobalt manganese, stretching vibrations of Co-O and Mn-O were similarly [40] observed at 568 and 656 cm−1, which were attributed to the vibration of atoms in octahedral oxygen environment of Co-O and the vibration of atoms in the tetrahedral oxygen environment related to the Co-O and/or Mn-O in spinels, respectively [41,42].
Typical peaks for the Ce-O stretching vibrations occur at 848 cm−1 and 521 cm−1 [43]. The band observable at 534 cm−1 in our samples is very similar to the published value of Ce-O stretching vibrations, but their intensities are very low and the band at 848 cm−1 is practically invisible.
2.6. Basicity
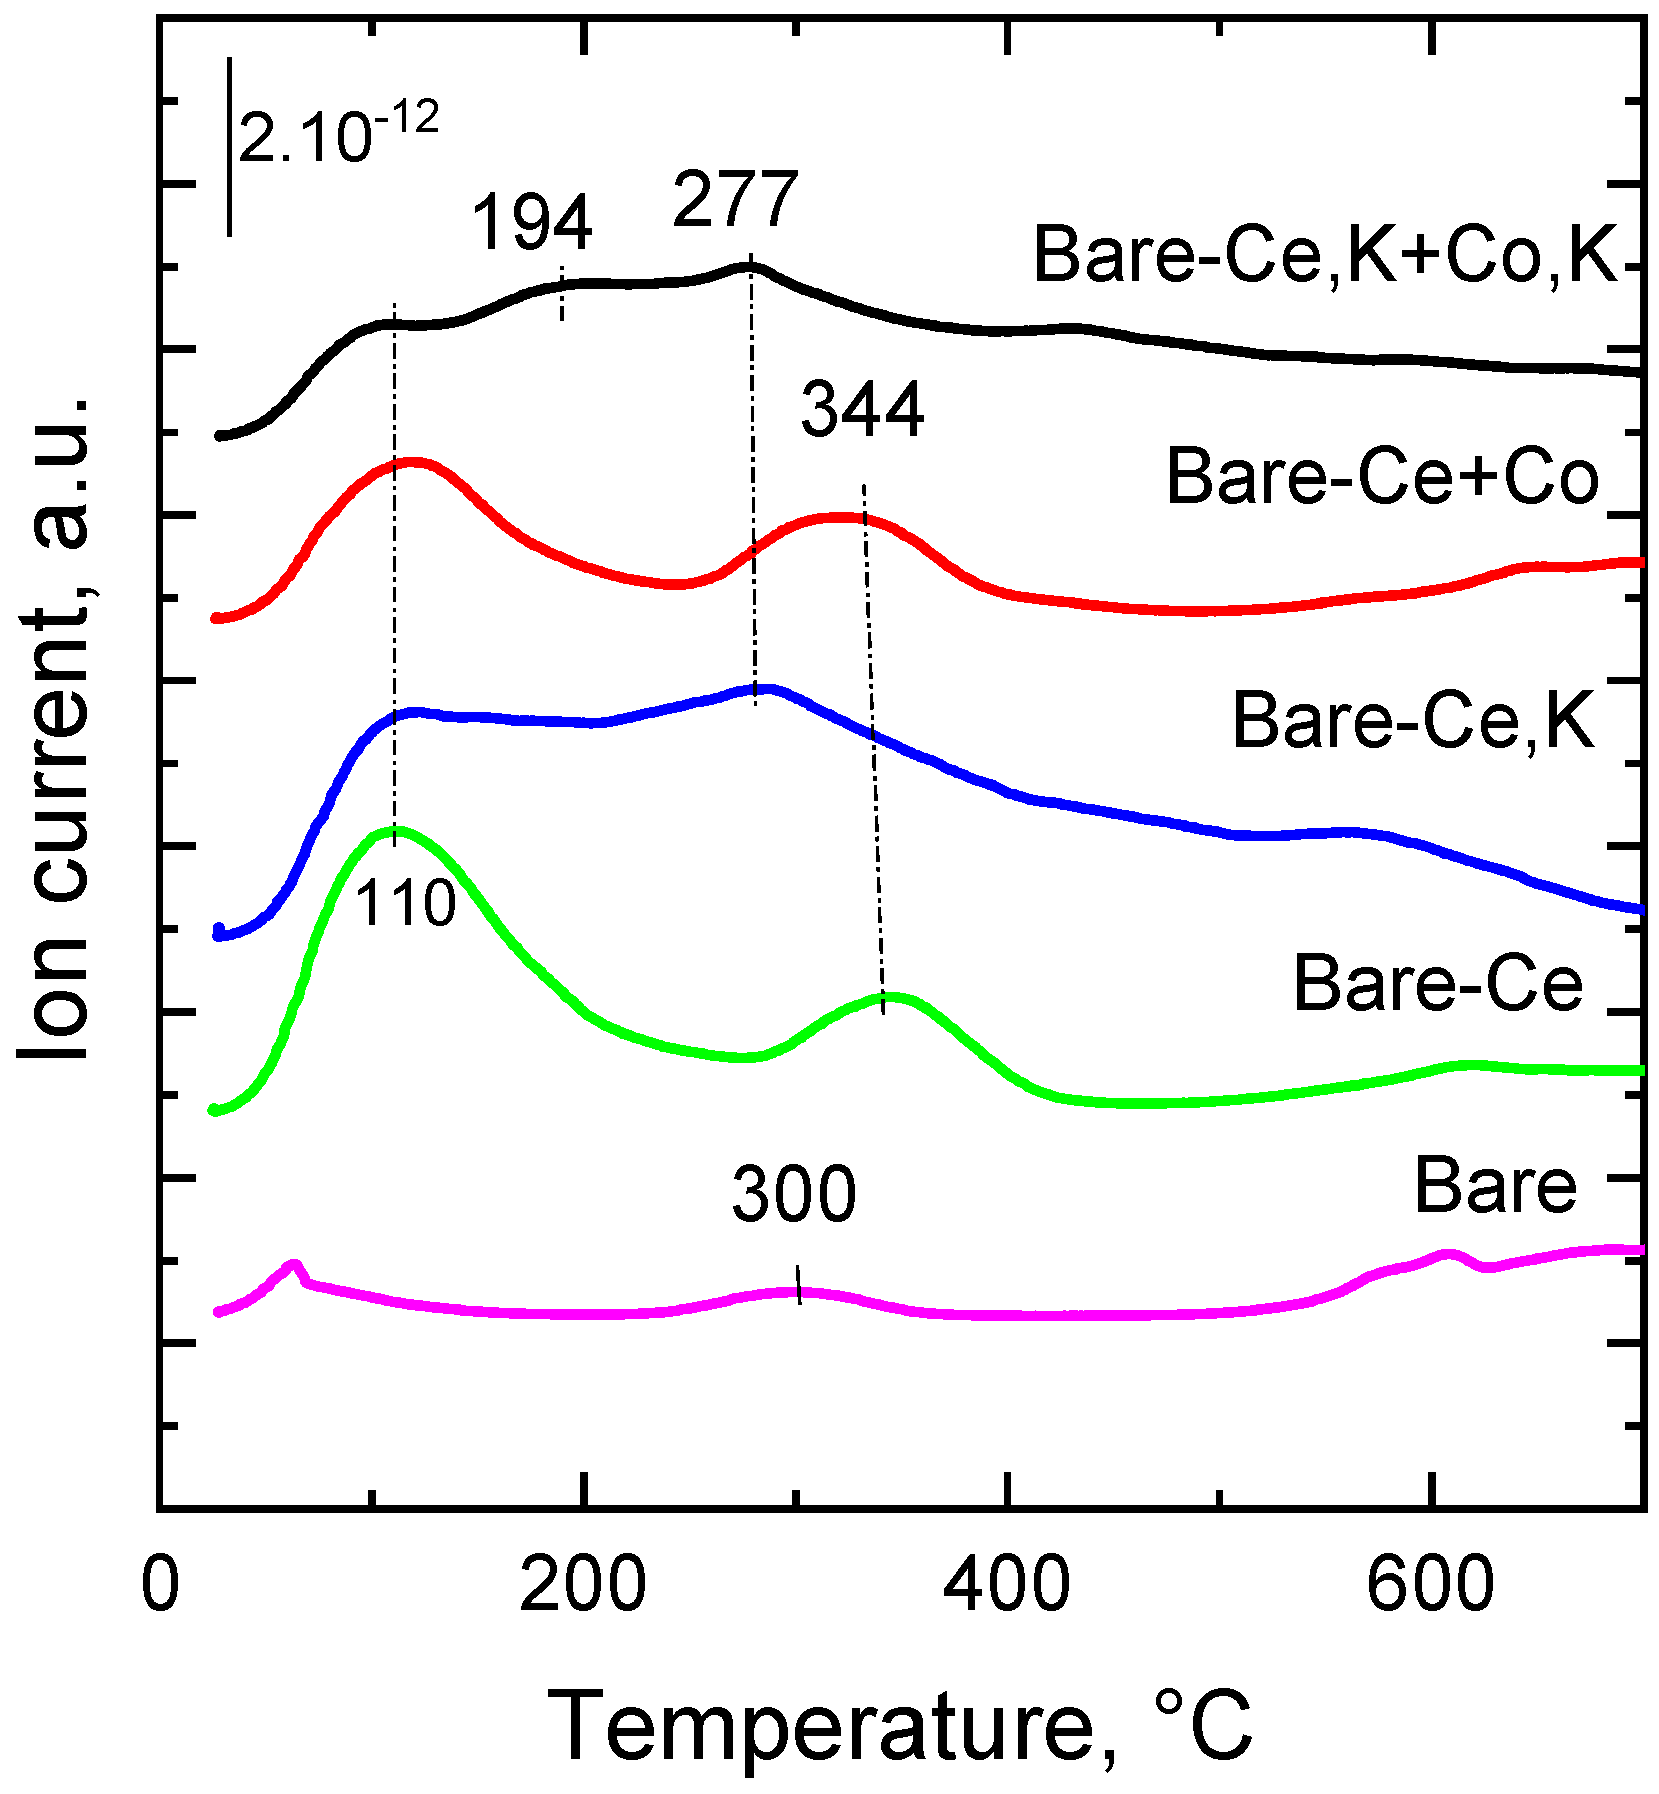
Catalyst basicity is an important factor influencing the chemical reactivity of NO because of the acidic nature of the NO molecule [44]. The basicity of solids can be determined by the temperature-programmed desorption of adsorbed CO2. In the CO2-TPD profiles of mixed oxide catalysts, several types of basic sites can be recognized: weak basic sites occurring on the surface of the catalyst are attributed to –OH groups, medium sites consist of oxygen bonded to metal as Me2+-O2− or Me3+-O2− pairs, and strong basic sites are assigned to isolated O2− anions [45]. Individual peaks below 140 °C can be ascribed to weak basic sites, the peaks appearing in the range of 140–220 °C can be assigned to medium basic sites, and the peaks above 270 °C can be assigned to strong basic sites.
Temperature-programmed desorption patterns of CO2 desorbed from the prepared catalysts are shown in Figure 5. Desorption of CO2 was carried out in the temperature range of 25–650 °C. The data indicate that the catalysts do not include very strong basic sites desorbing at temperatures higher than 400 °C. Distinct desorption peaks can be recognized at 60–110 °C and in the range of 200 to 400 °C. This means that the catalysts comprise basic sites of different strengths, low and medium. The lowest CO2 desorption peak was found for the bare catalyst, with peak maxima at 60 and 300 °C. The lowest basicity of the catalyst is caused by the absence of potassium. The addition of cerium to the bare catalyst induced a substantial increase in the amount of basic sites. However, practically no change in the strength of basic sites was observed. The simultaneous presence of cerium and potassium in the bare-Ce,K catalyst caused a considerable increase in the amount of basic sites of medium strength (Tmax = 100 and 280 °C). The addition of cobalt oxide to the bare-Ce catalyst caused a decrease in the amount of basic sites but a slight shift in desorption peaks to higher temperatures (Tmax = 110 and 340 °C). However, surprisingly, the simultaneous addition of Ce and K shifted the maximum of the CO2 temperature desorption to a slightly lower temperature (from 277 to 194 °C), which means that some stronger basic sites disappeared and new weaker basic sites were formed. At the same time, the intensity of the peak at ca. 110 °C corresponds to the decrease in weak acid sites.
Quantitative data of total basic sites are summarized in Table 3. The bare catalyst showed the lowest amount of basic sites, as transition metal oxides are, in principle, acidic solids [46,47]. Cerium introduced into the bare catalyst manifested itself in the slightly higher concentration of stronger basic sites with temperatures of maximum desorption that were higher than 200 °C (with maximum at ca. 340 °C). The catalysts containing potassium have the highest amount of stronger basic sites (desorbing CO2 in temperature range 200–650 °C).
2.7. Desorption of O2
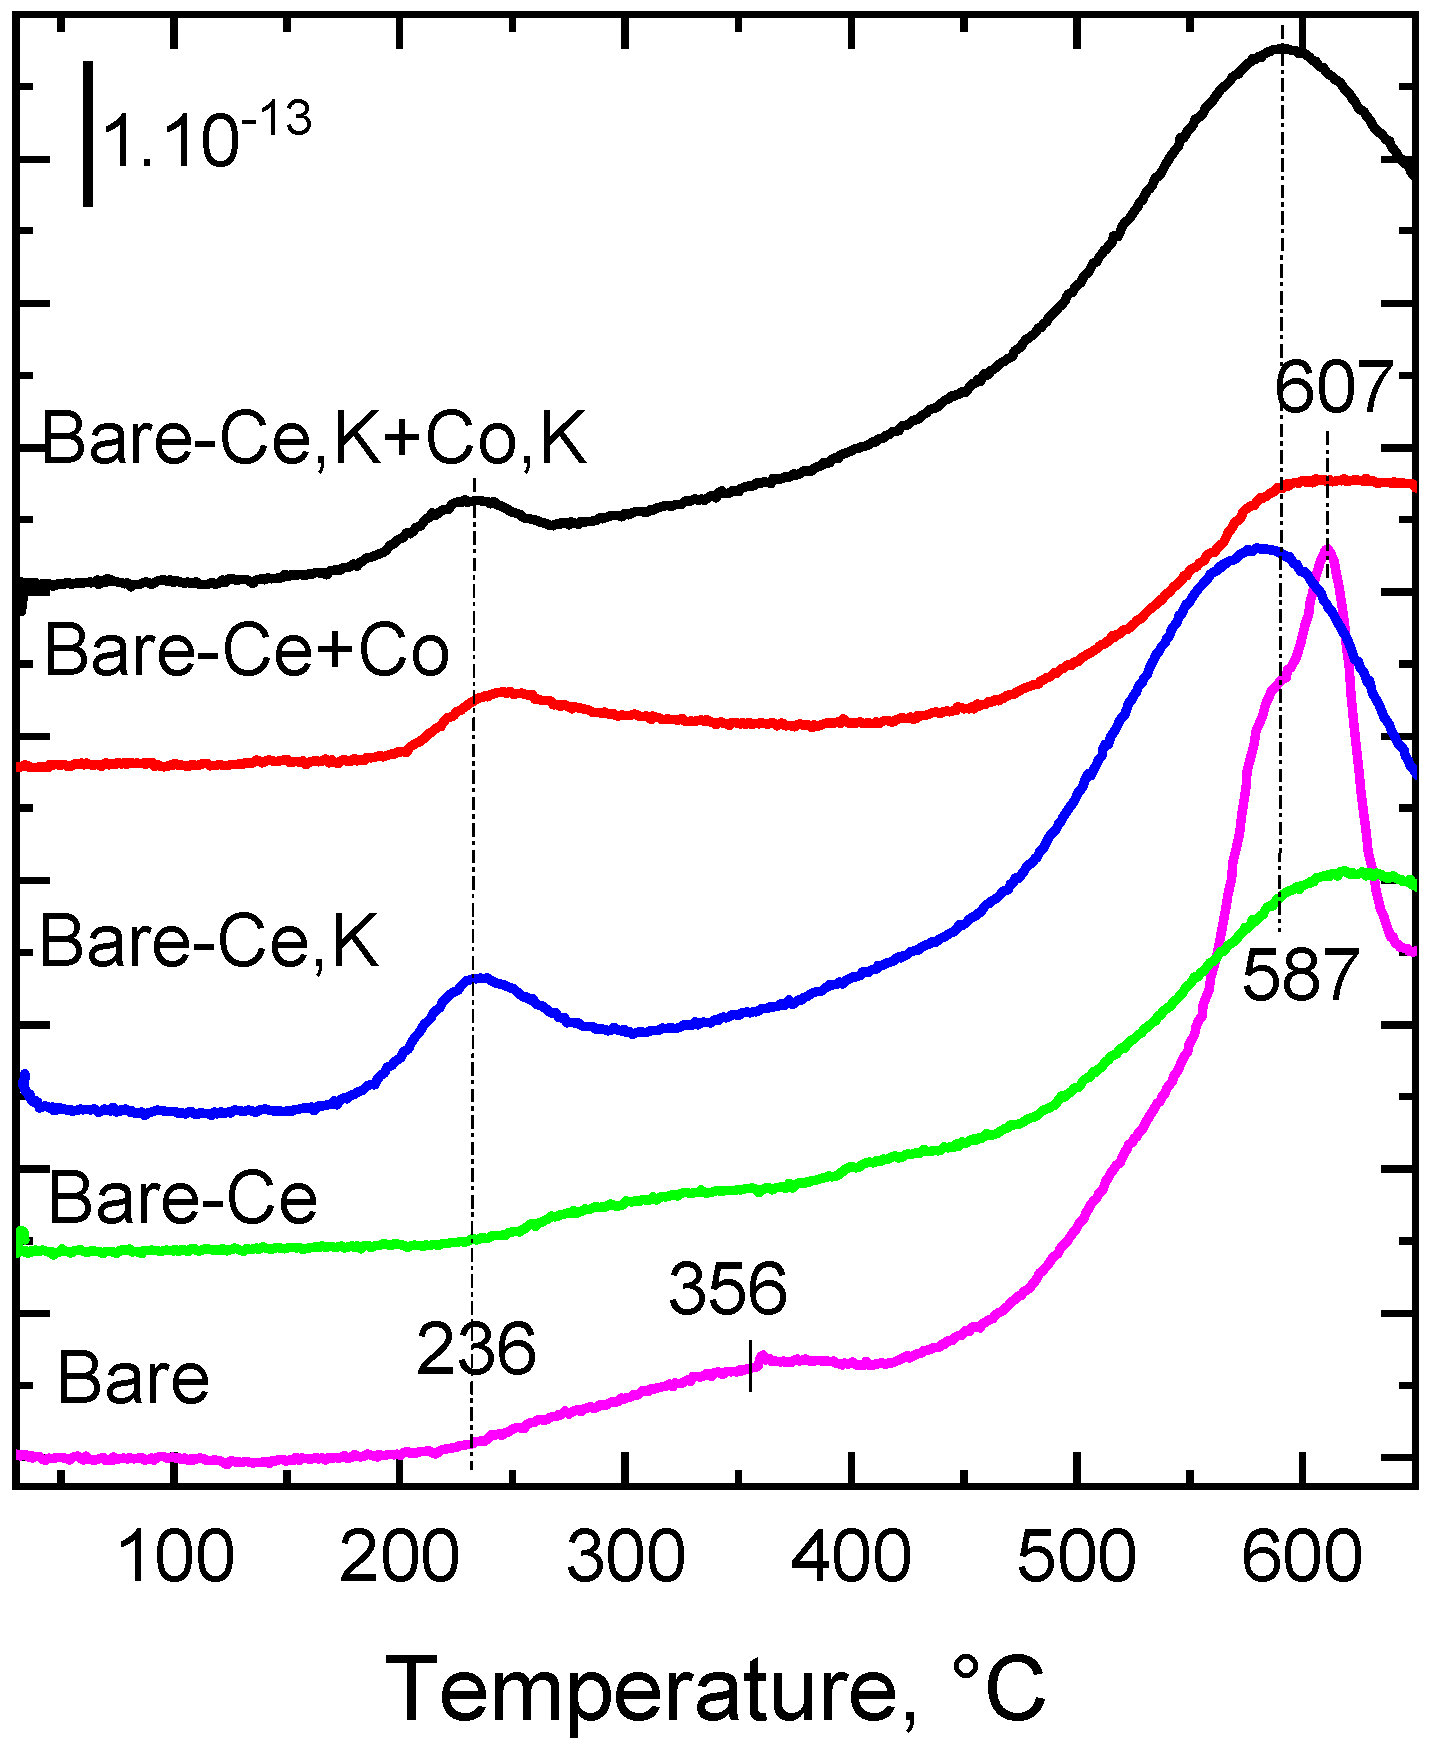
It is known from the literature [15,19] that cerium improves the mobility of oxygen in metal oxides. In order to determine the action of cerium on the mobility of oxygen in the lattice of modified Co-Mn-Al spinel-like oxide, especially in the subsurface region—that is, whether it affects the strength of the metal–oxygen bond—we measured the temperature-programmed desorption of O2 from the fresh catalysts to the inert gas (Figure 6). The non-modified Co-Mn-Al mixed oxide catalyst (bare) showed two main regions of O2 desorption, with the clear temperature maximum at 607 °C attributed to the desorption of lattice oxygen. The broad desorption peak above 230 °C observed in the O2-TPD pattern likely consisted of several overlapping peaks belonging to suprafacial O species [48]. A similar course of O2 desorption from Co-Mn-Al mixed oxide was observed by Karásková et al. [49]. The presence of cerium in the bare catalyst did not cause a substantial change in the course of O2 desorption, whereas the simultaneous presence of cerium and potassium in the catalysts shifted the first temperature maximum desorption to lower values (from 356 to 236 °C) and also shifted the high temperature peak (607 °C) to 587 °C, indicating a decrease in oxygen bond strength. These observations are consistent with the findings of Karásková et al. [50], who found that the modification of the Co-Mn-Al mixed oxide by potassium caused a substantial shift in the temperature maximum observed at 720 °C to lower values (by 250 °C). Nevertheless, the higher concentration of cerium in the bare-Ce,K catalyst, compared to the bare-Ce,K+Co,K catalyst, increased the intensity of the desorption peak detected at 236 °C.
2.8. Surface Composition
The surface composition of the prepared samples was determined by X-ray photoelectron spectroscopy (XPS). The surface concentrations of the elements were determined from the intensities (peak areas) divided by the corresponding response factor [51]. The carbon tape used for the fixing of the samples to the holder manifested itself in a relatively high concentration of C (16–31 mol.%) (Table 4). Nevertheless, the calibration of the spectra was carried out according to carbon 1s (284.8 eV). XPS results corresponding to the binding energies (BE) of several core levels (C 1s, O 1s, Co 2p3/2, Mn 2p, Al 2p, Ce 3d5/2, and K 2p3/2) are summarized in Table S1 and Figure S1 of the Supplementary Materials.
The positions of the BE show that carbon appears in the catalysts as adventitious carbon (C–C bond at 284.8 eV) and as carbon bonded to oxygen by a double bond –C=O (288.5 eV). Binding energies of Co2p3/2 (780.4; 786.3; 782.5 eV) together with the shapes of the spectra agree well with the BE for Co3O4 found in the literature [52]. The BE of Co 2p3/2 electrons is shifted towards higher values compared to pristine Co3O4 (BE = 779.5 eV). This finding could be concerned with the presence of other metallic components and with the formation of spinel CoMnAlO4 in the catalysts.
Manganese in all catalysts shows a main peak at (~642.5 eV), which can be ascribed to the Mn4+ oxidation state. As the peak is quite broad, the catalysts consist of a mixture of at least two manganese states, with BE corresponding to Mn3O4 and MnO2 [53]. The absence of the peak at 647 eV ascribed to the MnO satellite proves the absence of Mn2+ oxide in the catalyst.
The aluminum peak occurs at 73.2 eV, which is a position between metallic Al (73 eV) and completely oxidized Al3+ (Al2O3, 74.5 eV). These findings indicate the bonding of aluminum to other catalyst components like Co (very likely Co aluminate). Potassium 2p shows peaks predominantly at 292.6–292.7 eV. This finding corresponds to the bonding of potassium to metal oxides (like KCoxOy). Some amount of potassium could also be bonded as KNO3 (292.9 eV) [54] because a small amount of nitrogen (406.8 eV), ascribed to nitrates, was found in the bare-Ce,K+Co,K sample.
In the cerium-promoted catalysts, XPS measurement clearly identified cerium. Peak maxima of Ce 3d5/2 appeared at ~882 eV and 917 eV. Both peaks are ascribed to the Ce4+ oxidation state [55]. Moreover, the peak at 880 eV belonging to the Ce3+ oxidation state is missing, which means that oxidation of the initial compound of Ce (cerium trinitrate) completely passed through the calcination step in all catalysts.
The spectrum of O1s shows that oxygen is usually bonded to metal (~530 eV) (lattice oxygen O2−). The peak at ~531 eV can be assigned to oxygen bonded to carbon (C–O single bond) and surface oxygen bonded to metal oxides as O2−, O−, or OH− species) [12,13]. Deconvolution of the O1s peak led to different portions of the two peaks, with maxima at 529.3 and 531.6 eV (Table 5). The bare catalyst and the two catalysts containing cerium (Bare-Ce and Bare-Ce,K) contain less oxygen bonded to metal as lattice oxygen O2− than adsorbed oxygen bound to metal oxides as O2−, O−, or OH− species or to carbon. After impregnation of the latter catalysts by cobalt or cobalt with potassium, and, therefore, with the decrease in cerium concentration, the portion of oxygen bonded to metal as lattice oxygen was higher than the second one.
Compared to the non-modified Co-Mn-Al mixed oxide catalyst (bare), the presence of Ce and Ce+K in the catalysts led to the gradual decrease in the BE of all elements (Co, Mn, Al, Ce, and O). The BE shift to lower values after K promotion was also described in our previous work [56]. The shift indicated an increase in electron density and a change in the electronic states of metals to lower valence states [57,58]. This phenomenon can be interpreted as electron donation from K to oxygen anion surroundings and to further charge transfer towards cobalt, manganese, and aluminum [59].
Surface concentrations of Co, Mn, Al, Ce, and K in mol.% were recalculated to wt.% (Table S2) in order to compare them with those obtained by chemical analysis. Ratios of the two sets of data are given in Table 6. In the bare catalyst, the surface concentration of Co is roughly the same as the bulk, whereas surface concentrations of Mn and especially of Al are substantially higher (1.5 and 3.4 times, respectively). When cerium was incorporated into the solids during coprecipitation, the distribution of metals in the catalysts did not differ significantly from that in the bare catalyst. Only the surface concentration of Mn decreased because of the presence of cerium. The involvement of K nitrate in the coprecipitated solutions resulted in a high concentration of K on the catalyst’s surface, roughly five times higher than in bulk. This finding is not surprising, as it is known [11,60] that the migration of K from the interior of particles to their surface proceeds during calcination.
After impregnation of the bare-Ce catalyst with Co nitrate, the surface concentration of cobalt surprisingly decreased, while those of manganese and cerium increased. It is very likely that the redistribution of manganese and cerium occurred during the impregnation of the solid by the aqueous solution of Co nitrate, which resulted in the migration of the metals to the surface during catalyst preparation (impregnation, drying, calcination). A similar result as mentioned above was observed with bare-Ce,K+Co,K after impregnation of the bare-Ce,K catalyst with Co and K nitrates and catalyst calcination. Surface concentrations of Co remained more or less the same as in the bulk, but the surface concentration of Mn considerably increased. The surface concentration of Ce increased only slightly, but the catalyst surface was significantly enriched by potassium (five times) in comparison with bulk.
2.9. Catalytic Activity
The effect of cerium on the catalytic activity of the Co-Mn-Al mixed oxides in direct NO decomposition was studied across the catalysts with various concentrations of Ce and K. Conversions of NO obtained at 650 °C are summarized in Table 3. The pure precipitated Co-Mn-Al mixed oxide catalyst not containing potassium (bare) is nearly inactive in NO decomposition at 650 °C. Some activity observed with this catalyst can be attributed to the presence of sodium [61] on the surface remaining in the solid after the washing process in the course of its preparation. The addition of cerium(III) nitrate to the other nitrates before precipitation of the bare-Ce catalyst did not increase catalytic activity at all: the catalyst remained inactive, though we expected some increase due to the supposed higher mobility of oxygen in the mixed transition metal oxides. The simultaneous addition of Ce and K during precipitation of the bare-Ce,K catalyst resulted in a substantial increase in the catalytic activity: the conversion of NO at 650 °C met the value of 20.1%. However, the activity of this catalyst was lower compared to the activities of previously studied catalysts of a similar composition [12,13]. The reason for such findings could be the low concentration of the main active component, cobalt, and, for this reason, we added cobalt to the bare-Ce catalyst by impregnation. However, the activity in NO decomposition was negligible again. The desirable substantial enhancement in activity was not observed, even after the addition of cobalt and potassium to the bare-Ce,K catalyst prepared by its simultaneous impregnation with Co and K nitrates. The achieved NO conversion was only 24%. Based on our experiments, we must conclude that cerium did not contribute to the achievement of higher activity of the Co-Mn-Al mixed oxide catalyst in direct NO decomposition.
We were interested in determining whether cerium in the transition mixed oxide can contribute to the higher resistance of the catalysts to the inhibiting components usually present in industrial flue gases, like O2, CO2, or H2O. The most active bare-Ce,K+Co,K catalyst containing cerium was subjected to the investigation of stability in NO conversion in the presence of 2 mol.% O2, 2 mol.% CO2, and a mixture of 2 mol.% of both O2 and H2O. It follows from Table 7 that the presence of O2 in the reaction mixture decreased NO conversion at 700 °C from 30% to 4% (i.e., by 87 rel.%), which was fully recovered after the removal of O2. Addition of CO2 did not have such a strong deactivation effect as O2, because NO conversion decreased from an initial 30% to only 10.4% (i.e., 65 rel.%). A near complete recovery of NO conversion (29.0%) was observed when CO2 was removed from the reaction mixture. Therefore, it can be concluded that the presence of O2 in the reaction mixture decreased initial NO conversion drastically, whereas CO2 caused a smaller reduction in NO conversion. It is very likely that the adsorption of both components either blocks the adsorption of NO or slows down desorption of N2 and O2.
The simultaneous addition of O2 and H2O caused a similar decrease in conversion as pure O2. The decrease in NO conversion (85 rel.%) after 2 mol% O2 addition to the reaction mixture was similar to that observed with the Co4MnAlOx catalyst containing 2 wt.% of potassium [62], where the decrease in conversion was 88 rel.% (from 55% to 6.2%).
There was almost no difference in the action of the (H2O and O2) mixture and the action of pure O2. After removal of O2 and CO2 from the reaction mixture, the activity was restored almost completely. However, it is necessary to state that the presence of cerium in the Co-Mn-Al catalysts did not manifest itself positively in both catalytic activity and resistance to inhibition of catalytic activity by other components present in the gaseous reaction mixture.
3. Discussion
In this paper, the effect of cerium and/or potassium on the Co-Mn-Al mixed oxide catalyst’s quality and catalytic activity in the direct decomposition of NO was examined. The catalyst containing neither potassium nor cerium (bare) was prepared by precipitation of corresponding nitrates. The same procedure of preparation was used for the catalysts modified by cerium and cerium plus potassium (bare-Ce and bare-Ce,K). The molar ratio of Co:Ce in the catalysts modified with cerium was approximately 4:3. The molar ratios of Co:Mn:Al in the precipitated catalysts were roughly the same as in the bare catalyst, i.e., 4:1:1. The cerium modified catalysts were additionally impregnated with either Co(NO3)2 or a mixture of both Co(NO3)2 and KNO3 in order to increase the concentrations of Co and K in the catalysts. Application of the preparation procedure led to the catalysts with various concentrations of cerium and potassium in the catalysts whose physico-chemical properties were studied and compared with those of the bare catalyst. Impregnation of the Ce-containing catalysts with either cobalt or cobalt and potassium nitrate decreased the molar ratios of manganese, aluminum, and cerium to cobalt by roughly 30%.
As shown in the XRD profiles of the calcined catalysts, all catalysts exhibited identical crystallographic phases of the Co-Mn-Al mixed oxide with spinel structures (Figure 1). Clear positions of CeO2 were proven in the catalysts containing cerium. The catalyst not containing cerium showed a length of coherent domains D equal to 10.21 nm. Incorporation of cerium into the Co-Mn-Al mixed oxide led to no significant change in the length of spinel domains (10.48 and 10.28 nm). However, a substantial increase in the spinel domains was observed (D = 13–15 nm) when the two samples containing cerium were impregnated with additional amounts of cobalt or cobalt and potassium and repeatedly calcined. The length of the coherent domains of CeO2 occurring in the bare-Ce or bare-Ce,K catalyst was substantially smaller (only 4.8–5.1 nm) than that of cobalt spinel domains. Again, subsequent impregnation with repeated calcination of the catalysts caused a slight increase in the sizes of CeO2 (6.1–6.8 nm). Nevertheless, the addition of cerium to the Co-Mn-Al catalysts seems to increase the length of coherent domains of cobalt mixed oxide as, very probably, cerium enters the lattice of cobalt oxide spinel.
FTIR measurements proved the presence of some residues of the initial compounds used in the procedure of catalyst preparation (OH groups, nitrates, and carbonates). They remained in the solids even after the calcination step. The presence of nitrates could affect the basicity of the catalysts, especially the amount of stronger basic sites (Tmax of CO2 desorption > 220 °C). As basicity is the opposite feature to acidity, we were interested in the relationship between the basicity of catalysts and their composition. We applied the electronegativity of mixed oxides as a value characterizing catalyst basicity. Electronegativities of Co3O4, Mn2O3, Al2O3, CeO2, and K2O mixtures were calculated from the electronegativities of corresponding metal ions (Xion) under the assumption of additive behavior of this property and using molar fractions of the oxides (xoxide) as weights:
Xi = xCo3O4XCo3+ + xMn2O3XMn3+ + xAl2O3XAl3+ + xCeO2XCe4+ + xK2OXK+
Generalized electronegativity of metal ions (Xion) were calculated according to Sanderson [63] by the relation Xion = (1 + 2Z)Xo, where Z is the charge of the ion and Xo is the electronegativity of a metal, given by Pauling. It follows from Figure 7 that the basicity of the catalysts (mmol CO2 g−1 in the range 25–650 °C, Table 3) decreased proportionally with increasing electronegativity of the catalysts (Figure 7), calculated according to Sanderson [63] and Tanaka and Ozaki [47]. As the basicity of the catalysts is important for achieving high catalytic activity in NO decomposition, calculation of electronegativities according to the method described above can serve as the first piece of information about the basic properties of new catalysts intended for NO decomposition.
H2-TPR showed no significant difference in the amounts of reducible components in the catalysts, while their reducibilities, defined by the Tmax of the 1st H2-TPR peak, differed significantly. NO conversions were observed only in the catalysts with the highest reducibility (lowest Tmax of the 1st H2-TPR peak), caused by the presence of potassium.
As for XPS data, the bare catalyst without cerium showed a slight enrichment of the surface with Mn and substantial enrichment by Al. Compared to the bare catalyst, precipitated catalysts containing cerium differed in decreased surface concentration of Al and Mn, which proceeded at the expense of cerium. After impregnation of the cerium containing catalysts with Co or Co+K nitrates, surface concentrations of manganese and cerium surprisingly increased. It is very likely that the redistribution of manganese and cerium occurs during impregnation of the solids by aqueous solution of Co nitrate (or Co+K nitrates), which resulted in the migration of Mn and especially K to the surface during catalyst preparation (impregnation, drying, calcination).
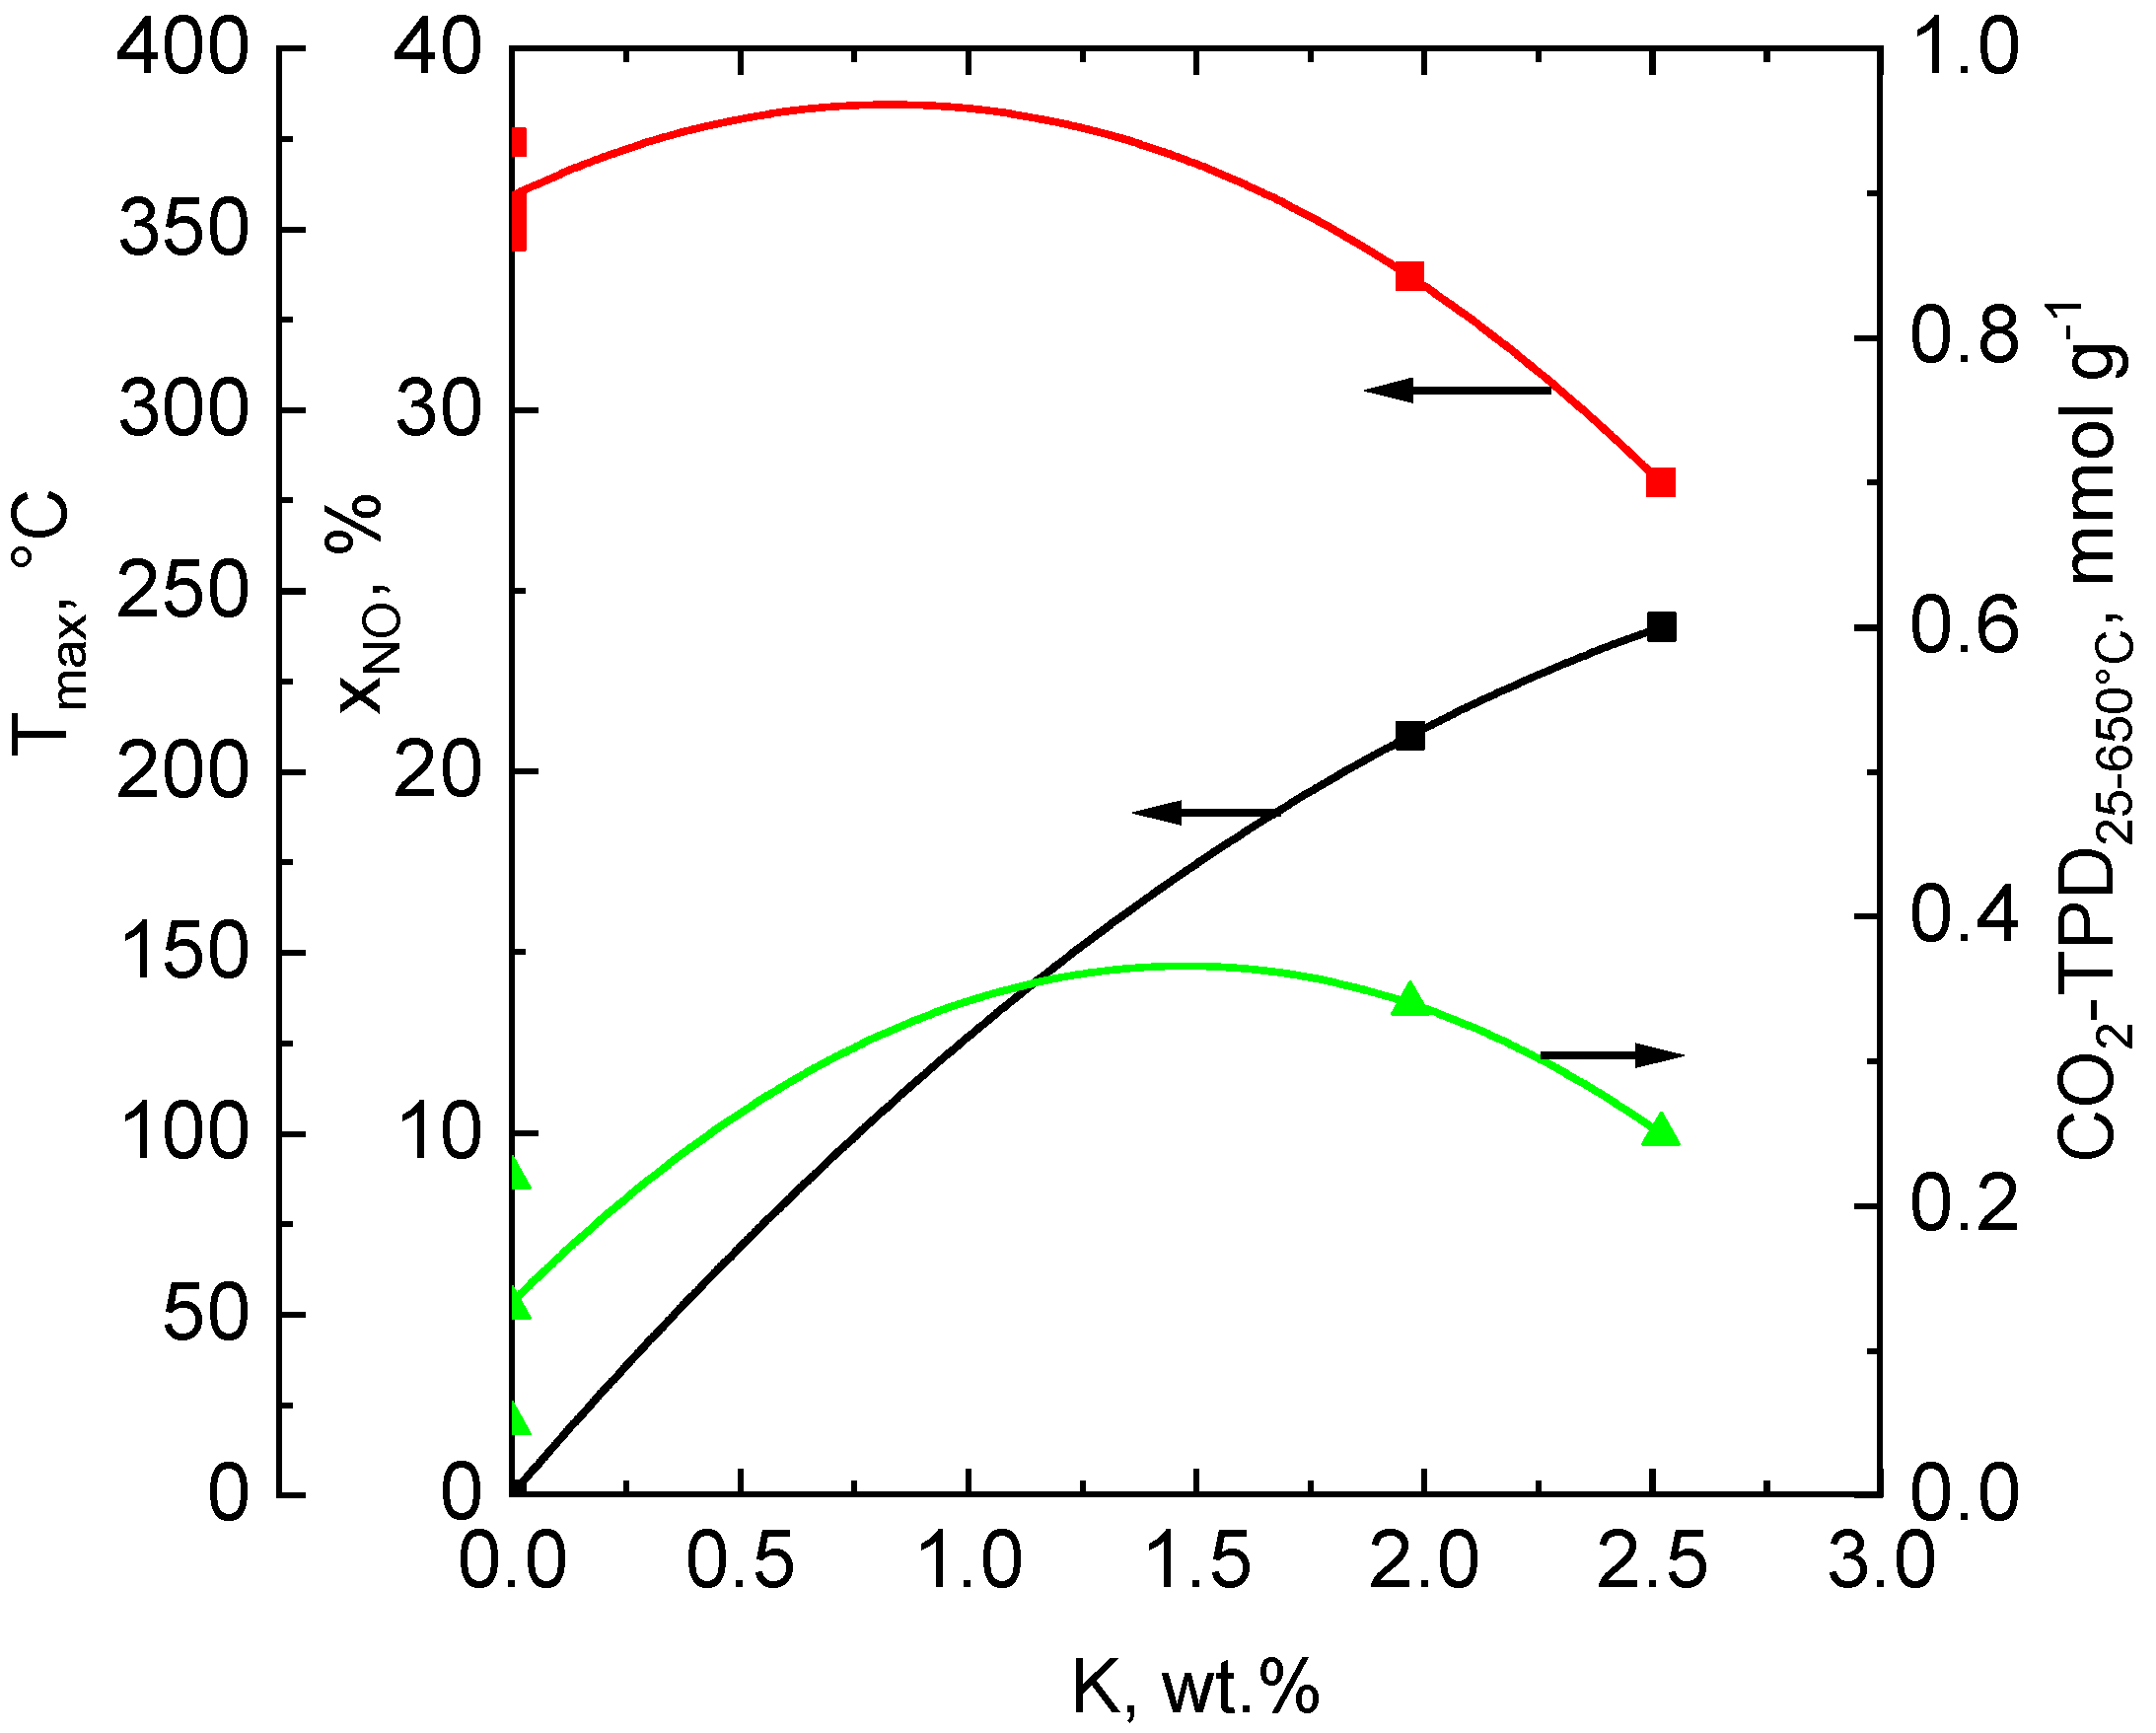
The catalytic activity of the Co-Mn-Al oxide catalysts in direct NO decomposition varied with the concentration of K in the solids. The catalysts not containing potassium (bare and bare-Ce) were entirely inactive in the reaction in comparison with the bare-Ce+K catalyst. The findings agree well with the results published previously [12,13,64]. In Figure 8, the dependence of NO conversion, basicity, and reducibility on the concentration of K in the catalysts is depicted. It is obvious that the conversion of NO increases continuously from zero value to ca. 25% with increasing concentrations of K in the catalysts and meets the highest value when the catalyst contains about 2.5 wt.% of K.
The presence of alkali metals and especially of potassium in the cobalt-containing solids is important as it affects the strength and amount of basic sites and the reducibility of the catalysts. Potassium due to its low ionization potential enables the charge transfer to the transition metal cations, inducing an electric field gradient at the surface generated by the resulting dipole and modification of the density of state characteristics [65]. Basic sites present in the catalyst substantially affect the sorption of NO on the catalyst surface, and, therefore, the amount of basic sites and their strength is very important for the achievement of high catalytic activity. In addition, the optimal reducibility of active sites is essential in order to gain high activity of the Co-Mn-Al catalyst in the direct decomposition of NO, as the reaction proceeds by the redox mechanism [2]. We have found that a combination of optimal reducibility with a high amount of stronger basic sites (CO2 desorbing in the range of 200–650 °C) is necessary for the achievement of an active catalyst for NO decomposition. The findings confirm that the plain content of cobalt in the catalyst and its raising is not responsible for the attainment of high catalytic activity in direct NO decomposition, but a mixture of both reducing sites and stronger basic sites is necessary in this kind of catalyst.
4. Materials and Methods
4.1. Catalyst Preparation
Bare Co-Mn-Al mixed oxide with a molar ratio of Co:Mn:Al = 4:1:1 containing neither Ce nor K was prepared by the coprecipitation of transition metal nitrates with the aqueous solution of Na2CO3+NaOH at pH 10. An aqueous solution (400 mL) of appropriate nitrates, i.e., Co(NO3)2.6H2O, Mn(NO3) 2.4H2O, Al(NO3)3.9H2O, and a total metal ion concentration of 1.0 mol l−1 was added, with a flow rate of 7.5 mL min−1, into 100 mL mixed flow reactor. The flow rate of simultaneously added alkaline solution of 0.5M Na2CO3 and 3M NaOH was controlled to maintain reaction pH 10.0 ± 0.1. The coprecipitation was carried out under vigorous stirring at 25 °C. The resulting suspension was relocated to a tank, where it was stirred for 2 h at 25 °C. The product was filtered, washed several times with distilled water, and dried overnight at 80 °C in air. The dried product was heated at 500 °C for 4 h in air. The calcined sample was crushed and sieved to obtain the fraction of particle size 0.160–0.315 mm, which was used for further examinations. The catalyst was labeled as bare.
Similarly to the bare catalyst, the Co-Mn-Al-Ce-(K) mixed oxide was prepared by the coprecipitation of the transition metal nitrate solutions also containing Ce(NO3)3 with the aqueous solution of Na2CO3+NaOH, eventually containing potassium nitrate, at pH 10. After washing, the samples were dried at 80 °C and calcined 4 h at 500 °C. The catalysts were labeled as bare-Ce and bare-Ce,K.
In order to increase the Co and (Co+K) concentrations in the catalysts, the bare-Ce and bare-Ce,K samples were impregnated by a solution of Co and (Co+K) nitrates, respectively, and after drying at 105 °C, they were calcined at 500 °C for 4 h. The prepared catalysts were labeled as bare-Ce+Co and bare-Ce,K+Co,K.
4.2. Catalyst Characterization
The catalysts calcined at 500 °C were characterized by MP-AES (atomic emission spectroscopy with microwave plasma), nitrogen physisorption (SBET), H2-TPR, XRD, FTIR, XPS, O2-TPD, and CO2-TPD.
The content of metals in the prepared catalysts was determined by an Avio 500 MP-AES (Perkin-Elmer, Chichester, UK) after dissolution of the samples in diluted (2 wt.%) hydrochloric acid.
Phase composition and microstructural properties were determined using the X-ray powder diffraction (XRD) technique. XRD patterns were obtained using a Bruker D8 Advance Eco (Bruker, Karlsruhe, Germany) equipped with a silicon-strip linear LynxEye XE-T detector (Bruker, Karlsruhe, Germany) in 1D mode, eliminating fluorescence and Kß line. The source of X-ray irradiation was a Cu tube (CuKα, λ = 0.15418 nm) operated at 40 kV and 25 mA. Incident slits were set up to 0.658 mm, and slits on the diffracted beam were set up to 4.5 mm. The powder was placed into the holder with a hole (diameter 10 mm, depth 1mm) and aligned to the plane. Bragg–Brentano geometry was used for measurement. The samples were rotated (20 rpm) during the measurement to eliminate the preferred orientation effect. The XRD patterns were collected in a 2θ range of 10–80°, with a step size of 0.02° and speed of 0.6 deg.min−1. Measured XRD patterns were evaluated using the DIFFRAC.EVA software (version 5.1.2.5) and compared with the PDF-2 database issued by ICDD, released in 2019.
Nitrogen physisorption on catalyst powders (grain size 0.16–0.32 mm) was performed using an ASAP 2020 Micromeritics instrument (Norcross, Atlanta, GA, USA)) after degassing at 105 °C for 24 h at 1 Pa vacuum. The adsorption–desorption isotherms of nitrogen at −196 °C were evaluated by the standard Brunauer–Emmett–Teller (BET) procedure for the p/p0 range = 0.05–0.25 to calculate the specific surface area SBET. Mesopore surface areas, Smeso, and micropore volume, Vmicro, were determined by the t-plot method [66]. Total pore volume, Vtotal, was determined from nitrogen adsorption isotherm at maximum p/p0 (∼0.995). The pore size distribution (pore radius 100–102 nm) was evaluated from the adsorption branch of the nitrogen adsorption–desorption isotherm by the Barrett–Joyner–Halenda (BJH) method [67], assuming a cylindrical pore geometry. The Lecloux–Pirard standard isotherm [68] was used for the t–plot and for the pore size distribution evaluation.
Temperature-programmed reduction (H2-TPR) measurements were performed with a H2/N2 mixture (10 mol.% H2), flow rate of 50 mL min−1, and a linear temperature increase of 20 °C min−1 up to 650 °C. Changes in H2 concentration were detected with a catharometer. A reduction of grained CuO (0.160–0.315 mm) was performed to calculate absolute values of the hydrogen consumed during reduction of the samples.
Temperature-programmed desorption of CO2 (CO2-TPD) was carried out to examine basic properties of the catalysts’ surfaces. The measurements were accomplished with a 0.050 g sample in the temperature range of 20–650 °C, with helium as a carrier gas and CO2 as the adsorbing gas. Prior to the CO2-TPD measurement, the sample was heated in helium from 25 to 500 °C, with a temperature ramp of 20 °C min−1; then, the sample was cooled in helium to 25 °C. Ten doses of CO2, 840 μL each, were applied to the catalyst sample at 30 °C before flushing with He for 1 h and heating at a rate of 20 °C min−1. The composition of gases evolved during the experiments was determined by a mass spectrometer (Balzers). The following mass contributions m/z were collected: 2-H2 and 44-CO2. The spectrometer was calibrated by dosing the known amount of CO2 into the carrier gas (He) in every experiment. The H2-TPR and CO2-TPD experiments were evaluated using OriginPro 8.0 software with the accuracy of ±5%.
Temperature-programmed desorption of oxygen (O2-TPD) were carried out with a sample amount of 0.05 g. The catalysts were pretreated in He flow (50 mL/min−1) at 500 °C for 1 h and then cooled to 30 °C. A mixture of 20% O2/N2 (30 mL/min−1) was introduced as the adsorbate gas at 30 °C for 1 h. Then, the system was purged by He (30 mL/min−1) until no change in the O2 signal was detected. The catalyst was heated at a rate of 20 °C/min to 500 °C. The mass number m/z 32-O2 was monitored by the OmniStar GSD 200 quadrupole mass spectrometer (Balzers, Pfeiffer Vacuum, Asslar, Germany) during the heating. The TPD results were evaluated using the OriginPro 8 software with an accuracy of ±5%.
An Avatar 360 (Nicolet, Analytical Instruments Brokers LLC, Golden Valley, MN, USA) FTIR spectrometer was used in ATR mode to obtain spectra from catalysts between 360 and 4000 cm−1 (resolution 1.93 cm−1, 300 scans, 1 s per scan) when the powder was pressed against the ZnSe crystal (working range between 508 and 4000 cm−1).
Surface elemental analyses were performed by XPS (X-ray Photoelectron Spectrometer Kratos ESCA 3400, Kratos, Manchester, UK) at a base pressure better than 5·10−7 Pa, using the polychromatic Mg X-ray source (Mg Kα, 1253.4 eV). Composition of the elements was determined without any etching. For the spectra, the Shirley background was subtracted, and elemental compositions of layers were calculated from the corresponding areas.
4.3. Catalyst Testing
The catalytic decomposition of NO to N2 and O2 was performed in an integral fixed bed stainless steel reactor with a 5-mm internal diameter (0.5 g of catalyst, total flow of 49 mL min−1). The inlet gas was composed of 1000 ppm NO in N2, O2 (0–10 mol.%), and water vapor (0–10 mol.%) was added to some catalytic runs. The catalysts (fraction 0.16–0.316 mm) were pre-calcined in situ at 650 °C in a mixture of N2 + 2 mol.% O2 (50 mL min−1 at 101,325 Pa, 20 °C) for 1 h before catalytic measurements. Infrared analyzers for online analysis of NO (Ultramat 6, Siemens, Karlsruhe, Germany) and N2O (SICK MAIHAK GmbH, Reute, Germany) were used. During all measurements, no N2O and no NO2 were detected, as proven by the low-temperature NO2/NO catalytic convertor (TESO Ltd. (Technical services for air protection, Inc.)), Prague, Czech Republic). The activity of the catalysts was determined as conversions of NO from the relation XNO = (cNOo − cNO)/cNOo, where XNO is NO conversion, cNOo is the initial NO concentration, and cNO is the NO concentration at the reactor outlet.
5. Conclusions
The bare Co-Mn-Al mixed oxide catalyst with a molar ratio of Co:Mn:Al = 4:1:1, not containing cerium and potassium, was practically inactive in the direct decomposition of NO at temperatures around 650 °C. Despite the assumption, cerium introduced into the bare catalyst did not contribute to higher activity of the catalyst in the examined reaction, whereas a combination of Ce and K did. Variation of the cobalt content in the catalyst with cerium did not change the low activity of the catalyst in the mentioned reaction. The catalyst with a molar ratio of Co:Mn:Al:Ce:K = 4:0.6:0.7:2.1:0.6 showed the highest conversion of NO at 700 °C, equal to 30%. This catalyst was strongly deactivated by O2 and to a lesser extent by CO2 occurring in the reaction mixture. Deactivation of the catalyst caused by both O2 and CO2 is reversible. Water vapor in the mixture with O2 present in the reactant did not essentially change the extent of deactivation observed with oxygen in the reaction mixture. An important result of this work is that the presence of cerium in the Co-Mn-Al-K catalyst neither increased catalytic activity in NO decomposition nor improved its stability during the reaction, with reactants including O2, CO2, or H2O+O2, compared to the cerium non-modified Co-Mn-Al-K.
Supplementary Materials
The following are available online at https://www.mdpi.com/2073-4344/10/7/808/s1, Figure S1: Deconvoluted XPS spectra of the individual elements of the catalysts, Table S1: Binding energies (eV) of core electron levels (adjusted to C 1s = 284.8 eV), Table S2: Surface concentrations of metals determined by XPS (wt.%).
Author Contributions
Conceptualization, K.J.; methodology, K.J. and K.P.; validation, L.O. and K.J.; investigation, J.B., K.P., K.K. and M.K.; data curation, K.P., K.K., J.B. and M.K.; writing—original draft preparation, K.J.; writing—review and editing, K.J. and K.P.; supervision, L.O.; project administration, K.P., L.O. and K.J. All authors have read and agreed to the published version of the manuscript.
Funding
The authors thank the Czech Science Foundation (project No. 18-19519S) for financial support. The work was also supported by the ERDF “Institute of Environmental Technology—Excellent Research” (No. CZ.02.1.01/0.0/0.0/16_019/0000853). Experimental results were achieved using Large Research Infrastructures ENREGAT and CATPRO, supported by the Ministry of Education, Youth and Sports of the Czech Republic, under projects LM2018098 and LM2015039.
Acknowledgments
The authors thank H. Šnajdaufová for the measurement of catalysts’ pore size distribution and L. Soukupová for the chemical analysis.
Conflicts of Interest
The authors declare no conflict of interest.
References
- Carslaw, D.; Beevers, S.; Westmoreland, E.; Williams, M.; Tate, J.; Murrells, T.; Stedman, J.; Li, Y.; Grice, S.; Kent, A.; et al. Trends in NO and NO2 Emissions and Ambient Measurements in the UK. Version 18th. Available online: http://ukair.defra.gov.uk/reports/cat05/1108251149_110718_AQ0724_Final_report.pdf (accessed on 31 July 2011).
- Haneda, M.; Hamada, H. Recent progress in catalytic NO decomposition. C. R. Chim. 2016, 19, 1254–1265. [Google Scholar] [CrossRef]
- Falsig, H.; Bligaard, T. Trends in catalytic NO decomposition over transition metal surfaces. Top. Catal. 2007, 45, 117–120. [Google Scholar] [CrossRef]
- Brown, W.A.; King, D.A. No Chemisorption and Reactions on Metal Surfaces: A New Perspective. J. Phys. Chem. B 2000, 104, 2578–2595. [Google Scholar] [CrossRef]
- Falsig, H.; Bligaard, T.; Christensen, C.H.; Nørskov, J.K. Direct No decomposition over stepped transition-metal surfaces. Pure Appl. Chem. 2007, 79, 1895–1903. [Google Scholar] [CrossRef]
- Wu, Z.; Xu, L.; Zhang, W.; Ma, Y.; Yuan, Q.; Jin, Y.; Yang, J.; Huang, W. Structure sensitivity of low-temperature NO decomposition on Au surfaces. J. Catal. 2013, 304, 112–122. [Google Scholar] [CrossRef]
- Obalová, L.; Fíla, V. Kinetic analysis of N2O decomposition over calcined hydrotalcites. Appl. Catal. B Environ. 2007, 70, 353. [Google Scholar] [CrossRef]
- Cheng, H.; Huang, Y.; Wang, A.; Li, L.; Wang, X.; Zhang, T. N2O decomposition over K-promoted Co-Al catalysts prepared from hydrotalcite-like precursors. Appl. Catal. B 2009, 89, 391–397. [Google Scholar] [CrossRef]
- Li, Q.; Meng, M.; Tsubaki, N.; Li, X.; Li, Z.; Xioe, Y.; Hu, T.; Zhang, J. Performance of K-promoted hydrotalcite-derived CoMgAlO catalysts used for soot combustion, NOx storage and simultaneous soot–NOx removal. Appl. Catal. B 2009, 91, 406–415. [Google Scholar] [CrossRef]
- Obalová, L.; Karásková, K.; Jirátová, K.; Kovanda, F. Effect of potassium in calcined Co–Mn–Al layered double hydroxide on the catalytic decomposition of N2O. Appl. Catal. B 2009, 90, 132–140. [Google Scholar] [CrossRef]
- Pacultová, K.; Draštíková, V.; Chromčáková, Ž.; Bílková, T.; Mamulová Kutláková, K.; Kotarba, A.; Obalová, L. On the stability of alkali metal promoters in Co mixed oxides during direct NO catalytic decomposition. J. Mol. Catal. A Chem. 2017, 428, 33–40. [Google Scholar] [CrossRef]
- Pacultová, K.; Bílková, T.; Klegová, A.; Karásková, K.; Fridrichová, D.; Jirátová, K.; Kiška, T.; Balabánová, J.; Koštejn, M.; Kotarba, A.; et al. Co-Mn-Al Mixed Oxides Promoted by K for Direct NO Decomposition: Effect of Preparation Parameters. Catalysts 2019, 9, 593. [Google Scholar] [CrossRef] [Green Version]
- Jirátová, K.; Pacultová, K.; Balabánová, J.; Karásková, K.; Klegová, A.; Bílková, T.; Jandová, V.; Koštejn, M.; Martaus, A.; Kotarba, A.; et al. Precipitated K-Promoted Co–Mn–Al Mixed Oxides for Direct NO Decomposition: Preparation and Properties. Catalysts 2019, 9, 592. [Google Scholar] [CrossRef] [Green Version]
- Figueredo, M.J.M.; Andana, T.; Bensaid, S.; Dosa, M.; Fino, D.; Russo, N.; Piumetti, M. Cerium–Copper–Manganese Oxides Synthesized via Solution Combustion Synthesis (SCS) for Total Oxidation of VOCs. Catal. Lett. 2020, 150, 1821–1840. [Google Scholar] [CrossRef]
- Lin, S.S.-Y.; Kim, D.H.; Ha, S.Y. Metallic phases of cobalt-based catalysts in ethanol steam reforming: The effect of cerium oxide. Appl. Catal. A Gen. 2009, 355, 69–77. [Google Scholar] [CrossRef]
- Katta, L.; Sudarsanam, P.; Thrimurthulu, G.B.; Reddy, M. Doped nanosized ceria solid solutions for low temperature soot oxidation: Zirconium versus lanthanum promoters. Appl. Catal. B 2010, 101, 101–108. [Google Scholar] [CrossRef]
- Liotta, L.F.; Ousmane, M.; Di Carlo, G.; Pantaleo, G.; Deganello, G.; Marci, G.; Retailleau, L.; Giroir-Fendler, A. Total oxidation of propene at low temperature over Co3O4–CeO2 mixed oxides: Role of surface oxygen vacancies and bulk oxygen mobility in the catalytic activit A. Appl. Catal. A Gen. 2008, 347, 81–88. [Google Scholar] [CrossRef] [Green Version]
- Dong, F.; Suda, A.; Tanabe, T.; Nagai, Y.; Sobukawa, H.; Shinjoh, H.; Sugiura, M.; Descorme, C.; Duprez, D. Dynamic oxygen mobility and a new insight into the role of Zr atoms in three-way catalysts of Pt/CeO2–ZrO2. Catal. Today 2004, 93–95, 827–832. [Google Scholar] [CrossRef]
- Yu, S.-W.; Huang, H.-H.; Tang, C.-W.; Wang, C.-B. The effect of accessible oxygen over Co3O4-CeO2 catalysts on the steam reforming of ethanol. Int. J. Hydrog. Energy 2014, 39, 20700–20711. [Google Scholar] [CrossRef]
- Xue, L.; Zhang, C.; He, H.; Teraoka, Y. Promotion effect of residual K on the decomposition of N2O over cobalt–cerium mixed oxide catalyst. Catal. Today 2007, 126, 449–455. [Google Scholar] [CrossRef]
- Xue, L.; He, H.; Liu, C.; Zhang, C.; Zhang, B. Promotion Effects and Mechanism of Alkali Metals and Alkaline Earth Metals on Cobalt-Cerium Composite Oxide Catalysts for N2O Decomposition. Environ. Sci. Technol. 2009, 43, 890–895. [Google Scholar] [CrossRef]
- Argyle, M.D. Supported, Alkali-Promoted Cobalt Oxide Catalysts for NOx Removal from Coal Combustion Flue Gases; University of Wyoming: Laramie, WY, USA, 2005. [Google Scholar]
- Stoyanova, D.; Georgieva, P.; Avramova, I.; Aleksieva, K.; Marinova, D.; Mehandjiev, D. Nitric oxide (NO) decomposition on catalysts, containing oxides of lanthanum and cerium, supported on γ-alumina. J. Rear Earths 2019, 37, 151–159. [Google Scholar] [CrossRef]
- Zhang, Y.; Guo, Y.; Li, N.; Feng, Y. Catalytic N2O decomposition over CeMeOy/γ-Al2O3 (Me = Mn, Cu, Zn) catalysts prepared by impregnation method. Asia Pac. J. Chem. Eng. 2018, 13, e2233. [Google Scholar] [CrossRef]
- Hong, W.-J.; Iwamoto, S.; Inoue, M. Direct NO decomposition over a Ce-Mn mixed oxide modified with alkali and alkali earth species and CO2-TPD behavior of the catalyst. Catal. Today 2011, 164, 489–494. [Google Scholar] [CrossRef]
- Hong, W.-J.; Ueda, M.; Iwamoto, S.; Hosokawa, S.; Wada, K.; Inoue, M. Synthesis of Highly Effective CeOx-MnOy-BaO Catalysts for direct NO decomposition. Catal. Lett. 2012, 142, 32–41. [Google Scholar] [CrossRef]
- Klug, H.P.; Alexander, L.E. X-ray Diffraction Procedures for Polycrystalline and Amorphous Materials; Wiley: New York, NY, USA, 1954. [Google Scholar]
- Schneider, P.; Hudec, P.; Šolcová, O. Pore-volume and surface area in microporous–mesoporous solids. Micropor. Mesopor. Mater. 2008, 115, 491–496. [Google Scholar] [CrossRef]
- Gregg, S.J.; Sing, K.S.W. Adsorption Surface Area and Porosity; Academic Press: New York, NY, USA, 1982. [Google Scholar]
- Leofanti, G.; Padovan, M.; Tozzola, G.; Venturelli, B. Surface area and pore structure of catalysts. Catal. Today 1998, 41, 207–219. [Google Scholar] [CrossRef]
- Schneider, P. Adsorption isotherms of microporous-mesoporous solids revisited. Appl. Catal. A 1995, 157–165. [Google Scholar] [CrossRef]
- Tang, C.-W.; Leu, T.-Y.; Yu, W.-Y.; Wang, C.-B.; Chien, S.-H. Low temperature oxidation of carbon monoxide: The influence of water and oxygen on the reactivity of a Co3O4 powder surface. Appl. Catal. B 2004, 48, 267–274. [Google Scholar] [CrossRef]
- Chromčáková, Ž.; Obalová, L.; Kovanda, F.; Michalik, S.; Kuśtrowski, P.; Jirátová, K. Effect of precursor synthesis on catalytic activity of Co3O4 in N2O decomposition. Catal. Today 2015, 257, 18–25. [Google Scholar] [CrossRef]
- Venkataswamy, P.; Jampaiah, D.; Rao, K.N.; Reddy, B.M. Nanostructured Ce0.7Mn0.3O2−δ and Ce0.7Fe0.3O2−δ solid solutions for diesel soot oxidation. Appl. Catal. A Gen. 2011, 488, 1–10. [Google Scholar] [CrossRef]
- Guan, F.; Ma, Y.; Yang, W.; Kang, J.; Deng, H.; Qi, H. Preparation of CeO2 nanoparticles and its application to Ion-selective Electrodes Based on Acetylcellulose. Rare Metals 2001, 20, 217–220. [Google Scholar]
- Ho, C.; Yu, J.C.; Kwang, T.; Mark, A.C.; Lai, S. Morphology-Controllable Synthesis of Mesoporous CeO2 Nano- and Microstructures. Chem. Mater. 2006, 17, 4514–4522. [Google Scholar] [CrossRef]
- Nyquist, R.A.; Nagel, R.O. Infrared Spectra of Inorganic Compounds; Academic Press: New York, NY, USA, 1971. [Google Scholar]
- Bentley, F.F.; Smithson, L.D.; Rozek, A.L. Infrared Spectra and Characteristic Frequencies 700–300 cm−1: A Collection of Spectra, Interpretation, and Bibliography; Interscience: New York, NY, USA, 1986. [Google Scholar]
- Jirátová, K.; Balabánová, J.; Kovanda, F.; Klegová, A.; Obalová, L.; Fajgar, R. Cobalt Oxides Supported Over Ceria–Zirconia Coated Cordierite Monoliths as Catalysts for Deep Oxidation of Ethanol and N2O Decomposition. Catal. Lett. 2017, 147, 1379–1391. [Google Scholar] [CrossRef]
- Habibi, M.H.; Bagheri, P. Spinel cobalt manganese oxide nano-composites grown hydrothermally on nanosheets for enhanced photocatalytic mineralization of Acid Black 1 textile dye: XRD, FTIR, FESEM, EDS and TOC studies. J. Iran Chem. Soc. 2017, 14, 1643–1649. [Google Scholar] [CrossRef]
- Tholkappiyan, R.; Naveen, A.N.; Sumithra, S.; Vishista, K. Investigation on spinel MnCo2O4 electrode material prepared via controlled and uncontrolled synthesis route for supercapacitor application. J. Mater. Sci. 2015, 50, 5833–5843. [Google Scholar] [CrossRef]
- Rojas, R.M.; Vila, E.; García, O.; de Vidales, J.L.M. Thermal behaviour and reactivity of manganese cobaltites MnxCo3-xO4 (0.0 ≤ x ≤ 1.0) obtained at low temperature. J. Mater. Chem. 1994, 4, 1635–1639. [Google Scholar] [CrossRef]
- Babitha, K.K.; Sreedevi, A.; Priyanka, K.P.; Sabu, B.; Varghese, T. Structural characterization and optical studies of CeO2 nanoparticles synthesized by chemical precipitation. Indian J. Pure Appl. Phys. 2015, 53, 596–603. [Google Scholar]
- Imanaka, N.; Masui, T. Advances in direct NOx decomposition catalysts. Appl. Catal. A Gen. 2012, 431–432, 1–8. [Google Scholar] [CrossRef]
- Smoláková, L.; Frolich, K.; Troppová, I.; Kutálek, P.; Kroft, E.; Cˇapek, L. Determination of basic sites in Mg–Al mixed oxides by combination of TPD-CO2 and CO2 adsorption calorimetry. J. Therm. Anal. Calorim. 2017, 127, 1921–1929. [Google Scholar] [CrossRef]
- Shibata, K.; Kiyoura, T.; Kitagawa, J.; Sumiyoshi, T.; Tanabe, K. Acidic properties of Binary Metal Oxides. Bull. Chem. Soc. Jpn. 1973, 46, 2985–2988. [Google Scholar] [CrossRef] [Green Version]
- Tanaka, K.; Ozaki, A. Acid-base properties and catalytic activity of solid surfaces. J. Catal. 1967, 8, 1–7. [Google Scholar] [CrossRef]
- Russo, N.; Finno, D.; Saracco, G.; Specchia, V. N2O catalytic decomposition over various spinel-type oxides. Catal. Today 2007, 119, 228–232. [Google Scholar] [CrossRef]
- Karaskova, K.; Obalova, L.; Jiratova, K.; Kovanda, F. Effect of promoters in Co–Mn–Al mixed oxide catalyst on N2O decomposition. Chem. Eng. J. 2010, 160, 480–487. [Google Scholar] [CrossRef]
- Karaskova, K.; Obalova, L.; Kovanda, F. N2O catalytic decomposition and temperature programmed desorption tests on alkali metals promoted Co–Mn–Al mixed oxide. Catal. Today 2011, 176, 208–211. [Google Scholar] [CrossRef]
- Scofield, J.H. Hartree-Slater subshell photoionization cross-sections at 1254 and 1487 eV. J. Electron Spectrosc. Relat. Phenom. 1976, 8, 129–137. [Google Scholar] [CrossRef]
- Biesinger, M.C.; Payne, B.P.; Grosvenor, A.P.; Lau, L.W.M.; Gerson, A.R.; Smart, R.S. Resolving surface chemical states in XPS analysis of first row transition metals, oxides and hydroxides: Cr, Mn, Fe, Co and Ni. Appl. Surf. Sci. 2011, 257, 2717–2730. [Google Scholar] [CrossRef]
- Kim, S.C.; Shim, W.G. Catalytic combustion of VOCs over a series of manganese oxide catalysts. Appl. Catal. B Environ. 2010, 98, 180–185. [Google Scholar] [CrossRef]
- Nefedov, V.I.; Salyn, Y.V.; Leonhardt, G.; Scheibe, R. A comparison of different spectrometers and charge corrections used in X-ray photoelectron spectroscopy. J. Electron Spectrosc. Relat. Phenom. 1977, 10, 121–124. [Google Scholar] [CrossRef]
- Available online: https://xpssimplified.com/elements/cerium.php (accessed on 30 June 2020).
- Obalová, L.; Karásková, K.; Wach, A.; Kustrowski, P.; Michalik, S.; Jirátová, K. Alkali metals as the promoters in Co-Mn-Al mixed oxide. Appl. Catal. A Chem. 2013, 462–463, 227–235. [Google Scholar]
- Haneda, M.; Kintaichi, Y.; Bion, N.; Hamada, H. Alkali metal-doped cobalt oxide catalysts for NO decomposition. Appl. Catal. B 2003, 46, 473–482. [Google Scholar] [CrossRef]
- Abu-Zied, B.M.; Asiri, A.M. The role of alkali promoters in enhancing the direct N2O decomposition reactivity over NiO catalysts. Chin. J. Catal. 2015, 36, 1837–1845. [Google Scholar] [CrossRef]
- Asano, K.; Ohnishi, C.; Iwamoto, S.; Shioya, Y.; Inoue, M. Potassium-doped Co3O4 catalyst for direct decomposition of N2O. Appl. Catal. B 2008, 78, 242–249. [Google Scholar] [CrossRef]
- Grzybek, G.; Wojcik, S.; Legutko, P.; Grybos, J.; Indyka, P.; Leszczynski, B.; Kotarba, A.; Sojka, Z. Thermal stability and repartition of potassium promoter between the support and active phase in the K-Co2.6Zn0.4O4 vertical bar α-Al2O3 catalyst for N2O decomposition: Crucial role of activation temperature on catalytic performance. Appl. Catal. B Environ. 2017, 205, 597–604. [Google Scholar] [CrossRef]
- Park, P.W.; Kil, J.K.; Kung, H.H.; Kung, M.C. NO decomposition over sodium-promoted cobalt oxide. Catal. Today 1998, 42, 51–60. [Google Scholar] [CrossRef]
- Pacultová, K.; Klegová, A.; Karásková, K.; Fridrichová, D.; Bílková, T.; Obalová, L. Oxygen effect in NO direct decomposition over K/Co-Mg-Mn-Al mixed oxide catalyst (in preparation).
- Sanderson, R.T. Chemical Bonds and Bond Energy; Academic Press: New York, NY, USA, 1971. [Google Scholar]
- Peck, T.C.; Roberts, C.A.; Reddy, G.K. Contrasting Effects of Potassium Addition on M3O4 (M = Co, Fe, and Mn) Oxides during Direct NO Decomposition Catalysis. Catalysts 2020, 10, 561. [Google Scholar] [CrossRef]
- Zasada, F.; Stelmachowski, P.; Maniak, G.; Paul, J.-F.; Kotarba, A.; Sojka, Z. Potassium promotion of cobalt spinel catalyst for N2O decomposition—Accounted by work function measurements and DFT modelling. Catal. Lett. 2009, 127, 126–131. [Google Scholar]
- Deboer, J.H.; Lippens, B.C.; Linsen, B.G.; Broekhof, J.C.; Vandenhe, A.; Osinga, T.J. The t-curve of multimolecular N2-adsorption. J. Colloid Interface Sci. 1966, 21, 405–414. [Google Scholar] [CrossRef]
- Barrett, E.P.; Joyner, L.G.; Halenda, P.P. The Determination of Pore Volume and Area Distributions in Porous Substances. I. Computations from Nitrogen Isotherms. J. Am. Chem. Soc. 1951, 73, 373–380. [Google Scholar] [CrossRef]
- Lecloux, A.; Pirard, J.P. The importance of standard isotherms in the analysis of adsorption isotherms for determining the porous texture of solids. J. Colloid Interface Sci. 1979, 70, 265–281. [Google Scholar] [CrossRef]
Figure 1.
XRD patterns of the examined catalysts (CuKα, λ = 0.15418 nm). Designation of the reflections: *—spinel Co3O4, ▽—CoMnAlO4, ●—MnO2, ▲—cubic CeO2.
Figure 1.
XRD patterns of the examined catalysts (CuKα, λ = 0.15418 nm). Designation of the reflections: *—spinel Co3O4, ▽—CoMnAlO4, ●—MnO2, ▲—cubic CeO2.

Figure 2.
(a) N2 adsorption–desorption isotherms at −196 °C of the examined catalysts and (b) their pore size distributions evaluated from nitrogen physical adsorption.
Figure 2.
(a) N2 adsorption–desorption isotherms at −196 °C of the examined catalysts and (b) their pore size distributions evaluated from nitrogen physical adsorption.

Figure 3.
H2-TPR of the examined catalysts.

Figure 4.
FTIR spectra of the calcined catalysts. Inset: FTIR spectra of the catalysts in the range of 900 to 4000 cm−1.
Figure 4.
FTIR spectra of the calcined catalysts. Inset: FTIR spectra of the catalysts in the range of 900 to 4000 cm−1.

Figure 5.
CO2-TPD profiles obtained for the prepared catalysts.

Figure 6.
O2-TPD patterns of the examined catalysts.

Figure 7.
Dependence of basicity (determined in temperature range 25–650 °C) on electronegativity of oxides (Co3O4, Al2O3, Mn2O3, K2O, and CeO2) hypothetically present in the catalysts.
Figure 7.
Dependence of basicity (determined in temperature range 25–650 °C) on electronegativity of oxides (Co3O4, Al2O3, Mn2O3, K2O, and CeO2) hypothetically present in the catalysts.

Figure 8.
Dependence of NO conversion to N2 (black curve), temperatures of first reduction peak in the TPR measurements (red curve), and basicity (CO2 desorbed in the range of 25 to 650 °C, green curve) on the amount of potassium in the catalysts.
Figure 8.
Dependence of NO conversion to N2 (black curve), temperatures of first reduction peak in the TPR measurements (red curve), and basicity (CO2 desorbed in the range of 25 to 650 °C, green curve) on the amount of potassium in the catalysts.


Table 1.
Chemical analysis and XRD characteristic values of the bare and modified Co-Mn-Al catalysts.
Table 1.
Chemical analysis and XRD characteristic values of the bare and modified Co-Mn-Al catalysts.
| Sample | Co_Mn_Al_Ce_K wt.% | Co:Mn:Al:Ce:K Molar Ratio | D (Co3O4) nm | D (CeO2) nm |
|---|---|---|---|---|
| Bare a | 52.0_11.0_3.7_0_0 | 4:1.0:1.0:0:0 | 10.21 | - |
| Bare-Ce b | 24.6_4.7_2.7_40.5_0 | 4:0.8:1.0:2.8:0 | 10.48 | 4.84 |
| Bare-Ce,K c | 25.0_4.8_2.7_41.0_2.0 | 4:0.8:1.0:2.8:0.5 | 10.28 | 5.07 |
| Bare-Ce+Co d | 36.3_3.7_2.2_32.4_0 | 4:0.6:0.8:2.2:0 | 13.13 | 6.10 |
| Bare-Ce,K+Co,K e | 35.6_3.6_2.1_30.7_2.5 | 4:0.6:0.7:2.1:0.6 | 15.17 | 6.85 |
a Coprecipitation of (Co, Mn, Al) metal nitrates with Na2CO3 and NaOH. b Coprecipitation of (Co, Mn, Al, Ce) metal nitrates with Na2CO3 and NaOH. c Coprecipitation of (Co, Mn, Al, Ce, K) metal nitrates with Na2CO3 + NaOH. d Impregnation of the bare-Ce sample with Co(NO3)2. e Impregnation of the bare-Ce,K sample with Co(NO3)2 and KNO3.
Table 2.
Characteristic values of catalysts’ pore size distributions.
| Sample | SBET m2 g−1 | Smeso m2 g−1 | Vtot mm3liq g−1 | Vmicro mm3liq g−1 |
|---|---|---|---|---|
| Bare | 85 | 84 | 454 | 2.0 |
| Bare-Ce | 118 | 118 | 604 | 0.7 |
| Bare-Ce,K | 93 | 92 | 456 | 0 |
| Bare-Ce+Co | 81 | 81 | 285 | 1.0 |
| Bare-Ce,K+Co,K | 59 | 49 | 204 | 5.0 |
Table 3.
H2-TPR, CO2-TPD data and NO conversions at 650 °C obtained for the examined catalysts.
| Sample | H2 a mmol g−1 | H2-TPR b mmol g−1 | Tmaxc °C | CO2-TPD b mmol g−1 | CO2-TPD d mmol g−1 | XNO (650 °C) % |
|---|---|---|---|---|---|---|
| Bare | 11.78 | 5.3 | 374 | 0.05 | 0.03 | 2 |
| Bare-Ce | 11.35 | 4.3 | 348 | 0.22 | 0.07 | 0 |
| Bare-Ce+K | 11.53 | 7.3 | 390 | 0.34 | 0.19 | 21 |
| Bare-Ce+Co | 12.84 | 5.6 | 356 | 0.13 | 0.06 | 0 |
| Bare-Ce.K+Co.K | 12.45 | 6.2 | 280 | 0.25 | 0.15 | 24 |
a Theoretical H2 Consumption, b In temperature interval 25–650 °C, c Maximum temperature of the first peak determined from H2-TPR, d In temperature interval 200–650 °C.
Table 4.
Surface molar fractions (mol.%) of the individual components of the examined catalysts (data are corrected to C 1s 284.8 eV).
Table 4.
Surface molar fractions (mol.%) of the individual components of the examined catalysts (data are corrected to C 1s 284.8 eV).
| Sample | C 1s | O 1s | Co 2p | Mn 2p | Al 2p | Ce 3d | K 2p | Na 1s | N 1s |
|---|---|---|---|---|---|---|---|---|---|
| Bare | 16.2 | 56.1 | 13.8 | 4.1 | 9.2 | 0.0 | 0.0 | 0.6 | 0.0 |
| Bare-Ce | 30.8 | 48.4 | 7.4 | 1.7 | 4.8 | 6.4 | 0.0 | 0.5 | 0.0 |
| Bare-Ce,K | 27.0 | 50.9 | 7.5 | 1.7 | 4.9 | 5.8 | 2.3 | 0.0 | 0.0 |
| Bare-Ce+Co | 25.0 | 51.4 | 9.0 | 2.1 | 4.5 | 7.6 | 0.0 | 0.4 | 0.0 |
| Bare-Ce,K+Co,K | 22.9 | 50.9 | 9.9 | 2.0 | 3.7 | 5.1 | 4.4 | 0.4 | 0.7 |
Table 5.
Deconvolution of O 1s binding energies to spin-orbit components (rel.%).
| Sample | O 1s (529.3 eV) | O 1s (531.6 eV) |
|---|---|---|
| Bare | 33.9 | 66.1 |
| Bare-Ce | 49.3 | 50.6 |
| Bare-Ce,K | 46.4 | 53.6 |
| Bare-Ce+Co | 55.8 | 44.2 |
| Bare-Ce,K+Co,K | 55.9 | 44.1 |
Table 6.
Ratio of surface and bulk concentrations (given in wt.%) of Co, Mn, Al, Ce, and K.
| Sample | Co | Mn | Al | Ce | K |
|---|---|---|---|---|---|
| Bare | 1.2 | 1.5 | 3.4 | ||
| Bare-Ce | 1.1 | 1.0 | 2.1 | 0.8 | |
| Bare-Ce,K | 1.1 | 1.0 | 2.1 | 0.7 | 4.6 |
| Bare-Ce+Co | 0.8 | 1.5 | 2.2 | 1.3 | |
| Bare-Ce,K+Co,K | 1.0 | 1.6 | 2.0 | 0.9 | 5.2 |
Table 7.
Conversions of NO in the presence of O2, H2O, and a mixture of O2 and H2O observed over the bare-Ce,K+Co,K catalyst.
Table 7.
Conversions of NO in the presence of O2, H2O, and a mixture of O2 and H2O observed over the bare-Ce,K+Co,K catalyst.
| Reaction Medium | Conversion of NO (700 °C), % |
|---|---|
| 1000 ppm NO/N2 | 30.0 |
| +2 mol.% O2 | 4.0 |
| After O2 removal | 29.0 |
| +2 mol.% CO2 | 10.4 |
| After CO2 removal | 29.0 |
| +2 mol.% O2 + 2 mol.% H2O | 5.0 |
Reaction conditions: 1000 ppm NO in N2, 0.5 g of catalyst, reaction temperature 700 °C, flow 2.9 L/h.
© 2020 by the authors. Licensee MDPI, Basel, Switzerland. This article is an open access article distributed under the terms and conditions of the Creative Commons Attribution (CC BY) license (http://creativecommons.org/licenses/by/4.0/).
Share and Cite
MDPI and ACS Style
Jirátová, K.; Pacultová, K.; Karásková, K.; Balabánová, J.; Koštejn, M.; Obalová, L. Direct Decomposition of NO over Co-Mn-Al Mixed Oxides: Effect of Ce and/or K Promoters. Catalysts 2020, 10, 808. https://doi.org/10.3390/catal10070808
AMA Style
Jirátová K, Pacultová K, Karásková K, Balabánová J, Koštejn M, Obalová L. Direct Decomposition of NO over Co-Mn-Al Mixed Oxides: Effect of Ce and/or K Promoters. Catalysts. 2020; 10(7):808. https://doi.org/10.3390/catal10070808
Chicago/Turabian StyleJirátová, Květa, Kateřina Pacultová, Kateřina Karásková, Jana Balabánová, Martin Koštejn, and Lucie Obalová. 2020. "Direct Decomposition of NO over Co-Mn-Al Mixed Oxides: Effect of Ce and/or K Promoters" Catalysts 10, no. 7: 808. https://doi.org/10.3390/catal10070808
Note that from the first issue of 2016, this journal uses article numbers instead of page numbers. See further details here.