
Feeding High-Fat Diet Accelerates Development of Peripheral and Central Insulin Resistance and Inflammation and Worsens AD-like Pathology in APP/PS1 Mice
 , , ,
, , ,
Abstract
: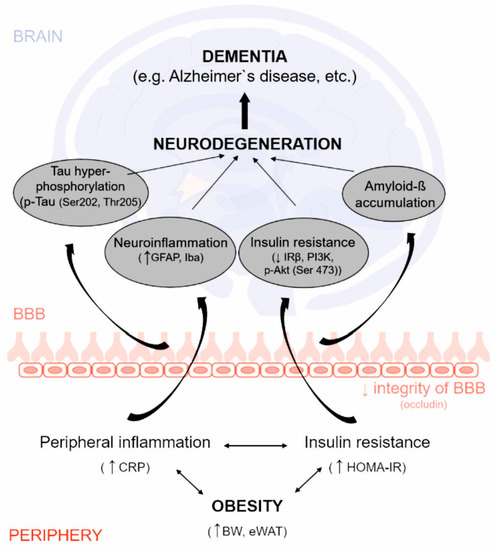
1. Introduction
2. Materials and Methods
2.1. Animals
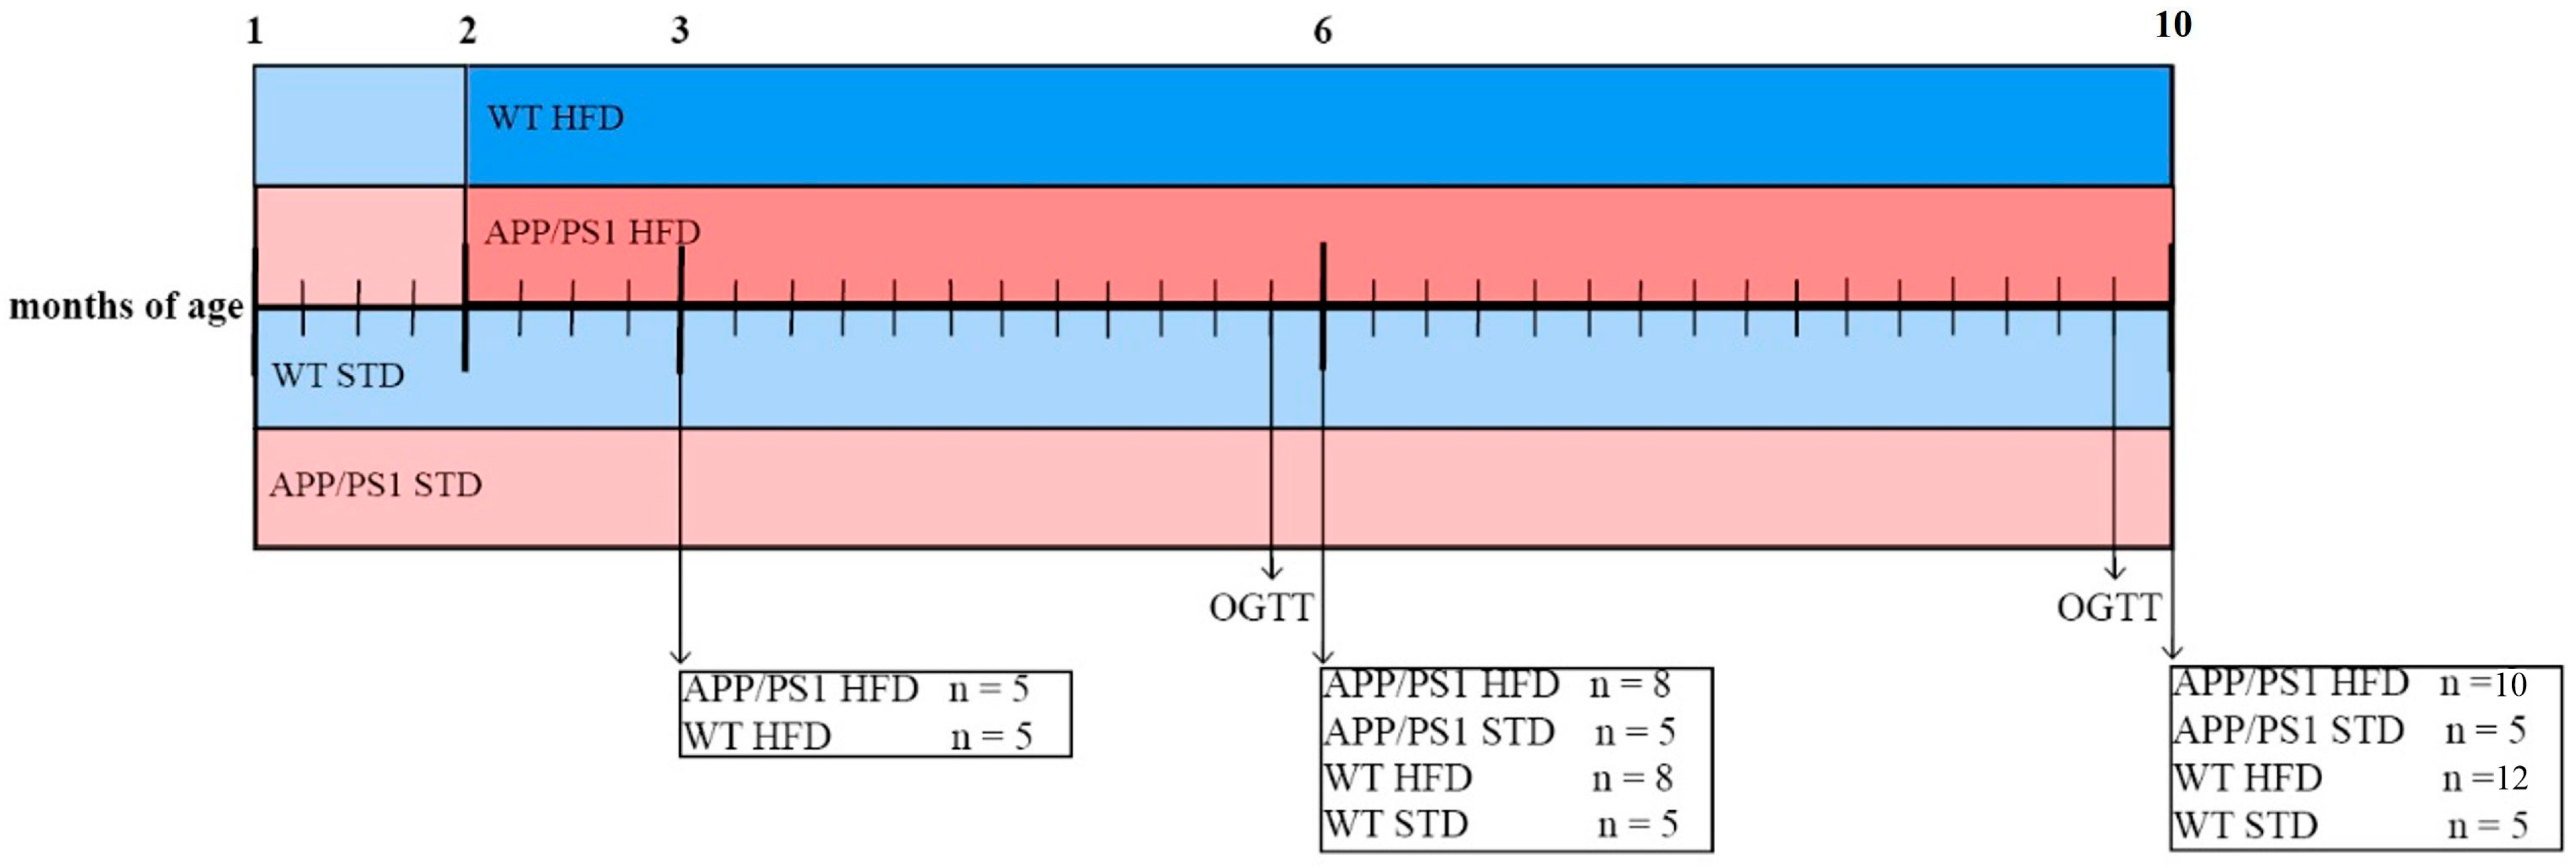
2.2. Study Design and Treatment
2.3. Oral Glucose Tolerance Test (OGTT)
2.4. Dissections
2.5. Determination of Hormonal and Biochemical Parameters in Fasting Plasma
2.6. Western Blotting
2.7. Brain Immunohistochemistry
2.8. Brain MALDI MSI
2.9. Liver Histology
2.10. LC-MS
2.11. NMR-Based Metabolomics of Urine, Plasma, and Liver Samples
2.12. Statistical Analyses
3. Results
3.1. Effect of HFD on Body Weight, at Weight and Lipid Profile
3.2. HFD Caused Glucose Intolerance in 6-Month-Old Animals and Peripheral Insulin Resistance Increasing with Aging
3.3. HFD Caused Peripheral Inflammation in APP/PS1 Mice
3.4. HFD Caused Liver Steatosis in APP/PS1 Mice and Worsened Fibrosis in 10-Month-Old Animals
3.5. HFD Altered Metabolic Profiles of Urine, Plasma and Polar Liver Extracts in APP/PS1 Mice
3.6. HFD Upregulated Liver Lipid Diversity in 6-Month-Old APP/PS1 Mice
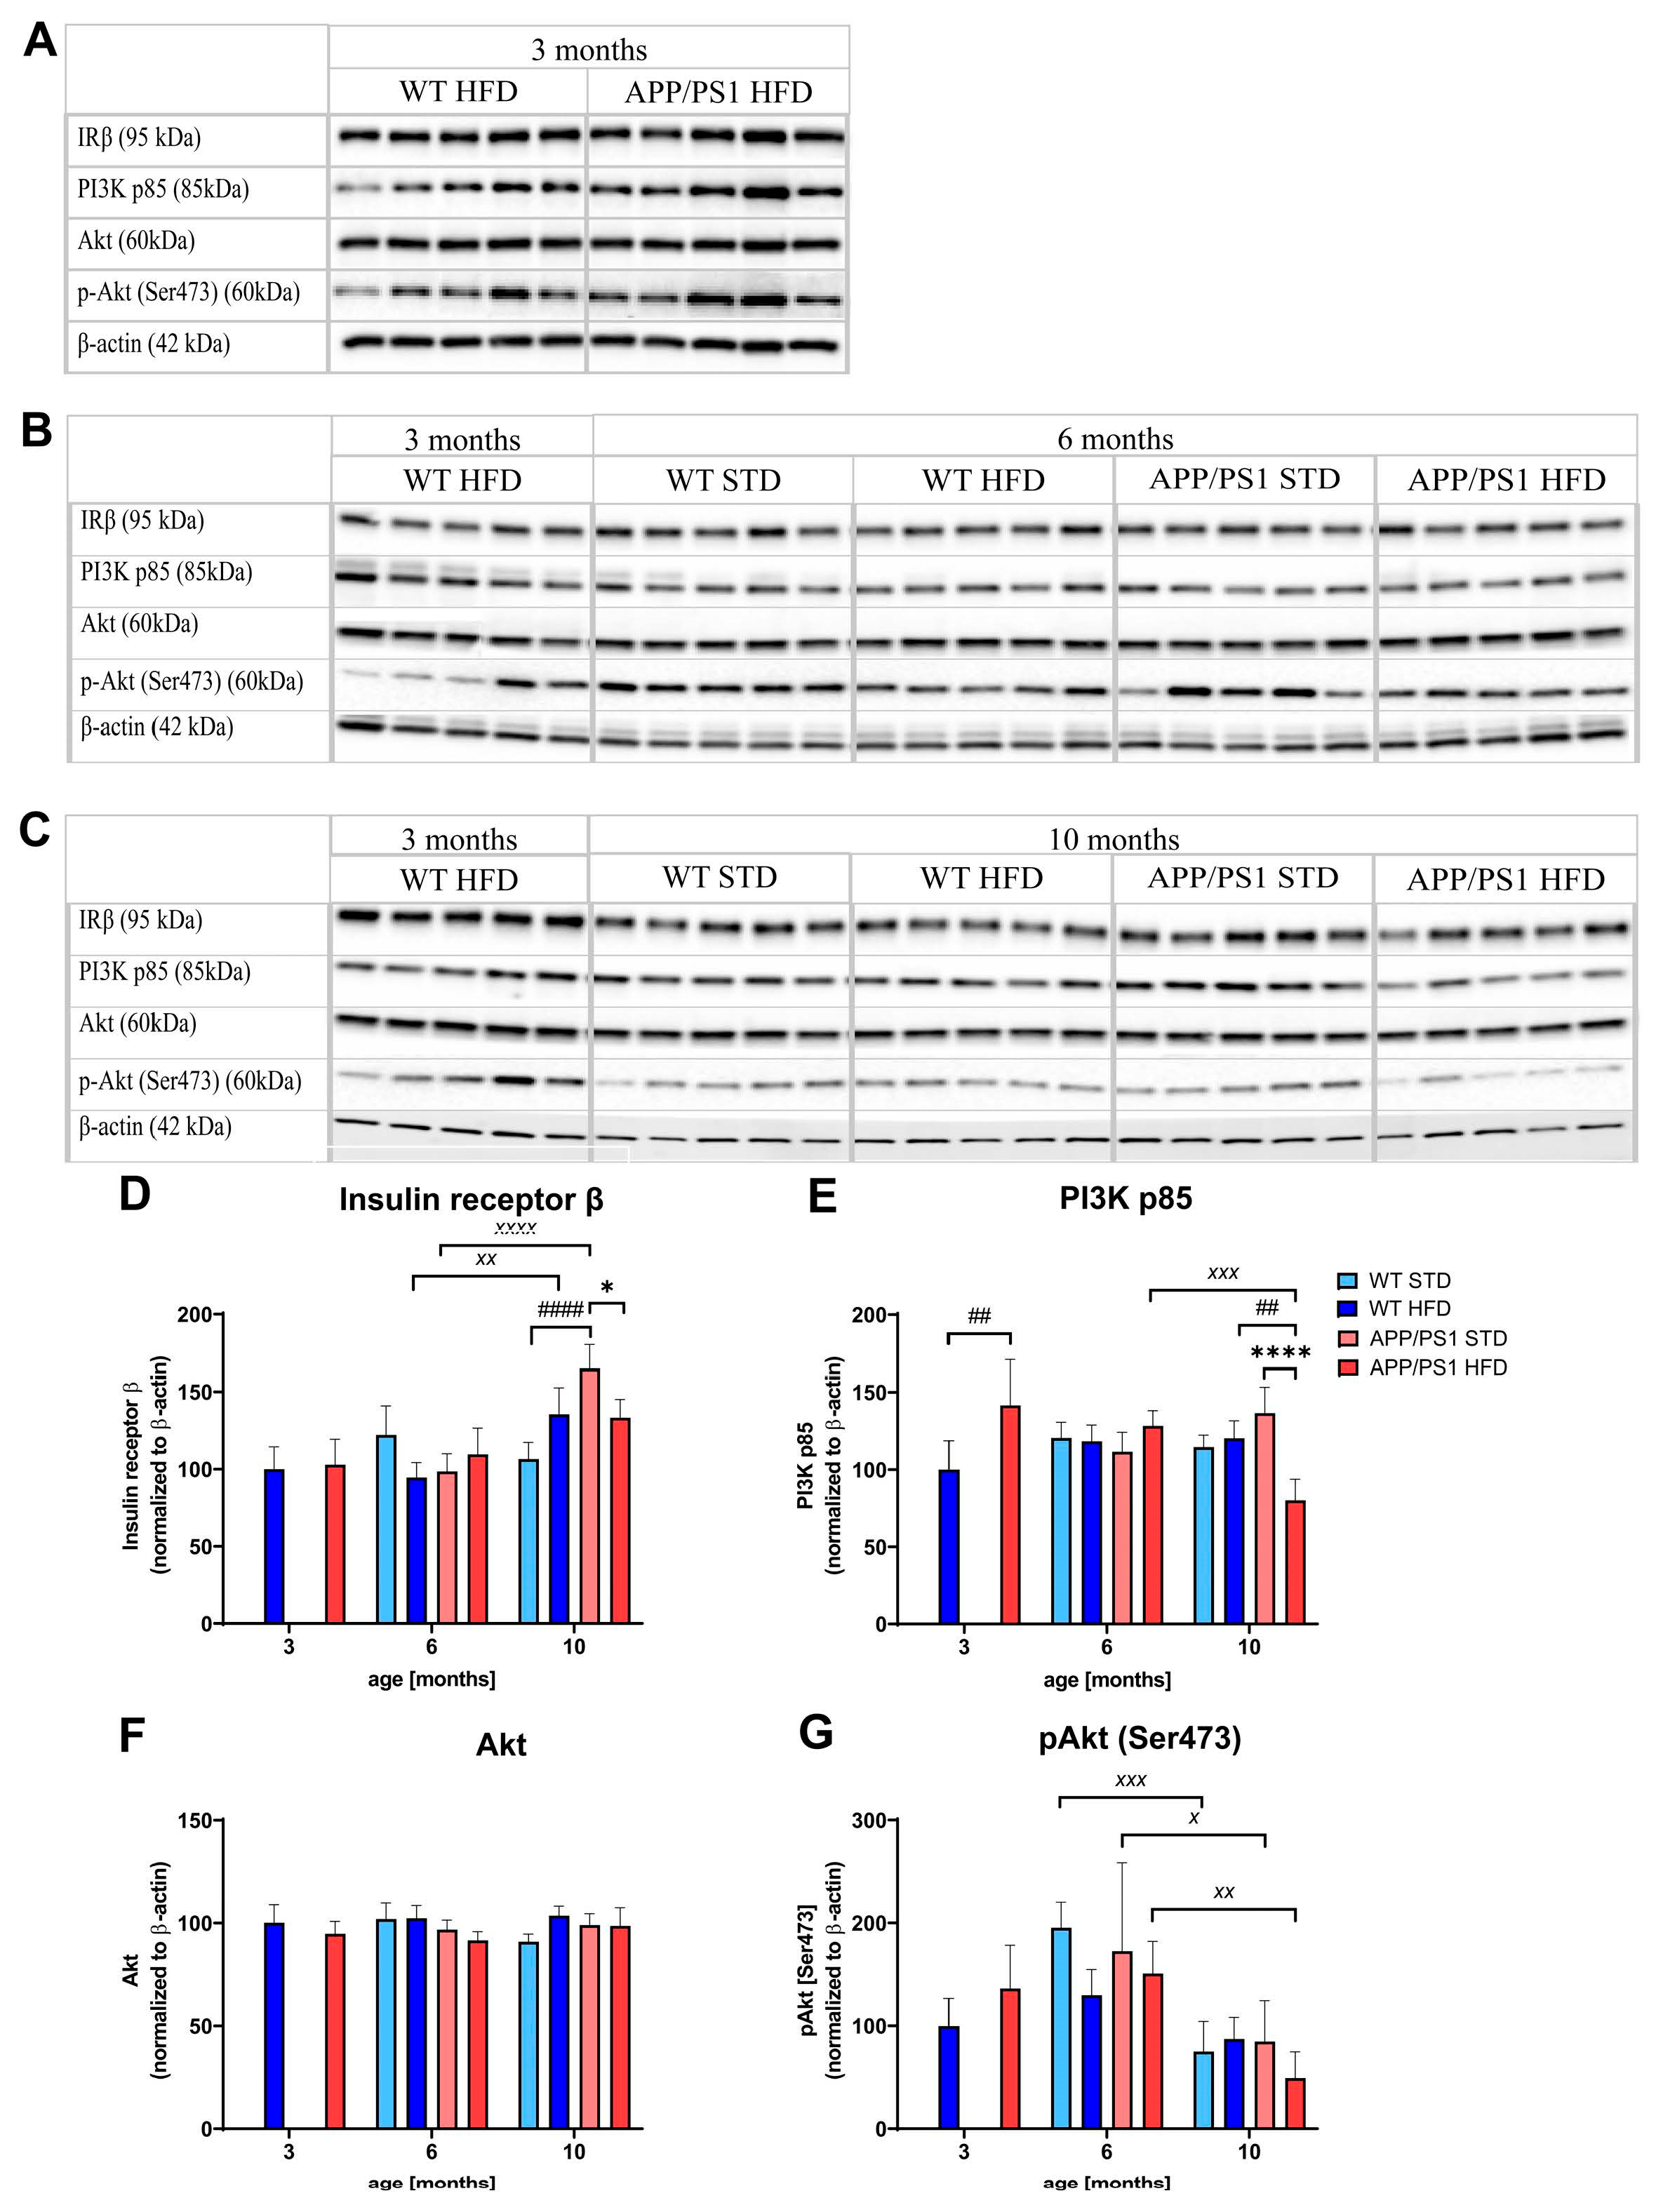
3.7. HFD and Age Attenuated PI3K/Akt Signaling in the Liver, eWAT and Skeletal Muscle
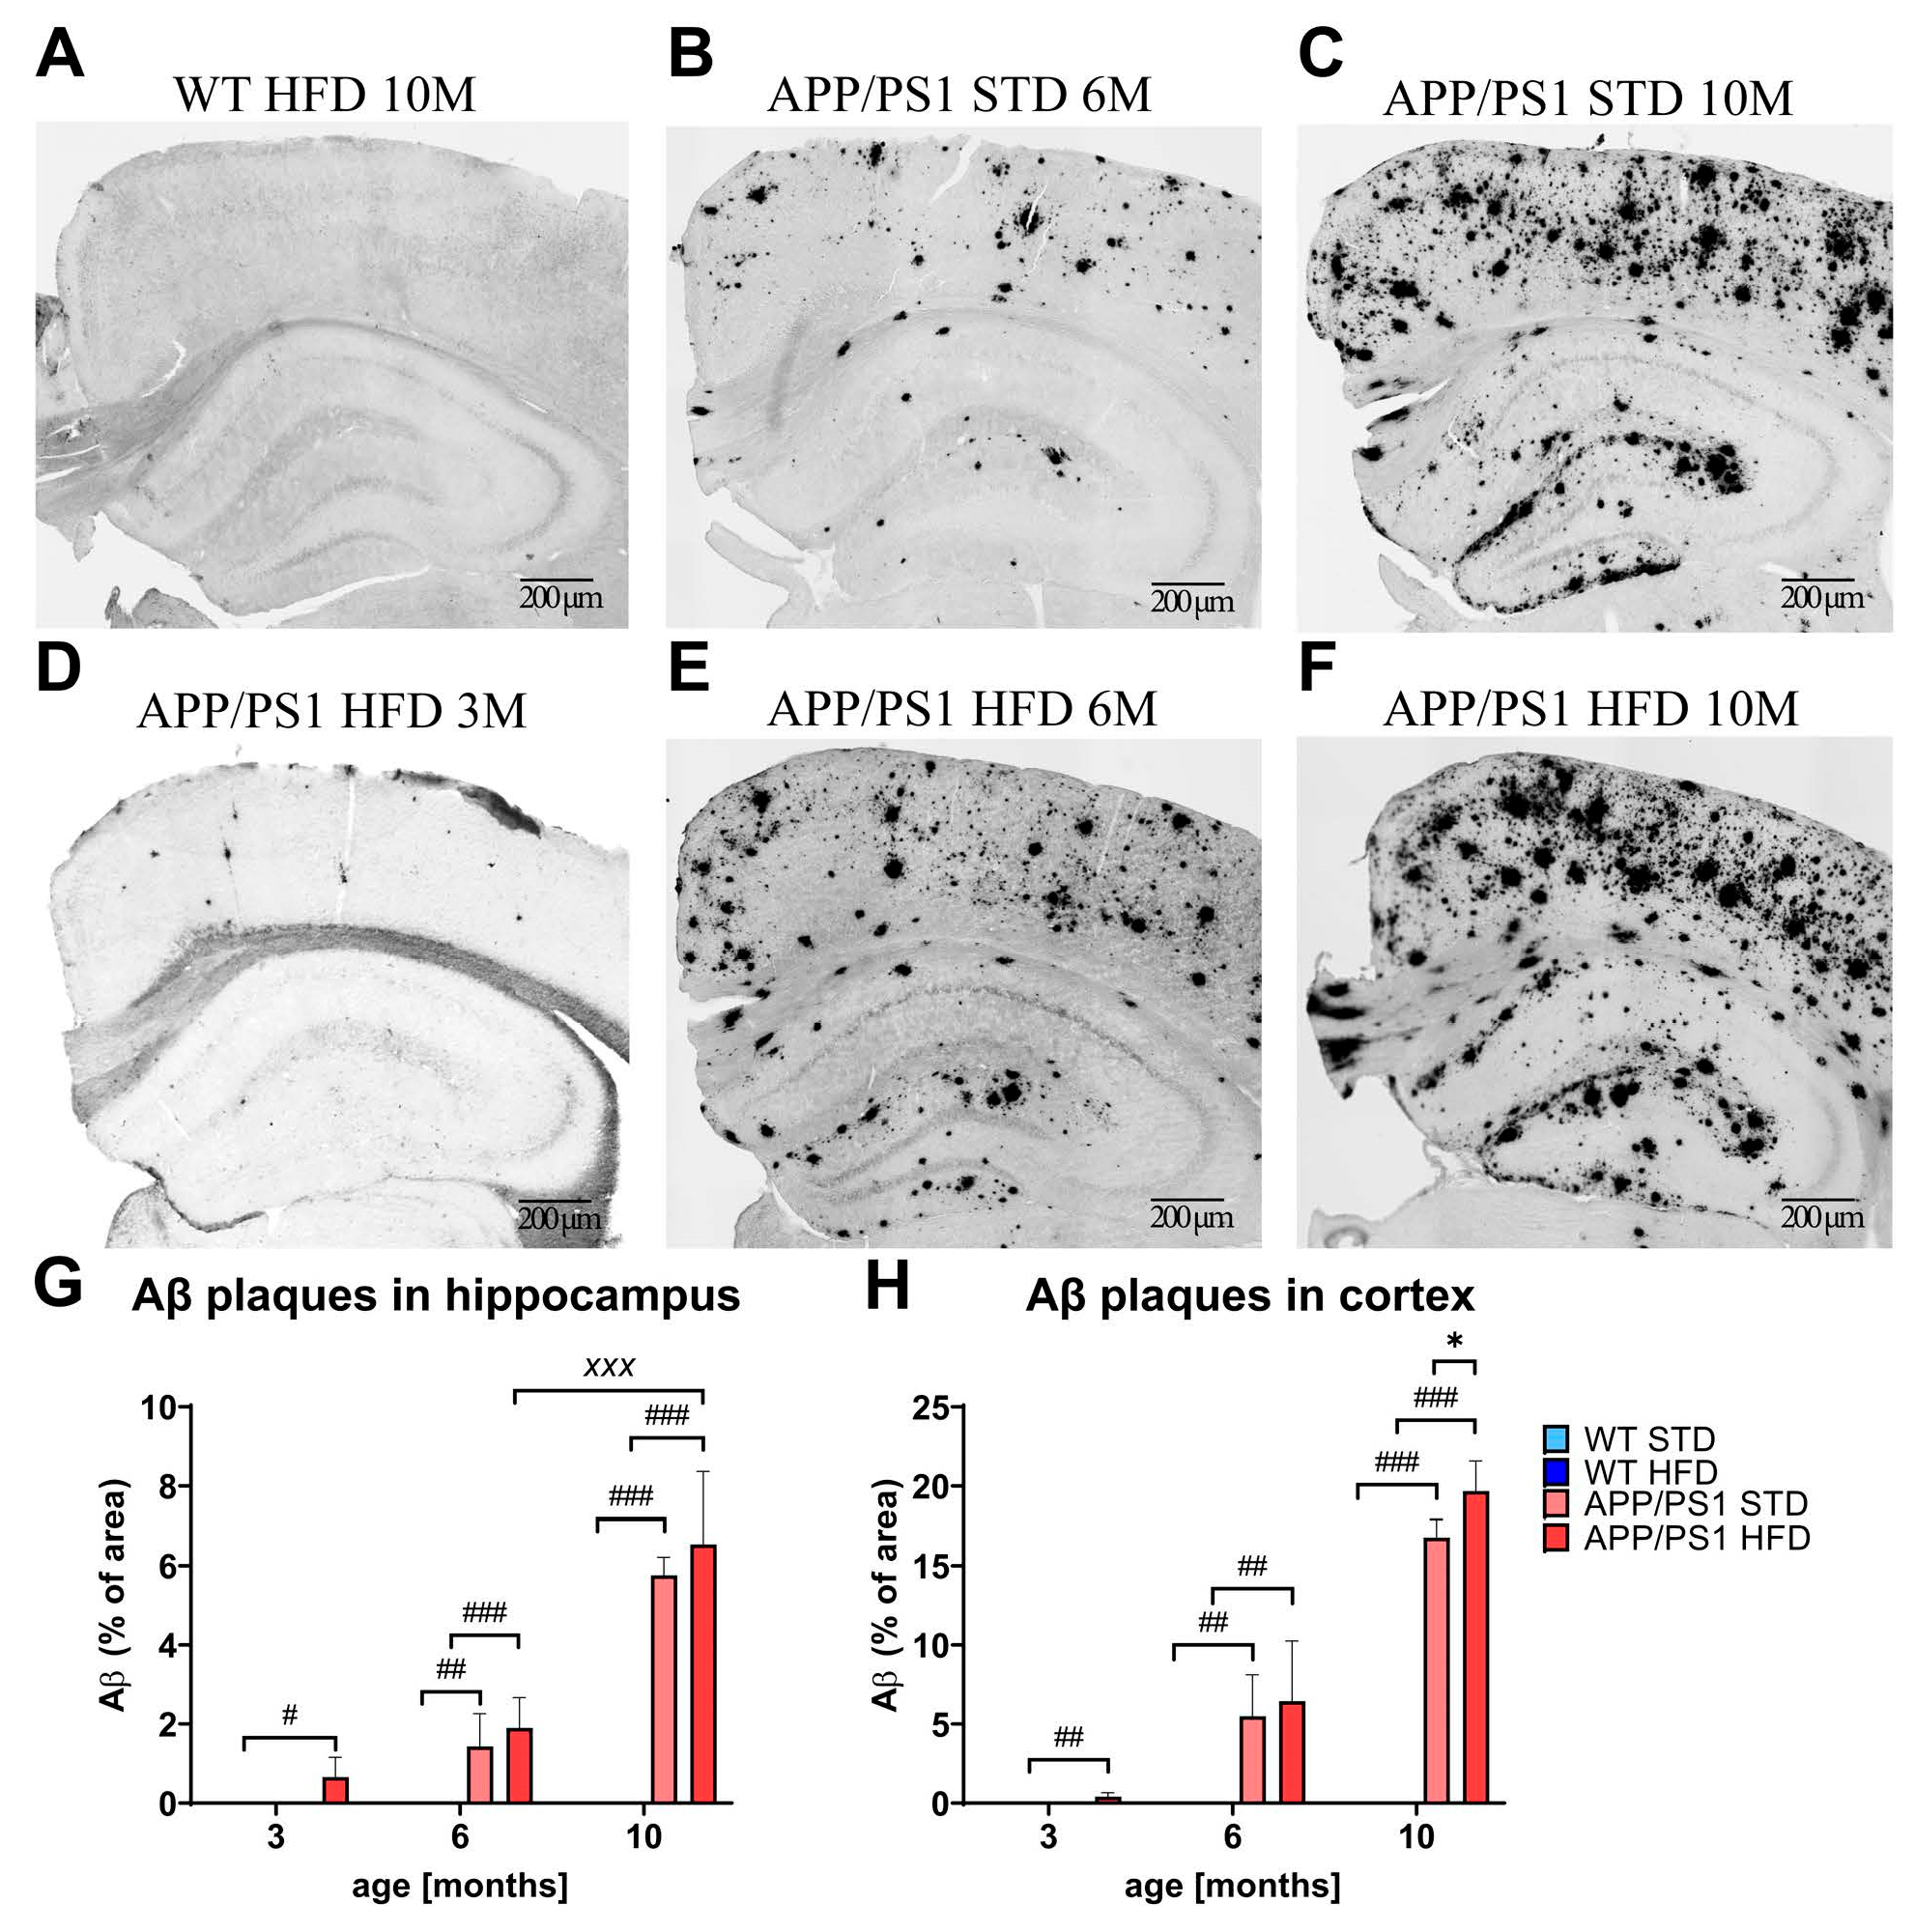
3.8. HFD Exacerbated Aβ Plaque Load in the Cortices of APP/PS1 Mice
3.9. HFD Worsened Neuroinflammation in the Brains of APP/PS1 Mice
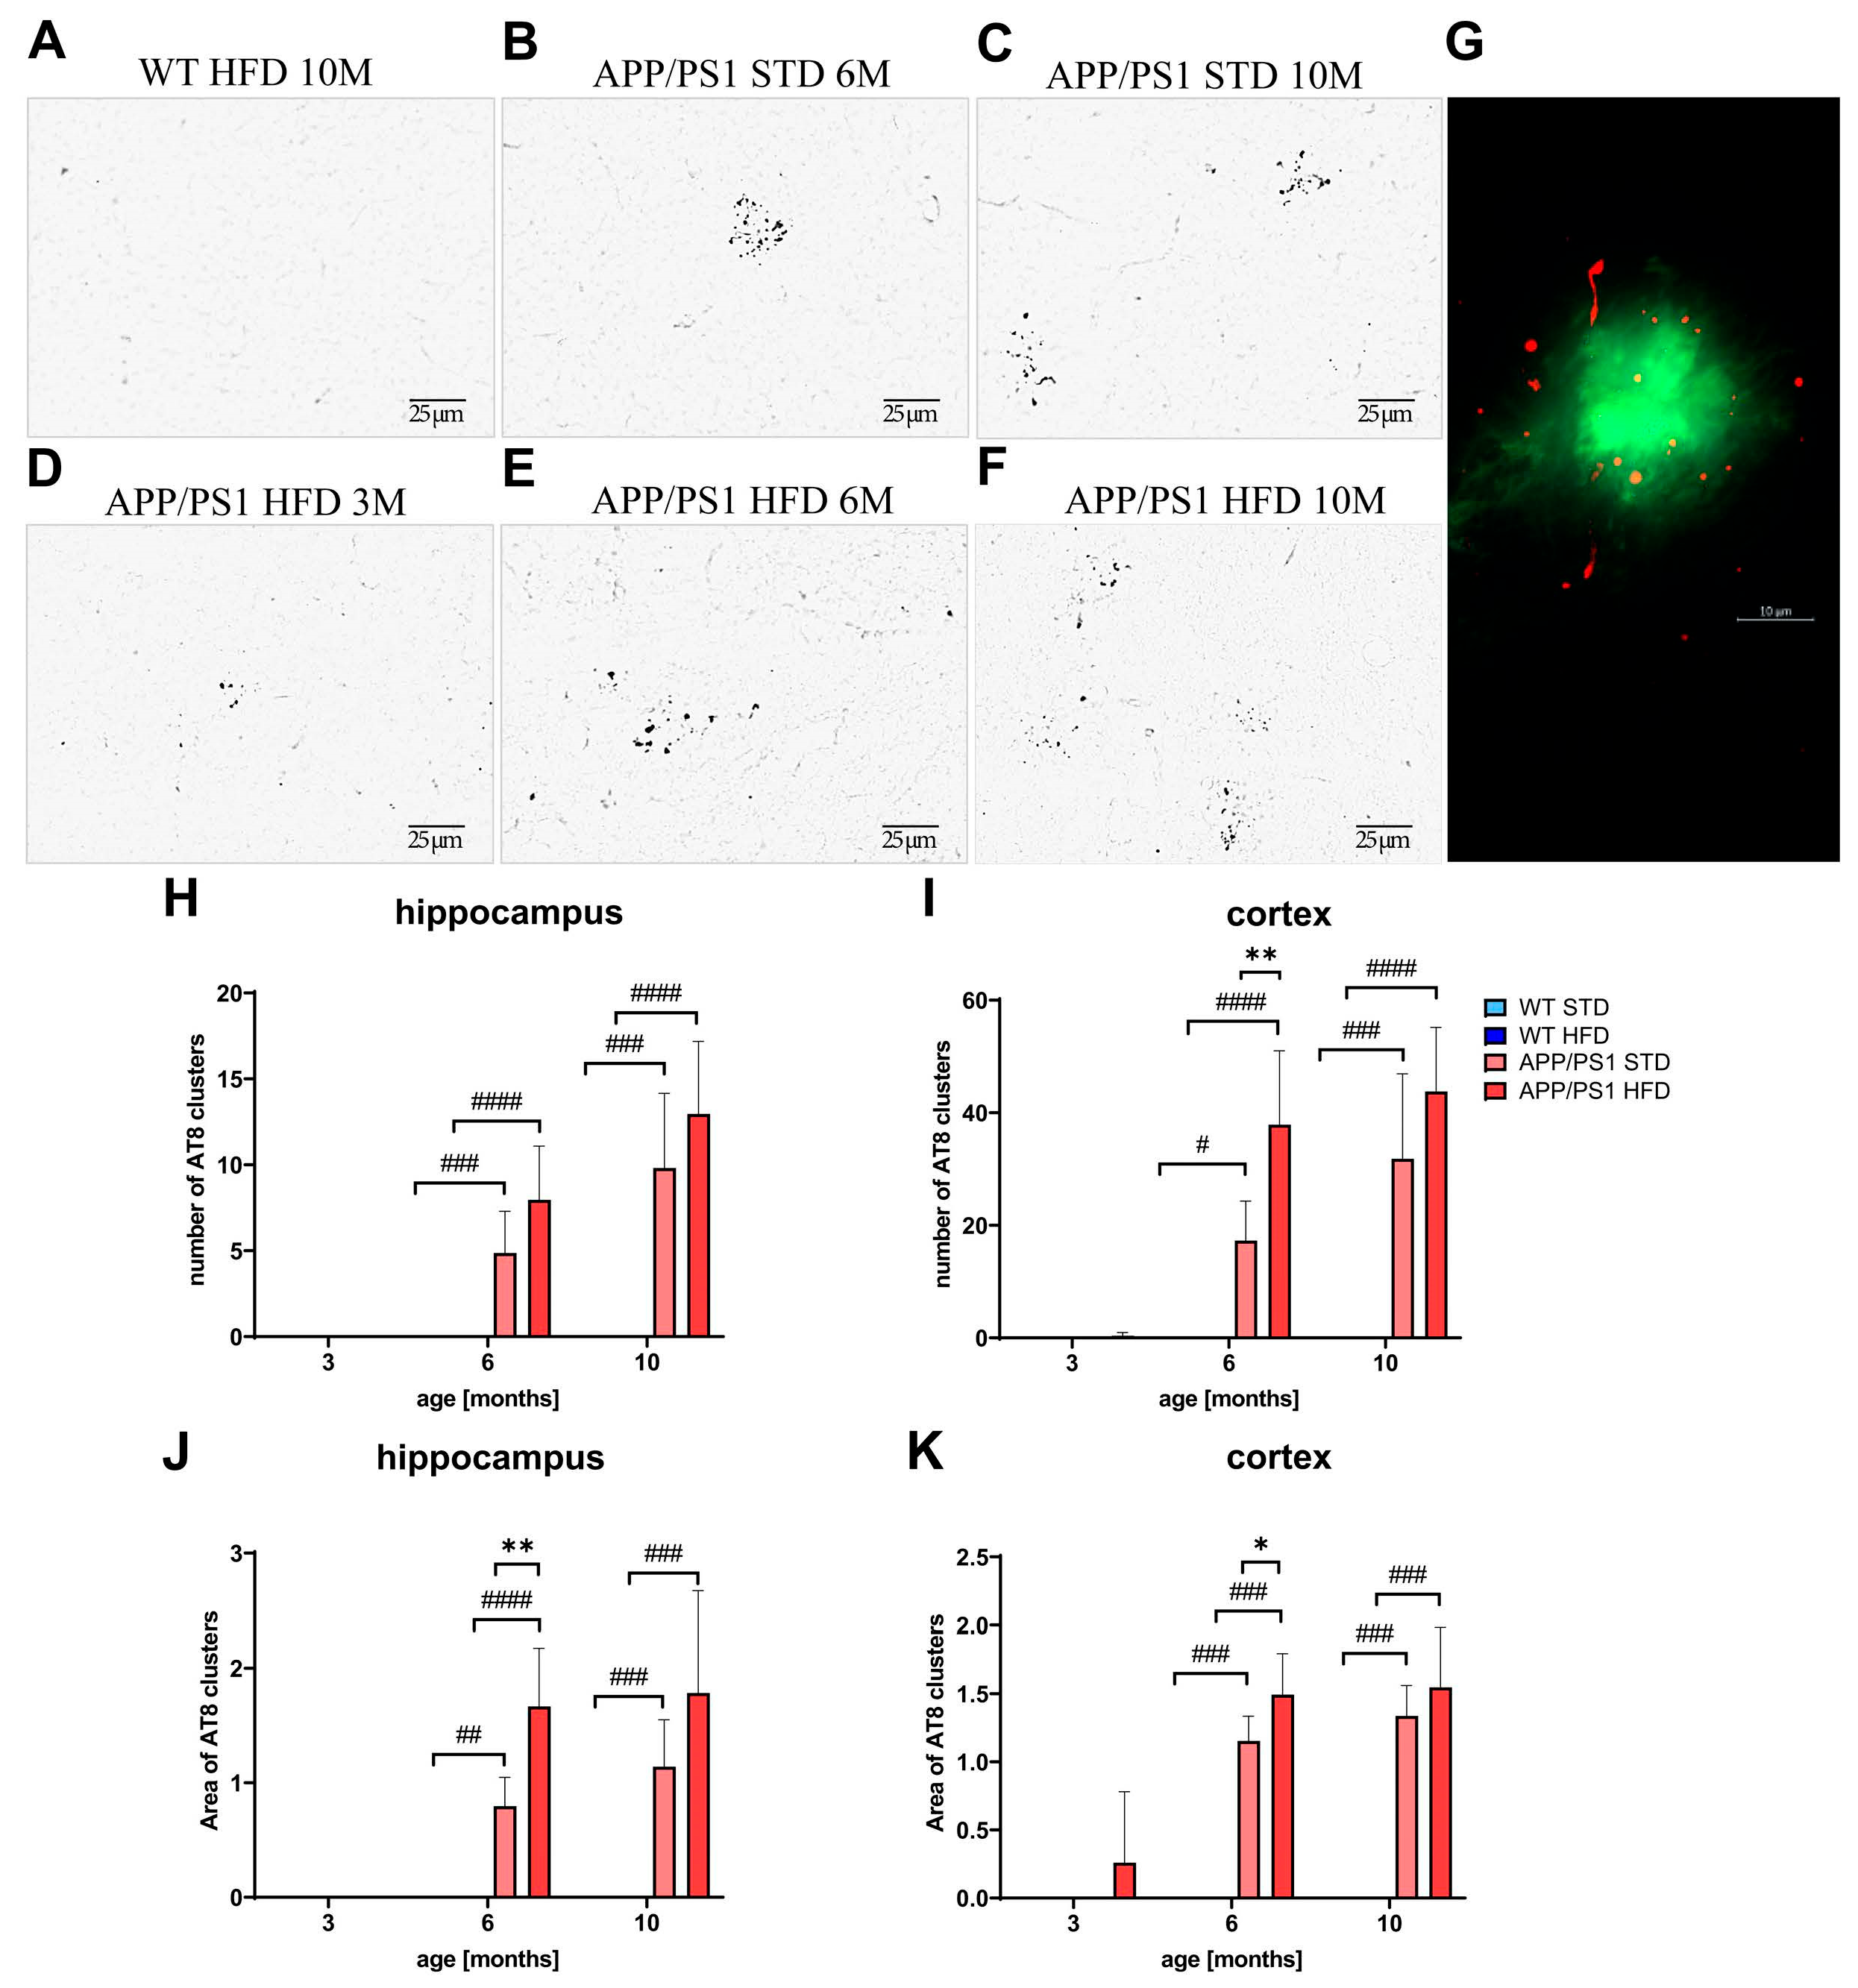
3.10. HFD Increased Tau Phosphorylation around Aβ Plaques in the Hippocampi and Cortices of 6-Month-Old APP/PS1 Mice
3.11. HFD and Age Attenuated the PI3K/Akt Signaling Pathway in the Hippocampus
3.12. Decreased Neuronal Density and Neurogenesis with Age of Mice
3.13. HFD Decreased Synaptogenesis in the Hippocampi of APP/PS1 Mice
3.14. HFD Upregulated TGs in the Frontal Cortices of APP/PS1 Mice
4. Discussion
5. Conclusions
Supplementary Materials
Author Contributions
Funding
Institutional Review Board Statement
Informed Consent Statement
Data Availability Statement
Acknowledgments
Conflicts of Interest
References
- Duong, S.; Patel, T.; Chang, F. Dementia: What pharmacists need to know. Can. Pharm. J. 2017, 150, 118–129. [Google Scholar] [CrossRef] [PubMed]
- DeTure, M.A.; Dickson, D.W. The neuropathological diagnosis of Alzheimer’s disease. Mol. Neurodegener. 2019, 14, 32. [Google Scholar] [CrossRef] [PubMed]
- Bloom, G.S. Amyloid-beta and tau: The trigger and bullet in Alzheimer disease pathogenesis. JAMA Neurol. 2014, 71, 505–508. [Google Scholar] [CrossRef] [PubMed]
- Serrano-Pozo, A.; Mielke, M.L.; Gomez-Isla, T.; Betensky, R.A.; Growdon, J.H.; Frosch, M.P.; Hyman, B.T. Reactive glia not only associates with plaques but also parallels tangles in Alzheimer’s disease. Am. J. Pathol. 2011, 179, 1373–1384. [Google Scholar] [CrossRef] [PubMed]
- Zilberter, Y.; Zilberter, M. The vicious circle of hypometabolism in neurodegenerative diseases: Ways and mechanisms of metabolic correction. J. Neurosci. Res. 2017, 95, 2217–2235. [Google Scholar] [CrossRef] [PubMed]
- Bagnol, D.; Al-Shamma, H.A.; Behan, D.; Whelan, K.; Grottick, A.J. Diet-induced models of obesity (DIO) in rodents. Curr. Protoc. Neurosci. 2012, 59, 9–38. [Google Scholar] [CrossRef] [PubMed]
- Buettner, R.; Scholmerich, J.; Bollheimer, L.C. High-fat diets: Modeling the metabolic disorders of human obesity in rodents. Obesity 2007, 15, 798–808. [Google Scholar] [CrossRef] [PubMed]
- Youngren, J.F.; Paik, J.; Barnard, R.J. Impaired insulin-receptor autophosphorylation is an early defect in fat-fed, insulin-resistant rats. J. Appl. Physiol. 2001, 91, 2240–2247. [Google Scholar] [CrossRef]
- Tabassum, S.; Misrani, A.; Yang, L. Exploiting Common Aspects of Obesity and Alzheimer’s Disease. Front. Hum. Neurosci. 2020, 14, 602360. [Google Scholar] [CrossRef]
- Zhang, D.; Liu, Z.X.; Choi, C.S.; Tian, L.; Kibbey, R.; Dong, J.; Cline, G.W.; Wood, P.A.; Shulman, G.I. Mitochondrial dysfunction due to long-chain Acyl-CoA dehydrogenase deficiency causes hepatic steatosis and hepatic insulin resistance. Proc. Natl. Acad. Sci. USA 2007, 104, 17075–17080. [Google Scholar] [CrossRef]
- Sripetchwandee, J.; Chattipakorn, N.; Chattipakorn, S.C. Links Between Obesity-Induced Brain Insulin Resistance, Brain Mitochondrial Dysfunction, and Dementia. Front. Endocrinol. 2018, 9, 496. [Google Scholar] [CrossRef] [PubMed]
- Boleti, A.P.D.A.; Cardoso, P.H.D.O.; Frihling, B.E.F.; e Silva, P.S.; de Moraes, L.F.R.; Migliolo, L. Adipose tissue, systematic inflammation, and neurodegenerative diseases. Neural Regen. Res. 2023, 18, 38–46. [Google Scholar] [CrossRef]
- Jankowsky, J.L.; Slunt, H.H.; Ratovitski, T.; Jenkins, N.A.; Copeland, N.G.; Borchelt, D.R. Co-expression of multiple transgenes in mouse CNS: A comparison of strategies. Biomol. Eng. 2001, 17, 157–165. [Google Scholar] [CrossRef] [PubMed]
- Guo, Y.; Ma, X.; Li, P.; Dong, S.; Huang, X.; Ren, X.; Yuan, L. High-fat diet induced discrepant peripheral and central nervous systems insulin resistance in APPswe/PS1dE9 and wild-type C57BL/6J mice. Aging 2020, 13, 1236–1250. [Google Scholar] [CrossRef] [PubMed]
- Ma, X.; Guo, Y.; Xu, J.; Wang, X.; Dong, S.; Gao, Y.; Van Halm-Lutterodt, N.; Yuan, L. Effects of distinct n-6 to n-3 polyunsaturated fatty acid ratios on insulin resistant and AD-like phenotypes in high-fat diets-fed APP/PS1 mice. Food Res. Int. 2022, 162, 112207. [Google Scholar] [CrossRef] [PubMed]
- Lee, Y.H.; Hsu, H.C.; Kao, P.C.; Shiao, Y.J.; Yeh, S.H.; Shie, F.S.; Hsu, S.M.; Yeh, C.W.; Liu, H.K.; Yang, S.B.; et al. Augmented Insulin and Leptin Resistance of High Fat Diet-Fed APPswe/PS1dE9 Transgenic Mice Exacerbate Obesity and Glycemic Dysregulation. Int. J. Mol. Sci. 2018, 19, 2333. [Google Scholar] [CrossRef] [PubMed]
- Ruiz, H.H.; Chi, T.; Shin, A.C.; Lindtner, C.; Hsieh, W.; Ehrlich, M.; Gandy, S.; Buettner, C. Increased susceptibility to metabolic dysregulation in a mouse model of Alzheimer’s disease is associated with impaired hypothalamic insulin signaling and elevated BCAA levels. Alzheimer’s Dement. J. Alzheimer’s Assoc. 2016, 12, 851–861. [Google Scholar] [CrossRef] [PubMed]
- Bracko, O.; Vinarcsik, L.K.; Cruz Hernandez, J.C.; Ruiz-Uribe, N.E.; Haft-Javaherian, M.; Falkenhain, K.; Ramanauskaite, E.M.; Ali, M.; Mohapatra, A.; Swallow, M.A.; et al. High fat diet worsens Alzheimer’s disease-related behavioral abnormalities and neuropathology in APP/PS1 mice, but not by synergistically decreasing cerebral blood flow. Sci. Rep. 2020, 10, 9884. [Google Scholar] [CrossRef]
- Fan, X.; Liu, B.; Zhou, J.; Gu, X.; Zhou, Y.; Yang, Y.; Guo, F.; Wei, X.; Wang, H.; Si, N.; et al. High-Fat Diet Alleviates Neuroinflammation and Metabolic Disorders of APP/PS1 Mice and the Intervention with Chinese Medicine. Front. Aging Neurosci. 2021, 13, 658376. [Google Scholar] [CrossRef]
- Kacirova, M.; Zelezna, B.; Blazkova, M.; Holubova, M.; Popelova, A.; Kunes, J.; Sediva, B.; Maletinska, L. Aging and high-fat diet feeding lead to peripheral insulin resistance and sex-dependent changes in brain of mouse model of tau pathology THY-Tau22. J. Neuroinflamm. 2021, 18, 141. [Google Scholar] [CrossRef]
- Leboucher, A.; Laurent, C.; Fernandez-Gomez, F.J.; Burnouf, S.; Troquier, L.; Eddarkaoui, S.; Demeyer, D.; Caillierez, R.; Zommer, N.; Vallez, E.; et al. Detrimental effects of diet-induced obesity on tau pathology are independent of insulin resistance in tau transgenic mice. Diabetes 2013, 62, 1681–1688. [Google Scholar] [CrossRef] [PubMed]
- Knight, E.M.; Martins, I.V.; Gumusgoz, S.; Allan, S.M.; Lawrence, C.B. High-fat diet-induced memory impairment in triple-transgenic Alzheimer’s disease (3xTgAD) mice is independent of changes in amyloid and tau pathology. Neurobiol. Aging 2014, 35, 1821–1832. [Google Scholar] [CrossRef] [PubMed]
- Matysková, R.; Maletínská, L.; Maixnerová, J.; Pirník, Z.; Kiss, A.; Zelezná, B. Comparison of the obesity phenotypes related to monosodium glutamate effect on arcuate nucleus and/or the high fat diet feeding in C57BL/6 and NMRI mice. Physiol. Res. 2008, 57, 727–734. [Google Scholar] [CrossRef] [PubMed]
- Prazienkova, V.; Funda, J.; Pirnik, Z.; Karnosova, A.; Hruba, L.; Korinkova, L.; Neprasova, B.; Janovska, P.; Benzce, M.; Kadlecova, M.; et al. GPR10 gene deletion in mice increases basal neuronal activity, disturbs insulin sensitivity and alters lipid homeostasis. Gene 2021, 774, 145427. [Google Scholar] [CrossRef] [PubMed]
- Pacesova, A.; Holubova, M.; Hruba, L.; Strnadova, V.; Neprasova, B.; Pelantova, H.; Kuzma, M.; Zelezna, B.; Kunes, J.; Maletinska, L. Age-related metabolic and neurodegenerative changes in SAMP8 mice. Aging 2022, 14, 7300–7327. [Google Scholar] [CrossRef] [PubMed]
- Holubova, M.; Hruba, L.; Popelova, A.; Bencze, M.; Prazienkova, V.; Gengler, S.; Kratochvilova, H.; Haluzik, M.; Zelezna, B.; Kunes, J.; et al. Liraglutide and a lipidized analog of prolactin-releasing peptide show neuroprotective effects in a mouse model of beta-amyloid pathology. Neuropharmacology 2019, 144, 377–387. [Google Scholar] [CrossRef] [PubMed]
- Franklin, K.; Paxinos, G. The Mouse Brain in Stereotaxic Coordinates; Academic Press: Cambridge, MA, USA, 2008. [Google Scholar]
- Strnad, S.; Vrkoslav, V.; Klimsova, Z.; Zemenova, J.; Cvacka, J.; Maletinska, L.; Sykora, D. Application of matrix-assisted laser desorption/ionization mass spectrometry imaging in combination with LC-MS in pharmacokinetic study of metformin. Bioanalysis 2018, 10, 71–81. [Google Scholar] [CrossRef]
- Strnad, S.; PraZienkova, V.; Holubova, M.; Sykora, D.; Cvacka, J.; Maletinska, L.; Zelezna, B.; Kunes, J.; Vrkoslav, V. Mass spectrometry imaging of free-floating brain sections detects pathological lipid distribution in a mouse model of Alzheimer’s-like pathology. Analyst 2020, 145, 4595–4605. [Google Scholar] [CrossRef]
- Korinkova, L.; Holubova, M.; Neprasova, B.; Hruba, L.; Prazienkova, V.; Bencze, M.; Haluzik, M.; Kunes, J.; Maletinska, L.; Zelezna, B. Synergistic effect of leptin and lipidized PrRP on metabolic pathways in ob/ob mice. J. Mol. Endocrinol. 2020, 64, 77–90. [Google Scholar] [CrossRef]
- Kleiner, D.E.; Brunt, E.M.; Van Natta, M.; Behling, C.; Contos, M.J.; Cummings, O.W.; Ferrell, L.D.; Liu, Y.C.; Torbenson, M.S.; Unalp-Arida, A.; et al. Design and validation of a histological scoring system for nonalcoholic fatty liver disease. Hepatology 2005, 41, 1313–1321. [Google Scholar] [CrossRef]
- Lofgren, L.; Forsberg, G.B.; Stahlman, M. The BUME method: A new rapid and simple chloroform-free method for total lipid extraction of animal tissue. Sci. Rep. 2016, 6, 27688. [Google Scholar] [CrossRef] [PubMed]
- Pelantova, H.; Buganova, M.; Anyz, J.; Zelezna, B.; Maletinska, L.; Novak, D.; Haluzik, M.; Kuzma, M. Strategy for NMR metabolomic analysis of urine in mouse models of obesity—From sample collection to interpretation of acquired data. J. Pharm. Biomed. Anal. 2015, 115, 225–235. [Google Scholar] [CrossRef] [PubMed]
- Wishart, D.S.; Feunang, Y.D.; Marcu, A.; Guo, A.C.; Liang, K.; Vazquez-Fresno, R.; Sajed, T.; Johnson, D.; Li, C.; Karu, N.; et al. HMDB 4.0: The human metabolome database for 2018. Nucleic Acids Res 2018, 46, D608–D617. [Google Scholar] [CrossRef] [PubMed]
- Lansang, M.C.; Williams, G.H.; Carroll, J.S. Correlation between the glucose clamp technique and the homeostasis model assessment in hypertension. Am. J. Hypertens. 2001, 14, 51–53. [Google Scholar] [CrossRef] [PubMed]
- Chong, J.; Wishart, D.S.; Xia, J. Using MetaboAnalyst 4.0 for Comprehensive and Integrative Metabolomics Data Analysis. Curr. Protoc. Bioinform. 2019, 68, e86. [Google Scholar] [CrossRef] [PubMed]
- Strnad, Š.; Pražienková, V.; Sýkora, D.; Cvačka, J.; Maletínská, L.; Popelová, A.; Vrkoslav, V. The use of 1,5-diaminonaphthalene for matrix-assisted laser desorption/ionization mass spectrometry imaging of brain in neurodegenerative disorders. Talanta 2019, 201, 364–372. [Google Scholar] [CrossRef] [PubMed]
- De Felice, F.G.; Lourenco, M.V.; Ferreira, S.T. How does brain insulin resistance develop in Alzheimer’s disease? Alzheimer’s Dement. J. Alzheimer’s Assoc. 2014, 10, S26–S32. [Google Scholar] [CrossRef] [PubMed]
- Clee, S.M.; Attie, A.D. The genetic landscape of type 2 diabetes in mice. Endocr. Rev. 2007, 28, 48–83. [Google Scholar] [CrossRef]
- Ramos-Rodriguez, J.J.; Ortiz-Barajas, O.; Gamero-Carrasco, C.; de la Rosa, P.R.; Infante-Garcia, C.; Zopeque-Garcia, N.; Lechuga-Sancho, A.M.; Garcia-Alloza, M. Prediabetes-induced vascular alterations exacerbate central pathology in APPswe/PS1dE9 mice. Psychoneuroendocrinology 2014, 48, 123–135. [Google Scholar] [CrossRef]
- Lechuga-Sancho, A.M.; Arroba, A.I.; Frago, L.M.; Paneda, C.; Garcia-Caceres, C.; Delgado Rubin de Celix, A.; Argente, J.; Chowen, J.A. Activation of the intrinsic cell death pathway, increased apoptosis and modulation of astrocytes in the cerebellum of diabetic rats. Neurobiol. Dis. 2006, 23, 290–299. [Google Scholar] [CrossRef]
- Eder, K.; Gessner, D.K.; Ringseis, R. Fibroblast growth factor 21 in dairy cows: Current knowledge and potential relevance. J. Anim. Sci. Biotechnol. 2021, 12, 97. [Google Scholar] [CrossRef] [PubMed]
- Misiak, B.; Leszek, J.; Kiejna, A. Metabolic syndrome, mild cognitive impairment and Alzheimer’s disease—The emerging role of systemic low-grade inflammation and adiposity. Brain Res. Bull. 2012, 89, 144–149. [Google Scholar] [CrossRef] [PubMed]
- Festa, A.; Hanley, A.J.; Tracy, R.P.; D’Agostino, R., Jr.; Haffner, S.M. Inflammation in the prediabetic state is related to increased insulin resistance rather than decreased insulin secretion. Circulation 2003, 108, 1822–1830. [Google Scholar] [CrossRef] [PubMed]
- Salek, R.M.; Maguire, M.L.; Bentley, E.; Rubtsov, D.V.; Hough, T.; Cheeseman, M.; Nunez, D.; Sweatman, B.C.; Haselden, J.N.; Cox, R.D.; et al. A metabolomic comparison of urinary changes in type 2 diabetes in mouse, rat, and human. Physiol. Genomics 2007, 29, 99–108. [Google Scholar] [CrossRef] [PubMed]
- Pelantova, H.; Buganova, M.; Holubova, M.; Sediva, B.; Zemenova, J.; Sykora, D.; Kavalkova, P.; Haluzik, M.; Zelezna, B.; Maletinska, L.; et al. Urinary metabolomic profiling in mice with diet-induced obesity and type 2 diabetes mellitus after treatment with metformin, vildagliptin and their combination. Mol. Cell Endocrinol. 2016, 431, 88–100. [Google Scholar] [CrossRef] [PubMed]
- Cermakova, M.; Pelantova, H.; Neprasova, B.; Sediva, B.; Maletinska, L.; Kunes, J.; Tomasova, P.; Zelezna, B.; Kuzma, M. Metabolomic Study of Obesity and Its Treatment with Palmitoylated Prolactin-Releasing Peptide Analog in Spontaneously Hypertensive and Normotensive Rats. J. Proteome Res. 2019, 18, 1735–1750. [Google Scholar] [CrossRef] [PubMed]
- Lees, H.J.; Swann, J.R.; Poucher, S.; Holmes, E.; Wilson, I.D.; Nicholson, J.K. Obesity and Cage Environment Modulate Metabolism in the Zucker Rat: A Multiple Biological Matrix Approach to Characterizing Metabolic Phenomena. J. Proteome Res. 2019, 18, 2160–2174. [Google Scholar] [CrossRef]
- Schofield, Z.; Reed, M.A.; Newsome, P.N.; Adams, D.H.; Gunther, U.L.; Lalor, P.F. Changes in human hepatic metabolism in steatosis and cirrhosis. World J. Gastroenterol. 2017, 23, 2685–2695. [Google Scholar] [CrossRef]
- Xie, Z.; Li, H.; Wang, K.; Lin, J.; Wang, Q.; Zhao, G.; Jia, W.; Zhang, Q. Analysis of transcriptome and metabolome profiles alterations in fatty liver induced by high-fat diet in rat. Metab. Clin. Exp. 2010, 59, 554–560. [Google Scholar] [CrossRef]
- Kim, D.G.; Krenz, A.; Toussaint, L.E.; Maurer, K.J.; Robinson, S.A.; Yan, A.; Torres, L.; Bynoe, M.S. Non-alcoholic fatty liver disease induces signs of Alzheimer’s disease (AD) in wild-type mice and accelerates pathological signs of AD in an AD model. J. Neuroinflamm. 2016, 13, 1. [Google Scholar] [CrossRef]
- Kim, G.A.; Oh, C.H.; Kim, J.W.; Jeong, S.J.; Oh, I.H.; Lee, J.S.; Park, K.C.; Shim, J.J. Association between non-alcoholic fatty liver disease and the risk of dementia: A nationwide cohort study. Liver Int. 2022, 42, 1027–1036. [Google Scholar] [CrossRef] [PubMed]
- Estrada, L.D.; Ahumada, P.; Cabrera, D.; Arab, J.P. Liver Dysfunction as a Novel Player in Alzheimer’s Progression: Looking Outside the Brain. Front. Aging Neurosci. 2019, 11, 174. [Google Scholar] [CrossRef] [PubMed]
- Huang, X.; Liu, G.; Guo, J.; Su, Z. The PI3K/AKT pathway in obesity and type 2 diabetes. Int. J. Biol. Sci. 2018, 14, 1483–1496. [Google Scholar] [CrossRef] [PubMed]
- Americo-Da-Silva, L.; Aguilera, J.; Quinteros-Waltemath, O.; Sanchez-Aguilera, P.; Russell, J.; Cadagan, C.; Meneses-Valdes, R.; Sanchez, G.; Estrada, M.; Jorquera, G.; et al. Activation of the NLRP3 Inflammasome Increases the IL-1beta Level and Decreases GLUT4 Translocation in Skeletal Muscle during Insulin Resistance. Int. J. Mol. Sci. 2021, 22, 10212. [Google Scholar] [CrossRef] [PubMed]
- Abel, E.D.; Peroni, O.; Kim, J.K.; Kim, Y.B.; Boss, O.; Hadro, E.; Minnemann, T.; Shulman, G.I.; Kahn, B.B. Adipose-selective targeting of the GLUT4 gene impairs insulin action in muscle and liver. Nature 2001, 409, 729–733. [Google Scholar] [CrossRef] [PubMed]
- Favaretto, F.; Milan, G.; Collin, G.B.; Marshall, J.D.; Stasi, F.; Maffei, P.; Vettor, R.; Naggert, J.K. GLUT4 defects in adipose tissue are early signs of metabolic alterations in Alms1GT/GT, a mouse model for obesity and insulin resistance. PLoS ONE 2014, 9, e109540. [Google Scholar] [CrossRef] [PubMed]
- Gaster, M.; Staehr, P.; Beck-Nielsen, H.; Schroder, H.D.; Handberg, A. GLUT4 is reduced in slow muscle fibers of type 2 diabetic patients: Is insulin resistance in type 2 diabetes a slow, type 1 fiber disease? Diabetes 2001, 50, 1324–1329. [Google Scholar] [CrossRef] [PubMed]
- Seraphim, P.M.; Nunes, M.T.; Machado, U.F. GLUT4 protein expression in obese and lean 12-month-old rats: Insights from different types of data analysis. Braz. J. Med. Biol. Res. 2001, 34, 1353–1362. [Google Scholar] [CrossRef]
- Nelson, V.L.; Jiang, Y.P.; Dickman, K.G.; Ballou, L.M.; Lin, R.Z. Adipose tissue insulin resistance due to loss of PI3K p110alpha leads to decreased energy expenditure and obesity. Am. J. Physiol. Endocrinol. Metab. 2014, 306, E1205–E1216. [Google Scholar] [CrossRef]
- Kruszynska, Y.T.; Worrall, D.S.; Ofrecio, J.; Frias, J.P.; Macaraeg, G.; Olefsky, J.M. Fatty acid-induced insulin resistance: Decreased muscle PI3K activation but unchanged Akt phosphorylation. J. Clin. Endocrinol. Metab. 2002, 87, 226–234. [Google Scholar] [CrossRef]
- Maletinska, L.; Nagelova, V.; Ticha, A.; Zemenova, J.; Pirnik, Z.; Holubova, M.; Spolcova, A.; Mikulaskova, B.; Blechova, M.; Sykora, D.; et al. Novel lipidized analogs of prolactin-releasing peptide have prolonged half-lives and exert anti-obesity effects after peripheral administration. Int. J. Obes. 2015, 39, 986–993. [Google Scholar] [CrossRef]
- Kimura, A.; Ohmichi, M.; Tasaka, K.; Kanda, Y.; Ikegami, H.; Hayakawa, J.; Hisamoto, K.; Morishige, K.; Hinuma, S.; Kurachi, H.; et al. Prolactin-releasing peptide activation of the prolactin promoter is differentially mediated by extracellular signal-regulated protein kinase and c-Jun N-terminal protein kinase. J. Biol. Chem. 2000, 275, 3667–3674. [Google Scholar] [CrossRef] [PubMed]
- Aso, E.; Semakova, J.; Joda, L.; Semak, V.; Halbaut, L.; Calpena, A.; Escolano, C.; Perales, J.C.; Ferrer, I. Triheptanoin supplementation to ketogenic diet curbs cognitive impairment in APP/PS1 mice used as a model of familial Alzheimer’s disease. Curr. Alzheimer Res. 2013, 10, 290–297. [Google Scholar] [CrossRef] [PubMed]
- Beckett, T.L.; Studzinski, C.M.; Keller, J.N.; Paul Murphy, M.; Niedowicz, D.M. A ketogenic diet improves motor performance but does not affect beta-amyloid levels in a mouse model of Alzheimer’s disease. Brain Res. 2013, 1505, 61–67. [Google Scholar] [CrossRef] [PubMed]
- Julien, C.; Tremblay, C.; Phivilay, A.; Berthiaume, L.; Emond, V.; Julien, P.; Calon, F. High-fat diet aggravates amyloid-beta and tau pathologies in the 3xTg-AD mouse model. Neurobiol. Aging 2010, 31, 1516–1531. [Google Scholar] [CrossRef] [PubMed]
- Selkoe, D.J.; Hardy, J. The amyloid hypothesis of Alzheimer’s disease at 25 years. EMBO Mol. Med. 2016, 8, 595–608. [Google Scholar] [CrossRef] [PubMed]
- Chen, Y.; Zhao, S.; Fan, Z.; Li, Z.; Zhu, Y.; Shen, T.; Li, K.; Yan, Y.; Tian, J.; Liu, Z.; et al. Metformin attenuates plaque-associated tau pathology and reduces amyloid-beta burden in APP/PS1 mice. Alzheimer’s Res. Ther. 2021, 13, 40. [Google Scholar] [CrossRef] [PubMed]
- Chabrier, M.A.; Cheng, D.; Castello, N.A.; Green, K.N.; LaFerla, F.M. Synergistic effects of amyloid-beta and wild-type human tau on dendritic spine loss in a floxed double transgenic model of Alzheimer’s disease. Neurobiol. Dis. 2014, 64, 107–117. [Google Scholar] [CrossRef] [PubMed]
- Roberson, E.D.; Scearce-Levie, K.; Palop, J.J.; Yan, F.; Cheng, I.H.; Wu, T.; Gerstein, H.; Yu, G.Q.; Mucke, L. Reducing endogenous tau ameliorates amyloid beta-induced deficits in an Alzheimer’s disease mouse model. Science 2007, 316, 750–754. [Google Scholar] [CrossRef] [PubMed]
- Jin, M.; Shepardson, N.; Yang, T.; Chen, G.; Walsh, D.; Selkoe, D.J. Soluble amyloid beta-protein dimers isolated from Alzheimer cortex directly induce Tau hyperphosphorylation and neuritic degeneration. Proc. Natl. Acad. Sci. USA 2011, 108, 5819–5824. [Google Scholar] [CrossRef]
- Scott Bitner, R. Cyclic AMP response element-binding protein (CREB) phosphorylation: A mechanistic marker in the development of memory enhancing Alzheimer’s disease therapeutics. Biochem. Pharmacol. 2012, 83, 705–714. [Google Scholar] [CrossRef] [PubMed]
- Lindqvist, A.; Mohapel, P.; Bouter, B.; Frielingsdorf, H.; Pizzo, D.; Brundin, P.; Erlanson-Albertsson, C. High-fat diet impairs hippocampal neurogenesis in male rats. Eur. J. Neurol. 2006, 13, 1385–1388. [Google Scholar] [CrossRef] [PubMed]
- Bracke, A.; Domanska, G.; Bracke, K.; Harzsch, S.; van den Brandt, J.; Broker, B.; von Bohlen Und Halbach, O. Obesity Impairs Mobility and Adult Hippocampal Neurogenesis. J Exp. Neurosci. 2019, 13, 1179069519883580. [Google Scholar] [CrossRef] [PubMed]
- Rupp, N.J.; Wegenast-Braun, B.M.; Radde, R.; Calhoun, M.E.; Jucker, M. Early onset amyloid lesions lead to severe neuritic abnormalities and local, but not global neuron loss in APPPS1 transgenic mice. Neurobiol. Aging 2011, 32, 2324.e1–2324.e6. [Google Scholar] [CrossRef] [PubMed]
- Crispino, M.; Trinchese, G.; Penna, E.; Cimmino, F.; Catapano, A.; Villano, I.; Perrone-Capano, C.; Mollica, M.P. Interplay between Peripheral and Central Inflammation in Obesity-Promoted Disorders: The Impact on Synaptic Mitochondrial Functions. Int. J. Mol. Sci. 2020, 21, 5964. [Google Scholar] [CrossRef] [PubMed]
- Arnold, S.E.; Lucki, I.; Brookshire, B.R.; Carlson, G.C.; Browne, C.A.; Kazi, H.; Bang, S.; Choi, B.R.; Chen, Y.; McMullen, M.F.; et al. High fat diet produces brain insulin resistance, synaptodendritic abnormalities and altered behavior in mice. Neurobiol. Dis. 2014, 67, 79–87. [Google Scholar] [CrossRef]


| Parameter | Glucose [mmol/L] | Insulin [ng/mL] | Leptin [ng/mL] | Cholesterol [mmol/L] | Triacylglycerol [mmol/L] | FGF21 [pg/mL] | HOMA-IR Index | |
|---|---|---|---|---|---|---|---|---|
| 3 months | WT HFD | 7.68 ± 1.95 | 0.38 ± 0.20 | 0.49 ± 0.33 | 5.26 ± 0.43 | 0.86 ± 0.09 | 537.53 ± 305.57 | 23.61 ± 17.02 |
| APP/PS1 HFD | 7.28 ± 1.71 | 0.38 ± 0.24 | 0.98 ± 1.10 | 5.12 ± 1.40 | 0.85 ± 0.42 | 900.48 ± 451.98 | 22.98 ± 16.22 | |
| 6 months | WT STD | 4.96 ± 1.03 ** | 0.08 ± 0.06 *** | 1.18 ± 1.03 *** | 3.40 ± 0.32 ** | 0.55 ± 0.14 ** | 541.55 ± 338.84 | 3.24 ± 2.34 * |
| WT HFD | 6.96 ± 0.97 ** | 1.36 ± 0.45 *** | 55.09 ± 15.00 *** | 6.25 ± 1.52 ** | 0.97 ± 0.27 ** | 804.94 ± 288.09 | 73.14 ± 30.44 * | |
| APP/PS1 STD | 4.88 ± 0.59 **** | 0.13 ± 0.03 *** | 1.72 ± 1.41 **** | 3.32 ± 0.79 **** | 0.57 ± 0.10 *** | 891.75 ± 648.42 | 4.50 ± 1.06 *** | |
| APP/PS1 HFD | 7.78 ± 0.59 **** | 1.95 ± 0.91 *** | 67.39 ± 17.41 **** | 7.85 ± 1.50 **** | 1.23 ± 0.23 *** | 1279.26 ± 691.75 | 117.24 ± 59.40 *** | |
| 10 months | WT STD | 6.16 ± 0.72 | 0.27 ± 0.31 | 1.04 ± 0.79 **** | 2.54 ± 1.10 * | 0.90 ± 0.35 | 615.40 ± 253.30 | 12.35 ± 14.10 ** |
| WT HFD | 7.85 ± 1.40 | 1.51 ± 1.08 **** *** | 67.92 ± 20.86 **** | 4.18 ± 1.38 * | 1.51 ± 0.50 | 1013.95 ± 578.83 * | 93.48 ± 72.92 ** *** | |
| APP/PS1 STD | 6.32 ± 1.93 | 0.12 ± 0.08 **** *** | 0.78 ± 0.32 **** | 2.47 ± 0.49 *** | 1.06 ± 0.39 * | 824.23 ± 464.01 * * | 6.83 ± 6.90 **** *** | |
| APP/PS1 HFD | 6.95 ± 1.24 | 4.64 ± 1.32 **** *** | 86.12 ± 26.20 **** | 5.32 ± 1.11 *** | 1.65 ± 0.32 * | 1999.93 ± 1103.56 * * | 254.85 ± 100.81 **** *** | |
| Plasma/Tissue | 3 Months | 6 Months | 10 Months | |||||||||
|---|---|---|---|---|---|---|---|---|---|---|---|---|
| APP/PS1 vs. WT on HFD | HFD vs. STD | APP/PS1 vs. WT on HFD | Age 6 M vs. 3 M on HFD | HFD vs. STD | APP/PS1 vs. WT on HFD | Age 10 M vs. 6 M on HFD | ||||||
| Body Weight | - | ↑ **** | ↑ **** | - | ↑ xxxx | ↑ xxxx | ↑ **** | ↑ **** | ↑ ## | - | ↑ xx | |
| eWAT | - | ↑ **** | ↑ **** | - | ↑ xxx | ↑ xx | ↑ *** | ↑ **** | - | - | ↑ xx | |
| Leptin | plasma | - | ↑ *** | ↑ **** | - | ↑ xxxx | ↑ xxxx | ↑ **** | ↑ **** | - | - | - |
| Glucose | plasma | - | ↑ ** | ↑ **** | - | - | ↑ xx | - | - | - | - | - |
| OGTT AUC | plasma | - | ↑ *** | ↑ *** | ↑ ### | - | - | - | - | - | - | |
| Insulin | plasma | - | ↑ *** | ↑ *** | - | - | ↑ x | ↑ *** | ↑ *** | ↑ ### | - | ↑ xxxx |
| FGF21 | plasma | - | - | - | - | - | - | - | ↑ * | ↑ # | - | - |
| HOMA-IR index | - | ↑ * | ↑ *** | - | - | - | - | - | ↑ ### | - | ↑ xxx | |
| Cholesterol | plasma | - | ↑ ** | ↑ **** | - | - | ↑ xx | ↑ * | ↑ *** | - | - | ↓ xx |
| Triacylglycerol | plasma | - | ↑ ** | ↑ *** | - | - | - | - | ↑ * | - | ↑ x | ↑ xx |
| CRP | plasma | - | - | ↑ * | - | - | - | - | ↑ ** | - | - | - |
| LIVER WEIGHT | - | - | ↑ ** | - | ↑ x | ↑ x | - | ↑ **** | ↑ ### | - | ↑ xx | |
| Steatosis | liver | - | - | ↑ ** | ↑ ## | - | - | - | ↑ ** | - | - | - |
| Fibrosis | liver | - | - | - | - | - | - | ↑ ** | ↑ *** | - | - | - |
| IRbeta | liver | - | - | ↓ * | - | - | - | - | ↓ *** | - | - | - |
| PI3K | liver | - | ↑ ** | - | - | - | - | - | - | - | ↓ xxxx | ↓xx |
| p-Akt (Ser473) | liver | - | - | - | - | - | - | - | - | - | - | - |
| IRbeta | eWAT | - | ↓ *** | ↓ *** | - | - | ↓ xxxx | ↓ * | ↓ *** | - | - | - |
| PI3K | eWAT | - | - | - | - | - | ↓ xxx | - | - | - | - | - |
| p-Akt (Ser473) | eWAT | - | - | - | - | - | - | ↓ * | - | - | - | - |
| GLUT4 | eWAT | - | ↓ * | - | - | - | - | - | - | - | - | - |
| IRbeta | muscle | - | - | ↓ ** | ↓ ## | - | - | - | ↓ * | - | - | - |
| PI3K | muscle | - | - | ↓ ** | - | - | - | ↓ * | - | - | - | - |
| p-Akt (Ser473) | muscle | - | ↑ ** | - | - | - | - | - | - | - | - | - |
| GLUT4 | muscle | - | - | - | - | - | - | ↓ * | ↓ * | - | - | - |
| Brain Region | 3 Months | 6 Months | 10 Months | |||||||||
|---|---|---|---|---|---|---|---|---|---|---|---|---|
| APP/PS1 vs. WT on HFD | HFD vs. STD | APP/PS1 vs. WT on HFD | Age 6 M vs. 3 M on HFD | HFD vs. STD | APP/PS1 vs. WT on HFD | Age 10 M vs. 6 M HFD | ||||||
| Aβ plaques | Hippocampus | ↑ # | - | - | ↑ ### | - | - | - | - | ↑ ### | - | ↑ xxx |
| Cortex | ↑ ## | - | - | ↑ ## | - | ↑ xxx | - | ↑ * | ↑ ### | - | ↑ xxx | |
| Microgliosis (Iba1) | Hippocampus | - | - | - | ↑ ## | - | - | - | ↑ * | ↑ ### | - | - |
| Cortex | - | - | - | ↑ ## | - | - | - | ↑ * | ↑ ### | - | - | |
| Astrocytosis (GFAP) | Hippocampus | - | - | - | ↑ #### | - | ↑ xx | - | - | ↑ ## | - | ↑ x |
| Cortex | - | - | - | ↑ ## | - | ↑ xxxx | - | - | ↑ ## | - | ↑ xx | |
| Total Tau (9H12) | Hippocampus (CA1) | - | - | - | - | - | - | - | - | - | - | - |
| p-Tau (Ser202, Thr205) (AT8) | Hippocampus | - | - | ↑ * | ↑ #### | - | - | - | - | ↑ ### | - | - |
| Cortex | - | - | ↑ ** | ↑ #### | - | - | - | - | ↑ ### | - | - | |
| Insulin receptor β | Hippocampus | - | - | - | - | ↑ xx | - | - | ↓ **** | ↓ ## | - | ↓ xxx |
| PI3K | Hippocampus | ↑ ## | - | - | - | - | - | - | ↓ * | - | - | - |
| p-Akt (Ser473) | Hippocampus | - | - | - | - | - | - | - | - | - | - | ↓ xx |
| Neuronal density (NeuN) | Hippocampus | - | - | - | ↑ ## | ↓ x | ↓ x | - | - | - | - | - |
| Cortex | - | - | - | - | - | ↓ xx | - | - | - | - | - | |
| Neurogenesis (DCX) | Hippocampus (DG) | - | - | - | - | ↓ xxx | ↓ xxxx | - | - | - | - | - |
| Neurogenesis (Tau 3R) | Hippocampus (DG) | - | - | - | - | ↓ xxxx | ↓ xxxx | - | - | - | - | - |
| Synaptophysin | Hippocampus | - | - | - | - | - | - | - | - | ↓ # | - | - |
| Spinophilin | Hippocampus | - | - | - | - | - | - | - | - | - | - | - |
Disclaimer/Publisher’s Note: The statements, opinions and data contained in all publications are solely those of the individual author(s) and contributor(s) and not of MDPI and/or the editor(s). MDPI and/or the editor(s) disclaim responsibility for any injury to people or property resulting from any ideas, methods, instructions or products referred to in the content. |
© 2023 by the authors. Licensee MDPI, Basel, Switzerland. This article is an open access article distributed under the terms and conditions of the Creative Commons Attribution (CC BY) license (https://creativecommons.org/licenses/by/4.0/).
Share and Cite
Mengr, A.; Strnadová, V.; Strnad, Š.; Vrkoslav, V.; Pelantová, H.; Kuzma, M.; Comptdaer, T.; Železná, B.; Kuneš, J.; Galas, M.-C.; et al. Feeding High-Fat Diet Accelerates Development of Peripheral and Central Insulin Resistance and Inflammation and Worsens AD-like Pathology in APP/PS1 Mice. Nutrients 2023, 15, 3690. https://doi.org/10.3390/nu15173690
Mengr A, Strnadová V, Strnad Š, Vrkoslav V, Pelantová H, Kuzma M, Comptdaer T, Železná B, Kuneš J, Galas M-C, et al. Feeding High-Fat Diet Accelerates Development of Peripheral and Central Insulin Resistance and Inflammation and Worsens AD-like Pathology in APP/PS1 Mice. Nutrients. 2023; 15(17):3690. https://doi.org/10.3390/nu15173690
Chicago/Turabian StyleMengr, Anna, Veronika Strnadová, Štěpán Strnad, Vladimír Vrkoslav, Helena Pelantová, Marek Kuzma, Thomas Comptdaer, Blanka Železná, Jaroslav Kuneš, Marie-Christine Galas, and et al. 2023. "Feeding High-Fat Diet Accelerates Development of Peripheral and Central Insulin Resistance and Inflammation and Worsens AD-like Pathology in APP/PS1 Mice" Nutrients 15, no. 17: 3690. https://doi.org/10.3390/nu15173690