
Hepatic Transcriptome Profiling Reveals Lack of Acsm3 Expression in Polydactylous Rats with High-Fat Diet-Induced Hypertriglyceridemia and Visceral Fat Accumulation

 , , and
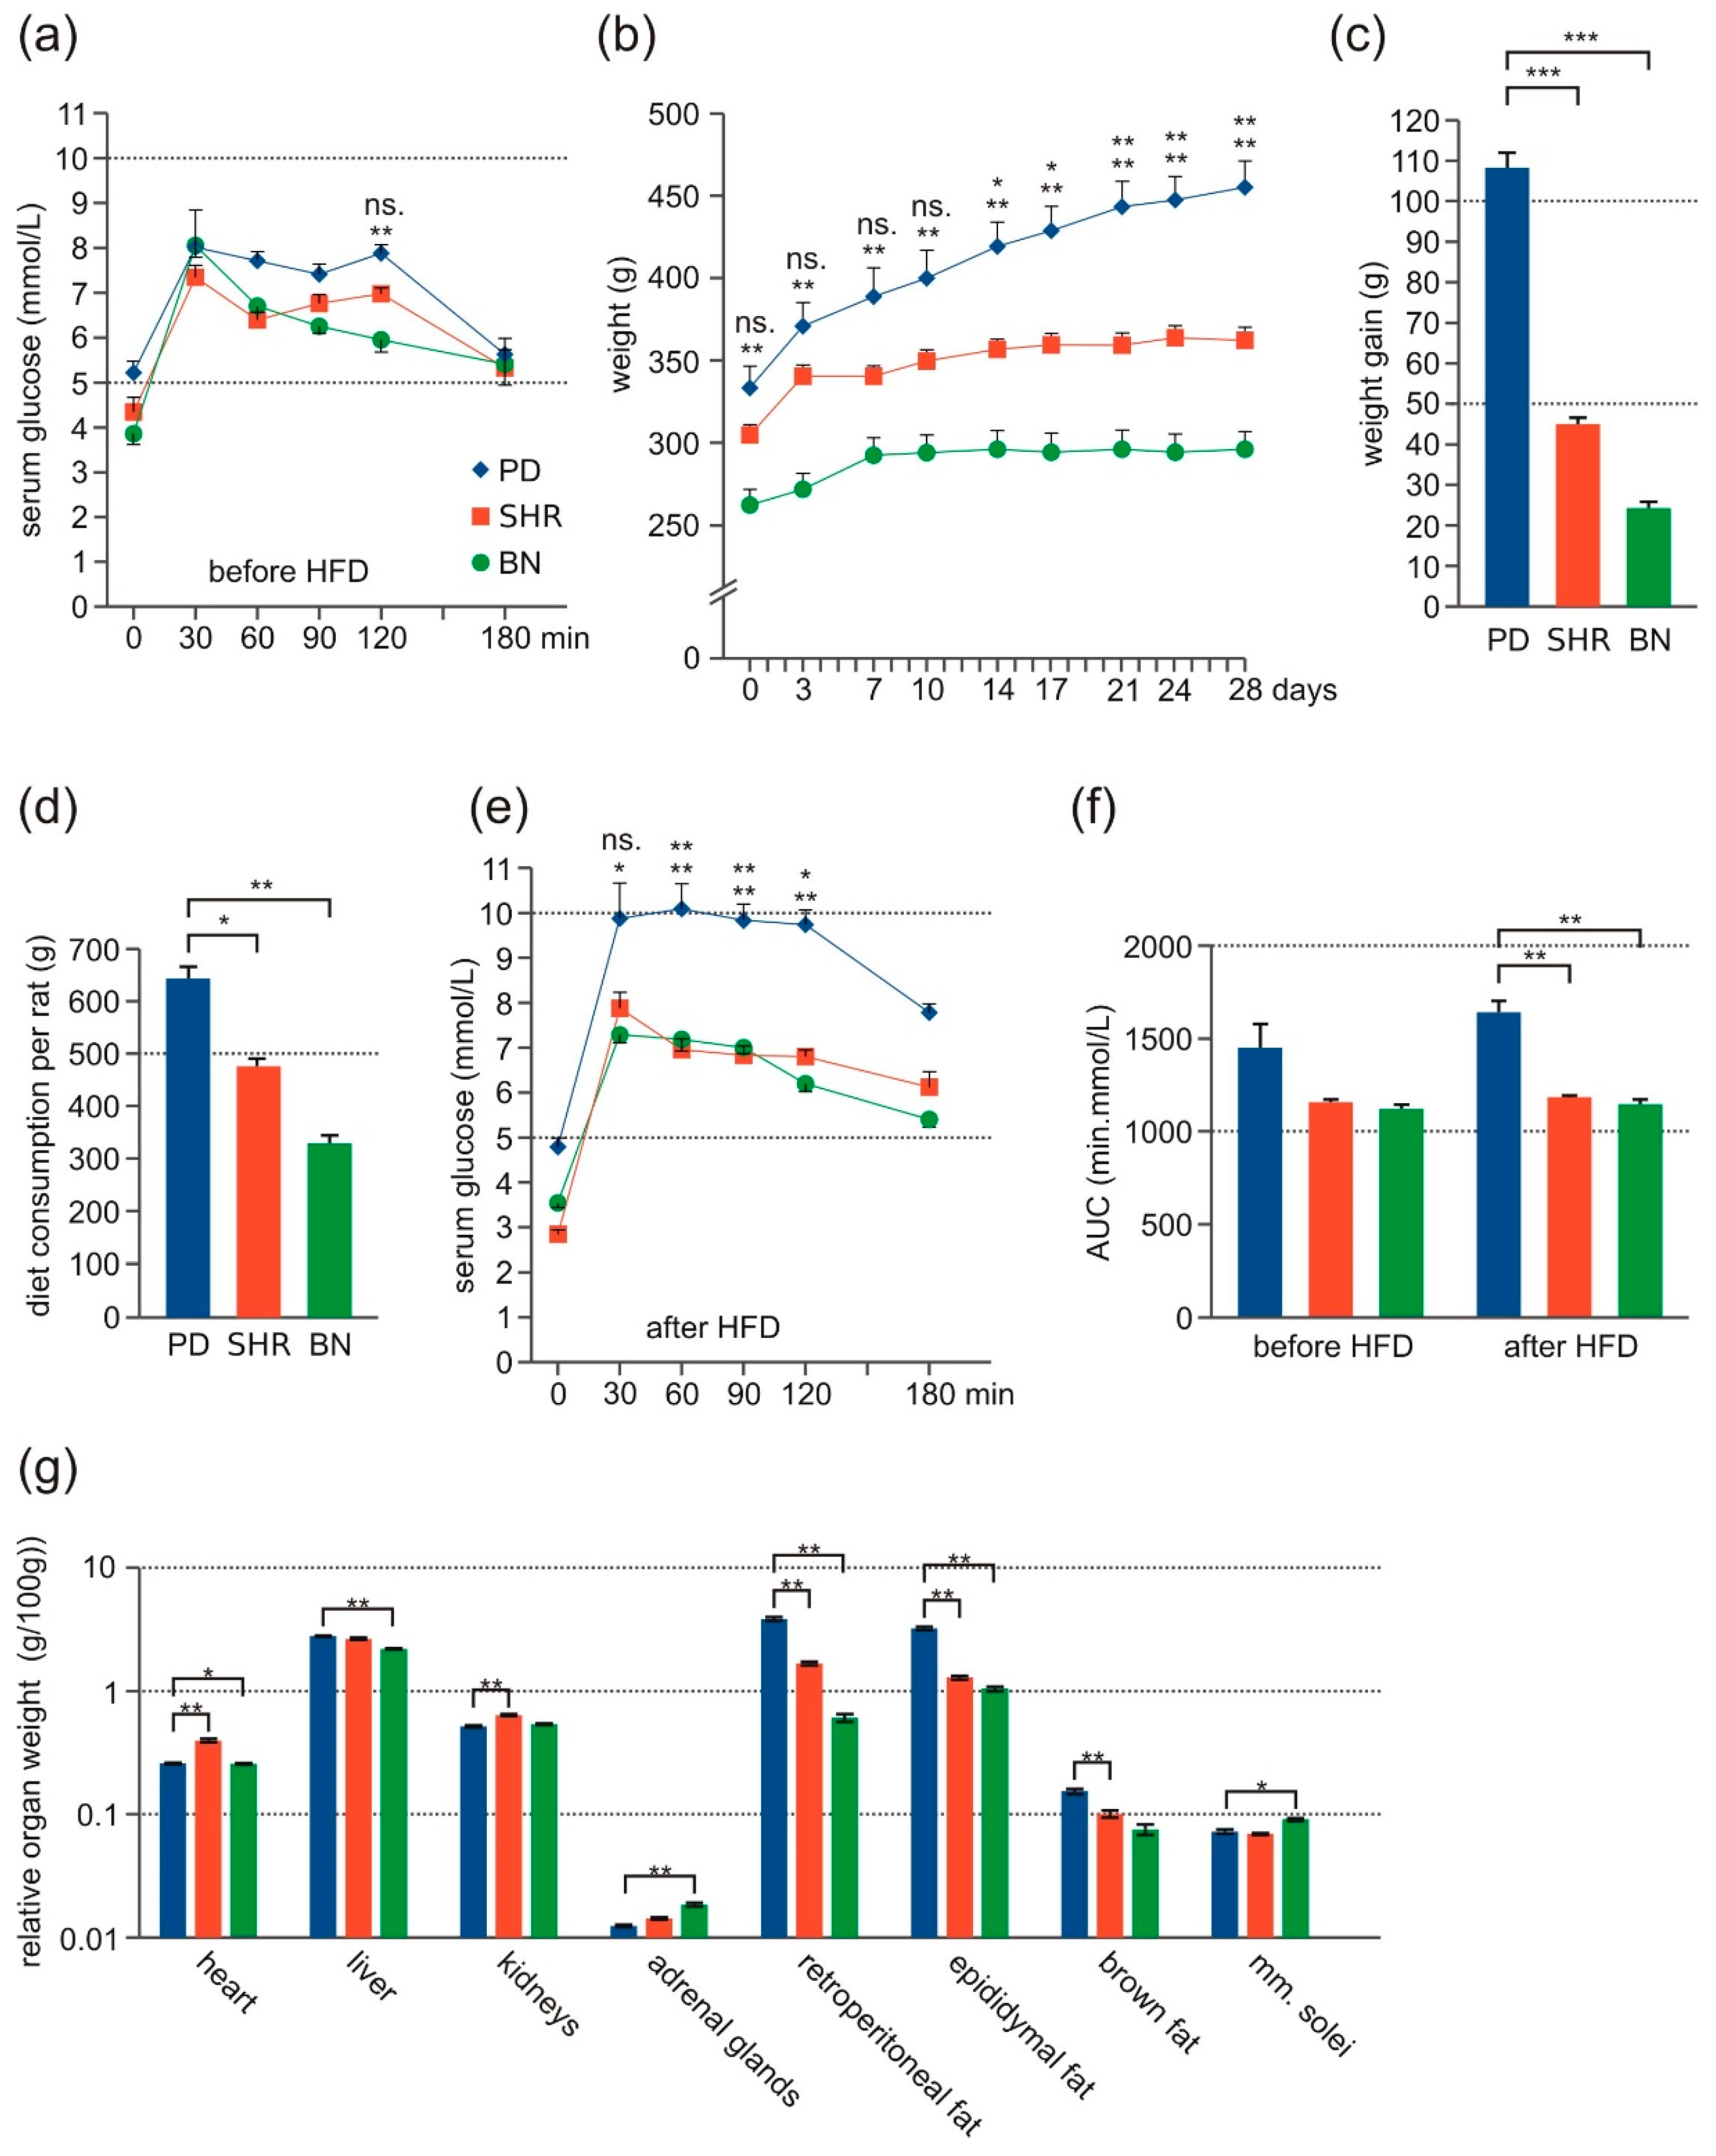
Abstract
:1. Introduction
2. Materials and Methods
2.1. Animals
2.2. Experimental Protocol
2.3. Tissue Collection
2.4. Biochemical Parameters
2.4.1. Lipidogram
2.4.2. FFA
2.4.3. Insulin
2.4.4. C-peptide, GIP, GLP-1, Glucagon, Leptin, PP, and PYY
2.4.5. Adiponectin
2.4.6. Cytokine Levels
2.4.7. Lipid Levels in Liver Tissue
2.5. Gene Expression
2.5.1. RNA Isolation
2.5.2. Gene Expression
2.5.3. RT-PCR and qPCR
2.6. DNA Sequencing
2.7. Western Blotting
2.8. Statistical Analysis
2.9. Gene Enrichment Analysis and Functional Clustering of the Differentially Expressed Genes
3. Results
3.1. Morphometric Profile and Oral Glucose Tolerance Test
3.2. Metabolic Profile
3.3. Lipid Levels in Liver Tissue after HFD Feeding
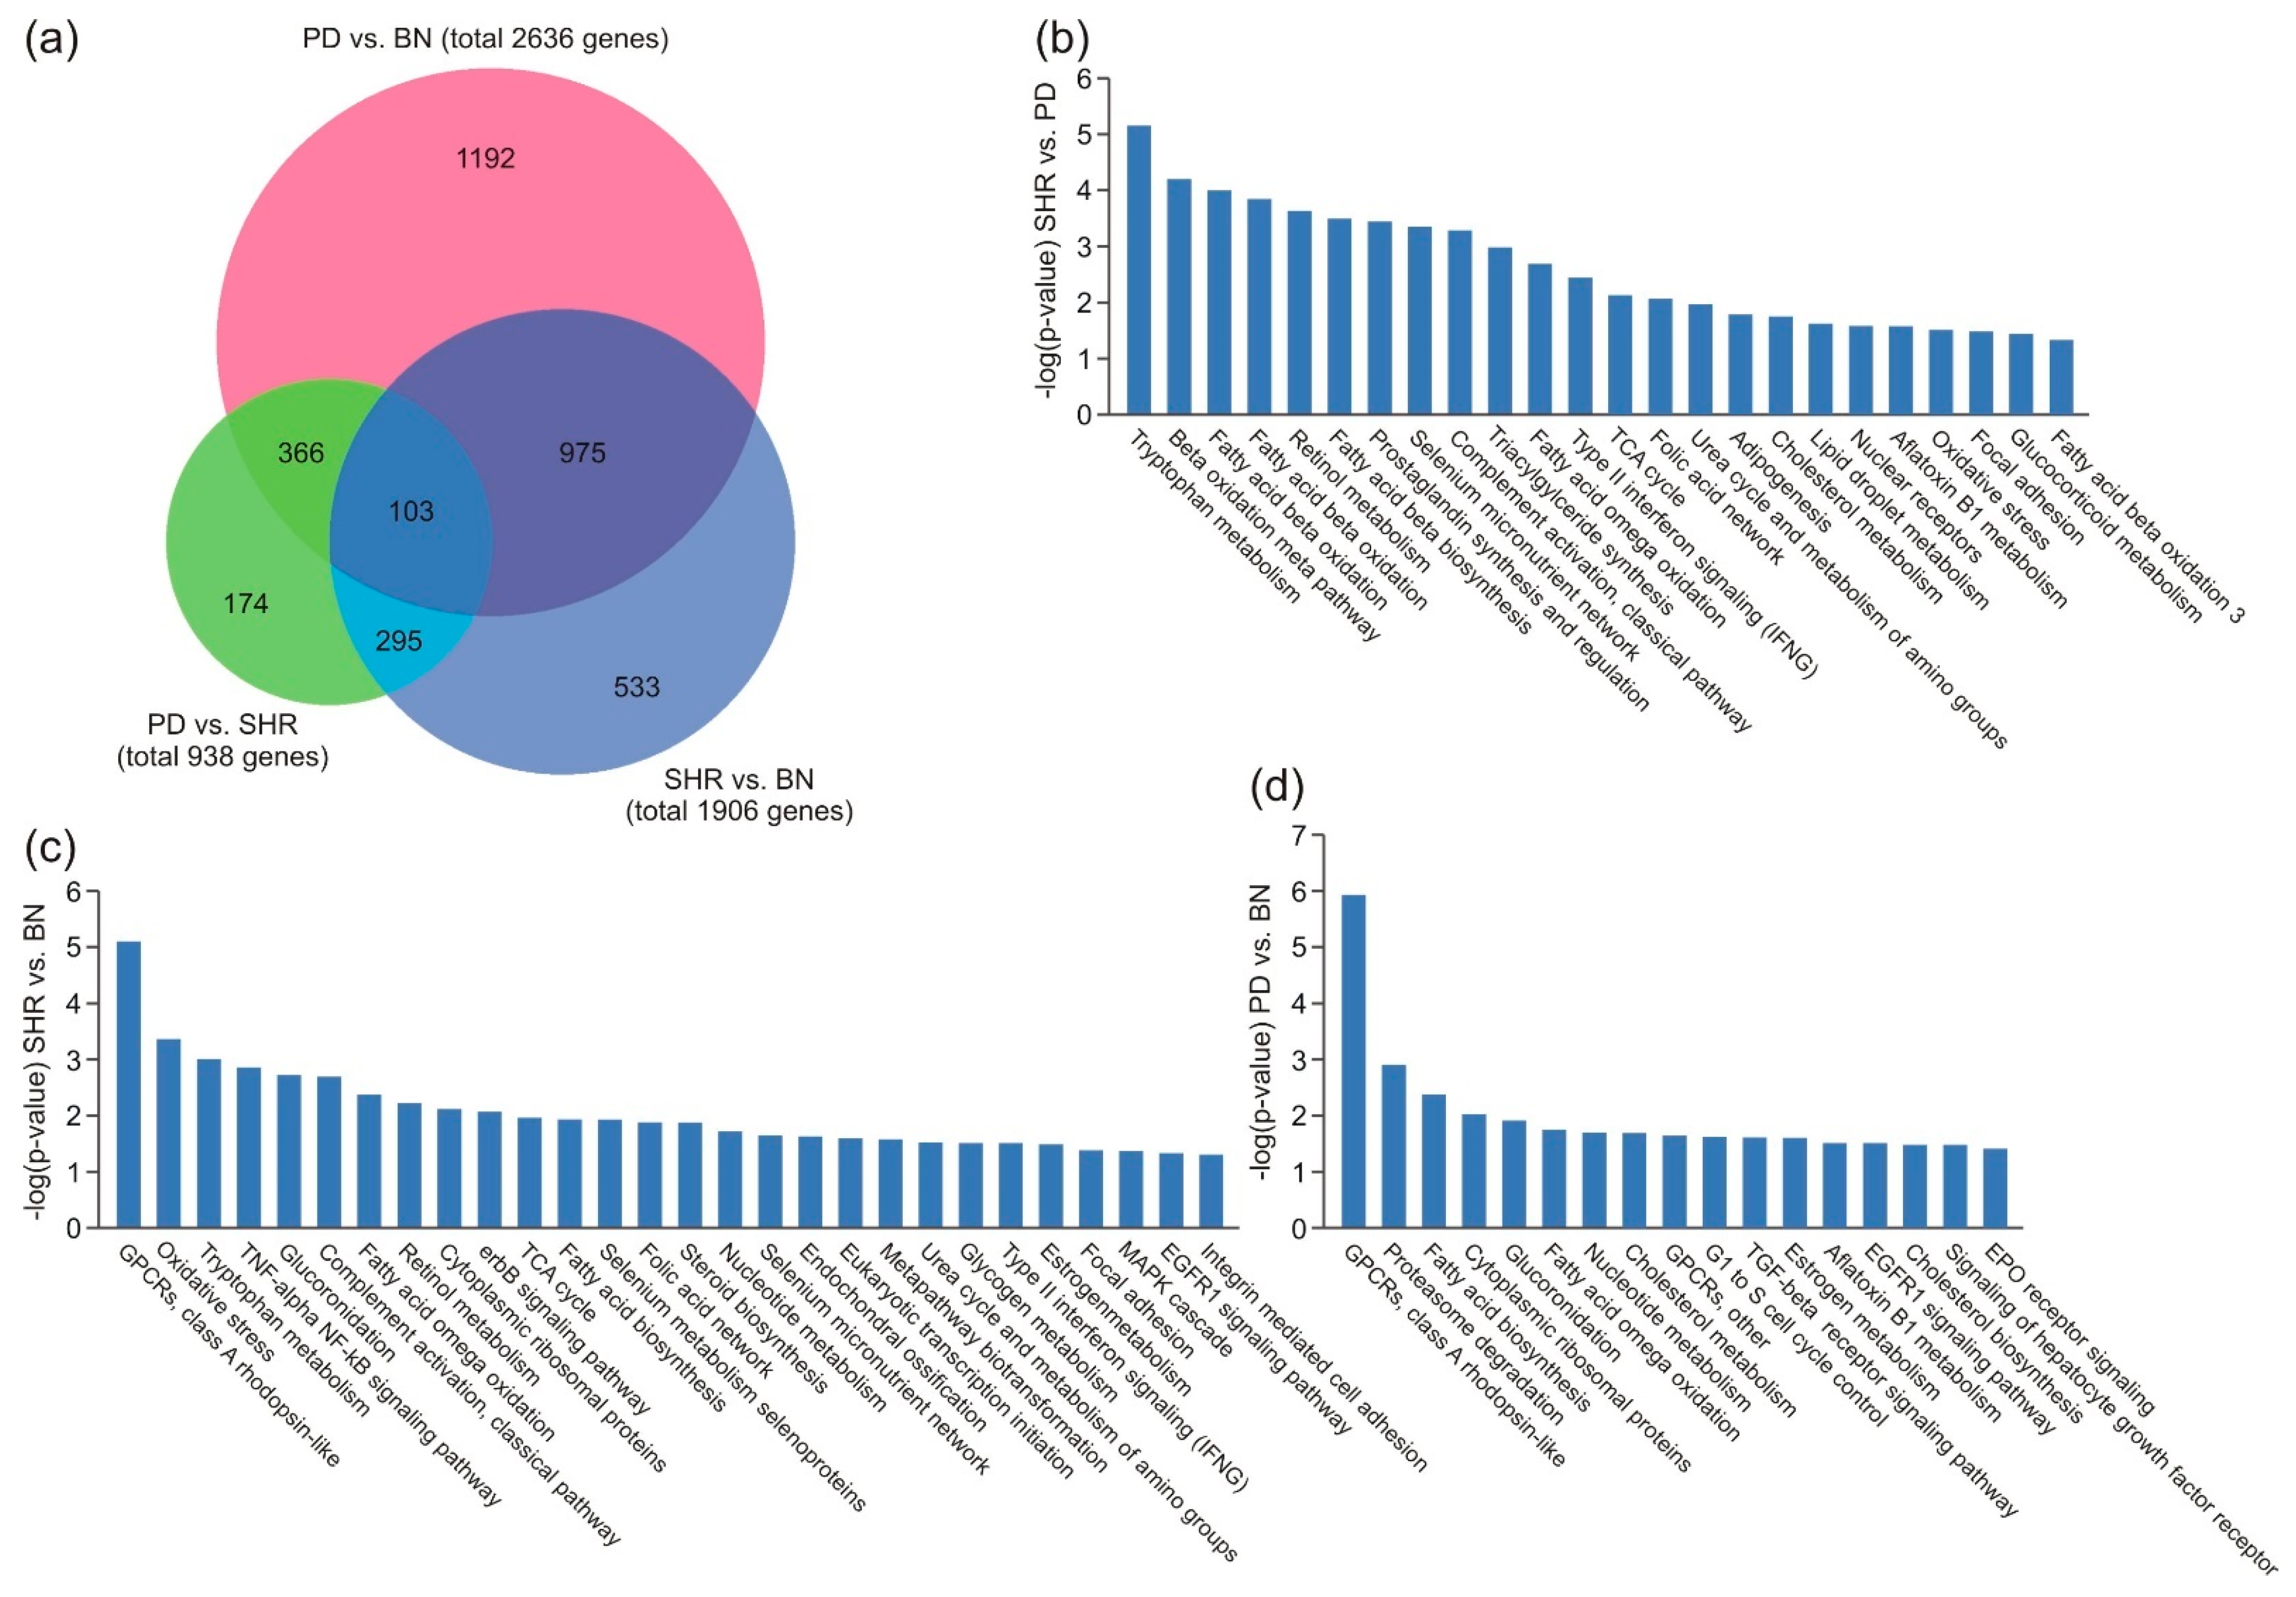
3.4. Gene Enrichment Analysis in Liver Tissue
3.5. Pathway Analysis
3.6. qPCR
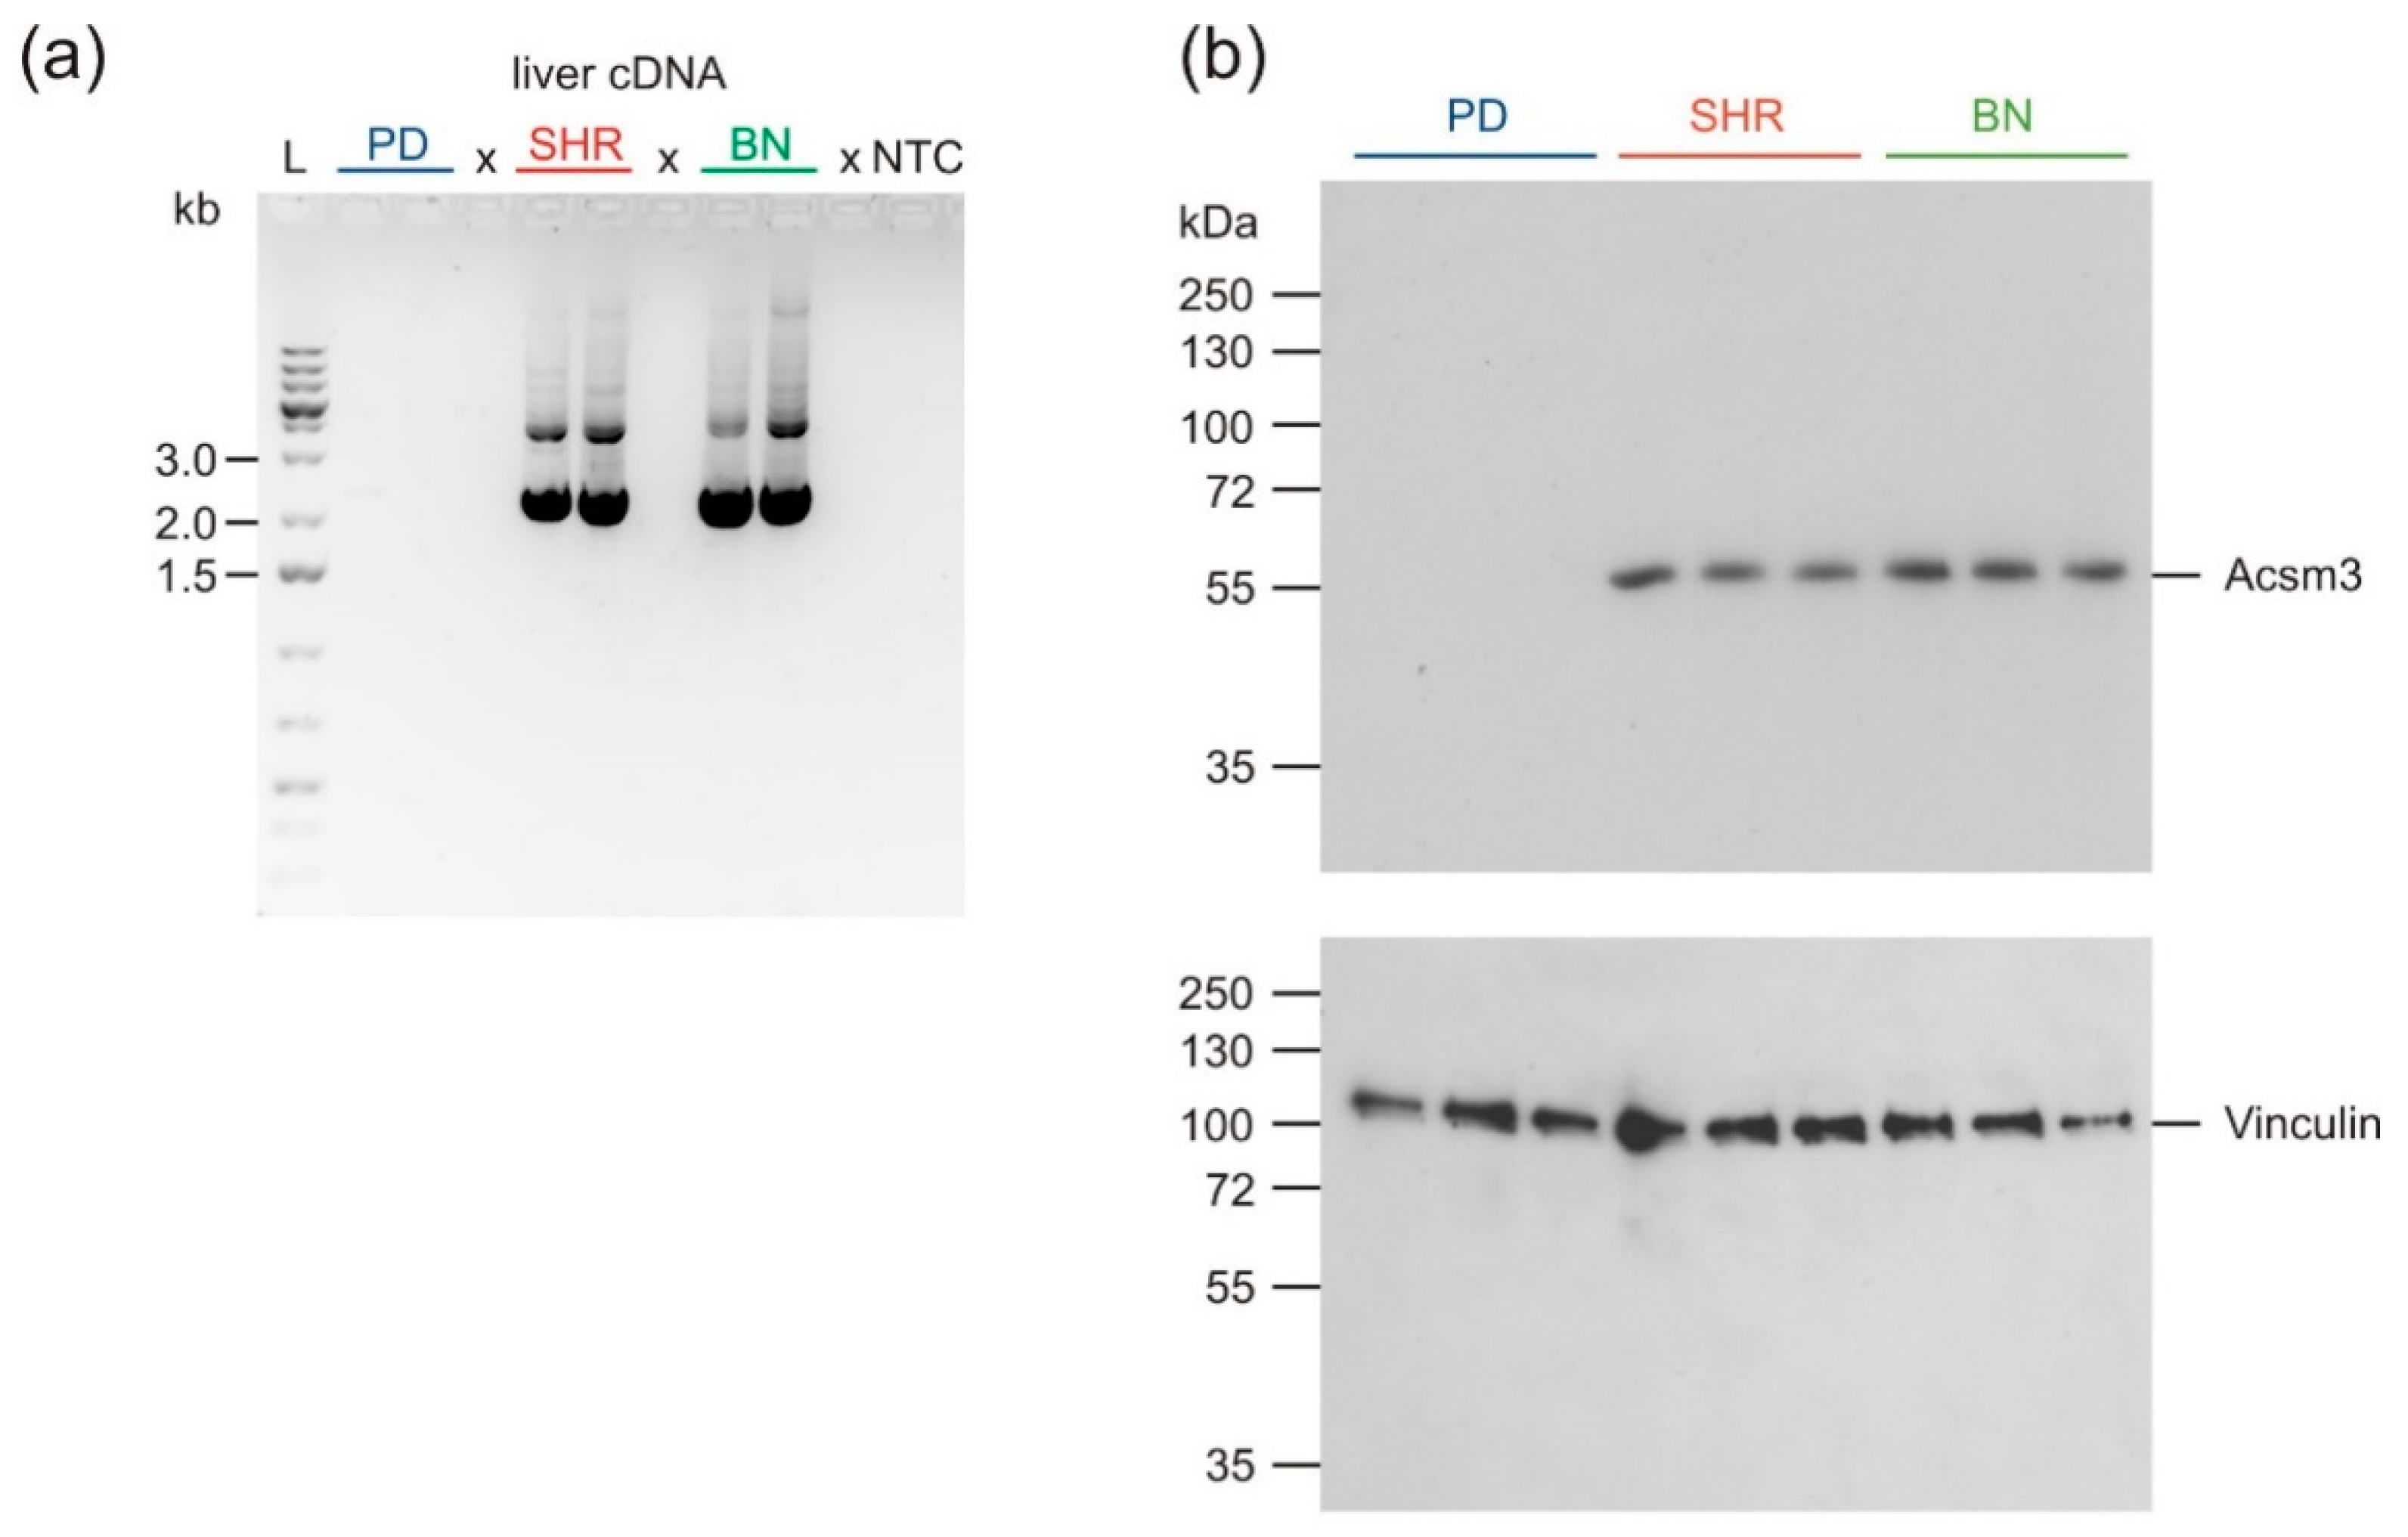
3.7. Sequencing of Acsm3
3.8. Western Blot Analysis
4. Discussion
5. Conclusions
Supplementary Materials
Author Contributions
Funding
Institutional Review Board Statement
Informed Consent Statement
Data Availability Statement
Conflicts of Interest
References
- Alberti, K.G.; Eckel, R.H.; Grundy, S.M.; Zimmet, P.Z.; Cleeman, J.I.; Donato, K.A.; Fruchart, J.C.; James, W.P.; Loria, C.M.; Smith, S.C., Jr.; et al. Harmonizing the metabolic syndrome: A joint interim statement of the International Diabetes Federation Task Force on Epidemiology and Prevention; National Heart, Lung, and Blood Institute; American Heart Association; World Heart Federation; International Atherosclerosis Society; and International Association for the Study of Obesity. Circulation 2009, 120, 1640–1645. [Google Scholar] [CrossRef] [PubMed] [Green Version]
- Vattikuti, S.; Guo, J.; Chow, C.C. Heritability and genetic correlations explained by common SNPs for metabolic syndrome traits. PLoS Genet. 2012, 8, e1002637. [Google Scholar] [CrossRef]
- Torkamani, A.; Wineinger, N.E.; Topol, E.J. The personal and clinical utility of polygenic risk scores. Nat. Rev. Genet. 2018, 19, 581–590. [Google Scholar] [CrossRef]
- Genin, E. Missing heritability of complex diseases: Case solved? Hum. Genet. 2020, 139, 103–113. [Google Scholar] [CrossRef]
- Seda, O.; Liska, F.; Krenova, D.; Kazdova, L.; Sedova, L.; Zima, T.; Peng, J.; Pelinkova, K.; Tremblay, J.; Hamet, P.; et al. Dynamic genetic architecture of metabolic syndrome attributes in the rat. Physiol. Genom. 2005, 21, 243–252. [Google Scholar] [CrossRef] [PubMed] [Green Version]
- Sedova, L.; Kazdova, L.; Seda, O.; Krenova, D.; Kren, V. Rat inbred PD/cub strain as a model of dyslipidemia and insulin resistance. Folia Biologica 2000, 46, 99–106. [Google Scholar]
- Coan, P.M.; Hummel, O.; Garcia Diaz, A.; Barrier, M.; Alfazema, N.; Norsworthy, P.J.; Pravenec, M.; Petretto, E.; Hubner, N.; Aitman, T.J. Genetic, physiological and comparative genomic studies of hypertension and insulin resistance in the spontaneously hypertensive rat. Dis. Models Mech. 2017, 10, 297–306. [Google Scholar] [CrossRef] [Green Version]
- Pravenec, M.; Kren, V.; Landa, V.; Mlejnek, P.; Musilova, A.; Silhavy, J.; Simakova, M.; Zidek, V. Recent progress in the genetics of spontaneously hypertensive rats. Physiol. Res. 2014, 63, S1–S8. [Google Scholar] [CrossRef] [PubMed]
- Kren, V. Genetics of the polydactyly-luxate syndrome in the Norway rat, Rattus norvegicus. Acta Univ. Carol. Med. Monogr. 1975, 1–103. [Google Scholar]
- Iwai, N.; Mannami, T.; Tomoike, H.; Ono, K.; Iwanaga, Y. An acyl-CoA synthetase gene family in chromosome 16p12 may contribute to multiple risk factors. Hypertension 2003, 41, 1041–1046. [Google Scholar] [CrossRef] [Green Version]
- Okamoto, K.; Aoki, K. Development of a strain of spontaneously hypertensive rats. Jpn. Circ. J. 1963, 27, 282–293. [Google Scholar] [CrossRef] [PubMed]
- Billingham, R.E.; Silvers, W.K. Inbred animals and tissue transplantation immunity, with an index of some inbred strains other than mice. Transplant. Bull. 1959, 6, 399–406. [Google Scholar] [CrossRef] [PubMed]
- Seda, O.; Sedova, L.; Kazdova, L.; Krenova, D.; Kren, V. Metabolic characterization of insulin resistance syndrome feature loci in three brown Norway-derived congenic strains. Folia Biol. 2002, 48, 81–88. [Google Scholar]
- Okazaki, M.; Yamashita, S. Recent Advances in Analytical Methods on Lipoprotein Subclasses: Calculation of Particle Numbers from Lipid Levels by Gel Permeation HPLC Using “Spherical Particle Model”. J. Oleo Sci. 2016, 65, 265–282. [Google Scholar] [CrossRef] [PubMed] [Green Version]
- Huttl, M.; Markova, I.; Miklankova, D.; Makovicky, P.; Pelikanova, T.; Seda, O.; Sedova, L.; Malinska, H. Adverse Effects of Methylglyoxal on Transcriptome and Metabolic Changes in Visceral Adipose Tissue in a Prediabetic Rat Model. Antioxidants 2020, 9, 803. [Google Scholar] [CrossRef]
- Edgar, R.; Domrachev, M.; Lash, A.E. Gene Expression Omnibus: NCBI gene expression and hybridization array data repository. Nucleic Acids Res. 2002, 30, 207–210. [Google Scholar] [CrossRef] [PubMed] [Green Version]
- Ye, J.; Coulouris, G.; Zaretskaya, I.; Cutcutache, I.; Rozen, S.; Madden, T.L. Primer-BLAST: A tool to design target-specific primers for polymerase chain reaction. BMC Bioinform. 2012, 13, 134. [Google Scholar] [CrossRef] [Green Version]
- Galaxy. Available online: https://usegalaxy.org (accessed on 8 February 2021).
- Picard. Available online: http://broadinstitute.github.io/picard (accessed on 8 February 2021).
- Garrison, E. Haplotype-based variant detection from short-read sequencing. arXiv 2012, arXiv:1207.3907. [Google Scholar]
- ImageJ. Available online: https://imagej.nih.gov/ij/ (accessed on 8 February 2021).
- Huang da, W.; Sherman, B.T.; Lempicki, R.A. Systematic and integrative analysis of large gene lists using DAVID bioinformatics resources. Nat. Protoc. 2009, 4, 44–57. [Google Scholar] [CrossRef]
- Huang da, W.; Sherman, B.T.; Lempicki, R.A. Bioinformatics enrichment tools: Paths toward the comprehensive functional analysis of large gene lists. Nucleic Acids Res. 2009, 37, 1–13. [Google Scholar] [CrossRef] [Green Version]
- Hulsen, T.; de Vlieg, J.; Alkema, W. BioVenn—A web application for the comparison and visualization of biological lists using area-proportional Venn diagrams. BMC Genom. 2008, 9, 488. [Google Scholar] [CrossRef] [PubMed] [Green Version]
- Igumenova, T.I. Dynamics and Membrane Interactions of Protein Kinase C. Biochemistry 2015, 54, 4953–4968. [Google Scholar] [CrossRef] [Green Version]
- Powell, D.J.; Hajduch, E.; Kular, G.; Hundal, H.S. Ceramide disables 3-phosphoinositide binding to the pleckstrin homology domain of protein kinase B (PKB)/Akt by a PKCzeta-dependent mechanism. Mol. Cell. Biol. 2003, 23, 7794–7808. [Google Scholar] [CrossRef] [Green Version]
- Arrese, M.; Cabrera, D.; Kalergis, A.M.; Feldstein, A.E. Innate Immunity and Inflammation in NAFLD/NASH. Dig. Dis. Sci. 2016, 61, 1294–1303. [Google Scholar] [CrossRef] [Green Version]
- Farrell, G.C.; Haczeyni, F.; Chitturi, S. Pathogenesis of NASH: How Metabolic Complications of Overnutrition Favour Lipotoxicity and Pro-Inflammatory Fatty Liver Disease. Adv. Exp. Med. Biol. 2018, 1061, 19–44. [Google Scholar] [CrossRef]
- Ainslie, D.A.; Proietto, J.; Fam, B.C.; Thorburn, A.W. Short-term, high-fat diets lower circulating leptin concentrations in rats. Am. J. Clin. Nutr. 2000, 71, 438–442. [Google Scholar] [CrossRef] [Green Version]
- Benjafield, A.V.; Iwai, N.; Ishikawa, K.; Wang, W.Y.; Morris, B.J. Overweight, but not hypertension, is associated with SAH polymorphisms in Caucasians with essential hypertension. Hypertens. Res. 2003, 26, 591–595. [Google Scholar] [CrossRef] [PubMed] [Green Version]
- Van der Sluis, R. Analyses of the genetic diversity and protein expression variation of the acyl: CoA medium-chain ligases, ACSM2A and ACSM2B. Mol. Genet. Genom. 2018, 293, 1279–1292. [Google Scholar] [CrossRef] [PubMed]
- Van der Sluis, R.; Erasmus, E. Xenobiotic/medium chain fatty acid: CoA ligase—A critical review on its role in fatty acid metabolism and the detoxification of benzoic acid and aspirin. Expert Opin. Drug Metab. Toxicol. 2016, 12, 1169–1179. [Google Scholar] [CrossRef]
- St Lezin, E.; Liu, W.; Wang, J.M.; Yang, Y.; Qi, N.; Kren, V.; Zidek, V.; Kurtz, T.W.; Pravenec, M. Genetic analysis of rat chromosome 1 and the Sa gene in spontaneous hypertension. Hypertension 2000, 35, 225–230. [Google Scholar] [CrossRef] [Green Version]
- Walsh, V.; Somody, L.; Farrell, A.; Zhang, B.; Brown, J.; Pritchard, C.; Vincent, M.; Samani, N.J. Analysis of the role of the SA gene in blood pressure regulation by gene targeting. Hypertension 2003, 41, 1212–1218. [Google Scholar] [CrossRef] [Green Version]
- Fujino, T.; Takei, Y.A.; Sone, H.; Ioka, R.X.; Kamataki, A.; Magoori, K.; Takahashi, S.; Sakai, J.; Yamamoto, T.T. Molecular identification and characterization of two medium-chain acyl-CoA synthetases, MACS1 and the Sa gene product. J. Biol. Chem. 2001, 276, 35961–35966. [Google Scholar] [CrossRef] [PubMed] [Green Version]
- Den Besten, G.; Lange, K.; Havinga, R.; van Dijk, T.H.; Gerding, A.; van Eunen, K.; Muller, M.; Groen, A.K.; Hooiveld, G.J.; Bakker, B.M.; et al. Gut-derived short-chain fatty acids are vividly assimilated into host carbohydrates and lipids. Am. J. Physiol. Gastrointest. Liver Physiol. 2013, 305, G900–G910. [Google Scholar] [CrossRef] [PubMed]
- Den Besten, G.; van Eunen, K.; Groen, A.K.; Venema, K.; Reijngoud, D.J.; Bakker, B.M. The role of short-chain fatty acids in the interplay between diet, gut microbiota, and host energy metabolism. J. Lipid Res. 2013, 54, 2325–2340. [Google Scholar] [CrossRef] [Green Version]
- Ellis, J.M.; Bowman, C.E.; Wolfgang, M.J. Metabolic and tissue-specific regulation of acyl-CoA metabolism. PLoS ONE 2015, 10, e0116587. [Google Scholar] [CrossRef] [Green Version]
- Iwai, N.; Katsuya, T.; Mannami, T.; Higaki, J.; Ogihara, T.; Kokame, K.; Ogata, J.; Baba, S. Association between SAH, an acyl-CoA synthetase gene, and hypertriglyceridemia, obesity, and hypertension. Circulation 2002, 105, 41–47. [Google Scholar] [CrossRef] [PubMed] [Green Version]
- Telgmann, R.; Brand, E.; Nicaud, V.; Hagedorn, C.; Beining, K.; Schonfelder, J.; Brink-Spalink, V.; Schmidt-Petersen, K.; Matanis, T.; Vischer, P.; et al. SAH gene variants are associated with obesity-related hypertension in Caucasians: The PEGASE Study. J Hypertens. 2007, 25, 557–564. [Google Scholar] [CrossRef] [PubMed]
- Guenard, F.; Bouchard-Mercier, A.; Rudkowska, I.; Lemieux, S.; Couture, P.; Vohl, M.C. Genome-Wide Association Study of Dietary Pattern Scores. Nutrients 2017, 9, 649. [Google Scholar] [CrossRef]
- Hubner, N.; Wallace, C.A.; Zimdahl, H.; Petretto, E.; Schulz, H.; Maciver, F.; Mueller, M.; Hummel, O.; Monti, J.; Zidek, V.; et al. Integrated transcriptional profiling and linkage analysis for identification of genes underlying disease. Nat. Genet. 2005, 37, 243–253. [Google Scholar] [CrossRef]
- GeneNetwork. Available online: http://www.genenetwork.org/ (accessed on 23 February 2021).
- Gopal, R.; Selvarasu, K.; Pandian, P.P.; Ganesan, K. Integrative transcriptome analysis of liver cancer profiles identifies upstream regulators and clinical significance of ACSM3 gene expression. Cell. Oncol. 2017, 40, 219–233. [Google Scholar] [CrossRef]
- Ruan, H.Y.; Yang, C.; Tao, X.M.; He, J.; Wang, T.; Wang, H.; Wang, C.; Jin, G.Z.; Jin, H.J.; Qin, W.X. Downregulation of ACSM3 promotes metastasis and predicts poor prognosis in hepatocellular carcinoma. Am. J. Cancer Res. 2017, 7, 543–553. [Google Scholar] [PubMed]
- Seda, O.; Charles University, Prague, Czech Republic. Personal communication, 2021.


Publisher’s Note: MDPI stays neutral with regard to jurisdictional claims in published maps and institutional affiliations. |
© 2021 by the authors. Licensee MDPI, Basel, Switzerland. This article is an open access article distributed under the terms and conditions of the Creative Commons Attribution (CC BY) license (https://creativecommons.org/licenses/by/4.0/).
Share and Cite
Junková, K.; Mirchi, L.F.; Chylíková, B.; Janků, M.; Šilhavý, J.; Hüttl, M.; Marková, I.; Miklánková, D.; Včelák, J.; Malínská, H.; et al. Hepatic Transcriptome Profiling Reveals Lack of Acsm3 Expression in Polydactylous Rats with High-Fat Diet-Induced Hypertriglyceridemia and Visceral Fat Accumulation. Nutrients 2021, 13, 1462. https://doi.org/10.3390/nu13051462
Junková K, Mirchi LF, Chylíková B, Janků M, Šilhavý J, Hüttl M, Marková I, Miklánková D, Včelák J, Malínská H, et al. Hepatic Transcriptome Profiling Reveals Lack of Acsm3 Expression in Polydactylous Rats with High-Fat Diet-Induced Hypertriglyceridemia and Visceral Fat Accumulation. Nutrients. 2021; 13(5):1462. https://doi.org/10.3390/nu13051462
Chicago/Turabian StyleJunková, Kristýna, Lukáš F. Mirchi, Blanka Chylíková, Michaela Janků, Jan Šilhavý, Martina Hüttl, Irena Marková, Denisa Miklánková, Josef Včelák, Hana Malínská, and et al. 2021. "Hepatic Transcriptome Profiling Reveals Lack of Acsm3 Expression in Polydactylous Rats with High-Fat Diet-Induced Hypertriglyceridemia and Visceral Fat Accumulation" Nutrients 13, no. 5: 1462. https://doi.org/10.3390/nu13051462