
Effect of COVID-19 Lockdown on Urban Heat Island Dynamics in Prague, Czechia

1
Faculty of Environmental Sciences, Czech University of Life Sciences Prague, Praha-Suchdol, 165 00 Prague, Czech Republic
2
Institute of Atmospheric Physics, Czech Academy of Sciences, Praha 4, 141 00 Prague, Czech Republic
*
Author to whom correspondence should be addressed.
Remote Sens. 2024, 16(7), 1113; https://doi.org/10.3390/rs16071113
Submission received: 2 January 2024
/
Revised: 22 February 2024
/
Accepted: 19 March 2024
/
Published: 22 March 2024
(This article belongs to the Special Issue The Confinement Period and Its Potential Impact on Urban Heat Island and Surface Temperature Using Remote Sensing)
Abstract
:Urban heat islands (UHI) are a well-known phenomenon adversely affecting human health and urban environments. The worldwide COVID-19 lockdown in 2020 provided a unique opportunity to investigate the effects of decreased emission of air pollution and anthropogenic heat flux (AHF) on UHI. Although studies have suggested that reduced AHF during lockdown decreased atmospheric UHI (AUHI) and surface UHI (SUHI), these results contain inherent uncertainties due to unaccounted weather variability and urban-rural dynamics. Our study comprehensively analyzes the impact of the COVID-19 lockdown on AUHI and SUHI in Prague, Czechia. By selecting days with similar weather conditions, we examined changes in mean SUHI using MODIS satellite images and in AUHI based on air temperature from Prague weather stations for the Lockdown period during March–April 2020 versus a Reference period from March–April 2017–2019. Our results show that, in comparison to the Reference period, the Lockdown period was associated with a 15% (0.1 °C) reduction of SUHI in urbanized areas of Prague and a 0.7 °C decline in AUHI in the city center. Additionally, the observed decreases in satellite-based aerosol optical depth and nitrogen dioxide by 12% and 29%, respectively, support our hypothesis that the weakened UHI effects were linked to reduction in anthropogenic activities during the lockdown. Revealing the largest decrease of mean SUHI magnitude around the periphery of Prague, which has predominantly rural land cover, our study emphasizes the need to consider the effects of urban-rural dynamics when attributing changes in SUHI to AHF. Our findings provide additional insights into the role of reduced anthropogenic activities in UHI dynamics during the COVID-19 lockdown and offer policymakers a comprehensive understanding of how the complex interaction between urban and rural microclimate dynamics influences the SUHI phenomenon.
1. Introduction
Coronavirus disease (COVID-19) caused by the severe acute respiratory syndrome coronavirus 2 (SARS-CoV-2) emerged in Wuhan, the capital of Hubei Province, China, early in December 2019, then spread globally within several months. The World Health Organization declared the COVID-19 outbreak a pandemic on 11 March 2020. Extraordinary measures were implemented around the world to slow the spread of the virus, ranging across closures of public services, schools, and universities due to national curfews.
The implementation of COVID-19 lockdown measures led to a significant reduction in human activities and mobility. This, in turn, caused a decrease in anthropogenic emissions, which subsequently led to a rapid improvement in air quality in locations across the globe [1,2,3,4]. For example, based on the Google mobility index and satellite data (Sentinel-5P), 90% reduction in mobility and 30% decline in NO2 emissions were observed in six countries across the northern hemisphere due to lockdowns in March 2020 (compared to March 2019) [1].
Similarly, studies using ground observations reported as much as 34%, 47%, and 64% reductions in PM2.5, PM10, and NO2 concentrations, respectively, in cities across the globe due to restrictions on anthropogenic emission sources during the lockdown [1,2,3,4]. Furthermore, reduction in CO2 emissions during the lockdown during March–April 2020 has been documented on global (8.8%, [4]) as well as local scales (e.g., a drop by 30% in the San Francisco Bay Area [5]). The drop in CO2 was attributable primarily to changes in traffic [4,5].
Similar to the changes in air pollution, anthropogenic heat emissions likely decreased during the lockdown, as they are closely associated with the same human activities that release air pollutants. Anthropogenic heat flux (AHF) is one of the well-known causes of the urban heat island (UHI) effect [6] and an important input parameter of the surface energy budget in urban areas [7]. Unlike air pollution emissions and concentrations, however, AHF is challenging to measure; it needs to be estimated from such other proxy variables as air pollution [8], energy consumption data [9], or land surface temperature (LST) [10]. The near-surface thermal microclimate of a given site is defined by the surface energy balance equation, which is represented as follows:
where Q* is the net all-wave radiation, QF is AHF density, ΔQS is net heat storage, ΔQA is net advective heat flux, QH is sensible and QE is latent heat flux density [7,11]. The two turbulent heat flux densities, sensible and latent heat flux, facilitate the energy transfer between the surface and the atmosphere [7,12]. AHF is an added energy input to the energy balance that impacts primarily thermal characteristics of the urban canopy layer. However, authors agree that AHF is also an important driver of LST due to enhanced heat exchange between the atmosphere and urban land surfaces [7,10,12,13,14,15]. Hence, it is hypothesized that the reduction in AHF during the COVID-19 lockdown led to a weaker UHI effect and a decreased magnitude of the surface UHI (SUHI) [16,17,18,19].
Q* + QF = QH + QE + ΔQS + ΔQA
Since the outbreak of the COVID-19 pandemic, there has been a growing body of literature on the effects of lockdowns on UHIs [15,20,21]. A recent review of 29 studies on urban temperature anomalies during the COVID-19 lockdown revealed a decrease in UHI, LST, or SUHI, respectively, in the majority of 46 cities across various regions and climate zones [22]. The average LST decrease in developed (i.e., mid- and high-latitude) countries was smaller than that in developing countries, which is in line with findings from China [15] where the UHI-decline effect related to the lockdown weakened with increasing latitude.
Another global study suggests that while there was a substantial decrease in the SUHI magnitude of Chinese cities, the results from Europe and the USA were less significant [23]. Similar patterns were observed in a study comparing LST in Europe and North America during March–May 2020 to the same period in 2015–2019 [20]. The decrease in LST was generally larger in urban areas compared to rural landscapes, suggesting weakening SUHI effects, especially during nighttime. On the contrary, daytime LST increased over large parts of Europe due to less attenuation of solar radiation by atmospheric aerosols and anticyclonic synoptic conditions over Europe during the lockdown period [20,24]. These findings highlight the importance of taking into account the spatial and temporal variability in synoptic conditions when analyzing and comparing temporal changes in SUHI.
Indeed, while the aforementioned studies offer important insight into large-scale effects of the COVID-19 lockdown on LST and SUHIs, they mostly neglect within-city differences between urban and rural land cover types and the way they are affected by day-to-day weather variability [20,24]. Distinguishing between urban and rural microclimate dynamics and controlling for the effect of natural weather variability are, however, crucial steps in identifying changes in SUHI attributable to variations in AHF [21]. While urbanized areas are largely affected by anthropogenic heat, rural areas are more susceptible to changes in weather conditions. Nevertheless, most studies do not take into account this effect when assessing the impacts of COVID-19 lockdowns on SUHIs and attribute all changes in cities to anthropogenic heat. In order to attribute the changes in SUHI more precisely to AHF variability, it is necessary to control for the effects of synoptic conditions. This can be achieved via a rigorous process for selecting study period based on synoptic conditions and evaluating the results by taking into account the local dynamics as well.
In this study, we aim to assess the effect of the COVID-19 lockdown during March 2020 on UHI dynamics in Prague, Czechia. In order to determine the changes in SUHI magnitude, we used MODIS satellite images for eight selected days within the main lockdown period during March–April 2020 and ten selected days during March–April in the years 2017–2019. To ensure consistent synoptic conditions, only days with similar weather parameters were selected. SUHI magnitude was defined as the difference between urbanized areas (i.e., areas within the city having artificial land cover) and selected rural areas (i.e., areas within the city having typically rural land cover). Furthermore, to provide a more comprehensive picture of UHI patterns during the lockdown period, we cross-validated the change in SUHI magnitude during the lockdown period with: (i) atmospheric UHI (AUHI) changes calculated from selected Prague weather stations, and (ii) changes in air pollution concentrations obtained from Sentinel-5′s TROPOMI and MODIS’s Aerosol Optical Depth products.
Our study presents a novel approach to decouple confounding factors from the potential impact of AHF variations on UHI dynamics. First, we introduced robust image selection criteria to minimize the effect of synoptic variability and changes in global radiation during the lockdown period. Furthermore, by distinguishing urbanized and rural areas within the city boundaries, we were able to control for the confounding effects of contrasts and interactions between urban and rural microclimates (referred to as urban-rural dynamics) on the changes in SUHI magnitude. Finally, by investigating the effect in zones of Prague, we were able to explain the association between the level of urbanization and other factors influencing UHI. Employing this approach, our study provides new insight into attributing UHI dynamics during the COVID-19 lockdown to the role of AHF while considering intra-urban microclimate variations between urban and rural areas.
2. Materials and Methods
2.1. Study Area
Prague is the capital city of Czechia. It is located at approximately 50°4′ north latitude and 14°25′ east longitude. The city covers an area of 496.2 km2. According to the Köppen classification, Prague experiences a temperate oceanic climate (Cfb) that is characterized by distinct seasons with relatively mild temperatures and moderate rainfall throughout the year [25]. The population of Prague reached 1.33 million in 2020, and this has not changed substantially in recent years [26].
2.2. Data
Table 1 presents all datasets used in the analysis. For the assessment of SUHI dynamics, we used daily LST variables obtained from NASA’s Moderate Resolution Imaging Spectroradiometer (MODIS) program. The CORINE Land Cover 2018 product was used to identify urban and rural land cover categories within the city of Prague. Additionally, we employed MODIS’s Aerosol Optical Depth (AOD) dataset and the Offline Nitrogen Dioxide (OFFL NO2) product of Sentinel 5 Precursor to analyze changes in air pollution concentrations. All remote sensing data were downloaded and processed via the Google Earth Engine catalog.
The final analysis of LST and SUHI spatial dynamics was conducted in the ArcGIS 11 software. Records of hourly temperature, cloud cover, precipitation, and daily mean global radiation from four professional weather stations in Prague (Praha-Karlov, Praha-Kbely, Praha-Libus, and Praha-Ruzyne; Figure 1), managed by the Czech Hydrometeorological Institute, were used to control for synoptic conditions and changes in AUHI. Three concentric zones of Prague (Inner City, Outer City, Periphery), based on urbanization level and demographic spatial patterns [27], were used to relate the changes in SUHI to anthropogenic activities (Figure 1, Table 2).
2.3. Methods
In order to assess the effects of the COVID-19 lockdown on Prague’s UHI, we compared temperature and air quality conditions during the lockdown period with a selected reference period following the workflow in Figure 2. This workflow was implemented for the lockdown and reference periods separately. The results were then compared. Lockdown-related changes in SUHI were compared in the three concentric zones of Prague as described in Table 2. As the highest population density is in Inner City and the lowest is in Periphery, the largest decrease in SUHI can be expected in Inner City followed by Outer City and the smallest in Periphery. Details of the individual steps are explained below.
2.3.1. Determination of the Study Period and Satellite Image Selection
Consistent with other countries’ prevention strategies, declaration of a lockdown was necessary to limit the spread of COVID-19 after its outbreak in Czechia. A state of emergency was declared on 14 March 2020. A countrywide lockdown with the most stringent measures began two days later and lasted until the end of April [28].
Lockdown measures (including closure of public services, schools, places of employment, and retail sales outlets; restrictions upon mobility between regions and public gatherings) dramatically affected human lifestyles, especially in urban areas. For example, data from Václav Havel Airport in Prague report an almost 80% decrease in the number of checked-in passengers in 2020 compared to 2019 (and the same decrease in the number of flights). This not only affected traffic at the airport per se but also influenced general tourism-related mobility in the city [29]. Accordingly, overall traffic intensity in Prague dropped by more than 30% during the spring of 2020 compared to usual rates in 2019, before returning to nearly normal levels in the summer [30].
To identify changes in SUHI magnitude due to the lockdown, we selected MODIS Aqua satellite images acquired during the effective lockdown period defined from the start of the most stringent measures (16 March) to the third wave of the loosening of measures (27 April), after which the relaxation plan accelerated [28]. To ensure that the comparison of lockdown versus reference periods was minimally affected by weather variability, we selected satellite images reflecting weather characteristics as similar as possible. In the first step, we filtered satellite images with total cloud cover over the Prague area with less than 45% coverage and used their temperature range (as defined by daily temperature data from Prague weather stations) as a benchmark to filter images in the reference period. In addition, conditions antecedent to image acquisition were also considered. Therefore, images with high cloud cover before acquisition and/or precipitation recorded a day before acquisition were excluded from the analysis. Additionally, we used daily global radiation records as a proxy for solar radiation to control for changes in radiative fluxes due to natural covariation of weather patterns and atmospheric composition during the lockdown [15,20]. Due to the limited number of available images and a lack of established thresholds in the literature for similar studies, we listed relevant variables for the available images and excluded outliers. This way, we ensured that background conditions in the two periods were comparable and the observed changes in LST were attributable to changes in human activities and AHF.
As a result, eight satellite images from the period 14 March–27 April were selected and defined as Lockdown. The dates of selected satellite images and their temperature and global radiation values are listed in Table A1. To avoid significant changes in land cover, we only chose days from the previous three years, 2017, 2018, and 2019, as the reference period. Using the same criteria as for Lockdown, ten images from the previous three spring seasons (March–April in the years 2017–2019) were selected and defined as Reference (Table A1). The same days were selected for the comparison of air temperature data (Section 3.3).
2.3.2. Land Surface Temperature Estimation
Land surface temperatures were derived from the Aqua satellite’s Moderate Resolution Imaging Spectroradiometer (MODIS) sensor (MYD11A1, version 6.1) with 1 km resolution over Prague. Aqua satellite images were acquired at ~13:30 local solar time. For LST, the “LST_Day_1km” dataset and for quality assessment, the “QC_Day” layer were used. Nighttime LST data were not used due to high cloud percentages. Detailed methods for the LST algorithm and layers used are described in the MODIS documentation [31].
2.3.3. Surface Urban Heat Island Magnitude Calculation
To quantify the dynamics of SUHI within a city, selection of the reference rural land cover area requires careful consideration. In this study, we used Pastures (class 231) and Transitional woodland-shrub (class 324) land cover types from the CORINE land cover data [32] as reference LSTrural [33]. Thus, day-to-day weather variability was captured and the thermal characteristics of individual images were more comparable.
The SUHI magnitude of each MODIS image was calculated according to the following formula:
in which LSTimage represents the LST in each pixel of the selected image and LSTrural is the mean value of the rural reference of the corresponding image.
SUHI magnitude = LSTimage − LSTrural,
Median SUHI magnitude values were computed for all images from the Lockdown period (SUHIlockdown) and the Reference period (SUHIreference). Consequently, SUHIlockdown and SUHIreference values were extracted separately for “urbanized areas” (defined as CORINE land cover classes continuous and discontinuous urban fabric, industrial or commercial units, road and rail networks and associated land, port areas, and airports) and changes in SUHI magnitude between Lockdown and Reference periods related to urbanized areas in the three concentric zones of Prague (see Figure 1) were compared. In this way, changes in SUHI were quantified while controlling urban-rural dynamics and the level of human activities.
2.3.4. Analyzing the Atmospheric Urban Heat Island
We used the mean hourly temperature records at 13:00 and 14:00 CET (T14) from the four Prague weather stations (Figure 1) to analyze the changes in daytime AUHI during Lockdown. Records at 13:00 and 14:00 CET were used, as these are most consistent with the time of MODIS image acquisition. Because Ruzyne and Kbely are stations situated at two Prague airports (i.e., their records might have been affected by changes in their traffic load during the lockdown) and Karlov is located in Prague’s city center near the main traffic artery called “Severojižní magistrála”, we considered Libus a “rural” reference station least affected by anthropogenic influences. Consequently, we quantified the potential effect of Lockdown on temperatures in Karlov, Kbely, and Ruzyne, as their average T14 anomalies (AUHI magnitudes) vis-à-vis Libus on days included in the Lockdown and Reference periods (Table A1), respectively.
2.3.5. Analyzing Air Pollution
In addition to air temperature and LST, we analyzed two indicators of air quality based on satellite data to verify the changes in anthropogenic activities. We used the Copernicus Sentinel-5P TROPOspheric Monitoring Instrument (TROPOMI) sensor to estimate the changes in NO2, and daily MODIS Aerosol Optical Depth (AOD) to estimate changes in particulate matter concentrations [34,35].
For this purpose, we acquired images for the whole effective Lockdown period (16 March–27 April). Likewise, for the Reference period, we used the mean for the same period in 2017, 2018, and 2019 for MODIS AOD, but only 2019 for TROPOMI NO2, as the latter product is not available from previous years.
3. Results
3.1. Atmospheric Urban Heat Island Analysis
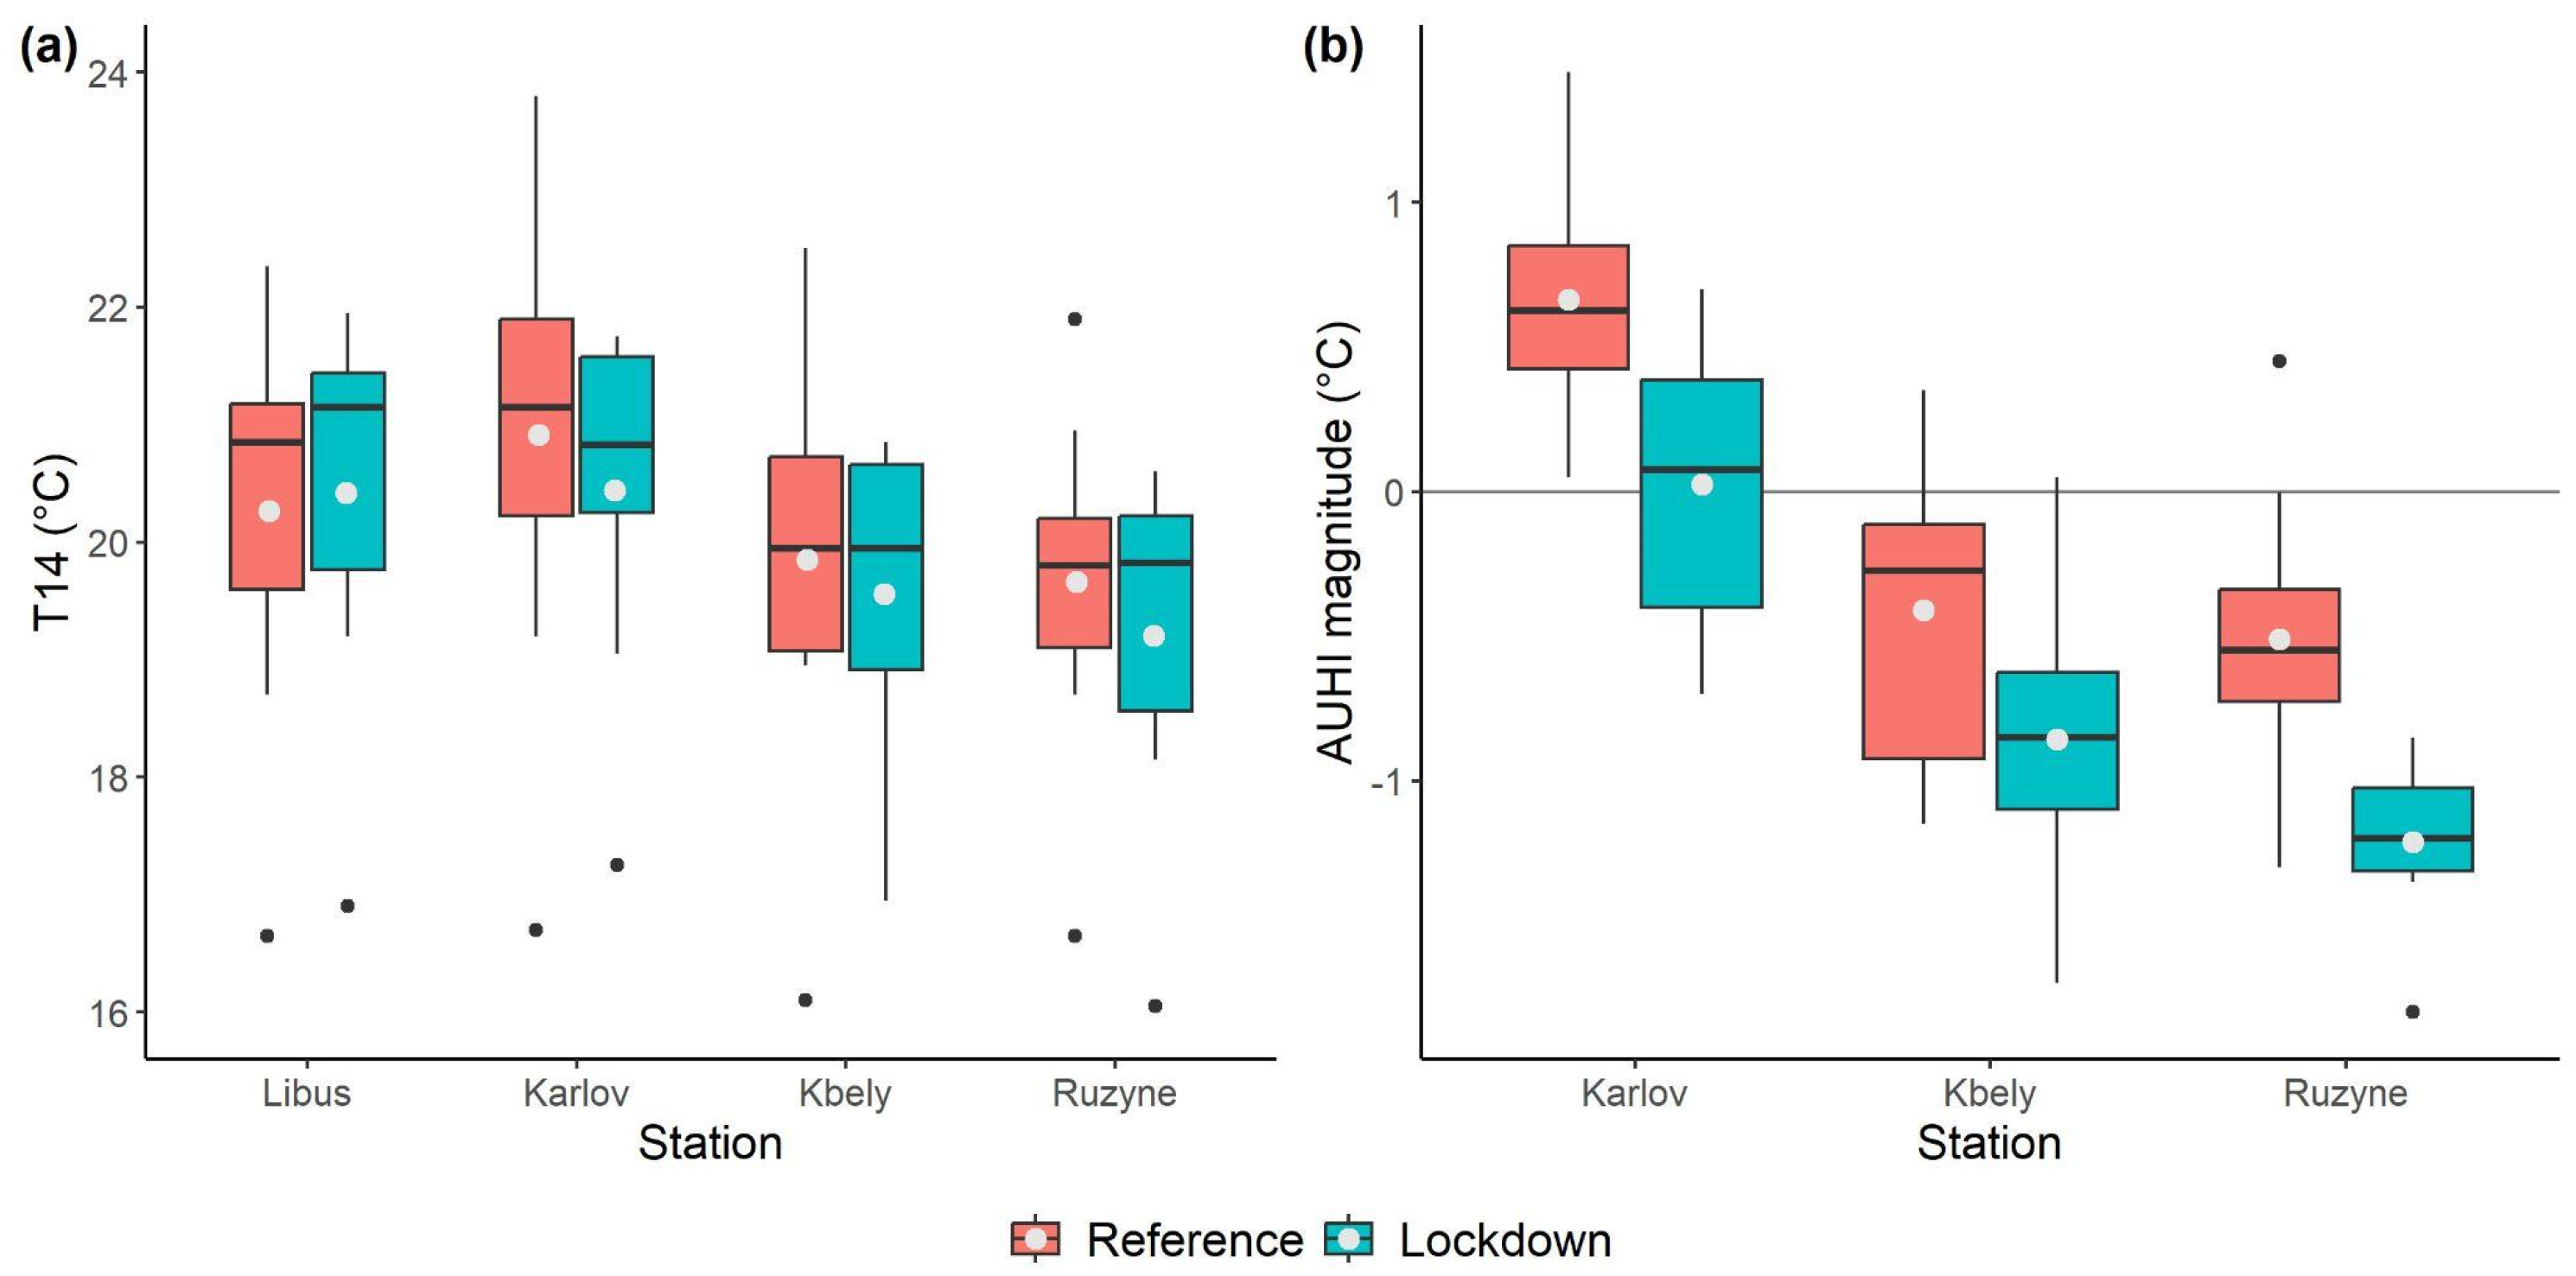
Figure 3a shows the distribution of afternoon temperature (T14) observed at Prague weather stations during the Lockdown and Reference periods. On average, we observed lower temperatures for Lockdown than Reference at all stations, except for Libus. Only the suburban station in Libus was slightly colder during Reference, but the difference was insignificant (less than 0.1 °C). This finding suggests that this station was least affected by anthropogenic changes and can be used as a reference station for the AUHI analysis.
The results suggest that the AUHI magnitude decreased during Lockdown by a mean of 0.5 °C. The most important change observed in Karlov suggests a marginal (less than 0.1 °C) difference between the city center (Karlov) and its outskirts (Libus) during Lockdown, compared to 0.7 °C in the Reference period (the change in AUHI magnitude was statistically significant according to the two-sample t-test with p-value < 0.05). Although colder than Libus, the decrease in AUHI between Reference and Lockdown was comparable (0.7 °C, p < 0.01) at Ruzyne, while at Kbely it was only 0.4 °C (p = 0.1) colder.
3.2. Surface Urban Heat Island Analysis
While the results for AUHI suggested a significant decrease in UHI magnitude during Lockdown in Prague, we observed smaller changes in SUHI. Figure 4 shows the spatial distribution of SUHI magnitude in the whole domain city of Prague during the Reference and Lockdown periods. Both images indicated clear spatial clustering of areas with the largest SUHI magnitude (up to 3.5 °C) in predominantly urbanized areas (i.e., near the city center and important transport corridors), while peripheral areas showed predominantly negative SUHI anomalies (by as much as −4.0 °C).
Figure 5 illustrates the spatial distribution of differences in SUHI magnitude between Lockdown and Reference. While the results indicate that some areas had stronger SUHI during Lockdown, mean SUHI magnitude in Prague was 0.2 °C lower during Lockdown (Figure A1a). To investigate the potential effect of AHF, we analyzed the changes of SUHI in urbanized areas only (Figure A1b, Figure 5). The mean difference in SUHI magnitude between Reference and Lockdown in urbanized areas was 0.1 °C (i.e., 15% decrease). Contrary to AUHI magnitudes, the changes in SUHI magnitude were relatively small. However, histograms in Figure A1 suggest a generally lower frequency of pixels with positive SUHI magnitude during Lockdown. This suggests overall weakening of spatial SUHI magnitude in Prague during Lockdown.
To analyze SUHI magnitude changes in the context of urbanization level and population density, a comparison was also made between the three concentric zones of Prague. Figure 6 shows the spatial distribution of SUHI magnitude differences in urbanized areas only. The SUHI magnitude difference for the three zones is presented in Table 3.
The largest decrease in SUHI magnitude was observed in Periphery. As this zone is characterized by the lowest population density and prevalence of agricultural land cover and forests (according to CORINE land cover classification: Figure A2), the SUHI magnitude was generally negative. The largest SUHI magnitude differences in this zone are related to the largest changes in the rural land cover types, especially in arable land and forests (Figure A3). As rural areas are generally more susceptible to both short-term (e.g., the occurrence of rainy days before the image acquisition) and seasonal weather variability (e.g., the beginning of the growing/seeding/harvesting season), we could observe the largest variance in SUHI magnitude in these classes (Figure A3).
On the other hand, Periphery is greatly affected by the daily commute from Prague suburbs to the city and intense flow of both national and international traffic on the highway circuit around the city. Furthermore, several industrial zones, such as a cement manufacturing plant in Radotín (the cool spot in the southwestern part of Prague in Figure 5 and Figure 6), are located in Periphery. Thus, the changes in SUHI in this zone might have been partly related to the significant drop in traffic intensity and AHF in these areas during Lockdown. However, given the 1 km resolution of MODIS images and linear character of the traffic-related activities, we were not able to obtain more precise information and we assume that most of the changes were related to the dynamics in rural areas within the city boundaries.
A 17% decrease in SUHI magnitude was observed in Inner City. This change was substantially smaller than that for Periphery. Inasmuch as industrial and urban fabric (Figure A2) cover more than 70% of the total area, however, and population density is highest in Inner City, we may assume that the reduction in SUHI magnitude in this zone was driven primarily by changes in human activities.
No significant change in SUHI was observed in Outer City, which can be characterized as a transition zone between Periphery and Inner City. Having a similar amount of industrial and urban fabric but higher population density (4.5 times as great) compared to Periphery, Outer City’s negligible change in SUHI magnitude suggests that the decrease observed in Periphery was related rather to changes in the rural areas’ dynamics than to AHF.
3.3. Air Pollution Analysis
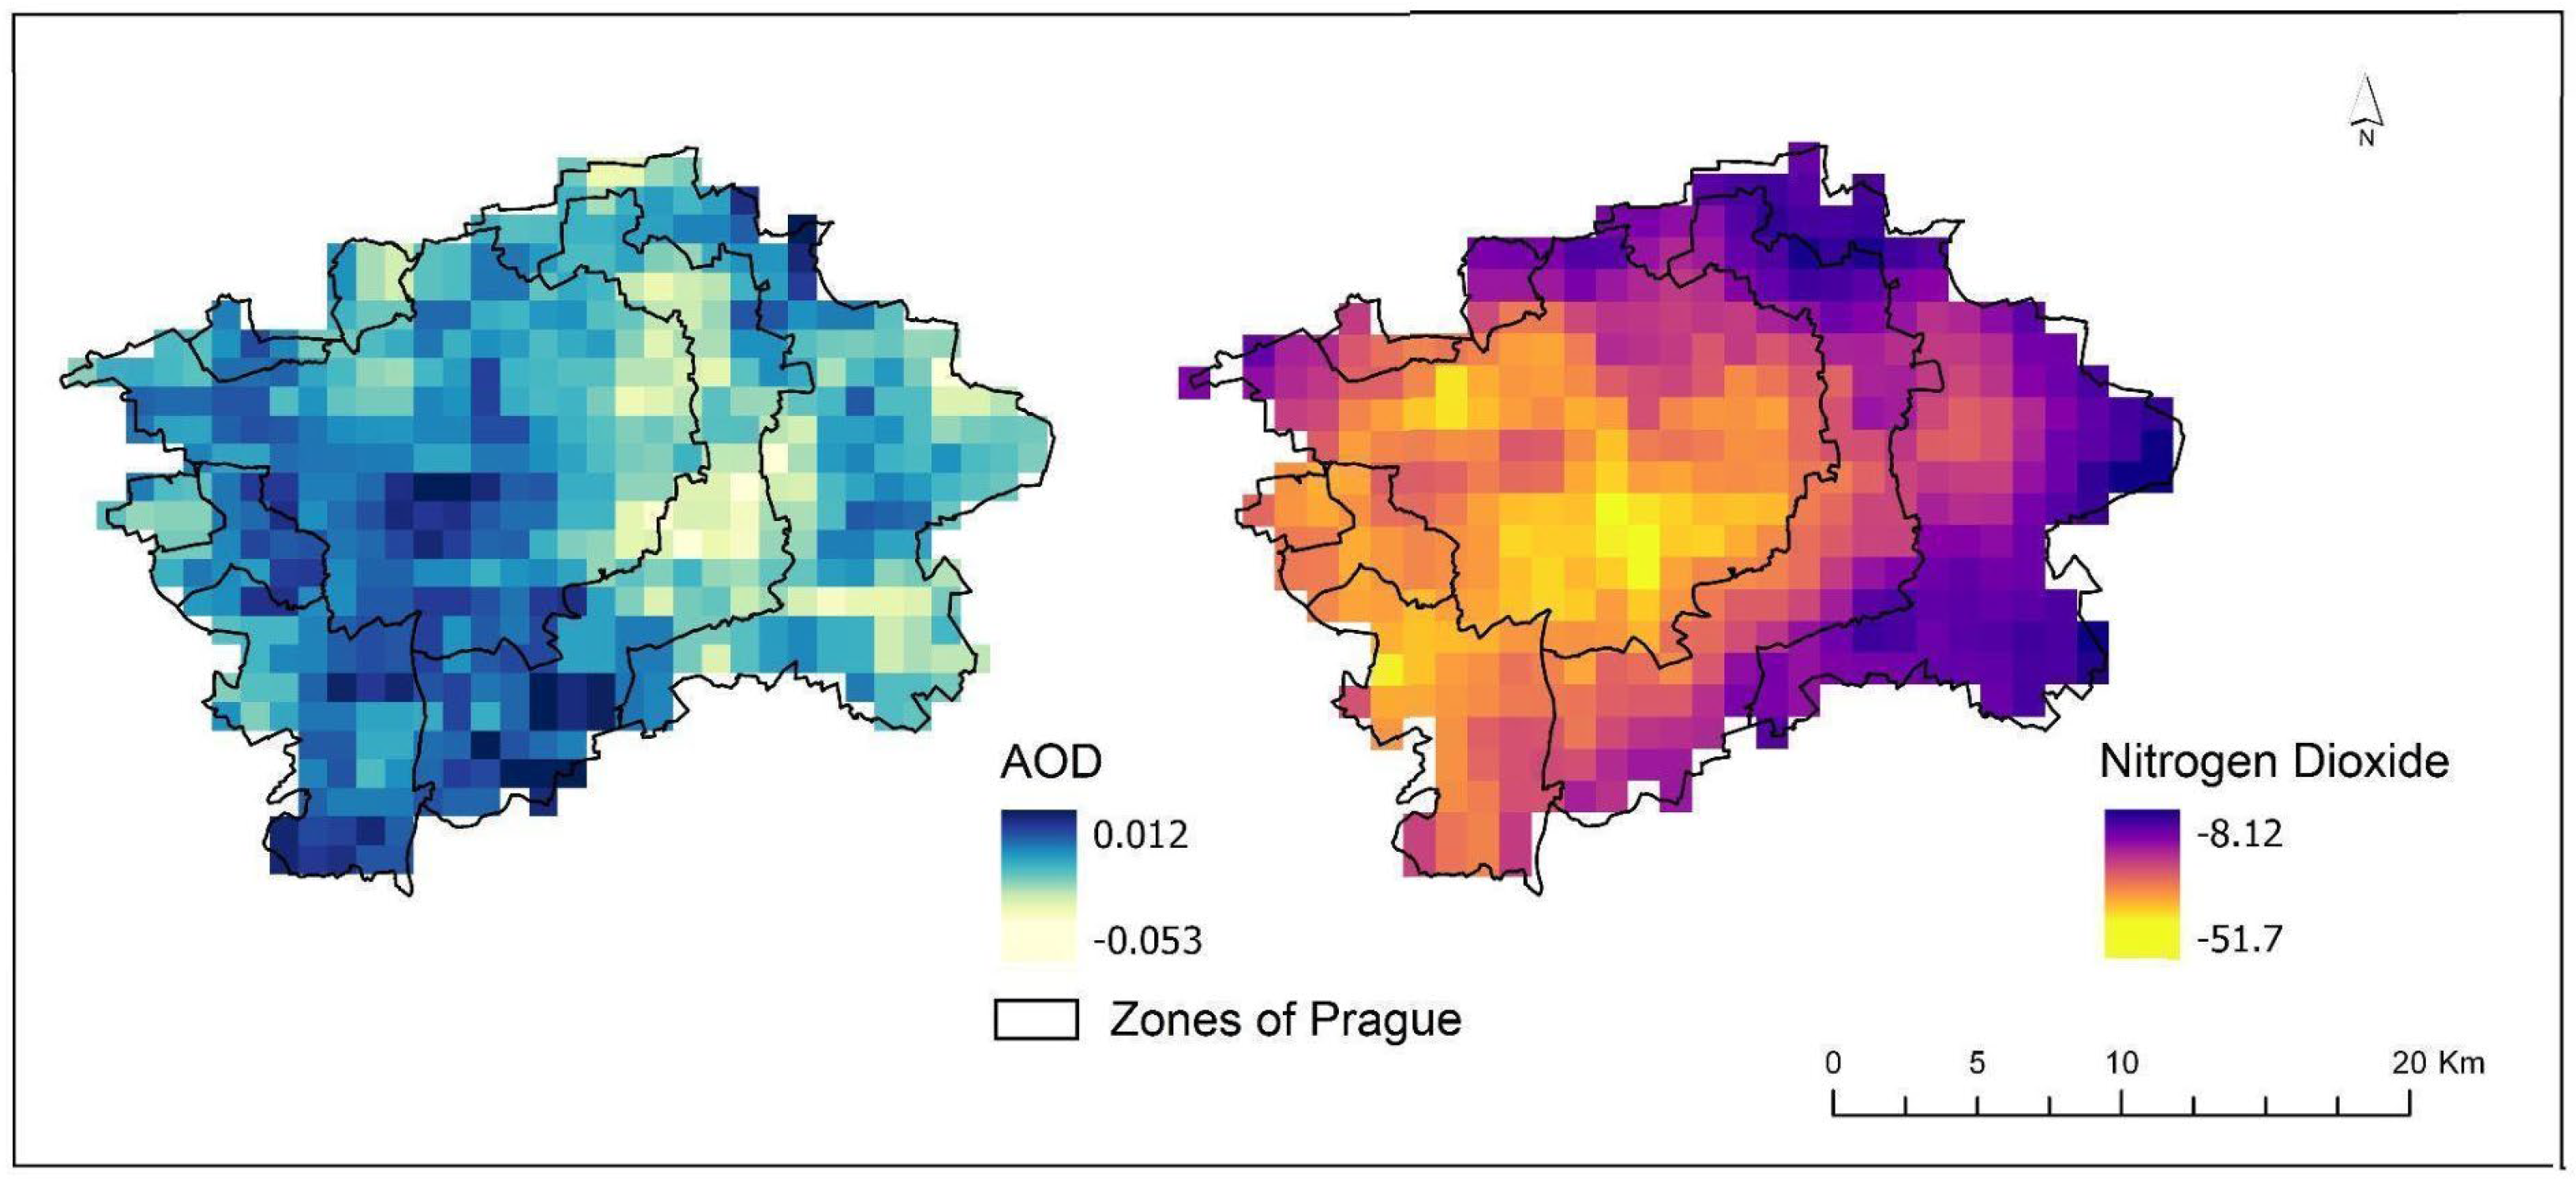
In accordance with the AUHI analysis, a significant decrease in air pollution concentration was observed during Lockdown. Figure 7 shows differences in AOD and NO2 concentrations between the Lockdown and Reference based on satellite data. Quantification of the changes in the three concentric zones of Prague is presented in Table 4.
Regarding NO2 concentrations, we observed an average decrease of 29% during Lockdown in 2020 compared to the same period in 2019. The decrease was largest in Inner City (33%), followed by Outer City (27%) and Periphery (25%). As NO2 concentrations are strongly related to traffic, these results support the hypothesis that SUHI magnitude changes in Inner City were more related to AHF variability, while changes in Periphery were driven by the rural dynamics.
Similarly, our analysis revealed a mean 12% decrease in AOD during Lockdown compared to the same period of 2017–2019. In contrast to NO2, the largest decrease was observed in Periphery (13%), followed by Outer City and Inner City (−12% and −11%), respectively. The generally smaller percentage decrease in AOD compared to NO2 may be attributed to the longer reference period. Moreover, AOD is not a direct measure of a pollutant; instead, it represents the optical thickness of aerosols along a column of the atmosphere. Therefore, compared to the short-lived NO2, AOD is more influenced by long-range transport and the prevailing westerly winds in Prague that carry pollutants from the city center to the east [36,37].
4. Discussion
In this study, we employed a comprehensive analytical approach to assess the effect of the COVID-19 lockdown on UHI dynamics in Prague, Czechia. We analyzed ground and satellite observations from the March–April 2020 Lockdown period and the March–April Reference periods in the years 2017–2019. This analysis quantified changes in mean AUHI and SUHI magnitudes, as well as in air quality distribution, between the two periods. Our findings show that the COVID-19 lockdown in Prague was associated with: (i) a 0.1 °C (15%) decrease in mean daytime SUHI magnitude over urbanized areas; (ii) a 0.7 °C decrease in mean afternoon (13:00–14:00 CET) AUHI magnitude in the city center (Praha-Karlov weather station vs. the reference station in Praha-Libus); and (iii) a 29% and 12% drop in mean NO2 and AOD concentrations, respectively, over the city.
Regarding changes in air temperature, our findings are in line with prior studies that observed weakened AUHI effects due to the COVID-19 lockdown. Similar to the results of our ground observations, an analysis performed with a high-accuracy observational network in Ghent, Belgium, revealed lower afternoon UHI magnitude (by as much as 0.4 °C/h) in the dense urban site during lockdown in 2020 as compared to the reference years [38]. Likewise, a study across 300 cities in China observed a mean 0.42 K decrease in daytime AUHI magnitude due to lockdown [15].
Regarding SUHI changes, while some studies show a decrease similar to our findings [15,21,39], others report an increase in SUHI effect during the lockdown [16,20]. This discrepancy results from the large thermal variation for land surfaces, which depends largely on local synoptic conditions and spatial distribution of land cover types [24]. To better understand the underlying reasons for variations among results in previous studies and to comprehend the impacts of lockdown on SUHI and UHI better, the roles of anthropogenic heat and rural dynamics need to be elaborated.
4.1. Role of Anthropogenic Heat
Despite the solid theoretical background on the importance of AHF for UHI [7], the evidence of specific mechanisms linking selected types of human activities with various aspects of UHI is limited due to the challenges in quantifying these associations. In mid-latitudes, AHF has a distinct seasonal pattern, and it has been considered a dominant contributor to UHI, especially during the cold part of the year. AHF is the product of human activities such as transportation, industrial and construction activities, heating, lighting, and human metabolism, and the heat flux is dissipated through both sensible and latent heat [7]. The quantity and impact of these emission sources on UHI can significantly vary throughout a city, influenced by the intensity of human activities and the time of day. The amount of these emission sources and their impacts on UHI may vary significantly across a city, depending on the intensity of human activities and the time of day. For example, temporal dependence of UHI magnitude on the weekly commuting pattern has been documented in Australia [40], while another study observed a significant increase in UHI magnitude related to massive migration during the Lunar New Year celebrations in China [41].
Although emissions of anthropogenic heat affect mainly the canopy UHI via enhanced sensible heat flux, SUHI is affected indirectly by modified thermal and radiative properties of the atmosphere (e.g., urban greenhouse effect) that intensify the amount of heat emitted by the atmosphere back to the surface [4,7]. Therefore, studies have documented both long-term and short-term associations between SUHI magnitude and reduction in human activities [10,42,43,44,45]. For example, a study in eastern China observed a positive correlation between SUHI magnitude and AHF (0.0275 °C warming of SUHI per each 1.0 W/m2 increase in AHF), which was estimated from energy consumption [46]. Accordingly, prior research documented a significant association between SUHI and AHF in seven Chinese cities using a linear mixed-effect model [47].
Reduced mobility and transport of city dwellers have been considered to contribute an important part of the reduction in AHF during the COVID-19 lockdown [15,22]. Data from Prague suggest an 80% drop in checked-in flights at the Prague airport and a 30% decrease in the city’s traffic intensity [29,30]. Accordingly, our results show a 29% and a 12% decrease in concentrations of NO2 and AOD, respectively, during Lockdown. Transportation data and our findings on air pollution support the hypothesis that the 0.1 °C (15%) decrease in mean daytime SUHI magnitude over urbanized areas in Prague and 0.7 °C decline in AUHI was driven by the decrease in AHF from human mobility during the lockdown period. The larger decrease in AUHI than in SUHI magnitude is in line with the indirect effect of AHF on SUHI. Similar to our findings, a larger reduction of daytime AUHI (by a mean of 0.42 K) than of SUHI (mean of 0.25 K) was observed during the COVID-19 lockdown in China [15].
Previous studies using the MODIS LST product to identify effects of the lockdown on SUHI revealed mean 0.20–0.41 K, 2 °C, and 0.25 K decreases in SUHI magnitude in the North Indian River Plain [21], the Middle East [14], and China [15], respectively. Most authors attribute these changes to reduced emissions of anthropogenic heat from traffic. For example, researchers documented a mean decrease in NO2, AOD, and SUHI, respectively by 23.7%, 3.7%, and 19.2%, in the United Arab Emirates during the lockdown compared to the same period in 2019 [48]. A study analyzing 43 European cities, on the other hand, was not able to attribute the reduction of air pollution concentrations to mobility changes during the lockdown, due to large spatial variability dominated by meteorological patterns [24].
When comparing the lockdown period to previous years, however, these studies considered the lockdown period as a whole, overlooking changes in synoptic conditions. A recent study also illustrated that nighttime LST in Paris and London were higher during the lockdown compared to 2019. However, this change was primarily driven by natural variability (due to higher temperatures during lockdown), and not related to changes in AHF [49]. Similarly, some parts of Europe experienced an increase in LST from usual levels during the lockdown period [20]. The authors hypothesized that this warming was related to anticyclonic weather conditions prevailing across a large part of Europe in spring 2020 and decreased concentrations of aerosols, which enhanced the amount of solar radiation incoming to the land surface. This could have enhanced the positive radiation balance during the lockdown period [21,50,51,52]. These findings highlight the important role of the natural variability of temperature and solar radiation that cannot be attributed to variations in AHF during lockdown. As far as we know, our study is the only one to analyze SUHI dynamics during the lockdown by rigorously selecting MODIS satellite images based on comparable synoptic conditions (i.e., taking into account similar temperature, cloud cover, and precipitation) and considering global radiation (as a proxy for solar radiation) (Appendix A). This approach ensured that our results would be more robust in the face of confounding factors.
In terms of spatial variability, our findings indicate a relatively small decrease in SUHI magnitude across the urbanized areas of Prague, while it even increased in some parts. While the decline in SUHI magnitude in urbanized areas was presumed to be linked to a decrease in AHF, this might not be the case in some historical parts of the city that have been within permanent traffic-restricted areas and/or pedestrian zones. In these areas, the changes in SUHI might be more influenced by favorable microclimatic conditions. Despite our efforts to mitigate the impact of changes in synoptic conditions through a rigorous selection of satellite images and careful consideration of reference land cover types for SUHI calculation, we acknowledge the possibility of their effects on our results. On the other hand, the consistent spatial pattern of SUHI between the Reference and Lockdown periods, along with generally small differences observed between the two periods, underscore the robustness of our method. This highlights the importance of considering possible confounding factors when assessing the effect of lockdown on SUHI.
4.2. Role of Urban-Rural Dynamics
Most prior studies have either covered multiple regions or primarily concentrated on large-scale effects. Although some of the previous studies have acknowledged the effects of urban-rural dynamics when analyzing the changes in SUHI [21], they often neglected the within-city dynamics between urban and rural land cover types when interpreting their results. Therefore, the options to compare our results with prior research are limited. For example, a 2 °C decrease in SUHI was observed in Paris during lockdown [49]. However, the spatial distribution of LST indicated a noteworthy temperature increase in surrounding rural areas, suggesting that a significant part of the SUHI decrease may have been attributable to increased LST in the rural areas. Given that the study did not consider the role of rural-urban dynamics or analyze the results in relation to development zones or urbanization, we are unable to compare its findings with ours. To better understand the role of urban-rural dynamics in the present study, we carefully distinguished urbanized and rural areas within the city boundaries when calculating the SUHI magnitude. Additionally, we investigated the complex interactions by employing the three concentric zones of Prague based on urbanization levels. As a result, we observed the largest decrease of SUHI magnitude in the Periphery zone with its predominantly rural land cover types. This is in line with some studies [17,21], although others have reported a larger LST decrease in urban areas compared to rural landscapes [17,19,39].
The additional analysis of SUHI changes in individual land cover classes indicated a generally larger variance in SUHI magnitude for rural land cover types, especially arable land and forests (Figure A3), compared to urban land covers (Figure A3). The difference may arise from rural areas’ natural systems and water reliance, which heighten their susceptibility to short-term and seasonal weather variations. These findings emphasize the importance of considering the effects of urban-rural dynamics within cities when attributing changes in SUHI magnitude to variations in AHF.
Although we tried to eliminate the effects of urban-rural dynamics on urbanized areas of Prague, results for the urban land cover classes were still affected by the “mixed pixels” problem [53]. The pixel values of urban areas, particularly those that are small and adjacent to larger rural areas, may be influenced by the predominance of these surrounding rural areas. This is because each MODIS pixel also contains information from neighboring pixels [53]. Hence, we may assume that SUHI variability in Inner City was predominantly driven by urban land cover characteristics and human-related activities, whereas changes in Periphery were primarily driven by the dynamics of prevalent rural land cover types, such as arable land and forests.
While previous studies provide knowledge and valuable insights, our study suggests that considering confounding factors such as changes in synoptic conditions and the urban-rural dynamics within city boundaries may provide better estimates and understanding of the effect of the COVID-19 lockdown on UHI and SUHI variations. Taking into account these factors, our findings support the hypothesis that the observed changes in SUHI magnitude within urbanized areas of the city were driven by the decrease in anthropogenic heat release during the lockdown period.
4.3. Limitations
We must acknowledge a few limitations of the study. First, due to lack of data on spatial distributions of anthropogenic heat sources and the amount of reduction in AHF during Lockdown, we were unable to solely attribute all changes to anthropogenic heat. Similarly, we could not quantify the specific impact of reduced AHF on the magnitude of SUHI. To estimate the effect of AHF reduction related to human activity, we employed the three concentric zones of Prague that are based on the level of urbanization and population density. While our approach enhances understanding of potential effects of urban development and human activities, we recognize that a more comprehensive understanding could be achieved by incorporating data on anthropogenic heat sources.
In addition, as AHF depends on population density and economic activities in the city [54], it is highly variable among cities [55]. This factor (together with methodological differences) limits meaningful comparison of our results with other case studies.
Furthermore, the study of SUHI changes relied on MODIS Aqua satellite images, which have inherent limitations. MODIS satellite images, while providing spatial coverage, may not capture the fine-scale variations in UHI effects within the city. For a more precise determination of the impact of human activities on urbanized areas in Prague, higher-resolution data (e.g., Landsat 8 images) could have been used to analyze the effects of the COVID-19 lockdown on SUHI [56,57]. Due to the low temporal resolution of Landsat, however, the number of available cloudless images was insufficient to be used in our methodology. Likewise, although nighttime UHI effects are generally more important in terms of health effects, we did not include nighttime analysis in this study due to high cloud coverage of the satellite images.
Another point of consideration is that air temperature data, while more precise and more relevant to human thermal comfort, are often restricted to a few stations. Thus, they do not fully capture the spatial variations in thermal conditions within a city. Therefore, many studies have utilized satellite images and remote sensing methods to analyze the spatial variations of UHIs in response to the COVID-19 lockdown [22].
Finally, although we implemented rigorous criteria to ensure comparable background conditions for the analyzed satellite images, we could not entirely eliminate the effects of synoptic variability on LST and urban-rural dynamics. Consequently, we could not quantify the specific contribution of the lockdown to UHI changes. This is especially difficult during the spring season, which is characterized by large day-to-day weather variability in Central Europe [58].
4.4. Future Research and Policy Implications
Controlling for potential confounding factors such as synoptic variability and urban-rural dynamics, our study suggests that the reduction of anthropogenic heat release can be used as an effective strategy to mitigate UHI effects in Prague, especially in the Inner City. Despite inconclusive results regarding SUHI and LST changes in Europe [20,24], our results align with research indicating that reduced mobility during the COVID-19 lockdown considerably improved the air quality and AUHI conditions in the city. Additionally, employing a rigorous selection of satellite images to eliminate the differences in synoptic conditions, we observed a decrease in mean SUHI magnitude across the urbanized areas of Prague.
Our findings underscore the significant influence of urban-rural dynamics within a city on SUHI variability and the role of spatial dependence. We encourage follow-up studies to further eliminate these effects, thereby enabling a clearer understanding of the reduction of AHF’s impact on SUHI. This approach aligns with Tobler’s first law of geography, which emphasizes the importance of spatial dependence: “Everything is related to everything else, but near things are more related than distant things”. [59].
The literature suggests reduction in anthropogenic activities as a potential SUHI mitigation strategy [10,42,43,44,45] and our study emphasizes the importance of carefully considering the local context. Our findings indicate that, especially in the city’s periphery, the effect of urban-rural dynamics needs to be taken into account when attributing changes in SUHI to anthropogenic activities. At the same time, mitigation strategies to reduce AHF in Periphery might not be as effective as anticipated due to the dominant influence of rural areas in this zone. A more sophisticated approach for quantifying the effect of urban-rural dynamics and investigating the relationship between spatial distribution of AHF and SUHI magnitude should be considered in future research. Quantifying these effects is necessary to plan effective mitigation strategies [47].
With the emergence of the COVID-19 pandemic, many cities have implemented measures to promote and encourage active mobility (walking and cycling), as well as to revitalize urban areas. This includes increasing bike lanes, setting up low emission zones, limiting car traffic, and revitalizing parking lots [22]. In addition to providing health benefits during the pandemic, these measures have other potential co-benefits such as improved air quality, reduced noise pollution, and reduced greenhouse gas emissions. Moreover, our study demonstrated that reduction in AHF during the lockdown, as a result of transportation and industrial activities, can reduce UHI and SUHI effects. Therefore, we recommend a transit-oriented development (TOD) approach that promotes sustainable, compact, and pedestrian-friendly urban design around transit hubs. TOD strategies, such as increased green spaces, energy-efficient buildings, reduced car dependence, and fostering community engagement, enhance human health (improving air quality and thermal comfort), mitigate UHI, and promote urban resilience [60,61,62].
Overall, the experience with the COVID-19 pandemic and the results of subsequent studies can motivate urban climate researchers, city planners and policy makers to collaborate and develop more resilient cities [22].
5. Conclusions
The unprecedented social and economic stagnation experienced worldwide during the COVID-19 pandemic provided an opportunity to investigate the effect of AHF on UHI and SUHI. In this study, we employed a comprehensive analytical approach to assess effects of the COVID-19 lockdown on mean UHI, SUHI, and air quality distribution in Prague, Czechia. The Lockdown period during March–April 2020 was compared with the Reference periods of March–April during the years 2017–2019.
Our results show that, based on MODIS observation, the COVID-19 lockdown was associated with a 15% reduction in the daytime magnitude of SUHI in urbanized areas of Prague. These findings were consistent with the 0.7 °C increase in afternoon AUHI magnitude (considered as the difference between the city center station and reference station in the city outskirts). Likewise, two main air quality indicators based on satellite data for aerosol optical depth and offline nitrogen dioxide concentrations, showed a 12% and 29% decrease, respectively. Taking into account changes in synoptic conditions and the dynamics of LST in urban-rural dynamics, we hypothesize that these changes may be attributed to the decreased anthropogenic emissions, mainly through reduced transportation and industrial activities.
The method employed in the study, which eliminates the differences in synoptic conditions and enables comparison between different periods, can be used to understand the effect of changes in AHF on SUHI during lockdown in other cities.
Ultimately, our study not only provides important insights for scientists regarding anthropogenic heat effects on the SUHI phenomenon, but also incentives for public policymakers to understand the complex dynamics of urban heat islands, by highlighting the interplay between urban and rural microclimates.
Because UHI is a complex phenomenon influenced by various factors, successful mitigation strategies that enhance thermal comfort and air quality can be achieved only through comprehensively understanding UHI. Such understanding can guide researchers and policymakers in developing targeted mitigation strategies that reduce the adverse effects of UHI on the environment and human well-being and also promote sustainable urban development.
Author Contributions
Conceptualization, T.D., A.U. and M.H.; methodology, T.D. and A.U.; software, T.D.; data acquisition and analysis, T.D.; writing–original draft preparation, T.D.; writing–review and editing, A.U. and M.H.; visualization, T.D.; supervision, A.U. and M.H. All authors have read and agreed to the published version of the manuscript.
Funding
The project study was supported by IGA Faculty of Environmental Sciences CZU Prague (project no. 2020B004) and by the Czech Science Foundation (22-24920S).
Data Availability Statement
Satellite image data used in this paper are open source; they can be downloaded from the official site https://earthengine.google.com/ (accessed on 12 January 2022) at no charge. Additional information about the results and analysis is available upon request from the corresponding author.
Acknowledgments
We thank David Sailor and Steven Caluwaerts for their valuable advice and constructive critiques.
Conflicts of Interest
The authors declare no conflicts of interest.
Appendix A

Table A1.
List of selected satellite images with dates, daily mean global radiation, and mean afternoon temperature (13:00–14:00 CET) as observed at Prague weather stations.
Table A1.
List of selected satellite images with dates, daily mean global radiation, and mean afternoon temperature (13:00–14:00 CET) as observed at Prague weather stations.
| Global Radiation (kJ/m²) | Air Temperature (°C) | |||||
|---|---|---|---|---|---|---|
| Weather Station | Karlov | Libus | Libus | Kbely | Karlov | Ruzyne |
| 28 March 2017 | 18137 | 19551 | 21.6 | 21.5 | 22.5 | 21.0 |
| 31 March 2017 | 18060 | 19350 | 20.9 | 20.6 | 22.0 | 20.1 |
| 1 April 2017 | 18243 | 19518 | 18.7 | 19.1 | 19.2 | 19.2 |
| 7 April 2018 | 20936 | 21337 | 21.0 | 20.0 | 21.7 | 20.0 |
| 18 April 2018 | 22439 | 22908 | 22.4 | 22.5 | 23.8 | 21.9 |
| 19 April 2018 | 21669 | 22204 | 19.2 | 19.1 | 19.8 | 18.7 |
| 23 March 2019 | 17323 | 17570 | 20.9 | 20.6 | 21.2 | 20.3 |
| 19 April 2019 | 23617 | 24119 | 21.4 | 20.9 | 21.8 | 19.8 |
| 21 April 2019 | 23905 | 24517 | 20.4 | 19.2 | 20.8 | 19.1 |
| 22 April 2019 | 24333 | 25125 | 16.7 | 16.1 | 16.7 | 16.7 |
| 7 April 2020 | 20614 | 21511 | 20.0 | 19.1 | 20.7 | 18.7 |
| 8 April 2020 | 22022 | 22937 | 21.4 | 20.7 | 21.7 | 20.2 |
| 9 April 2020 | 20523 | 21371 | 21.3 | 20.9 | 21.8 | 20.3 |
| 12 April 2020 | 22195 | 23034 | 22.0 | 20.6 | 21.6 | 20.6 |
| 17 April 2020 | 22039 | 23039 | 21.1 | 19.4 | 20.7 | 19.8 |
| 22 April 2020 | 24899 | 25628 | 16.9 | 17.0 | 17.3 | 16.1 |
| 23 April 2020 | 24648 | 25472 | 19.2 | 18.4 | 19.1 | 18.2 |
| 27 April 2020 | 25154 | 24679 | 21.7 | 20.7 | 21.0 | 19.9 |
Figure A1.
SUHI magnitude distribution in Prague in the Reference and Lockdown periods for (a) the whole of Prague, and (b) urbanized areas of Prague. Vertical broken lines indicate mean values for each period weighted by the numbers of pixels.
Figure A1.
SUHI magnitude distribution in Prague in the Reference and Lockdown periods for (a) the whole of Prague, and (b) urbanized areas of Prague. Vertical broken lines indicate mean values for each period weighted by the numbers of pixels.

Figure A2.
Land cover proportions in the zones within Prague.

Figure A3.
SUHI magnitude distribution (pixel count) for individual CORINE land cover classes in Prague for the Reference (red outline) and Lockdown (green outline) periods.
Figure A3.
SUHI magnitude distribution (pixel count) for individual CORINE land cover classes in Prague for the Reference (red outline) and Lockdown (green outline) periods.

References
- Muhammad, S.; Long, X.; Salman, M. COVID-19 Pandemic and Environmental Pollution: A Blessing in Disguise? Sci. Total Environ. 2020, 728, 138820. [Google Scholar] [CrossRef] [PubMed]
- Venter, Z.S.; Aunan, K.; Chowdhury, S.; Lelieveld, J. COVID-19 Lockdowns Cause Global Air Pollution Declines. Proc. Natl. Acad. Sci. USA 2020, 117, 18984–18990. [Google Scholar] [CrossRef] [PubMed]
- Kumari, P.; Toshniwal, D. Impact of Lockdown on Air Quality over Major Cities across the Globe during COVID-19 Pandemic. Urban Clim. 2020, 34, 100719. [Google Scholar] [CrossRef] [PubMed]
- Liu, F.; Wang, M.; Zheng, M. Effects of COVID-19 Lockdown on Global Air Quality and Health. Sci. Total Environ. 2021, 755, 142533. [Google Scholar] [CrossRef] [PubMed]
- Potter, C.; Alexander, O. Impacts of the San Francisco Bay Area Shelter-in-Place during the COVID-19 Pandemic on Urban Heat Fluxes. Urban Clim. 2021, 37, 100828. [Google Scholar] [CrossRef] [PubMed]
- Fan, H.; Sailor, D. Modeling the Impacts of Anthropogenic Heating on the Urban Climate of Philadelphia: A Comparison of Implementations in Two PBL Schemes. Atmos. Environ. 2005, 39, 73–84. [Google Scholar] [CrossRef]
- Oke, T.R.; Mills, G.; Christen, A.; Voogt, J.A. Urban Climates; Cambridge University Press: Cambridge, UK, 2017. [Google Scholar]
- Lee, S.-H.; McKeen, S.A.; Sailor, D.J. A Regression Approach for Estimation of Anthropogenic Heat Flux Based on a Bottom-up Air Pollutant Emission Database. Atmos. Environ. 2014, 95, 629–633. [Google Scholar] [CrossRef]
- Chen, S.; Hu, D. Parameterizing Anthropogenic Heat Flux with an Energy-Consumption Inventory and Multi-Source Remote Sensing Data. Remote Sens. 2017, 9, 1165. [Google Scholar] [CrossRef]
- Firozjaei, M.K.; Weng, Q.; Zhao, C.; Kiavarz, M.; Lu, L.; Alavipanah, S.K. Surface Anthropogenic Heat Islands in Six Megacities: An Assessment Based on a Triple-Source Surface Energy Balance Model. Remote Sens. Environ. 2020, 242, 111751. [Google Scholar] [CrossRef]
- Chrysoulakis, N.; Grimmond, S.; Feigenwinter, C.; Lindberg, F.; Gastellu-Etchegorry, J.-P.; Marconcini, M.; Mitraka, Z.; Stagakis, S.; Crawford, B.; Olofson, F.; et al. Urban Energy Exchanges Monitoring from Space. Sci. Rep. 2018, 8, 11498. [Google Scholar] [CrossRef]
- Lee, X. Energy Balance, Evaporation, and Surface Temperature. In Fundamentals of Boundary-Layer Meteorology; Springer Atmospheric Sciences; Springer: Cham, Switzerland, 2017; pp. 191–213. [Google Scholar] [CrossRef]
- Hamilton, I.G.; Davies, M.; Steadman, P.; Stone, A.; Ridley, I.; Evans, S. The Significance of the Anthropogenic Heat Emissions of London’s Buildings: A Comparison against Captured Shortwave Solar Radiation. Build. Environ. 2009, 44, 807–817. [Google Scholar] [CrossRef]
- El Kenawy, A.M.; Lopez-Moreno, J.I.; McCabe, M.F.; Domínguez-Castro, F.; Peña-Angulo, D.; Gaber, I.M.; Alqasemi, A.S.; Al Kindi, K.M.; Al-Awadhi, T.; Hereher, M.E.; et al. The Impact of COVID-19 Lockdowns on Surface Urban Heat Island Changes and Air-Quality Improvements across 21 Major Cities in the Middle East. Environ. Pollut. 2021, 288, 117802. [Google Scholar] [CrossRef] [PubMed]
- Liu, Z.; Lai, J.; Zhan, W.; Bechtel, B.; Voogt, J.; Quan, J.; Hu, L.; Fu, P.; Huang, F.; Li, L.; et al. Urban Heat Islands Significantly Reduced by COVID-19 Lockdown. Geophys. Res. Lett. 2022, 49, e2021GL096842. [Google Scholar] [CrossRef]
- Feng, Z.; Wang, X.; Yuan, J.; Zhang, Y.; Yu, M. Changes in Air Pollution, Land Surface Temperature, and Urban Heat Islands during the COVID-19 Lockdown in Three Chinese Urban Agglomerations. Sci. Total Environ. 2023, 892, 164496. [Google Scholar] [CrossRef] [PubMed]
- Mijani, N.; Karimi Firozjaei, M.; Mijani, M.; Khodabakhshi, A.; Qureshi, S.; Jokar Arsanjani, J.; Alavipanah, S.K. Exploring the Effect of COVID-19 Pandemic Lockdowns on Urban Cooling: A Tale of Three Cities. Adv. Space Res. 2023, 71, 1017–1033. [Google Scholar] [CrossRef]
- Meng, Q.; Qian, J.; Schlink, U.; Zhang, L.; Hu, X.; Gao, J.; Wang, Q. Anthropogenic Heat Variation during the COVID-19 Pandemic Control Measures in Four Chinese Megacities. Remote Sens. Environ. 2023, 293, 113602. [Google Scholar] [CrossRef] [PubMed]
- Pal, S.; Das, P.; Mandal, I.; Sarda, R.; Mahato, S.; Nguyen, K.-A.; Liou, Y.-A.; Talukdar, S.; Debanshi, S.; Saha, T.K. Effects of Lockdown Due to COVID-19 Outbreak on Air Quality and Anthropogenic Heat in an Industrial Belt of India. J. Clean. Prod. 2021, 297, 126674. [Google Scholar] [CrossRef]
- Parida, B.R.; Bar, S.; Kaskaoutis, D.; Pandey, A.C.; Polade, S.D.; Goswami, S. Impact of COVID-19 Induced Lockdown on Land Surface Temperature, Aerosol, and Urban Heat in Europe and North America. Sustain. Cities Soc. 2021, 75, 103336. [Google Scholar] [CrossRef]
- Chakraborty, T.; Sarangi, C.; Lee, X. Reduction in Human Activity Can Enhance the Urban Heat Island: Insights from the COVID-19 Lockdown. Environ. Res. Lett. 2021, 16, 054060. [Google Scholar] [CrossRef]
- Wang, W.; He, B.-J. Co-Occurrence of Urban Heat and the COVID-19: Impacts, Drivers, Methods, and Implications for the Post-Pandemic Era. Sustain. Cities Soc. 2023, 90, 104387. [Google Scholar] [CrossRef]
- Sismanidis, P.; Bechtel, B.; Keramitsoglou, I.; Liu, Z.; Zhan, W. The Intensity of Surface Urban Heat Islands in the Global North during the COVID-19 Lockdowns. In Proceedings of the 2023 Joint Urban Remote Sensing Event (JURSE), Heraklion, Greece, 17–19 May 2023. [Google Scholar] [CrossRef]
- Glocke, P.; Bechtel, B.; Sismanidis, P. Consideration of Altered Anthropogenic Behavior during the First Lockdown and Its Effects on Air Pollutants and Land Surface Temperature in European Cities. Atmosphere 2023, 14, 1025. [Google Scholar] [CrossRef]
- Kottek, M.; Grieser, J.; Beck, C.; Rudolf, B.; Rubel, F. World Map of the Köppen-Geiger Climate Classification Updated. Meteorol. Z. 2006, 15, 259–263. [Google Scholar] [CrossRef] [PubMed]
- Obyvatelstvo. Available online: https://www.czso.cz/csu/xa/obyvatelstvo-xa (accessed on 20 December 2023).
- Ouředníček, M. Prague and Central Bohemia; Charles University, Karolinum Press: Prague, Czech Republic, 2022. [Google Scholar]
- Our World in Data. COVID-19 Stringency Index. Available online: https://ourworldindata.org/covid-stringency-index (accessed on 20 January 2023).
- Letiště Praha. Available online: https://www.prg.aero/letiste-praha-odbavilo-za-lonsky-rok-temer-3-7-milionu-cestujicich (accessed on 4 February 2023).
- Ročenka Dopravy Praha 2020. Available online: https://www.tsk-praha.cz/static/udi-rocenka-2020-cz.pdf (accessed on 20 March 2023).
- Wan, Z. MODIS Land Surface Temperature Products Users’ Guide. Available online: https://lpdaac.usgs.gov/documents/447/MOD11_User_Guide_V4.pdf (accessed on 11 January 2023).
- CORINE Land Cover. Available online: https://land.copernicus.eu/en/products/corine-land-cover (accessed on 10 January 2023).
- Oke, T.R. Boundary Layer Climates; Psychology Press: London, UK, 1987. [Google Scholar]
- Sentinel-5P OFFL NO2: Offline Nitrogen Dioxide. Available online: https://developers.google.com/earth-engine/datasets/catalog/COPERNICUS_S5P_OFFL_L3_NO2#description (accessed on 20 January 2023).
- LP DAAC—MCD19A2. Available online: https://lpdaac.usgs.gov/products/mcd19a2v006/ (accessed on 3 January 2023).
- Patiño, W.R.; Duong, V.M. Intercomparison of Gaussian Plume Dispersion Models Applied to Sulfur Dioxide Emissions from a Stationary Source in the Suburban Area of Prague, Czech Republic. Environ. Model. Assess. 2021, 27, 119–137. [Google Scholar] [CrossRef]
- Simulated Historical Climate & Weather Data for Prague. Available online: https://www.meteoblue.com/en/weather/historyclimate/climatemodelled/prague_czechia_3067696 (accessed on 17 March 2023).
- Hamdi, R.; Tronquo, E.; Bogaerts, E.; Hoang, K.-M.; Loudeche, C.; Claeys, E.; Caluwaerts, S.; Duchêne, F.; Van Schaeybroeck, B.; Termonia, P. The Impact of COVID-19 Confinement Measures on the Canopy Urban Heat Island Intensity of Ghent (Belgium). In Proceedings of the EGU General Assembly 2022, Vienna, Austria, 23–27 May 2022. [Google Scholar] [CrossRef]
- Roshan, G.; Sarli, R.; Grab, S.W. The Case of Tehran’s Urban Heat Island, Iran: Impacts of Urban ‘Lockdown’ Associated with the COVID-19 Pandemic. Sustain. Cities Soc. 2021, 75, 103263. [Google Scholar] [CrossRef] [PubMed]
- Earl, N.; Simmonds, I.; Tapper, N. Weekly Cycles in Peak Time Temperatures and Urban Heat Island Intensity. Environ. Res. Lett. 2016, 11, 074003. [Google Scholar] [CrossRef]
- Zhang, J.; Wu, L.; Yuan, F.; Dou, J.; Miao, S. Mass Human Migration and Beijing’s Urban Heat Island during the Chinese New Year Holiday. Sci. Bull. 2015, 60, 1038–1041. [Google Scholar] [CrossRef]
- Raj, S.; Paul, S.K.; Chakraborty, A.; Kuttippurath, J. Anthropogenic Forcing Exacerbating the Urban Heat Islands in India. J. Environ. Manag. 2020, 257, 110006. [Google Scholar] [CrossRef]
- Alves, E.; Anjos, M.; Galvani, E. Surface Urban Heat Island in Middle City: Spatial and Temporal Characteristics. Urban Sci. 2020, 4, 54. [Google Scholar] [CrossRef]
- Feng, R.; Wang, F.; Wang, K.; Wang, H.; Li, L. Urban Ecological Land and Natural-Anthropogenic Environment Interactively Drive Surface Urban Heat Island: An Urban Agglomeration-Level Study in China. Environ. Int. 2021, 157, 106857. [Google Scholar] [CrossRef]
- Zhou, D.; Zhao, S.; Liu, S.; Zhang, L.; Zhu, C. Surface Urban Heat Island in China’s 32 Major Cities: Spatial Patterns and Drivers. Remote Sens. Environ. 2014, 152, 51–61. [Google Scholar] [CrossRef]
- Jin, K.; Wang, F.; Wang, S. Assessing the Spatiotemporal Variation in Anthropogenic Heat and Its Impact on the Surface Thermal Environment over Global Land Areas. Sustain. Cities Soc. 2020, 63, 102488. [Google Scholar] [CrossRef]
- Qian, J.; Meng, Q.; Zhang, L.; Schlink, U.; Hu, X.; Gao, J. Characteristics of Anthropogenic Heat with Different Modeling Ideas and Its Driving Effect on Urban Heat Islands in Seven Typical Chinese Cities. Sci. Total Environ. 2023, 886, 163989. [Google Scholar] [CrossRef]
- Alqasemi, A.S.; Hereher, M.E.; Kaplan, G.; Al-Quraishi, A.M.F.; Saibi, H. Impact of COVID-19 Lockdown upon the Air Quality and Surface Urban Heat Island Intensity over the United Arab Emirates. Sci. Total Environ. 2021, 767, 144330. [Google Scholar] [CrossRef] [PubMed]
- Safarrad, T.; Ghadami, M.; Dittmann, A. Effects of COVID-19 Restriction Policies on Urban Heat Islands in Some European Cities: Berlin, London, Paris, Madrid, and Frankfurt. Int. J. Environ. Res. Public Health 2022, 19, 6579. [Google Scholar] [CrossRef] [PubMed]
- Chakraborty, T.; Das, D.; Hamdi, R.; Khan, A.; Niyogi, D. Large-Scale Urban Heating and Pollution Domes over the Indian Subcontinent. Remote Sens. 2023, 15, 2681. [Google Scholar] [CrossRef]
- Revathy, S.M.; Rangaraj, A.G.; Srinath, Y.; Boopathi, K.; Shobana Devi, A.; Balaraman, K.; Prasad, D.M.R. Impact on Solar Radiation Parameters in India during COVID-19 Lockdown: A Case Study. Int. J. Sustain. Energy 2021, 40, 806–820. [Google Scholar] [CrossRef]
- Mazhar, U.; Jin, S.; Bilal, M.; Ali, M.A.; Khan, R. Reduction of Surface Radiative Forcing Observed from Remote Sensing Data during Global COVID-19 Lockdown. Atmos. Res. 2021, 261, 105729. [Google Scholar] [CrossRef] [PubMed]
- Peng, J.; Liu, Q.; Wang, L.; Liu, Q.; Fan, W.; Lu, M.; Wen, J. Characterizing the Pixel Footprint of Satellite Albedo Products Derived from MODIS Reflectance in the Heihe River Basin, China. Remote Sens. 2015, 7, 6886–6907. [Google Scholar] [CrossRef]
- Lindberg, F.; Grimmond, C.S.B.; Yogeswaran, N.; Kotthaus, S.; Allen, L. Impact of City Changes and Weather on Anthropogenic Heat Flux in Europe 1995–2015. Urban Clim. 2013, 4, 1–15. [Google Scholar] [CrossRef]
- Ahmed, G.; Zan, M. Impact of COVID-19 Restrictions on Air Quality and Surface Urban Heat Island Effect within the Main Urban Area of Urumqi, China. Environ. Sci. Pollut. Res. 2022, 30, 16333–16345. [Google Scholar] [CrossRef]
- Cai, Z.; Tang, Y.; Zhan, Q. A Cooled City? Comparing Human Activity Changes on the Impact of Urban Thermal Environment before and after City-Wide Lockdown. Build. Environ. 2021, 195, 107729. [Google Scholar] [CrossRef] [PubMed]
- Sahani, N.; Goswami, S.K.; Saha, A. The Impact of COVID-19 Induced Lockdown on the Changes of Air Quality and Land Surface Temperature in Kolkata City, India. Spat. Inf. Res. 2020, 29, 519–534. [Google Scholar] [CrossRef]
- Scheifinger, H.; Menzel, A.; Koch, E.; Peter, C.; Ahas, R. Atmospheric Mechanisms Governing the Spatial and Temporal Variability of Phenological Phases in Central Europe. Int. J. Climatol. 2002, 22, 1739–1755. [Google Scholar] [CrossRef]
- Tobler, W.R. A Computer Movie Simulating Urban Growth in the Detroit Region. Econ. Geogr. 1970, 46, 234. [Google Scholar] [CrossRef]
- Raya, A.B.; Hasibuan, H.S.; Sodri, A. Thermal Comfort-Based Spatial Planning Model in Jakarta Transit-Oriented Development (TOD). Atmosphere 2022, 13, 565. [Google Scholar] [CrossRef]
- Wey, W.-M. Smart Growth and Transit-Oriented Development Planning in Site Selection for a New Metro Transit Station in Taipei, Taiwan. Habitat Int. 2015, 47, 158–168. [Google Scholar] [CrossRef]
- Jacobson, J.; Forsyth, A. Seven American TODs: Good Practices for Urban Design in Transit-Oriented Development Projects. J. Transp. Land Use 2008, 1, 51–88. [Google Scholar] [CrossRef]
Figure 1.
Three concentric zones of Prague [27] and locations of weather stations used in this study.
Figure 1.
Three concentric zones of Prague [27] and locations of weather stations used in this study.

Figure 2.
Workflow of the study.

Figure 3.
(a) Afternoon air temperatures (T14) at four Prague weather stations during the Reference and Lockdown periods. (b) Atmospheric urban heat island (AUHI) magnitudes calculated as T14 difference between a given weather station and the reference station in Libus. Box plots indicate medians and interquartile ranges of the values. Gray points denote mean values across all days in a given period at each station.

Figure 4.
Spatial distribution of surface urban heat island (SUHI) magnitude during Reference (left) and Lockdown (right) periods in Prague based on Aqua satellite’s Moderate Resolution Imaging Spectroradiometer (MODIS) sensor.
Figure 4.
Spatial distribution of surface urban heat island (SUHI) magnitude during Reference (left) and Lockdown (right) periods in Prague based on Aqua satellite’s Moderate Resolution Imaging Spectroradiometer (MODIS) sensor.

Figure 5.
Spatial distribution of SUHI magnitude difference in Prague (Lockdown vs. Reference). Urbanized areas are brightened while rural areas are shaded.
Figure 5.
Spatial distribution of SUHI magnitude difference in Prague (Lockdown vs. Reference). Urbanized areas are brightened while rural areas are shaded.

Figure 6.
Spatial distribution of SUHI magnitude difference (Lockdown vs. Reference) in urbanized areas of the three concentric zones of Prague (Figure 1).
Figure 6.
Spatial distribution of SUHI magnitude difference (Lockdown vs. Reference) in urbanized areas of the three concentric zones of Prague (Figure 1).

Figure 7.
Difference in NO2 (left) and Aerosol Optical Depth (AOD) (right) concentrations (Lockdown vs. Reference).
Figure 7.
Difference in NO2 (left) and Aerosol Optical Depth (AOD) (right) concentrations (Lockdown vs. Reference).

Table 1.
Datasets used in this study.
| Category | Variables | Temporal and Spatial Resolution | Data Source |
|---|---|---|---|
| LST–MODIS day | LST_Day_1 km | daily, 1 km | National Aeronautics and Space Administration |
| AOD–MODIS | Optical_Depth_055 | daily, 1 km | National Aeronautics and Space Administration |
| NO2–Sentinel 5 | tropospheric_NO2_column_number_density | daily, 1 km | European Space Agency |
| Land cover–CORINE | CLC2018 | minimum mapped unit of 25 ha | European Space Agency |
| Weather station | air temperature global radiation | hourly daily | Czech Hydrometeorological Institute |
| Zone | Area (km2) | Population Count | Population Density (Inhab/km2) | ||
|---|---|---|---|---|---|
| Inner City | 173.6 | 35.0% | 727,589 | 60.9% | 4651 |
| Outer City | 115.1 | 23.2% | 370,106 | 27.9% | 3216 |
| Periphery | 207.5 | 41.8% | 146,656 | 11.1% | 707 |
| Prague (total) | 496.2 | 100.0% | 1,324,277 | 100.0% | 2669 |
Table 3.
SUHI magnitude changes in the three concentric zones of Prague during Lockdown.
| Zone | Reference | Lockdown | Change (°C) | Change (%) | Change (%)/Population Density (%) |
|---|---|---|---|---|---|
| Inner City | 0.6 | 0.5 | 0.1 | −17% | −31 |
| Outer City | 0.6 | 0.6 | 0 | 0 | 0 |
| Periphery | −0.2 | −0.4 | −0.2 | −100% | −1213 |
Table 4.
Difference in NO2 and aerosol optical depth (AOD) concentrations in the three concentric zones of Prague.
Table 4.
Difference in NO2 and aerosol optical depth (AOD) concentrations in the three concentric zones of Prague.
| NO2 (μmol/m²) | AOD | |||||||
|---|---|---|---|---|---|---|---|---|
| Zone | Reference | Lockdown | Change | Change (%) | Reference | Lockdown | Change | Change (%) |
| Inner City | 147.7 | 111.1 | −36.6 | −32.9 | 0.103 | 0.092 | −0.011 | −10.8 |
| Outer City | 132.4 | 103.9 | −28.4 | −27.3 | 0.106 | 0.093 | −0.012 | −11.8 |
| Periphery | 124.2 | 99.1 | −25.2 | −25.4 | 0.105 | 0.091 | −0.014 | −13.3 |
Disclaimer/Publisher’s Note: The statements, opinions and data contained in all publications are solely those of the individual author(s) and contributor(s) and not of MDPI and/or the editor(s). MDPI and/or the editor(s) disclaim responsibility for any injury to people or property resulting from any ideas, methods, instructions or products referred to in the content. |
© 2024 by the authors. Licensee MDPI, Basel, Switzerland. This article is an open access article distributed under the terms and conditions of the Creative Commons Attribution (CC BY) license (https://creativecommons.org/licenses/by/4.0/).
Share and Cite
MDPI and ACS Style
Dogan, T.; Urban, A.; Hanel, M. Effect of COVID-19 Lockdown on Urban Heat Island Dynamics in Prague, Czechia. Remote Sens. 2024, 16, 1113. https://doi.org/10.3390/rs16071113
AMA Style
Dogan T, Urban A, Hanel M. Effect of COVID-19 Lockdown on Urban Heat Island Dynamics in Prague, Czechia. Remote Sensing. 2024; 16(7):1113. https://doi.org/10.3390/rs16071113
Chicago/Turabian StyleDogan, Tugba, Aleš Urban, and Martin Hanel. 2024. "Effect of COVID-19 Lockdown on Urban Heat Island Dynamics in Prague, Czechia" Remote Sensing 16, no. 7: 1113. https://doi.org/10.3390/rs16071113
Note that from the first issue of 2016, this journal uses article numbers instead of page numbers. See further details here.