
Morphology, Micromechanical, and Macromechanical Properties of Novel Waterborne Poly(urethane-urea)/Silica Nanocomposites
 , , and
Abstract
:
1. Introduction
- (1)
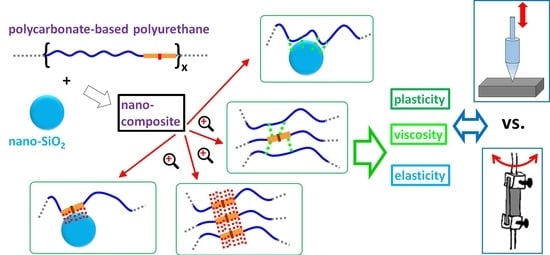
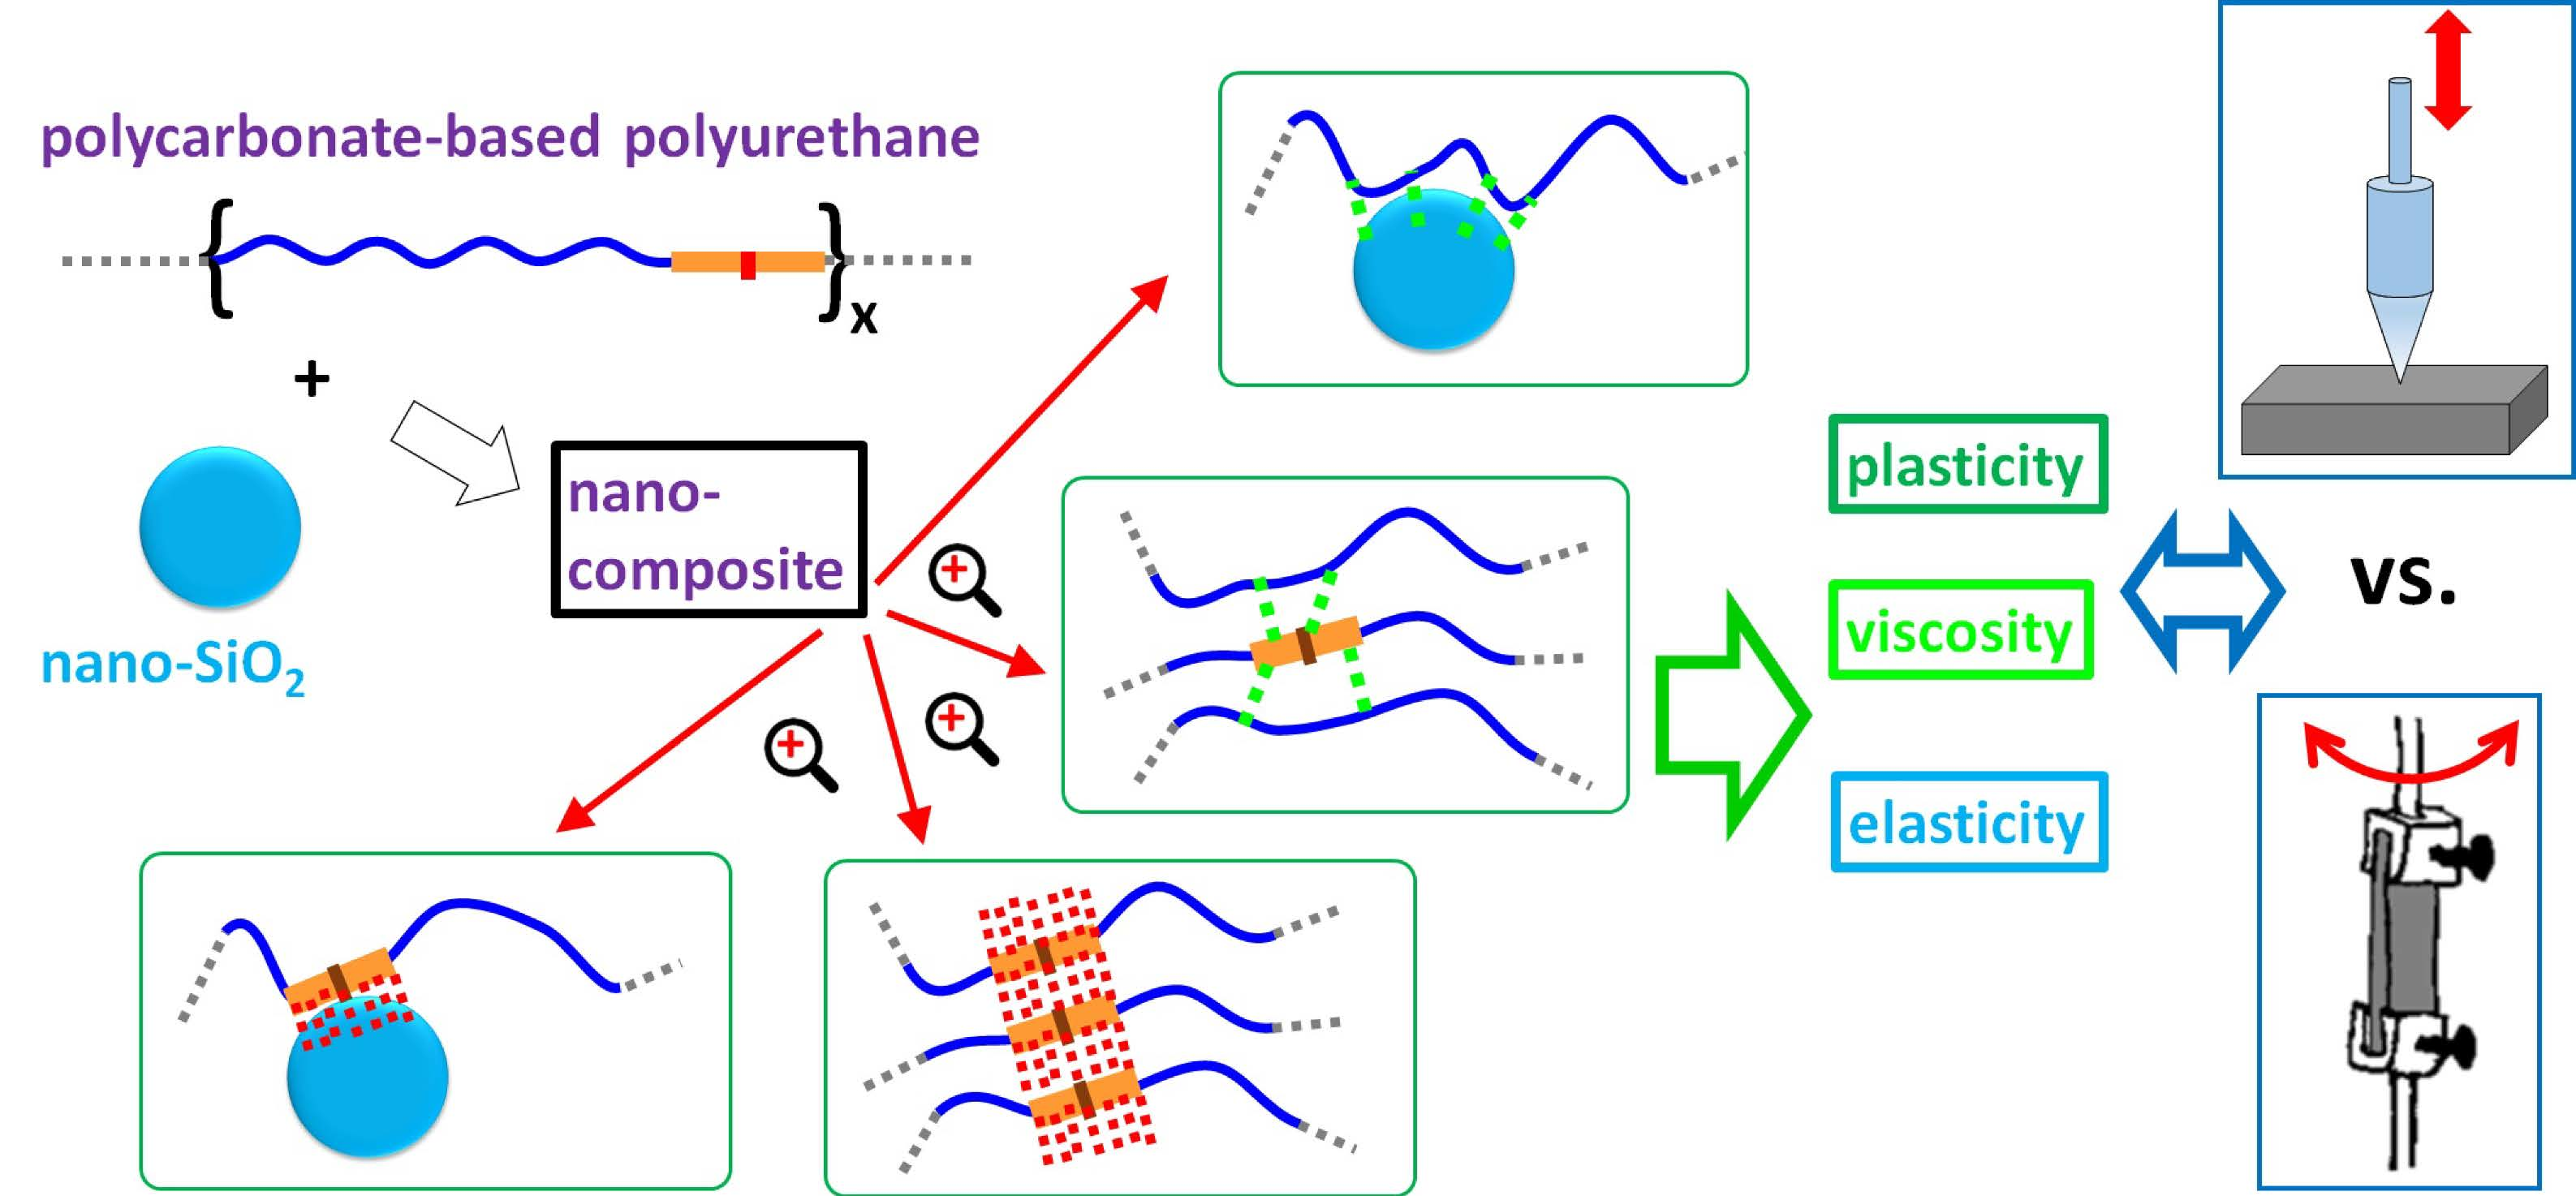
- We prepared a series of polymer nanocomposites with a (strongly hydrogen bonding) polycarbonate-based polyurethane matrix, reinforced by 0 to 40 wt% of monodisperse silica nano spheres; the nanocomposites were all formally in the rubbery state at room temperature, but their consistence varied from stiffer rubbery to semi-ceramic because of the filler effect.
- (2)
- We characterized the nanocomposites’ macromechanical properties using DMTA, and the micromechanical properties by microindentation hardness testing (MHI).
- (3)
- We compared the trends in elasticity and energy dissipation-related macro- and micromechanical properties.
2. Materials and Methods
2.1. Materials
2.2. Preparation of PUU/Silica Composites
2.2.1. Synthesis of Polyurethane-Urea Water Dispersions (PUUD)
- (1)
- Pre-polymerization: PCD type T5652, DMPA, HDI, and DBTDL catalyst (0.05 mol% DBTDL per mol of NCO) were mixed in acetone at 60 °C and 700 rpm for 5 h.
- (2)
- Ionization via neutralization of the carboxylic groups in DMPA by adding triethylamine (TEA) to the acetone solution and mixing at 55 °C for 30 min.
- (3)
- Emulsification via gradual addition of water (water also reacts with the remaining NCO groups and thus connects the original polymer chains by newly formed urea, and eventually biuret groups). Finally, acetone was removed under reduced pressure and a purely waterborne PUUD, containing 30 ± 1 wt% of organic latex particles was obtained.
2.2.2. Nanocomposite (PU/SiO2) Preparation via Solution Blending and Drying
2.3. Characterization of the Prepared PUU/Silica Nanocomposites
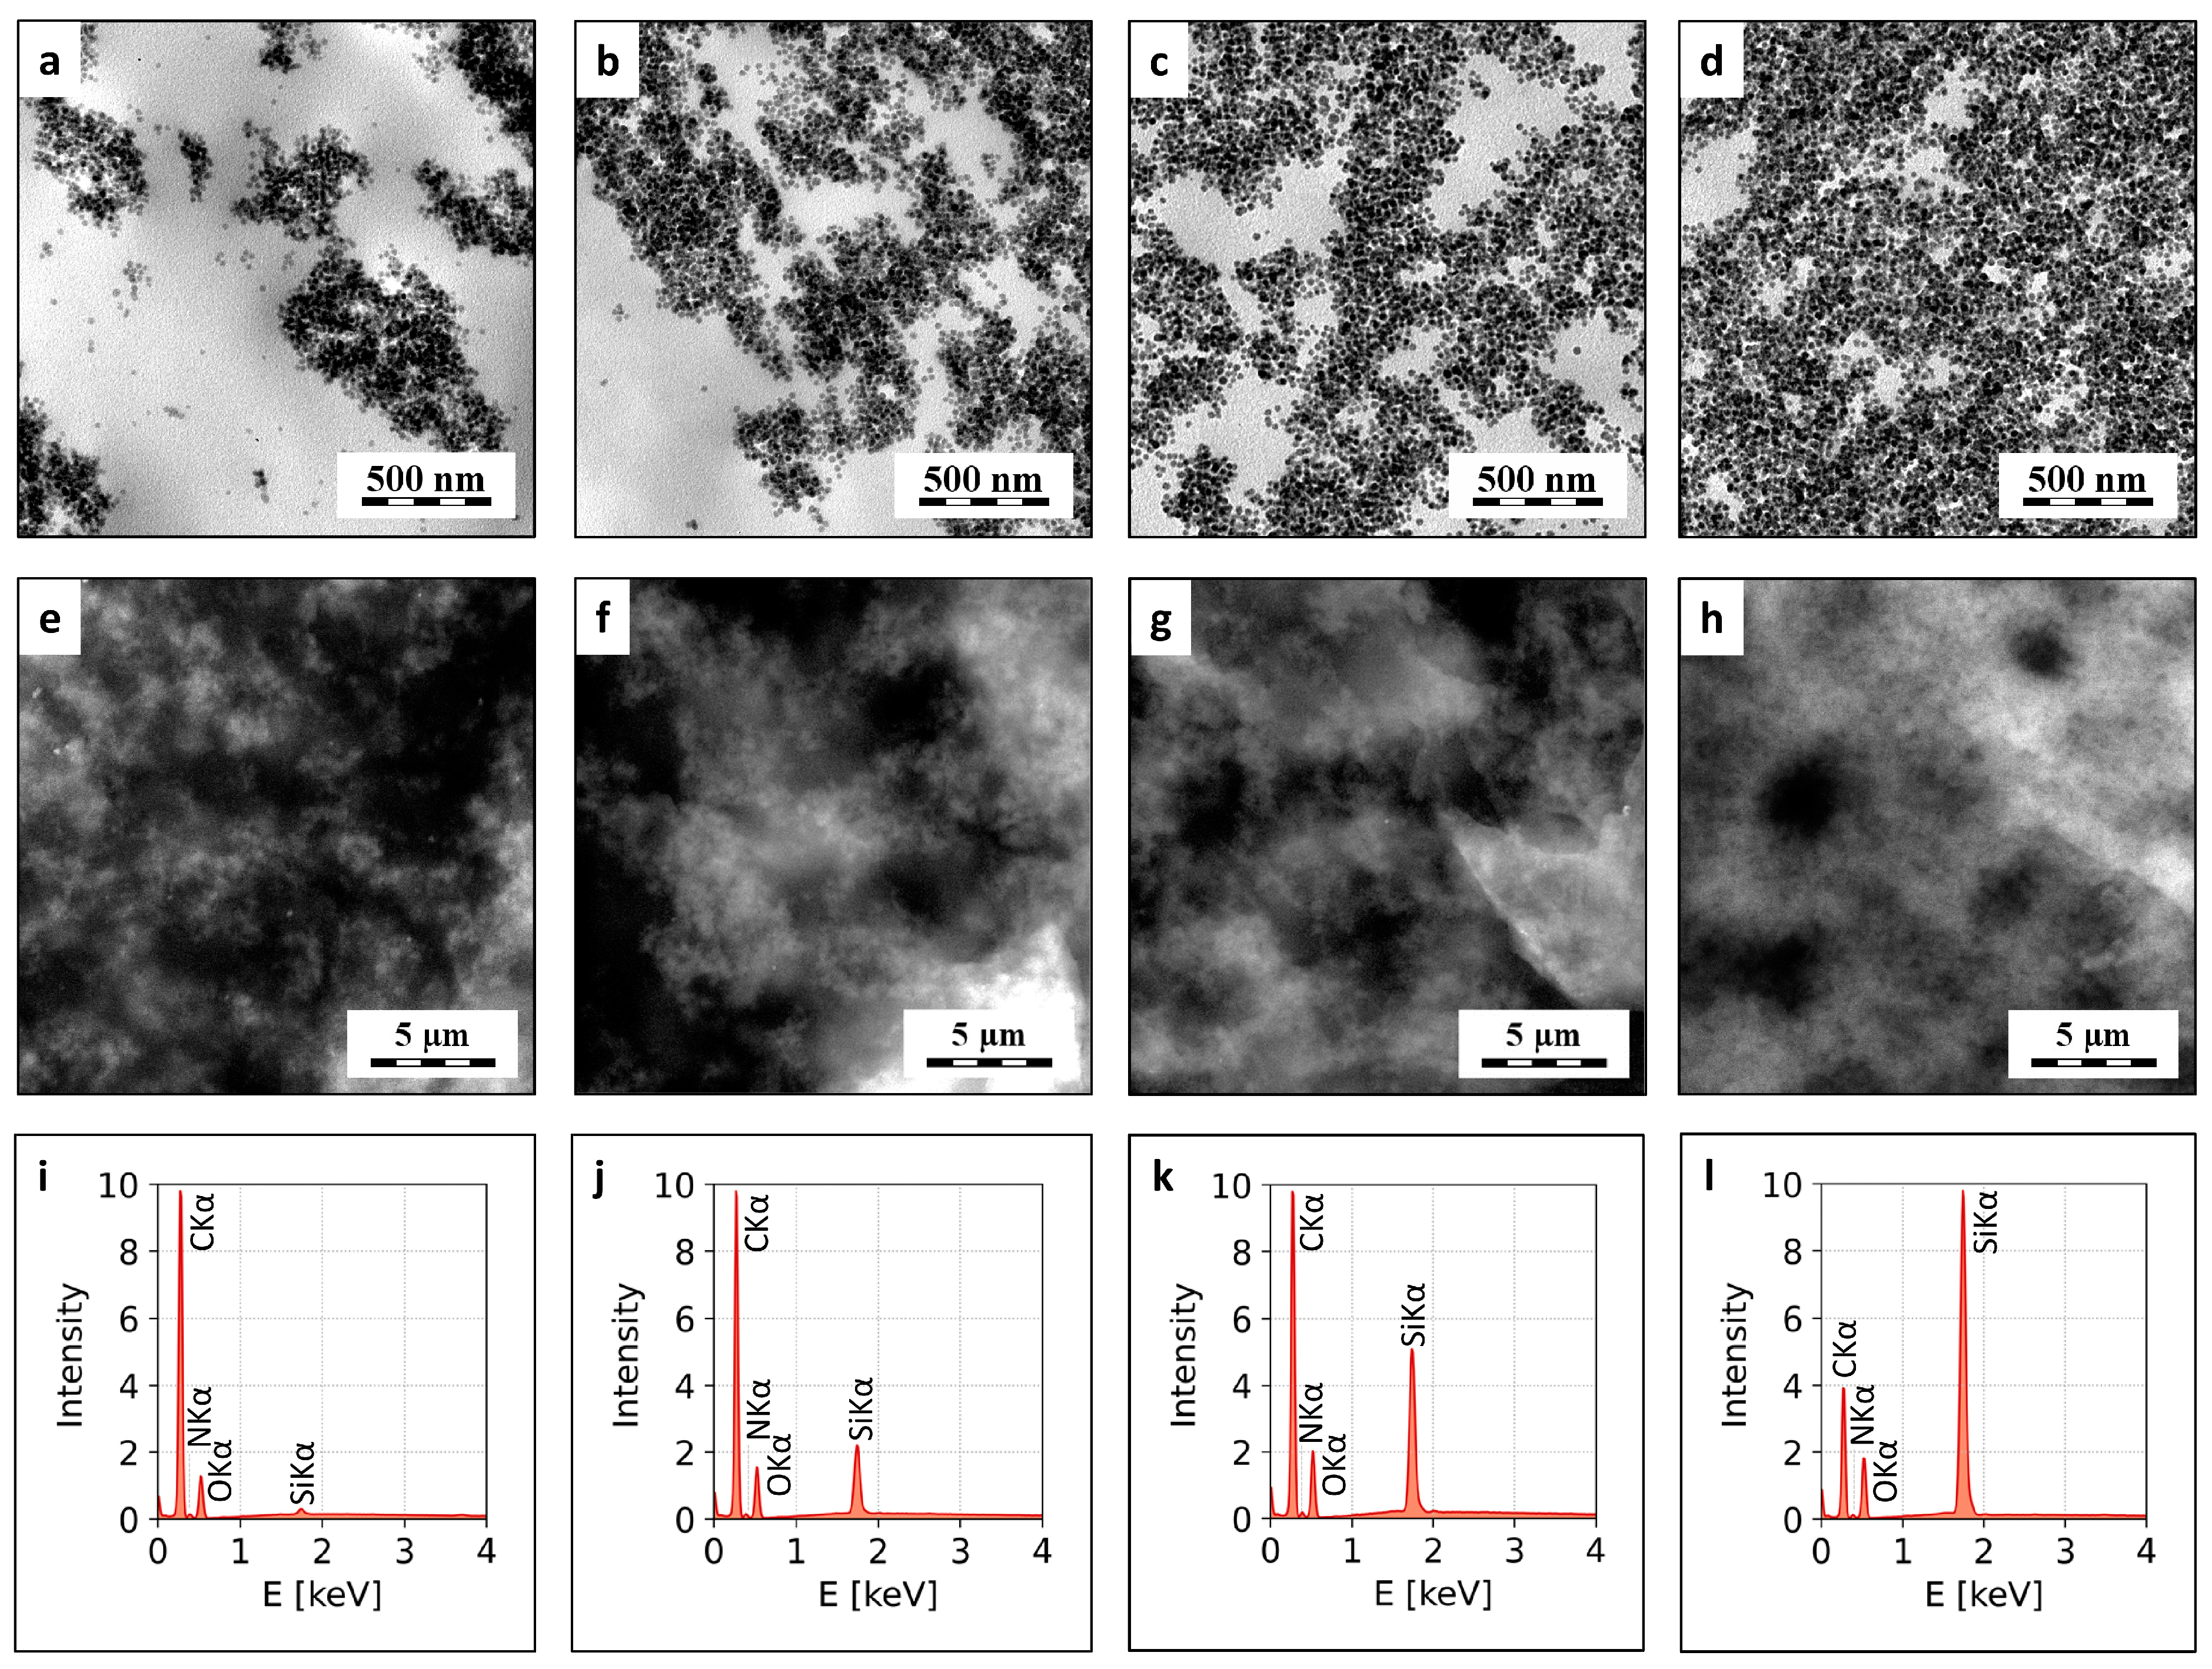
2.3.1. Electron Microscopy
2.3.2. Dynamic Mechanical Thermal Analysis (DMTA)
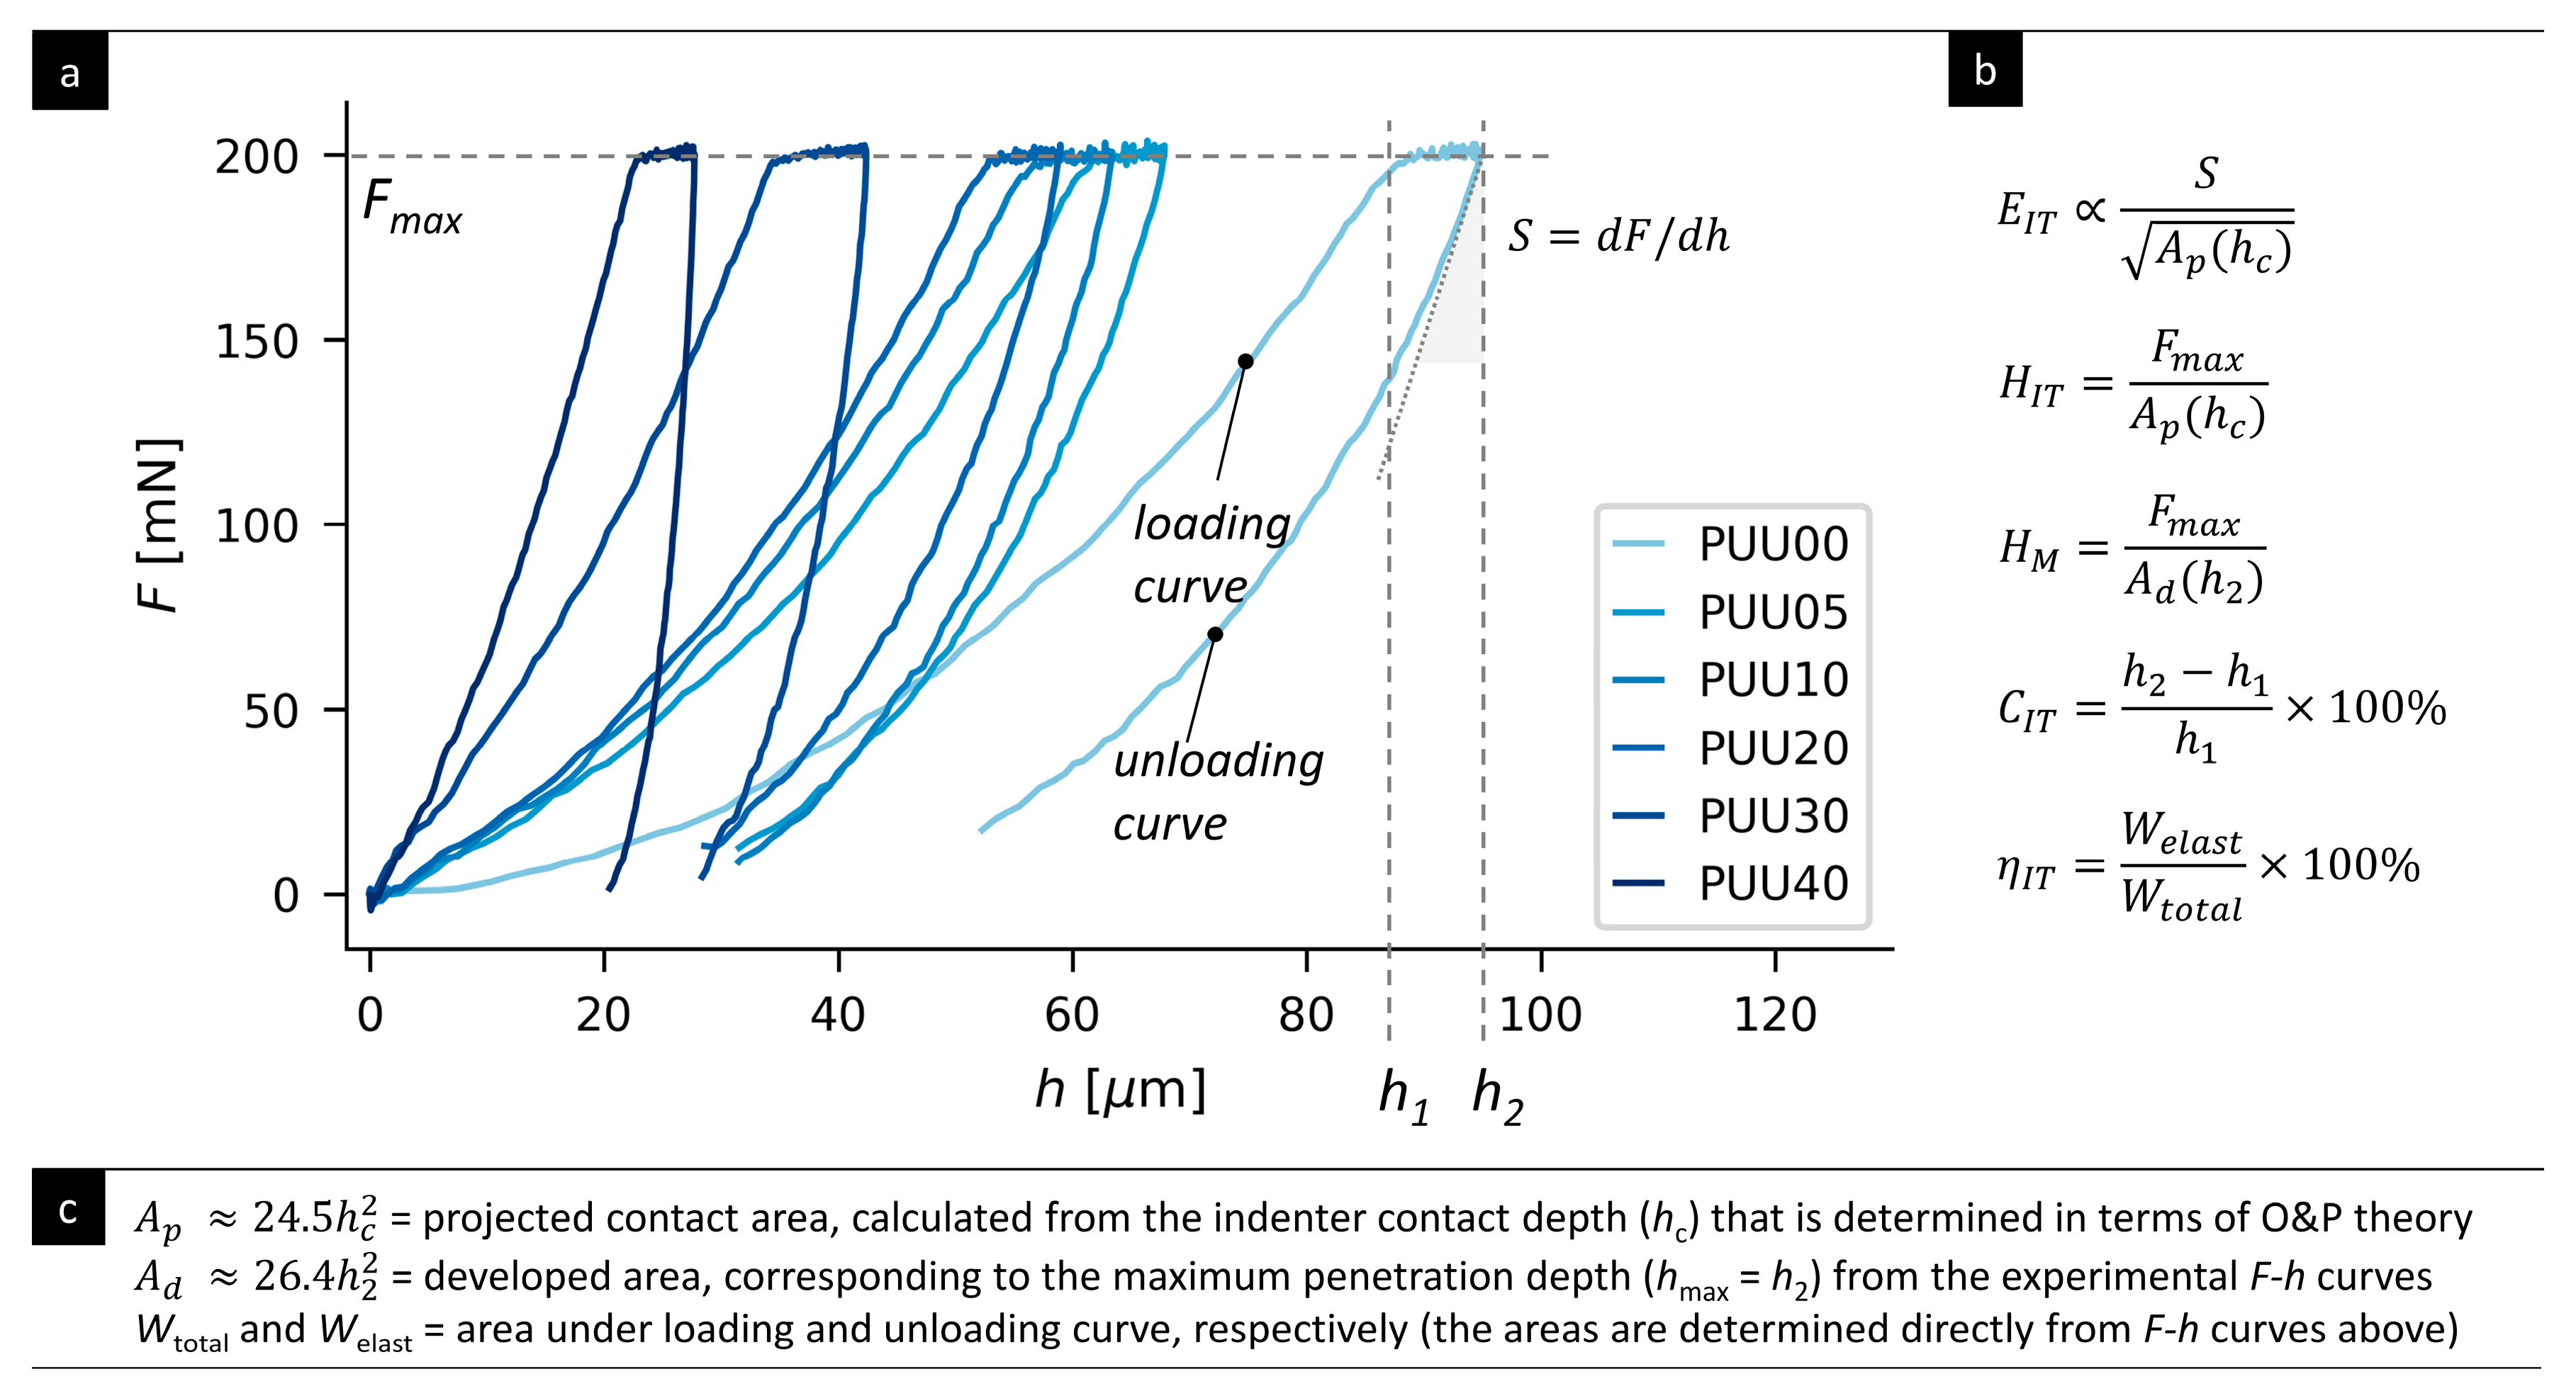
2.3.3. Microindentation Hardness Testing
3. Results
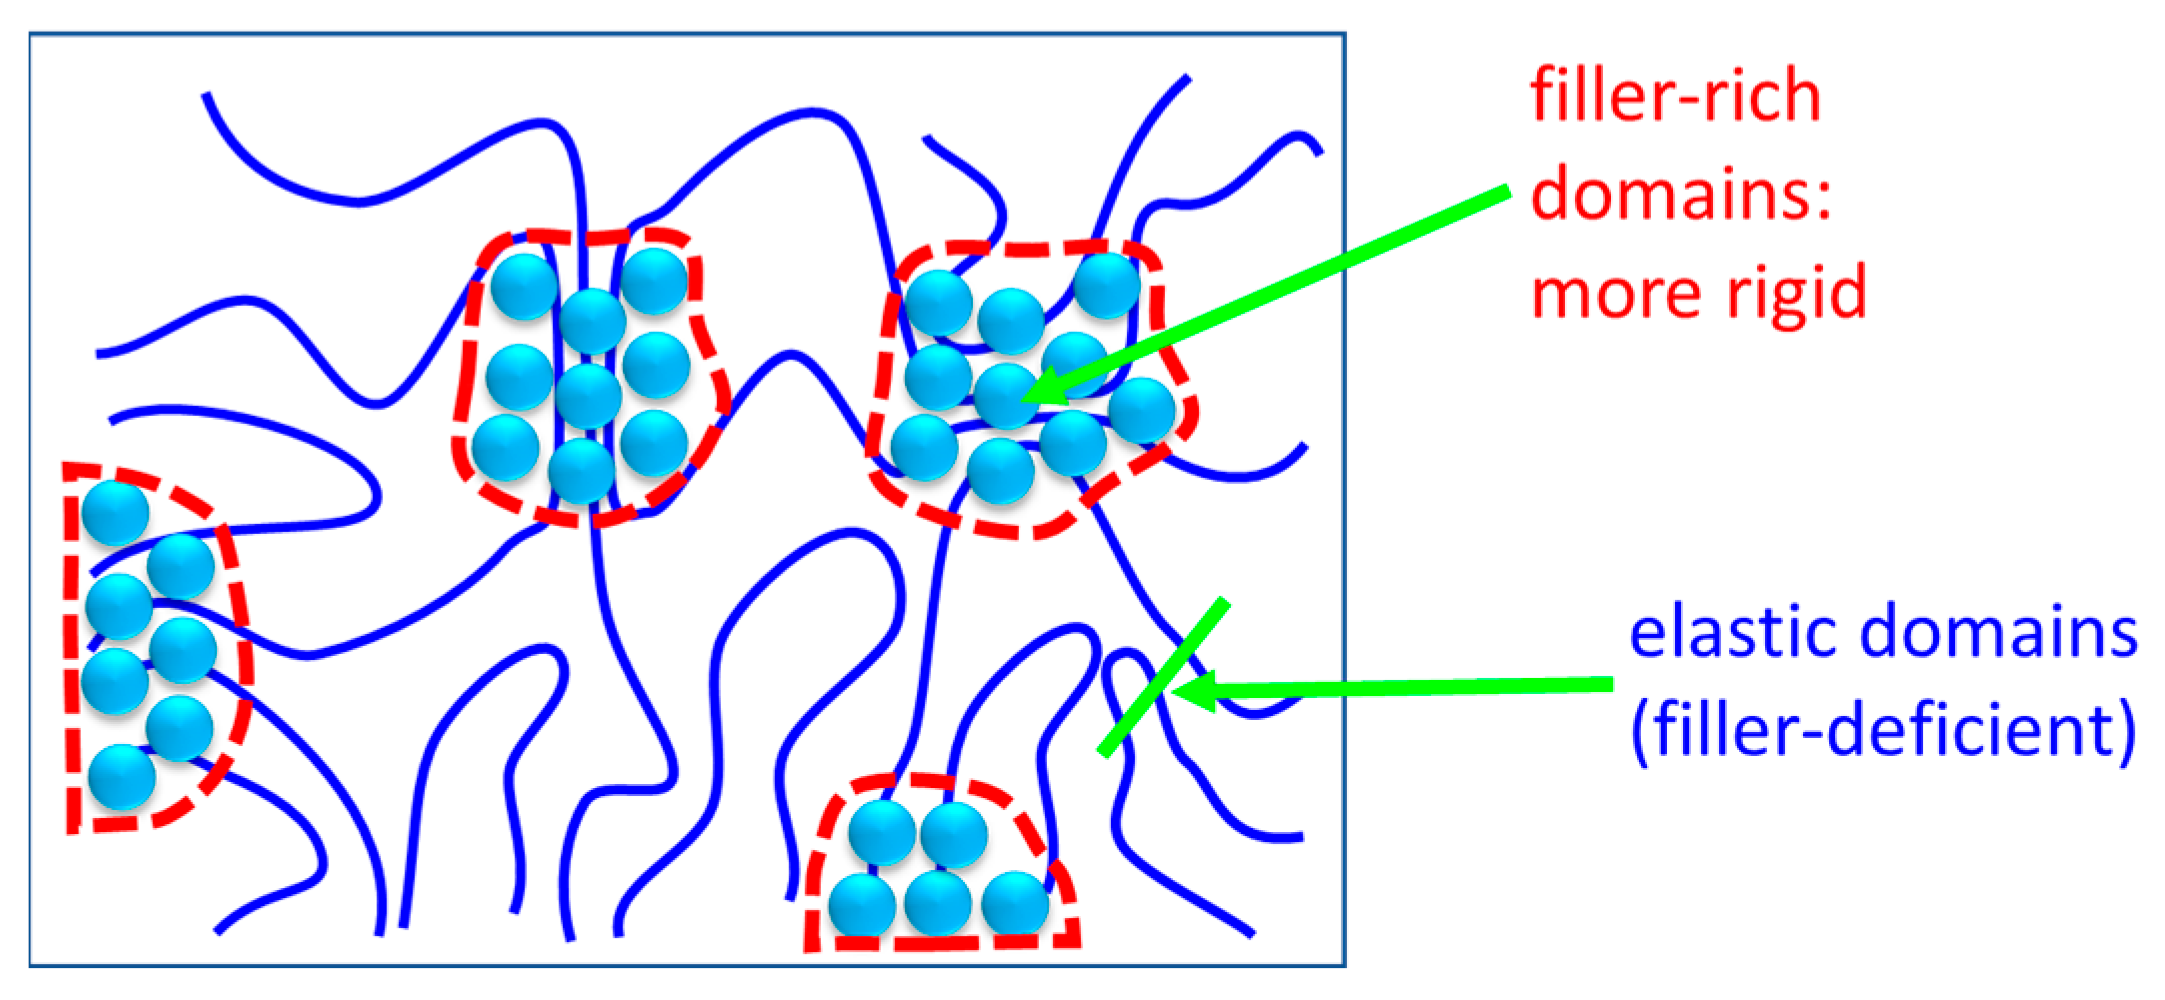
3.1. Morphology
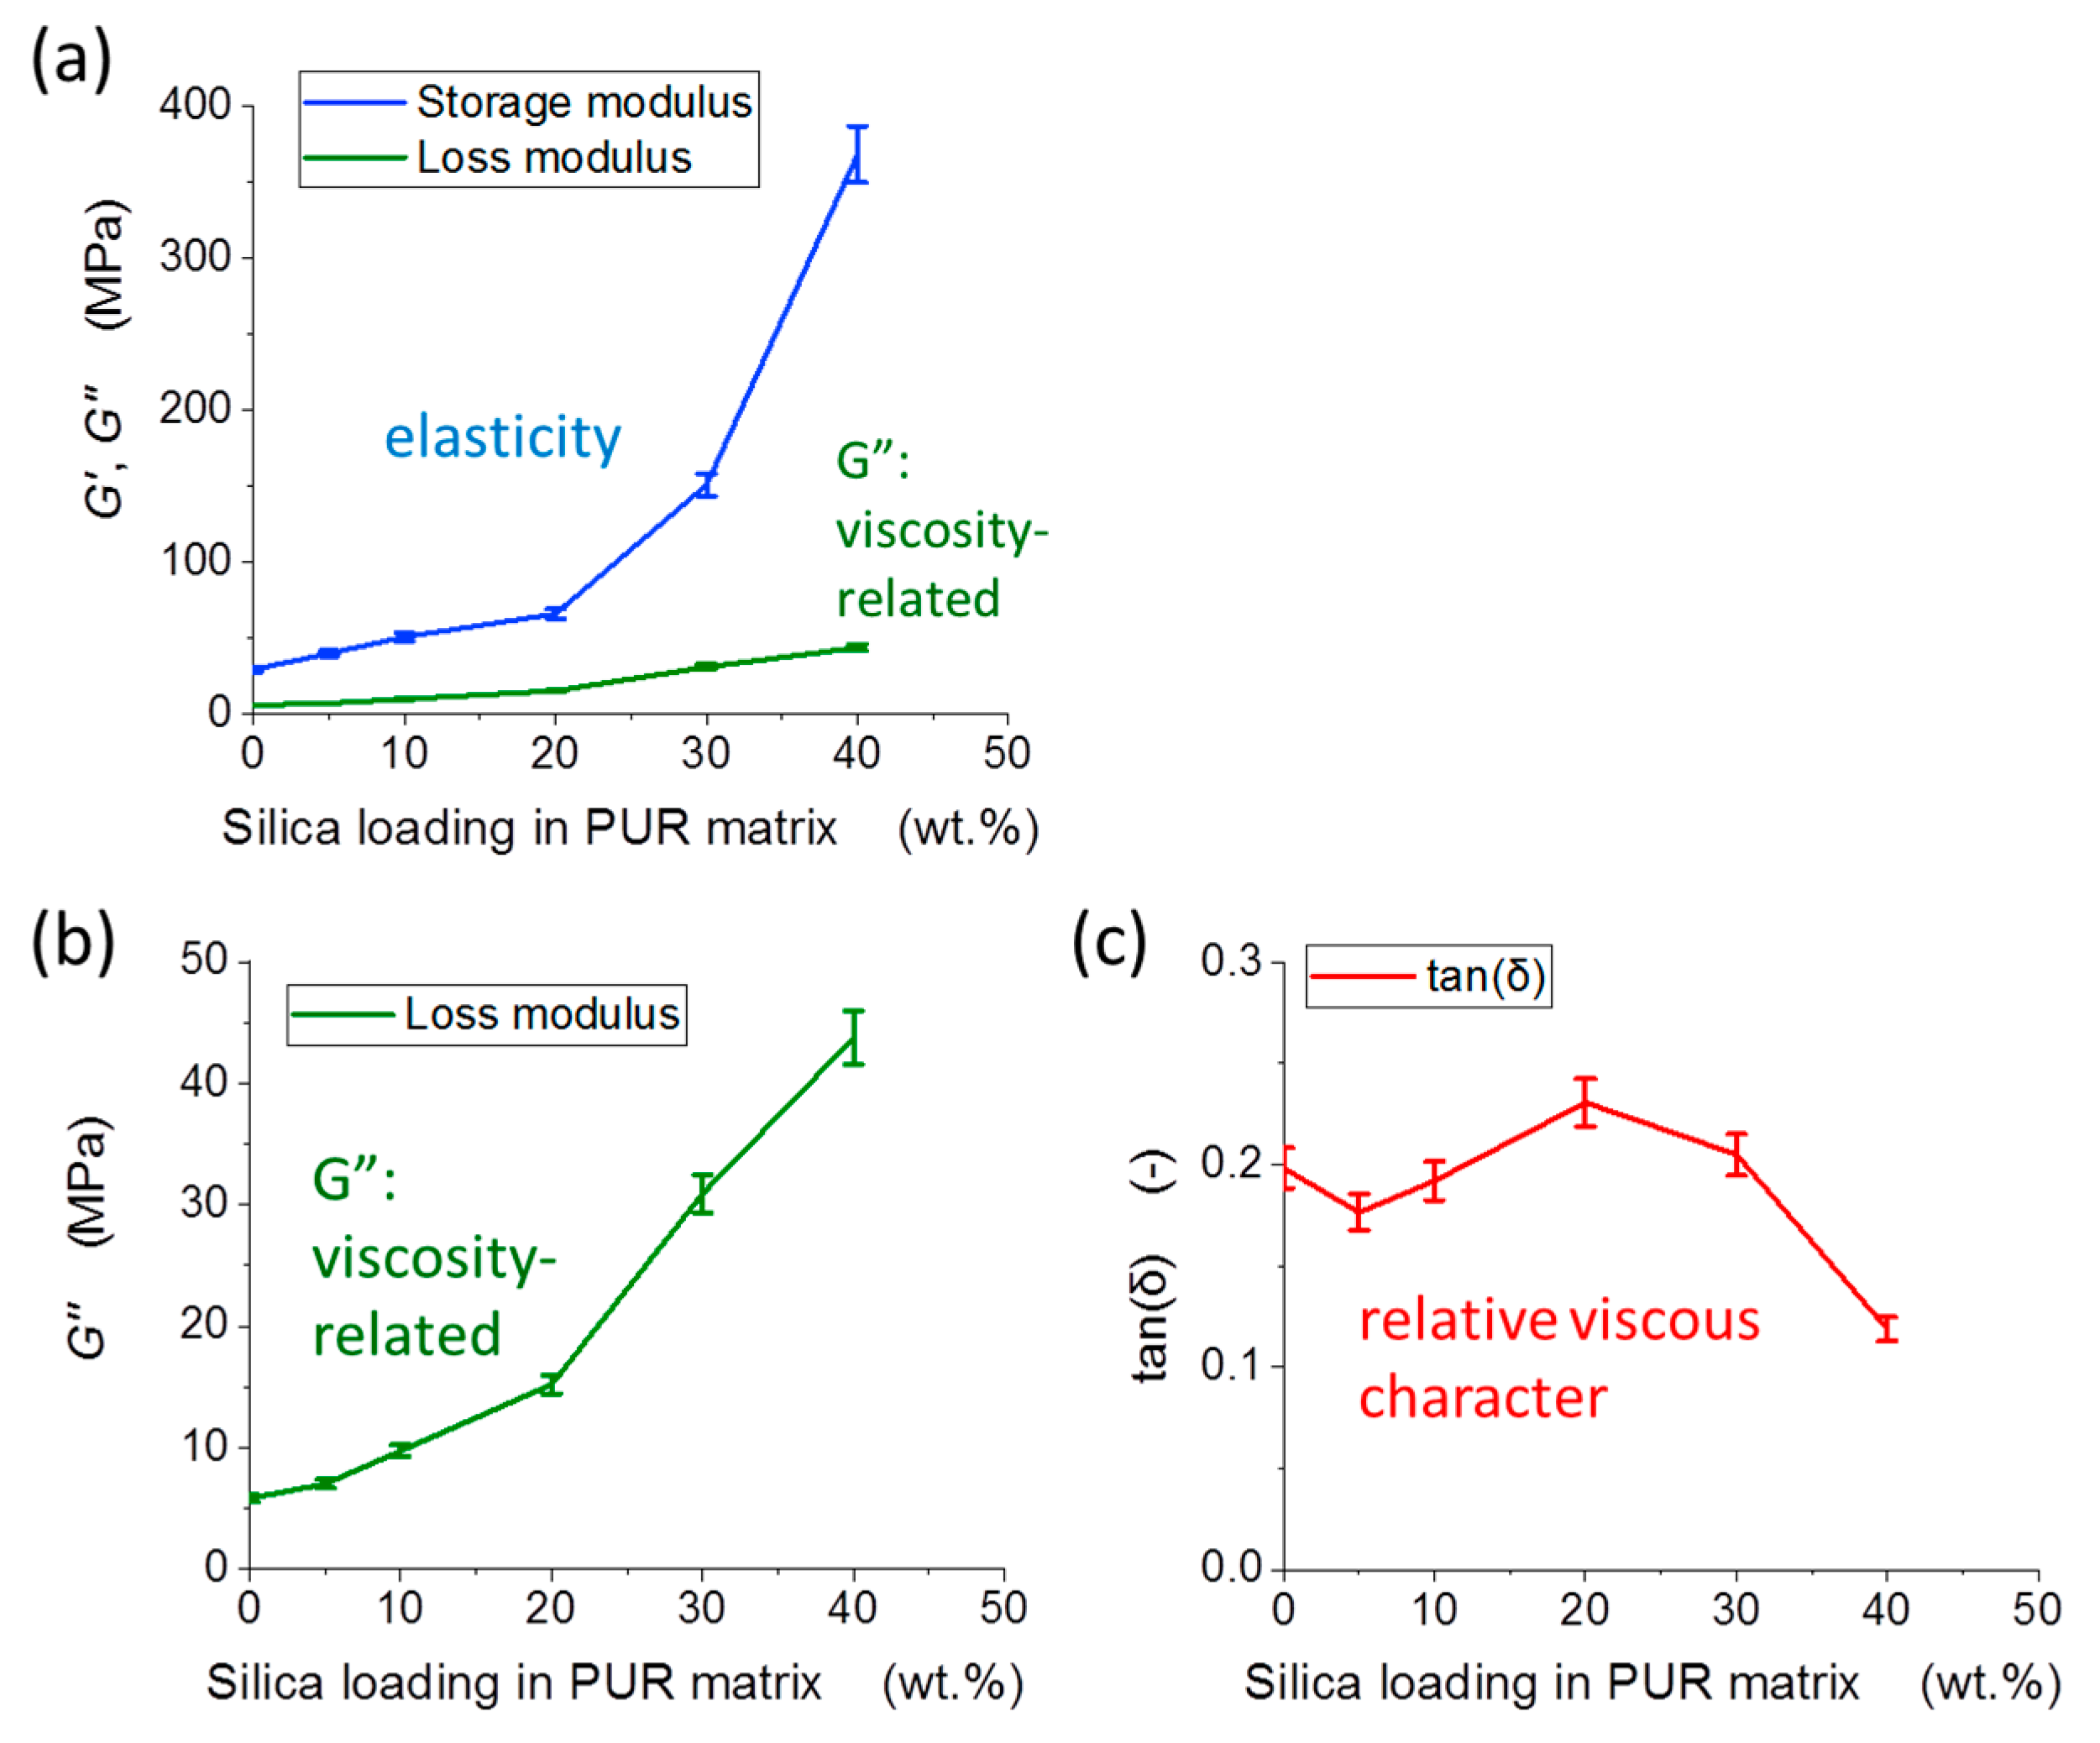
3.2. DMTA: Macromechanical Properties
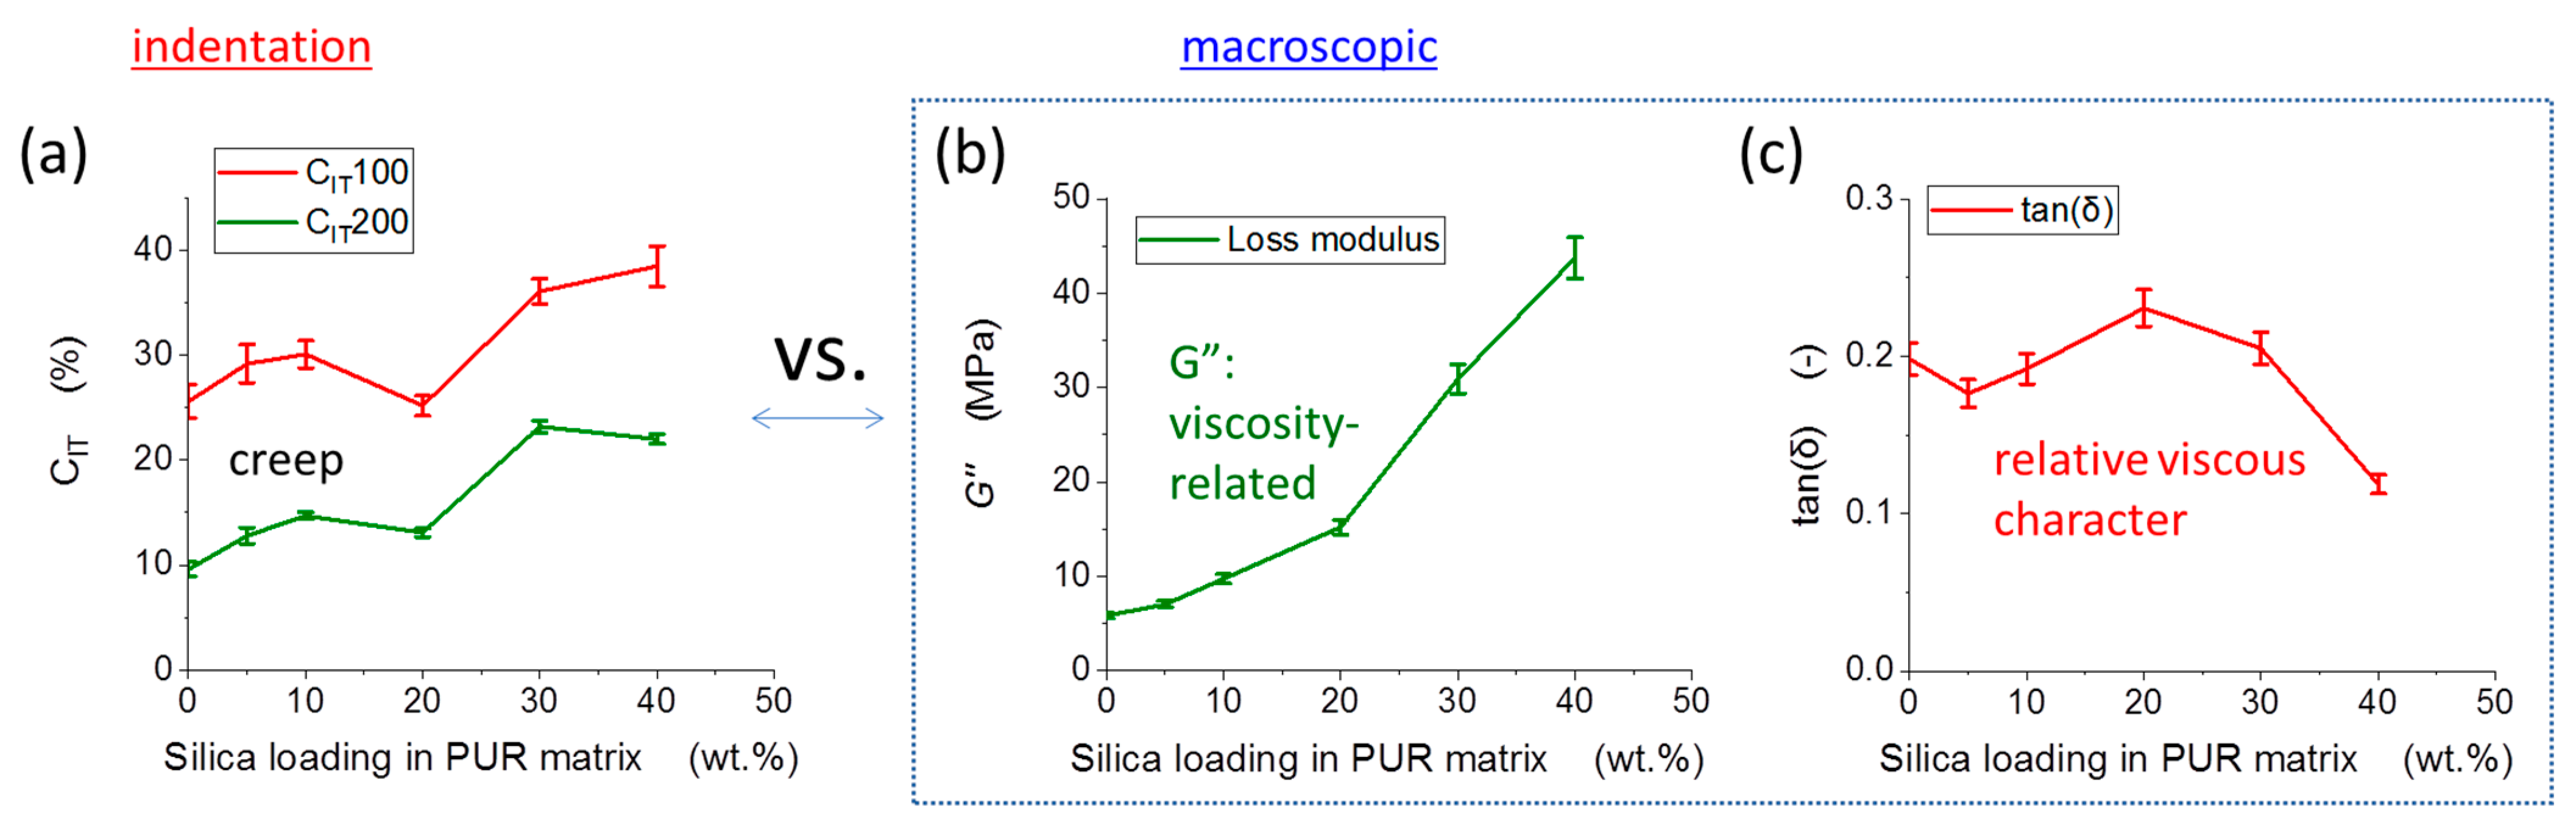
3.3. Indentation Testing: Micromechanical Properties
4. Discussion
4.1. Interactions in the Nanocomposites
4.1.1. Neat matrix: Hydrogen Bonding between Segments
4.1.2. Filler–Matrix Hydrogen Bonding
4.2. Correlations among Structure, Macro- and Micromechanical Properties
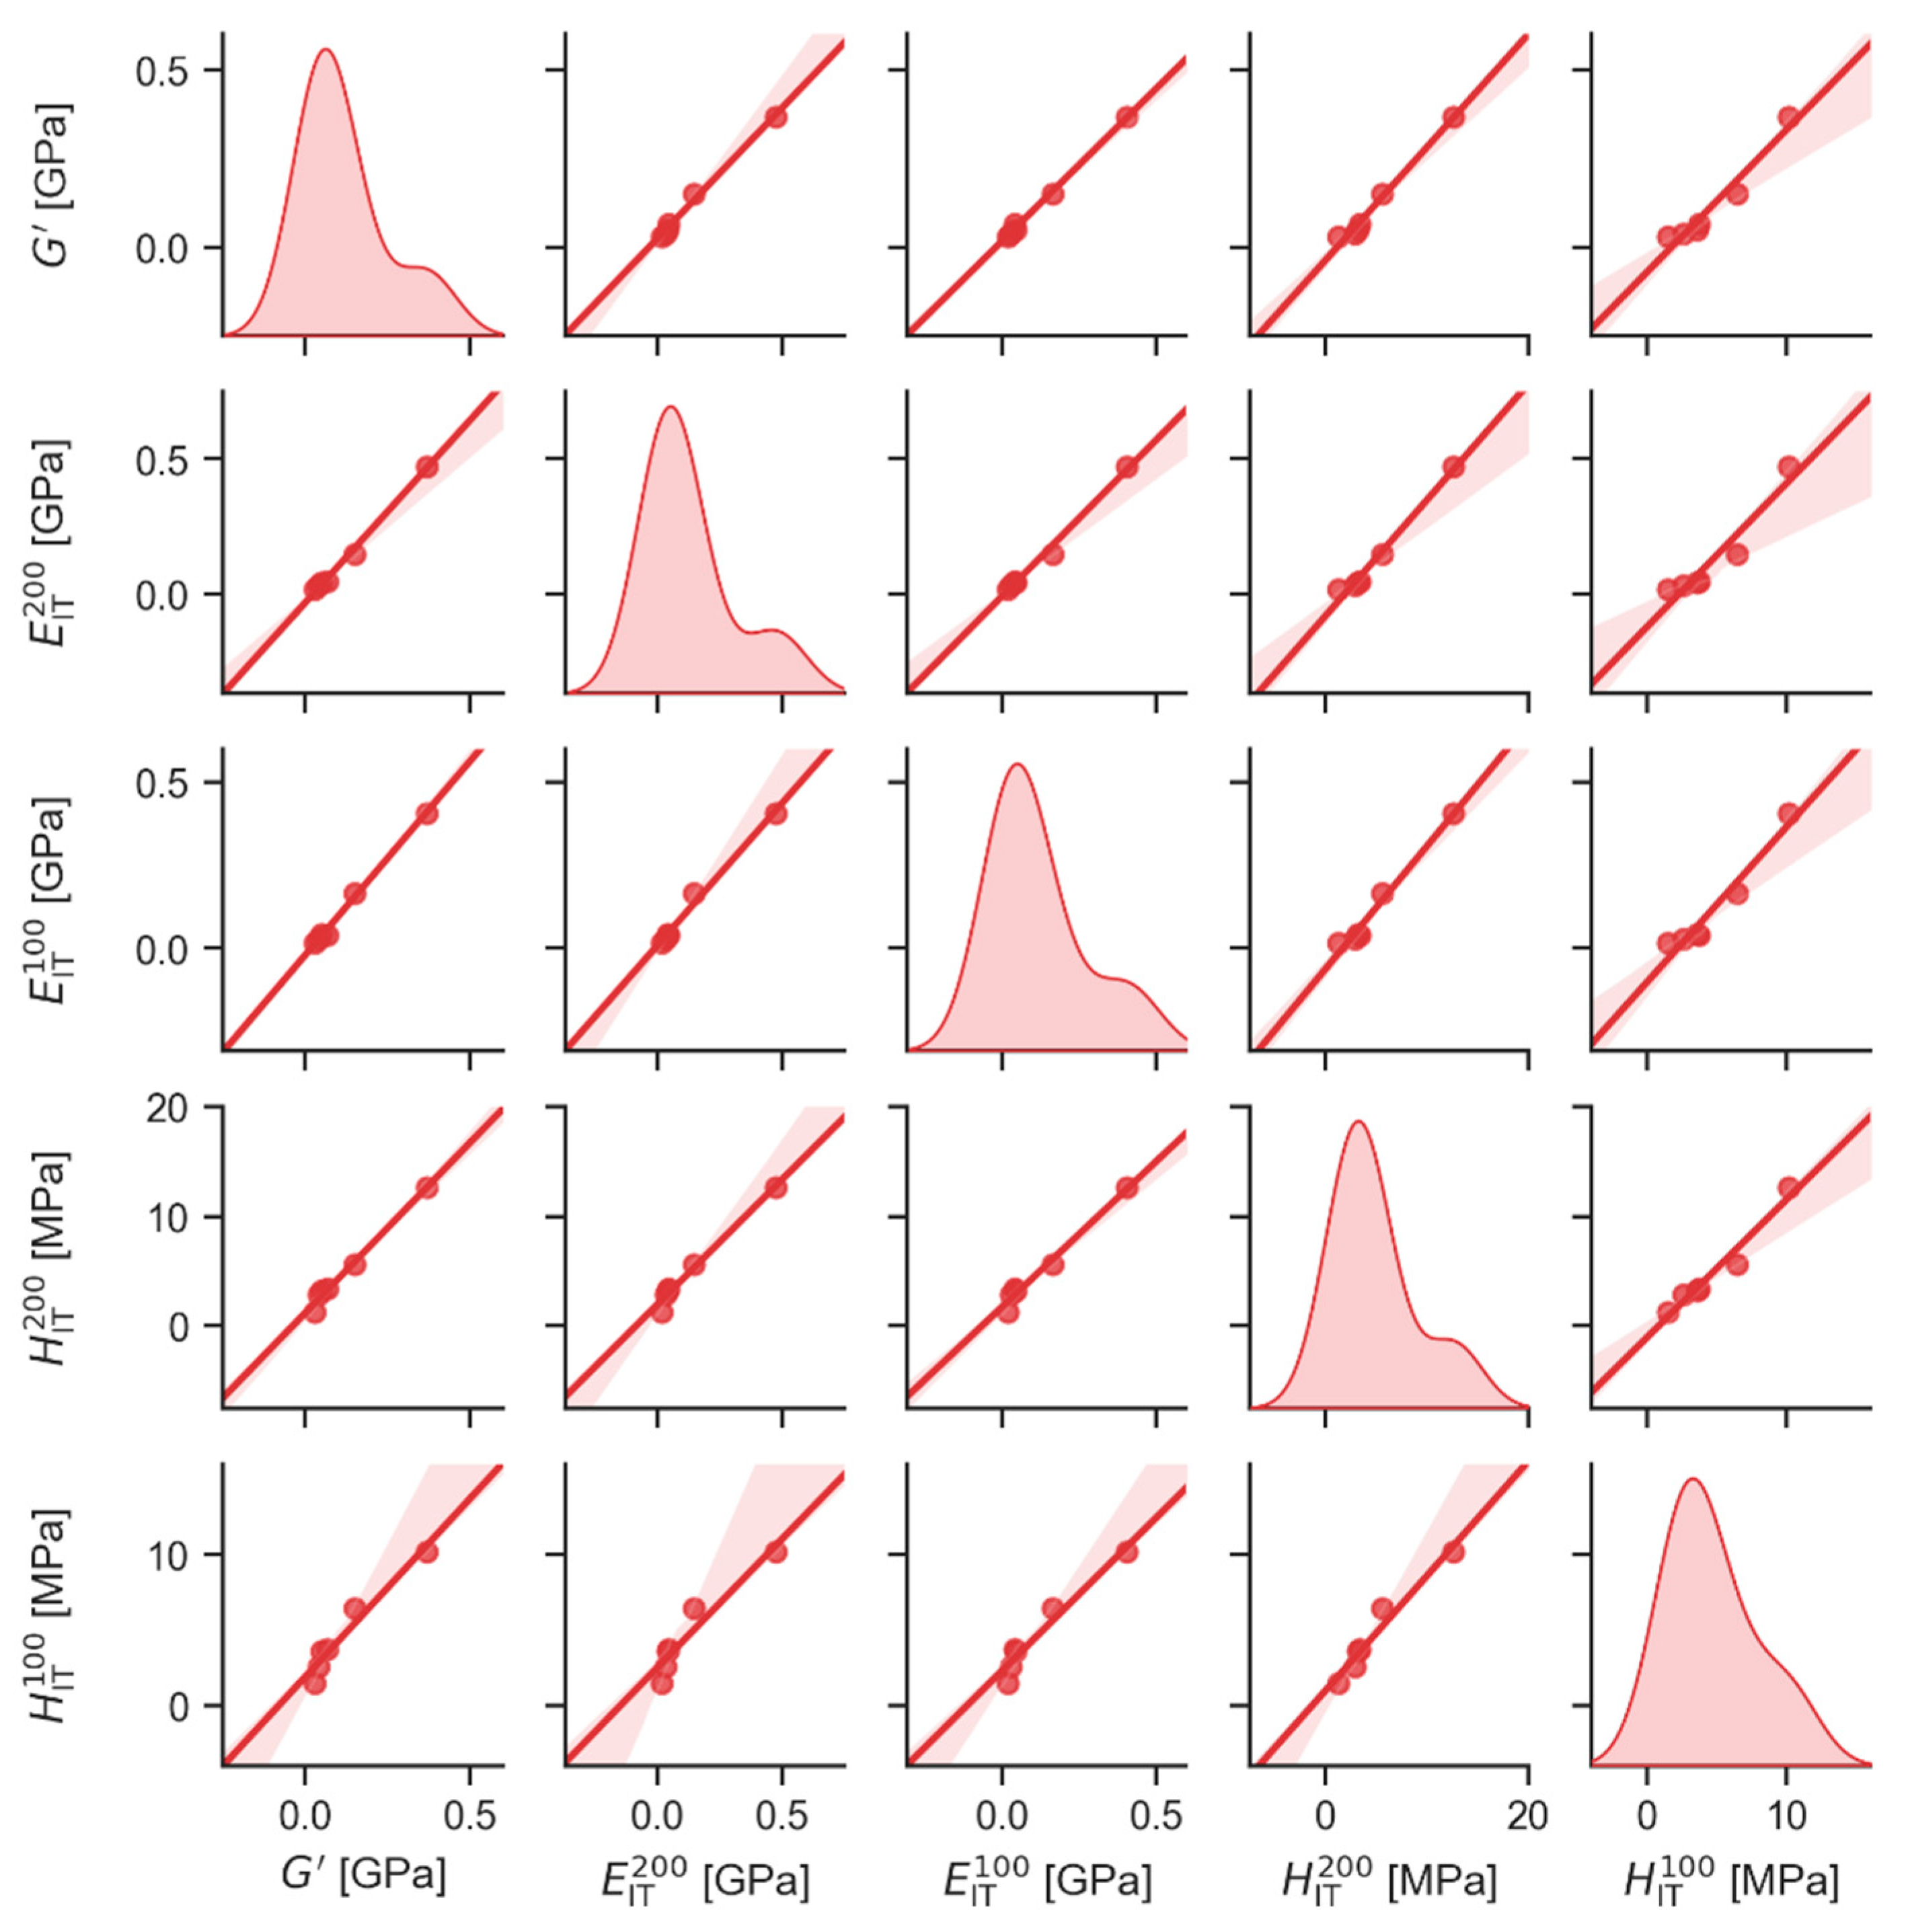
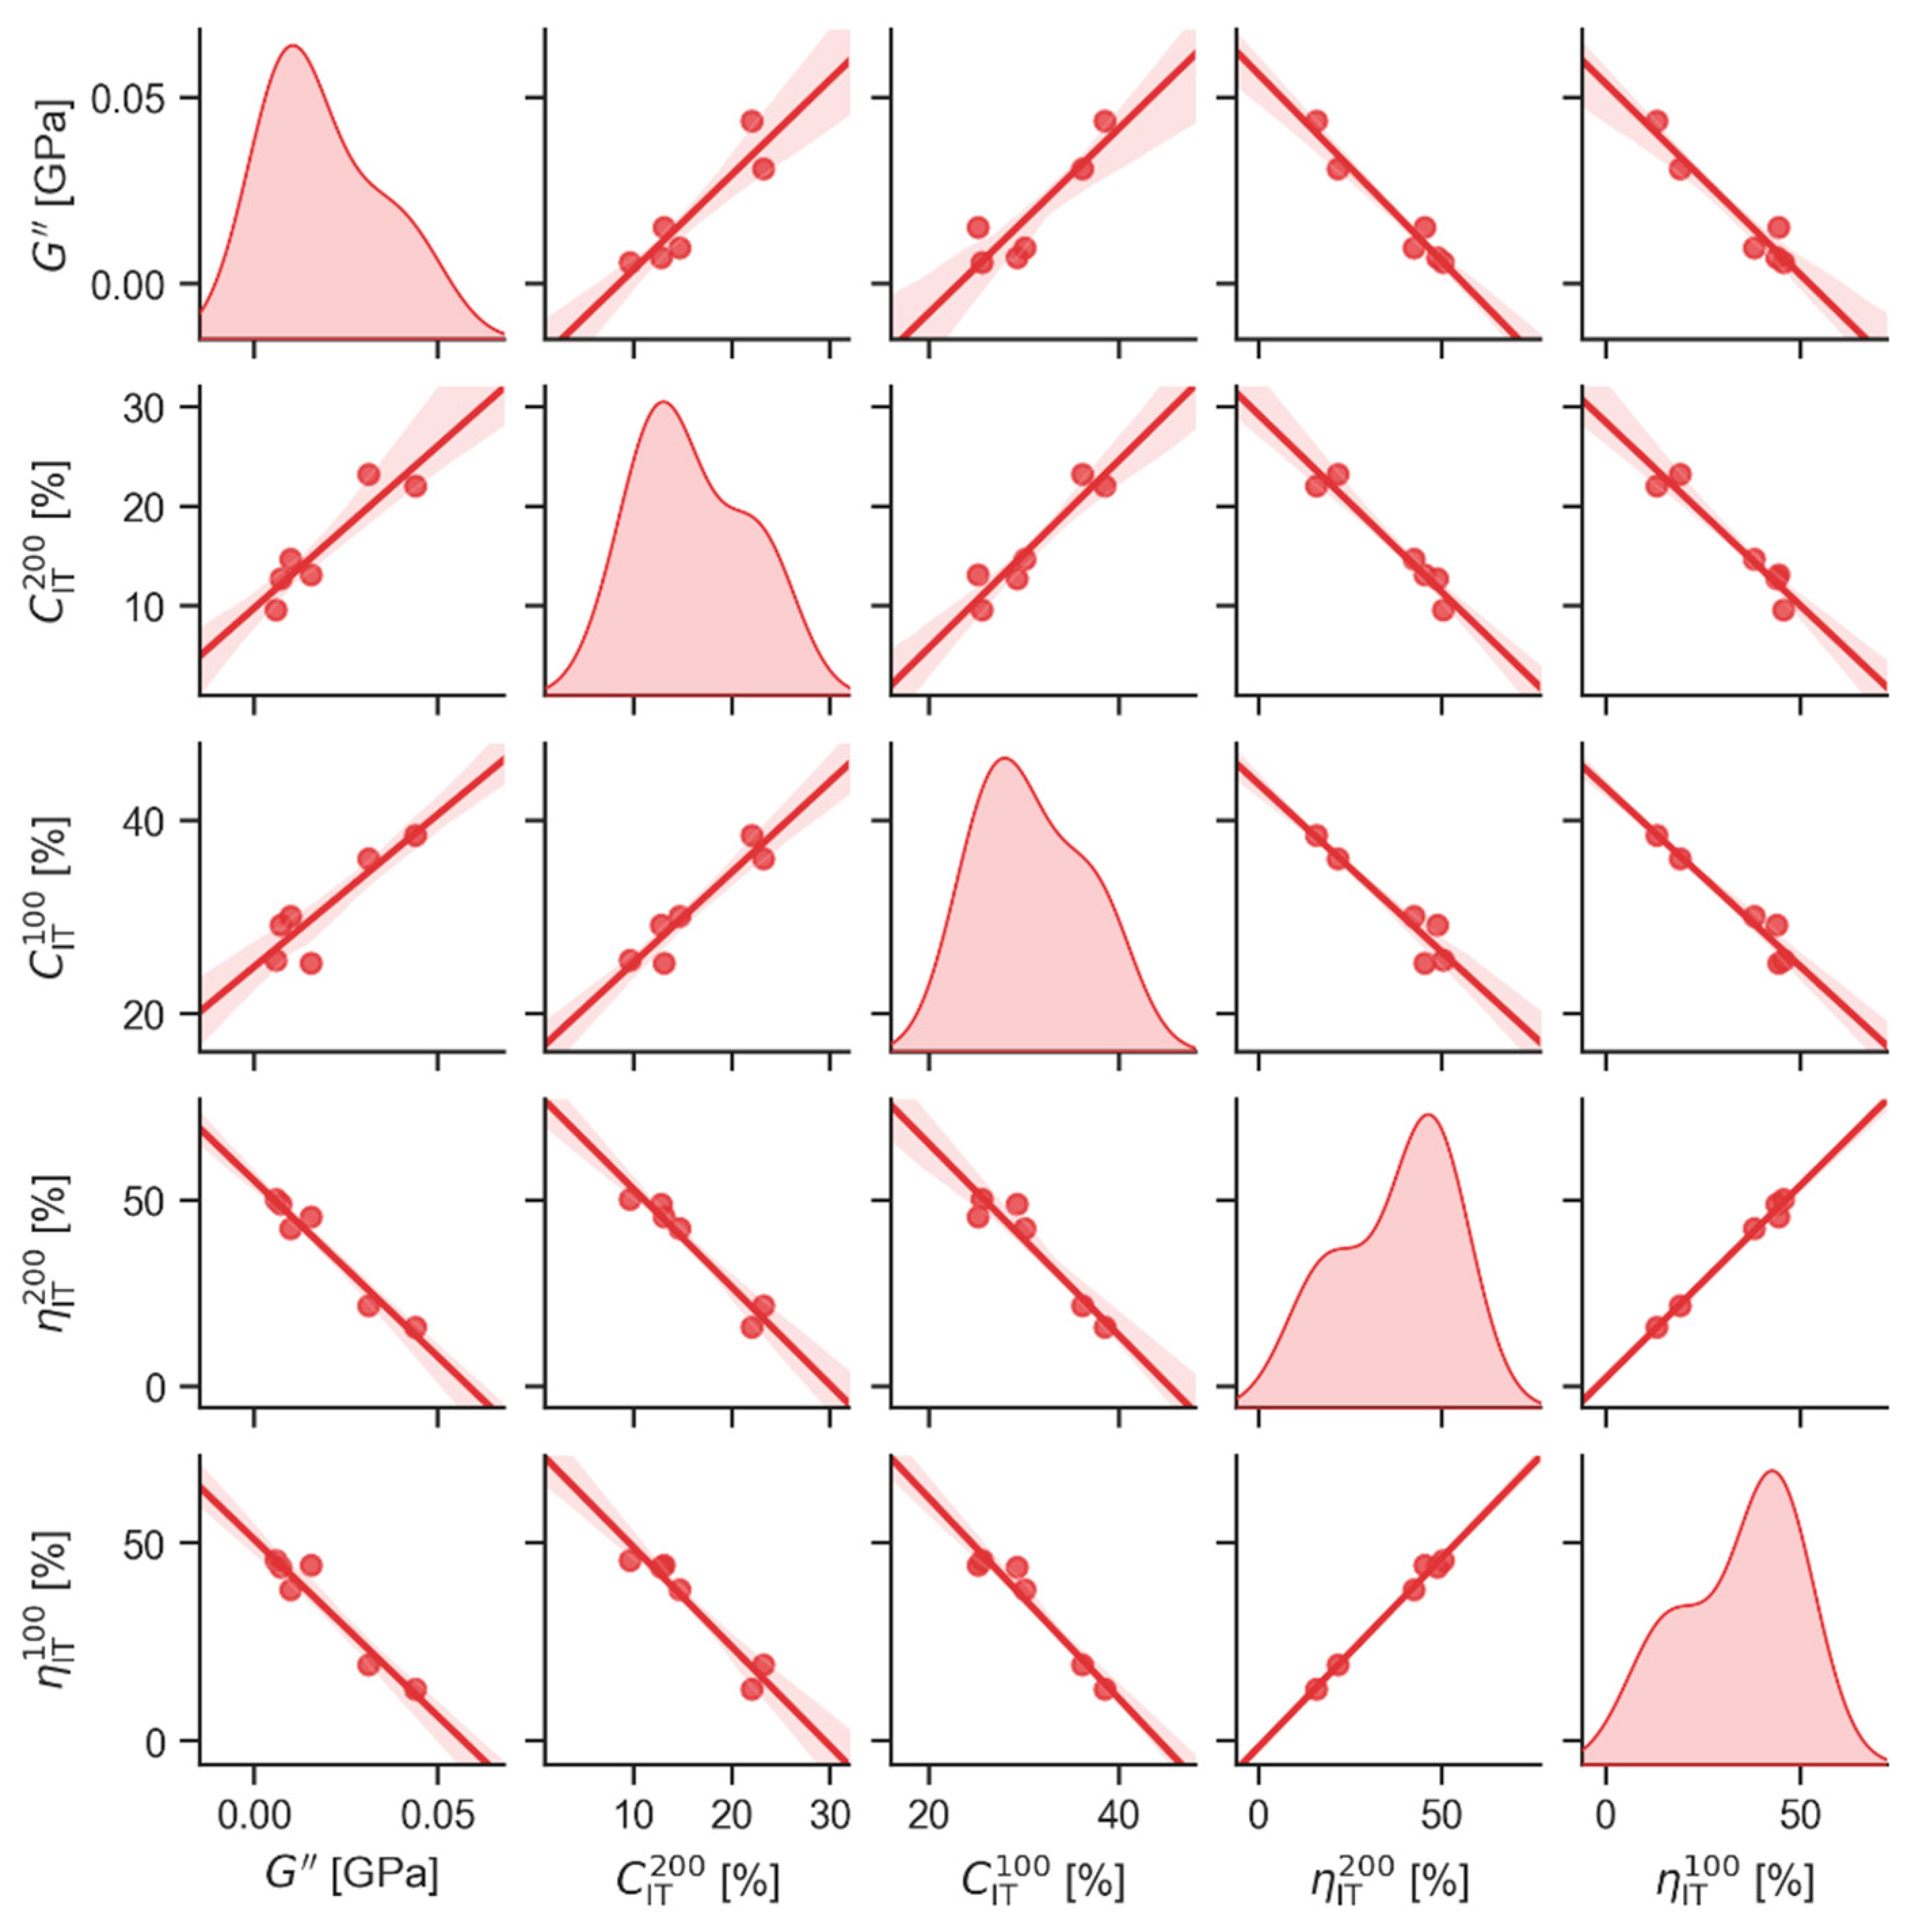
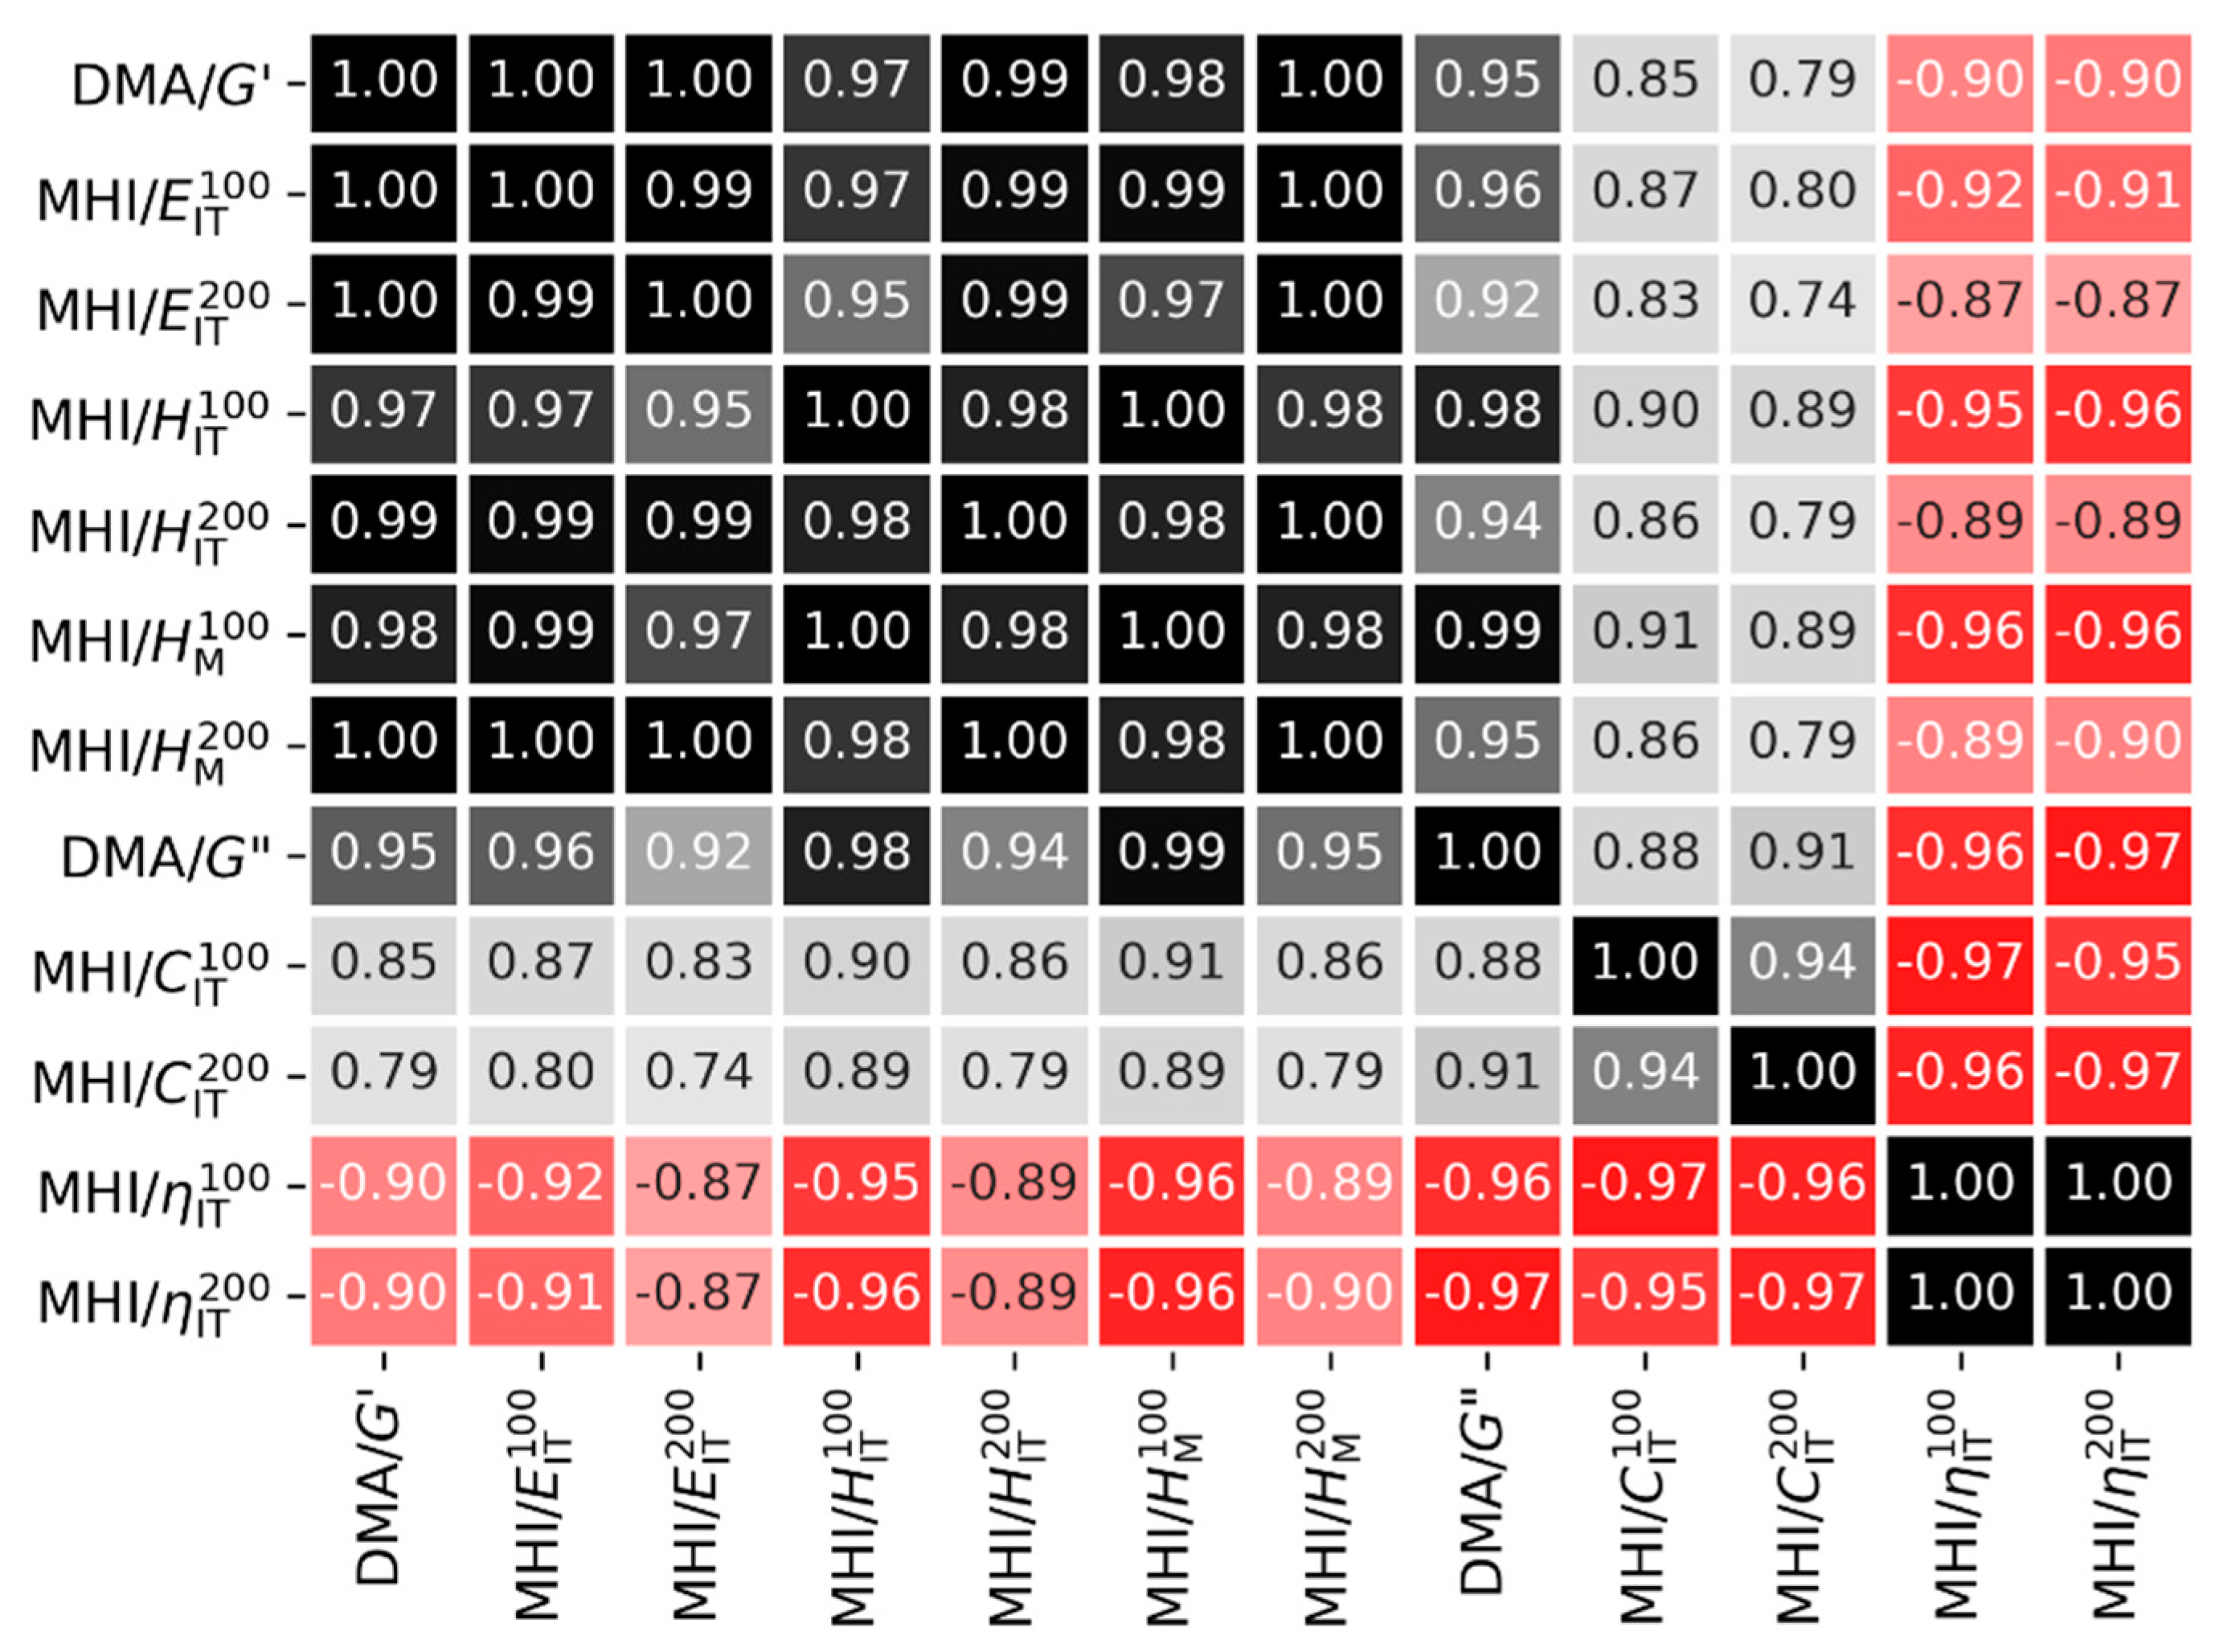
4.2.1. Statistical Correlations between Macro- and Micromechanical Properties
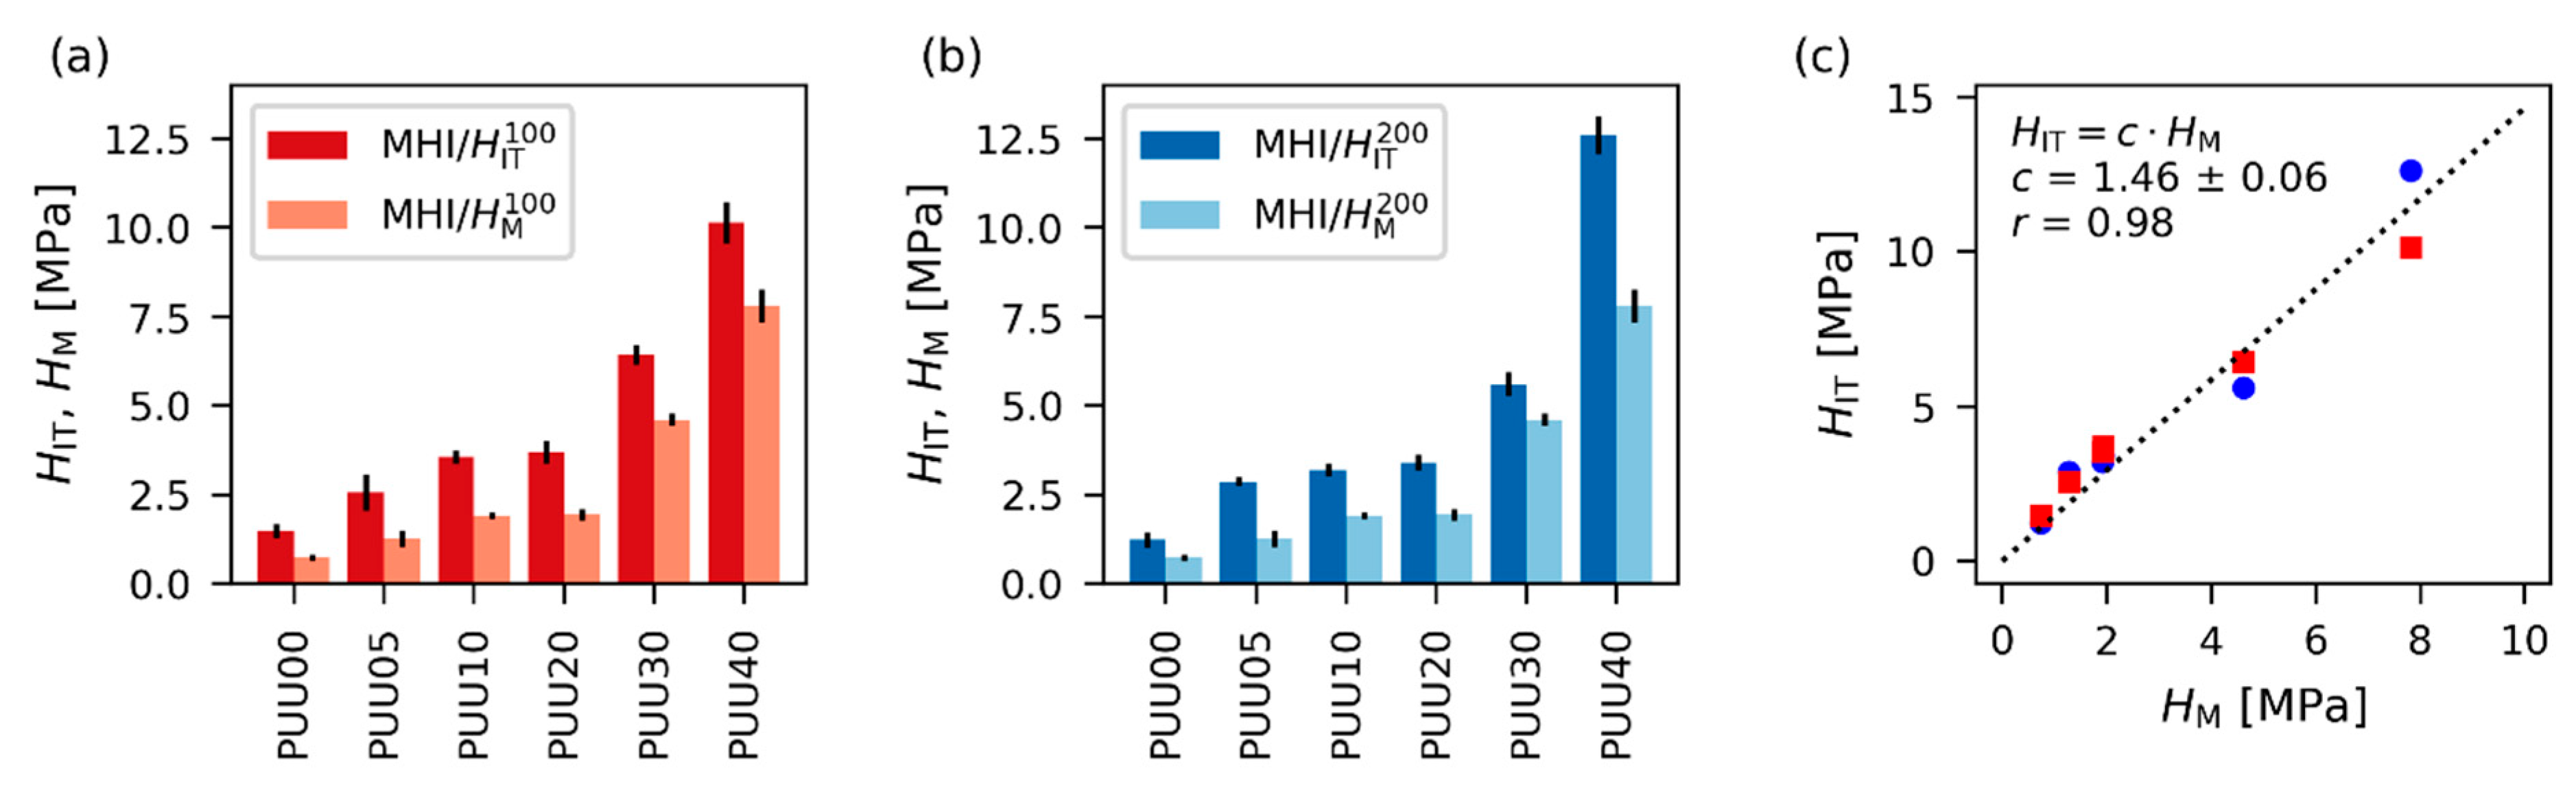
4.2.2. Differences between Indentation Hardness and Universal Hardness
4.2.3. Macroscopic Thermo-Mechanical Properties (DMTA): Effects of Structure and Morphology
4.2.4. Elastic Properties: Trends and Differences in Micro vs. Macroscopic Tests
4.2.5. Energy-Dissipation-Related Properties: Trends and Differences in Micro vs. Macroscopic Tests
5. Conclusions
Supplementary Materials
Author Contributions
Funding
Institutional Review Board Statement
Informed Consent Statement
Data Availability Statement
Conflicts of Interest
References
- Spirkova, M.; Pavlicevic, J.; Costumbre, Y.A.; Hodan, J.; Krejcikova, S.; Brozova, L. Novel waterborne poly(urethane-urea)/silica nanocomposites. Polym. Compos. 2020, 41, 4031–4042. [Google Scholar] [CrossRef]
- Slouf, M.; Strachota, B.; Strachota, A.; Gajdosova, V.; Bertschova, V.; Nohava, J. Macro-, micro- and nanomechanical characterization of crosslinked polymers with very broad range of mechanical properties. Polymers 2020, 12, 2951. [Google Scholar] [CrossRef] [PubMed]
- Slouf, M.; Arevalo, S.; Vlkova, H.; Gajdosova, V.; Kralik, V.; Pruitt, L. Comparison of macro-, micro- and nanomechanical properties of clinically-relevant UHMWPE formulations. J. Mech. Behav. Biomed. Mater. 2021, 120, 104205. [Google Scholar] [CrossRef]
- Sonnenschein, M.F. Polyurethanes: Science, Technology, Markets and Trends, 1st ed.; John Wiley & Sons: New York, NY, USA, 2015; ISBN 978-1118737835. [Google Scholar]
- Szycher, M. Szycher’s Handbook of Polyurethanes, 1st ed.; CRC Press: Boca Raton, FL, USA, 1999; ISBN 0849306027. [Google Scholar]
- Cao, X.; Lee, L.J.; Widya, T.; Macosko, C. Polyurethane/clay nanocomposites foams: Processing, structure and properties. Polymer 2005, 46, 775–783. [Google Scholar] [CrossRef]
- Kidane, G.; Burriesci, G.; Edirisinghe, M.; Ghanbari, H.; Bonhoeffer, P.; Seifalian, A.M. A novel nanocomposite polymer for development of synthetic heart valve leaflets. Acta Biomater. 2009, 5, 2409–2417. [Google Scholar] [CrossRef]
- Cao, X.D.; Dong, H.; Li, C.M. New Nanocomposite Materials Reinforced with Flax Cellulose Nanocrystals in Waterborne Polyurethane. Biomacromolecules 2007, 8, 899–904. [Google Scholar] [CrossRef] [PubMed]
- Charpentier, A.; Burgess, K.; Wang, L.; Chowdhury, R.R.; Lotus, A.F.; Moula, G. Nano-TiO2/polyurethane composites for antibacterial and self-cleaning coatings. Nanotechnology 2012, 23, 425606. [Google Scholar] [CrossRef] [PubMed]
- Das, B.; Mandal, M.; Upadhyay, A.; Chattopadhyay, P.; Karak, N. Bio-based hyperbranched polyurethane/Fe3O4 nanocomposites: Smart antibacterial biomaterials for biomedical devices and implants. Biomed. Mater. 2013, 8, 035003. [Google Scholar] [CrossRef]
- Bistricic, L.; Baranovic, G.; Leskovac, M.; Bajsic, E.G. Hydrogen bonding and mechanical properties of thin films of polyether-based polyurethane–silica nanocomposites. Eur. Polym. J. 2010, 46, 1975–1987. [Google Scholar] [CrossRef]
- Yu, J.C.; Tonpheng, B.; Grobner, G.; Andersson, O. A MWCNT/Polyisoprene Composite Reinforced by an Effective Load Transfer Reflected in the Extent of Polymer Coating. Macromolecules 2012, 45, 2841–2849. [Google Scholar] [CrossRef]
- Sun, G.; Li, Z.; Liang, R.; Weng, L.T.; Zhang, L. Super stretchable hydrogel achieved by non-aggregated spherulites with diameters < 5 nm. Nat. Commun. 2016, 7, 12095. [Google Scholar] [CrossRef] [PubMed] [Green Version]
- Hakimelahi, H.R.; Hu, L.; Rupp, B.B.; Coleman, M.R. Synthesis and characterization of transparent alumina reinforced polycarbonate nanocomposite. Polymer 2010, 51, 2494–2502. [Google Scholar] [CrossRef]
- Rao, Y.Q.; Chen, S. Molecular Composites Comprising TiO2 and Their Optical Properties. Macromolecules 2008, 41, 4838–4844. [Google Scholar] [CrossRef]
- Miniewicz AGirones, J.; Karpinski, P.; Mossety-Leszczak, B.; Galina, H.; Dutkiewicz, M. Photochromic and nonlinear optical properties of azo-functionalized POSS nanoparticles dispersed in nematic liquid crystals. J. Mater. Chem. C 2014, 2, 432–440. [Google Scholar] [CrossRef]
- Zhou, W.; Yu, Y.; Chen, H.; DiSalvo, F.J.; Abruna, H.D. Yolk–Shell Structure of Polyaniline-Coated Sulfur for Lithium–Sulfur Batteries. J. Am. Chem. Soc. 2013, 135, 16736–16743. [Google Scholar] [CrossRef]
- Matteucci, S.; Van Wagner, E.; Freeman, B.D.; Swinnea, S.; Sakaguchi, T.; Masuda, T. Desilylation of Substituted Polyacetylenes by Nanoparticles. Macromolecules 2007, 40, 3337–3347. [Google Scholar] [CrossRef]
- Strachota, A.; Ribot, F.; Matějka, L.; Whelan, P.; Starovoytova, L.; Plestil, J.; Steinhart, M.; Slouf, M.; Hromadkova, J.; Kovarova, J.; et al. Preparation of novel, nanocomposite stannoxane-based organic-inorganic epoxy polymers containing ionic bonds. Macromolecules 2012, 45, 221–237. [Google Scholar] [CrossRef]
- Strachota, A.; Rodzen, K.; Ribot, F.; Perchacz, M.; Trchová, M.; Steinhart, M.; Starovoytova, L.; Slouf, M.; Strachota, B. Tin-based “super-POSS” building blocks in epoxy nanocomposites with highly improved oxidation resistance. Polymer 2014, 55, 3498–3515. [Google Scholar] [CrossRef]
- Strachota, A.; Rodzeń, K.; Ribot, F.; Trchová, M.; Steinhart, M.; Starovoytova, L.; Pavlova, E. Behavior of Tin-Based “Super-POSS” Incorporated in Different Bonding Situations in Hybrid Epoxy Resins. Macromolecules 2014, 47, 4266–4287. [Google Scholar] [CrossRef]
- Kim, H.; Abdala, A.A.; Macosko, C.W. Graphene/Polymer Nanocomposites. Macromolecules 2010, 43, 6515–6530. [Google Scholar] [CrossRef]
- Robbes, A.S.; Jestin, J.; Meneau, F.; Dalmas, F.; Sandre, O.; Perez, J.; Boue, F.; Cousin, F. Homogeneous Dispersion of Magnetic Nanoparticles Aggregates in a PS Nanocomposite: Highly Reproducible Hierarchical Structure Tuned by the Nanoparticles’ Size. Macromolecules 2010, 43, 5785–5796. [Google Scholar] [CrossRef] [Green Version]
- Mossety-Leszczak, B.; Strachota, B.; Strachota, A.; Steinhart, M.; Šlouf, M. The orientation-enhancing effect of diphenyl aluminium phosphate nanorods in a liquid-crystalline epoxy matrix ordered by magnetic field. Eur. Polym. J. 2015, 72, 238–255. [Google Scholar] [CrossRef]
- Maji, P.K.; Das, N.K.; Bhowmick, A.K. Preparation and properties of polyurethane nanocomposites of novel architecture as advanced barrier materials. Polymer 2010, 51, 1100–1110. [Google Scholar] [CrossRef]
- Yan, N.; Buonocore, G.; Lavorgna, M.; Kaciulis, S.; Balijepalli, S.K.; Zhan, Y.H.; Xia, H.S.; Ambrosio, L. The role of reduced graphene oxide on chemical, mechanical and barrier properties of natural rubber composites. Compos. Sci. Technol. 2014, 102, 74–81. [Google Scholar] [CrossRef]
- Kim, B.K. Aqueous polyurethane dispersions. Colloid Polym. Sci. 1996, 274, 599–611. [Google Scholar] [CrossRef]
- Nanda, A.K.; Wicks, D.A.; Madbouly, S.A.; Otaigbe, J.U. Effect of ionic content, solid content, degree of neutralization, and chain extension on aqueous polyurethane dispersions prepared by prepolymer method. J. Appl. Polym. Sci. 2005, 98, 2514–2520. [Google Scholar] [CrossRef]
- Jeon, H.T.; Jang, M.K.; Kim, B.K.; Kim, K.H. Synthesis and characterizations of waterborne polyurethane–silica hybrids using sol–gel process. Colloids Surf. A Physicochem. Eng. Asp. 2007, 302, 559–567. [Google Scholar] [CrossRef]
- Heck, C.A.; dos Santos, J.H.Z.; Wolf, C.R. Waterborne polyurethane: The effect of the addition or in situ formation of silica on mechanical properties and adhesion. Int. J. Adhes. Adhes. 2015, 58, 13–20. [Google Scholar] [CrossRef]
- Echarri-Giacchi, M.; Martín-Martínez, J.M. Efficient Physical Mixing of Small Amounts of Nanosilica Dispersion and Waterborne Polyurethane by Using Mild Stirring Conditions. Polymers 2022, 14, 5136. [Google Scholar] [CrossRef]
- Serkis, M.; Špírková, M.; Hodan, J.; Kredatusová, J. Nanocomposites made from thermoplastic waterborne polyurethane and colloidal silica. The influence of nanosilica type and amount on the functional properties. Prog. Org. Coat. 2016, 101, 342–349. [Google Scholar] [CrossRef]
- Zhang, S.; Chen, Z.; Guo, M.; Bai, H.; Liu, X. Synthesis and characterization of waterborne UV-curable polyurethane modified with side-chain triethoxysilane and colloidal silica. Colloids Surf. A Physicochem. Eng. Asp. 2015, 468, 1–9. [Google Scholar] [CrossRef]
- Peruzzo, P.J.; Anbinder, P.S.; Pardini, F.M.; Pardini, O.R.; Plivelic, T.S.; Amalvy, J.I. On the strategies for incorporating nanosilica aqueous dispersion in the synthesis of waterborne polyurethane/silica nanocomposites: Effects on morphology and properties. Mater. Today Commun. 2016, 6, 81–91. [Google Scholar] [CrossRef]
- Hassanajili, S.; Sajedi, M.T. Fumed silica/polyurethane nanocomposites: Effect of silica concentration and its surface modification on rheology and mechanical properties. Iran. Polym. J. 2016, 25, 697–710. [Google Scholar] [CrossRef]
- Foldi, V.S.; Campbell, T.W. Preparation of copoly(carbonate/urethanes) from polycarbonates. J. Polym. Sci. 1962, 56, 1–9. [Google Scholar] [CrossRef]
- Tanzi, M.C.; Mantovani, D.; Petrini, P.; Guidoin, R.; Laroche, G. Chemical stability of polyether urethanes versus polycarbonate urethanes. J. Biomed. Mater. Res. 1997, 36, 550–559. [Google Scholar] [CrossRef]
- Lee, D.K.; Tsai, H.B.; Wang, H.H.; Tsai, R.S. Aqueous Polyurethane Dispersions Derived from Polycarbonatediols. J. Appl. Polym. Sci. 2004, 94, 1723–1729. [Google Scholar] [CrossRef]
- Lee, D.K.; Yang, Z.D.; Tsai, H.B.; Tsai, R.S. Polyurethane Dispersions Derived From Polycarbonatediols and m-Di(2-isocyanatopropyl)benzene. Polym. Eng. Sci. 2009, 49, 2264–2268. [Google Scholar] [CrossRef]
- Serkis, M.; Poręba, R.; Hodan, J.; Kredatusová, J.; Špírková, M. Preparation and characterization of thermoplastic water-borne polycarbonate-based polyurethane dispersions and cast films. J. Appl. Polym. Sci. 2015, 132, 42672. [Google Scholar] [CrossRef]
- Špírková, M.; Hodan, J.; Kredatusová, J.; Poręba, R.; Uchman, M.; Serkis-Rodzeń, M. Functional properties of films based on novel waterborne polyurethane dispersions prepared without a chain-extension step. Prog. Org. Coat. 2018, 123, 53–62. [Google Scholar] [CrossRef]
- Oliver, W.C.; Pharr, G.M. Measurement of hardness and elastic modulus by instrumented indentation: Advances in understanding and refinements to methodology. J. Mater. Res. 2004, 19, 3–20. [Google Scholar] [CrossRef]
- Flores, A.; Ania, F.; Baltá-Calleja, F.J. From the glassy state to ordered polymer structures: A microhardness study. Polymer 2009, 50, 729–746. [Google Scholar] [CrossRef] [Green Version]
- Díez-Pascual, A.M.; Gómez-Fatou, M.A.; Ania, F.; Flores, A. Nanoindentation in polymer nanocomposites. Prog. Mater. Sci. 2015, 67, 1–94. [Google Scholar] [CrossRef] [Green Version]
- Mezger, T.G. The Rheology Handbook for Users of Rotational and Oscillatory Rheometers, 4th ed.; Vincentz Network: Hanover, Germany, 2014; ISBN 978-3-86630-650-9. [Google Scholar]
- Slouf, M.; Henning, S. Micromechanical Properties. In Encyclopedia of Polymer Science and Technology, 4th ed.; John Wiley & Sons, Inc.: Hoboken, NJ, USA, 2022; pp. 1–50. ISBN 9780471440260. [Google Scholar] [CrossRef]
- Herrmann, K. Hardness Testing: Principles and Applications, 1st ed.; ASM International: Russell Township, OH, USA, 2011; ISBN 978-1615038329. [Google Scholar]
- Heinrich, G.; Kluppel, M.; Vilgis, T.A. Reinforcement of elastomers. Curr. Opin. Solid State Mater. Sci. 2002, 6, 195–203. [Google Scholar] [CrossRef]
- Gajdosova, V.; Strachota, B.; Strachota, A.; Michalkova, D.; Krejcikova, S.; Fulin, P.; Nyc, O.; Brinek, A.; Zemek, M.; Slouf, M. Biodegradable Thermoplastic Starch/Polycaprolactone Blends with Co-Continuous Morphology Suitable for Local Release of Antibiotics. Materials 2022, 15, 1101. [Google Scholar] [CrossRef]
- Strachota, B.; Šlouf, M.; Matějka, L. Tremendous reinforcing, pore-stabilizing and response-accelerating effect of in situ generated nanosilica in thermoresponsive poly(N-isopropylacrylamide) cryogels. Polym. Int. 2017, 66, 1510–1521. [Google Scholar] [CrossRef]
- Hardiman, M.; Vaughan, T.J.; McCarthy, C.T. The effects of pile-up, viscoelasticity and hydrostatic stress on polymer matrix nanoindentation. Polym. Test. 2016, 52, 157–166. [Google Scholar] [CrossRef] [Green Version]
- Liu, C.K.; Lee, S.; Sung, L.P.; Nguyen, T. Load-displacement relations for nanoindentation of viscoelastic materials. J. Appl. Phys. 2006, 100, 033503. [Google Scholar] [CrossRef]
- Slouf, M.; Krajenta, J.; Gajdosova, V.; Pawlak, A. Macromechanical and micromechanical properties of polymers with reduced density of entanglements. Polym. Eng. Sci. 2021, 61, 1773–1790. [Google Scholar] [CrossRef]
- Urdan, T.C. Statistics in Plain English, 4th ed.; Routledge (Taylor & Francis Group): New York, NY, USA, 2017; ISBN 978-1138838345. [Google Scholar]
- Kang, S.K.; Kim, J.Y.; Park, C.P.; Kim, H.U.; Kwon, D. Conventional Vickers and true instrumented indentation hardness determined by instrumented indentation tests. J. Mater. Res. 2010, 25, 337–343. [Google Scholar] [CrossRef] [Green Version]
- Strachota, A.; Kroutilová, I.; Kovářová, J.; Matějka, L. Epoxy Networks Reinforced with Polyhedral Oligomeric Silsesquioxanes (POSS). Thermomechanical Properties. Macromolecules 2004, 37, 9457–9464. [Google Scholar] [CrossRef]
- Strachota, B.; Hodan, J.; Dybal, J.; Matějka, L. Self-Healing Epoxy and Reversible Diels-Alder Based Interpenetrating Networks. Macromol. Mater. Eng. 2021, 306, 2000474. [Google Scholar] [CrossRef]
- Špírková, M.; Pavličević, J.; Strachota, A.; Poreba, R.; Bera, O.; Kaprálková, L.; Baldrian, J.; Šlouf, M.; Lazić, N.; Budinsky-Simendic, J. Novel polycarbonate-based polyurethane elastomers: Composition-property relationship. Eur. Polym. J. 2011, 47, 959–972. [Google Scholar] [CrossRef]
- Horodecka, S.; Strachota, A.; Mossety-Leszczak, B.; Kisiel, M.; Strachota, B.; Šlouf, M. Low-Temperature-Meltable Elastomers Based on Linear Polydimethylsiloxane Chains Alpha, Omega-Terminated with Mesogenic Groups as Physical Crosslinker: A Passive Smart Material with Potential as Viscoelastic Coupling. Part II—Viscoelastic and Rheological Properties. Polymers 2020, 12, 2840. [Google Scholar] [CrossRef]


| Sample ID | Nano-SiO2 Content (wt%) | v/v% * |
|---|---|---|
| PUU00 | 0 | 0 (neat PUU matrix) |
| PUU05 | 5 | 2.1 |
| PUU10 | 10 | 4.3 |
| PUU20 | 20 | 9.1 |
| PUU30 | 30 | 14.6 |
| PUU40 | 40 | 21.1 |
| PUU00 | PUU05 | PUU10 | PUU20 | PUU30 | PUU40 | |
|---|---|---|---|---|---|---|
| G’ (Pa) | 2.94 × 10⁷ | 3.98 × 10⁷ | 5.07 × 10⁷ | 6.59 × 10⁷ | 1.51 × 10⁸ | 3.68 × 10⁸ |
| G” (Pa) | 5.82 × 10⁶ | 7.02 × 10⁶ | 9.73 × 10⁶ | 1.52 × 10⁷ | 3.09 × 10⁷ | 4.37 × 10⁷ |
| tan δ | 0.20 | 0.18 | 0.19 | 0.23 | 0.21 | 0.12 |
| PUU00 | PUU05 | PUU10 | PUU20 | PUU30 | PUU40 | |
|---|---|---|---|---|---|---|
| (MPa) | 16 ± 1 | 26 ± 3 | 42 ± 2 | 40 ± 3 | 165 ± 7 | 406 ± 28 |
| (MPa) | 17 ± 2 | 32 ± 2 | 41 ± 2 | 44 ± 2 | 146 ± 6 | 474 ± 17 |
| (MPa) | 1.48 ± 0.20 | 2.56 ± 0.51 | 3.56 ± 0.18 | 3.71 ± 0.33 | 6.44 ± 0.28 | 10.15 ± 0.57 |
| (MPa) | 1.24 ± 0.22 | 2.87 ± 0.13 | 3.2 ± 0.17 | 3.41 ± 0.22 | 5.61 ± 0.33 | 12.61 ± 0.54 |
| (MPa) | 0.74 ± 0.09 | 1.27 ± 0.24 | 1.92 ± 0.09 | 1.94 ± 0.16 | 4.62 ± 0.18 | 7.81 ± 0.46 |
| (MPa) | 0.76 ± 0.12 | 1.65 ± 0.07 | 1.95 ± 0.09 | 2.08 ± 0.12 | 4.16 ± 0.24 | 9.99 ± 0.44 |
| (%) | 25.6 ± 1.6 | 29.2 ± 1.8 | 30.1 ± 1.3 | 25.2 ± 0.9 | 36.1 ± 1.2 | 38.5 ± 1.9 |
| (%) | 9.6 ± 0.7 | 12.8 ± 0.8 | 14.7 ± 0.3 | 13.1 ± 0.4 | 23.2 ± 0.5 | 22.0 ± 0.5 |
| (%) | 45.7 ± 1.0 | 43.9 ± 0.9 | 38.2 ± 0.5 | 44.4 ± 1.0 | 19.2 ± 0.4 | 13.2 ± 0.3 |
| (%) | 50.2 ± 0.8 | 48.8 ± 0.4 | 42.4 ± 0.3 | 45.4 ± 0.9 | 21.6 ± 0.2 | 15.8 ± 0.3 |
Disclaimer/Publisher’s Note: The statements, opinions and data contained in all publications are solely those of the individual author(s) and contributor(s) and not of MDPI and/or the editor(s). MDPI and/or the editor(s) disclaim responsibility for any injury to people or property resulting from any ideas, methods, instructions or products referred to in the content. |
© 2023 by the authors. Licensee MDPI, Basel, Switzerland. This article is an open access article distributed under the terms and conditions of the Creative Commons Attribution (CC BY) license (https://creativecommons.org/licenses/by/4.0/).
Share and Cite
Gajdošová, V.; Špírková, M.; Aguilar Costumbre, Y.; Krejčíková, S.; Strachota, B.; Šlouf, M.; Strachota, A. Morphology, Micromechanical, and Macromechanical Properties of Novel Waterborne Poly(urethane-urea)/Silica Nanocomposites. Materials 2023, 16, 1767. https://doi.org/10.3390/ma16051767
Gajdošová V, Špírková M, Aguilar Costumbre Y, Krejčíková S, Strachota B, Šlouf M, Strachota A. Morphology, Micromechanical, and Macromechanical Properties of Novel Waterborne Poly(urethane-urea)/Silica Nanocomposites. Materials. 2023; 16(5):1767. https://doi.org/10.3390/ma16051767
Chicago/Turabian StyleGajdošová, Veronika, Milena Špírková, Yareni Aguilar Costumbre, Sabina Krejčíková, Beata Strachota, Miroslav Šlouf, and Adam Strachota. 2023. "Morphology, Micromechanical, and Macromechanical Properties of Novel Waterborne Poly(urethane-urea)/Silica Nanocomposites" Materials 16, no. 5: 1767. https://doi.org/10.3390/ma16051767