
A Combined Atomic and Molecular Probe Characterization of Aromatic Hydrocarbons via PALS and ESR: Methylbenzene

 , , ,
, , , 
Abstract
:1. Introduction
2. Materials and Methods
2.1. DSC
2.2. PALS
2.3. ESR
3. Results
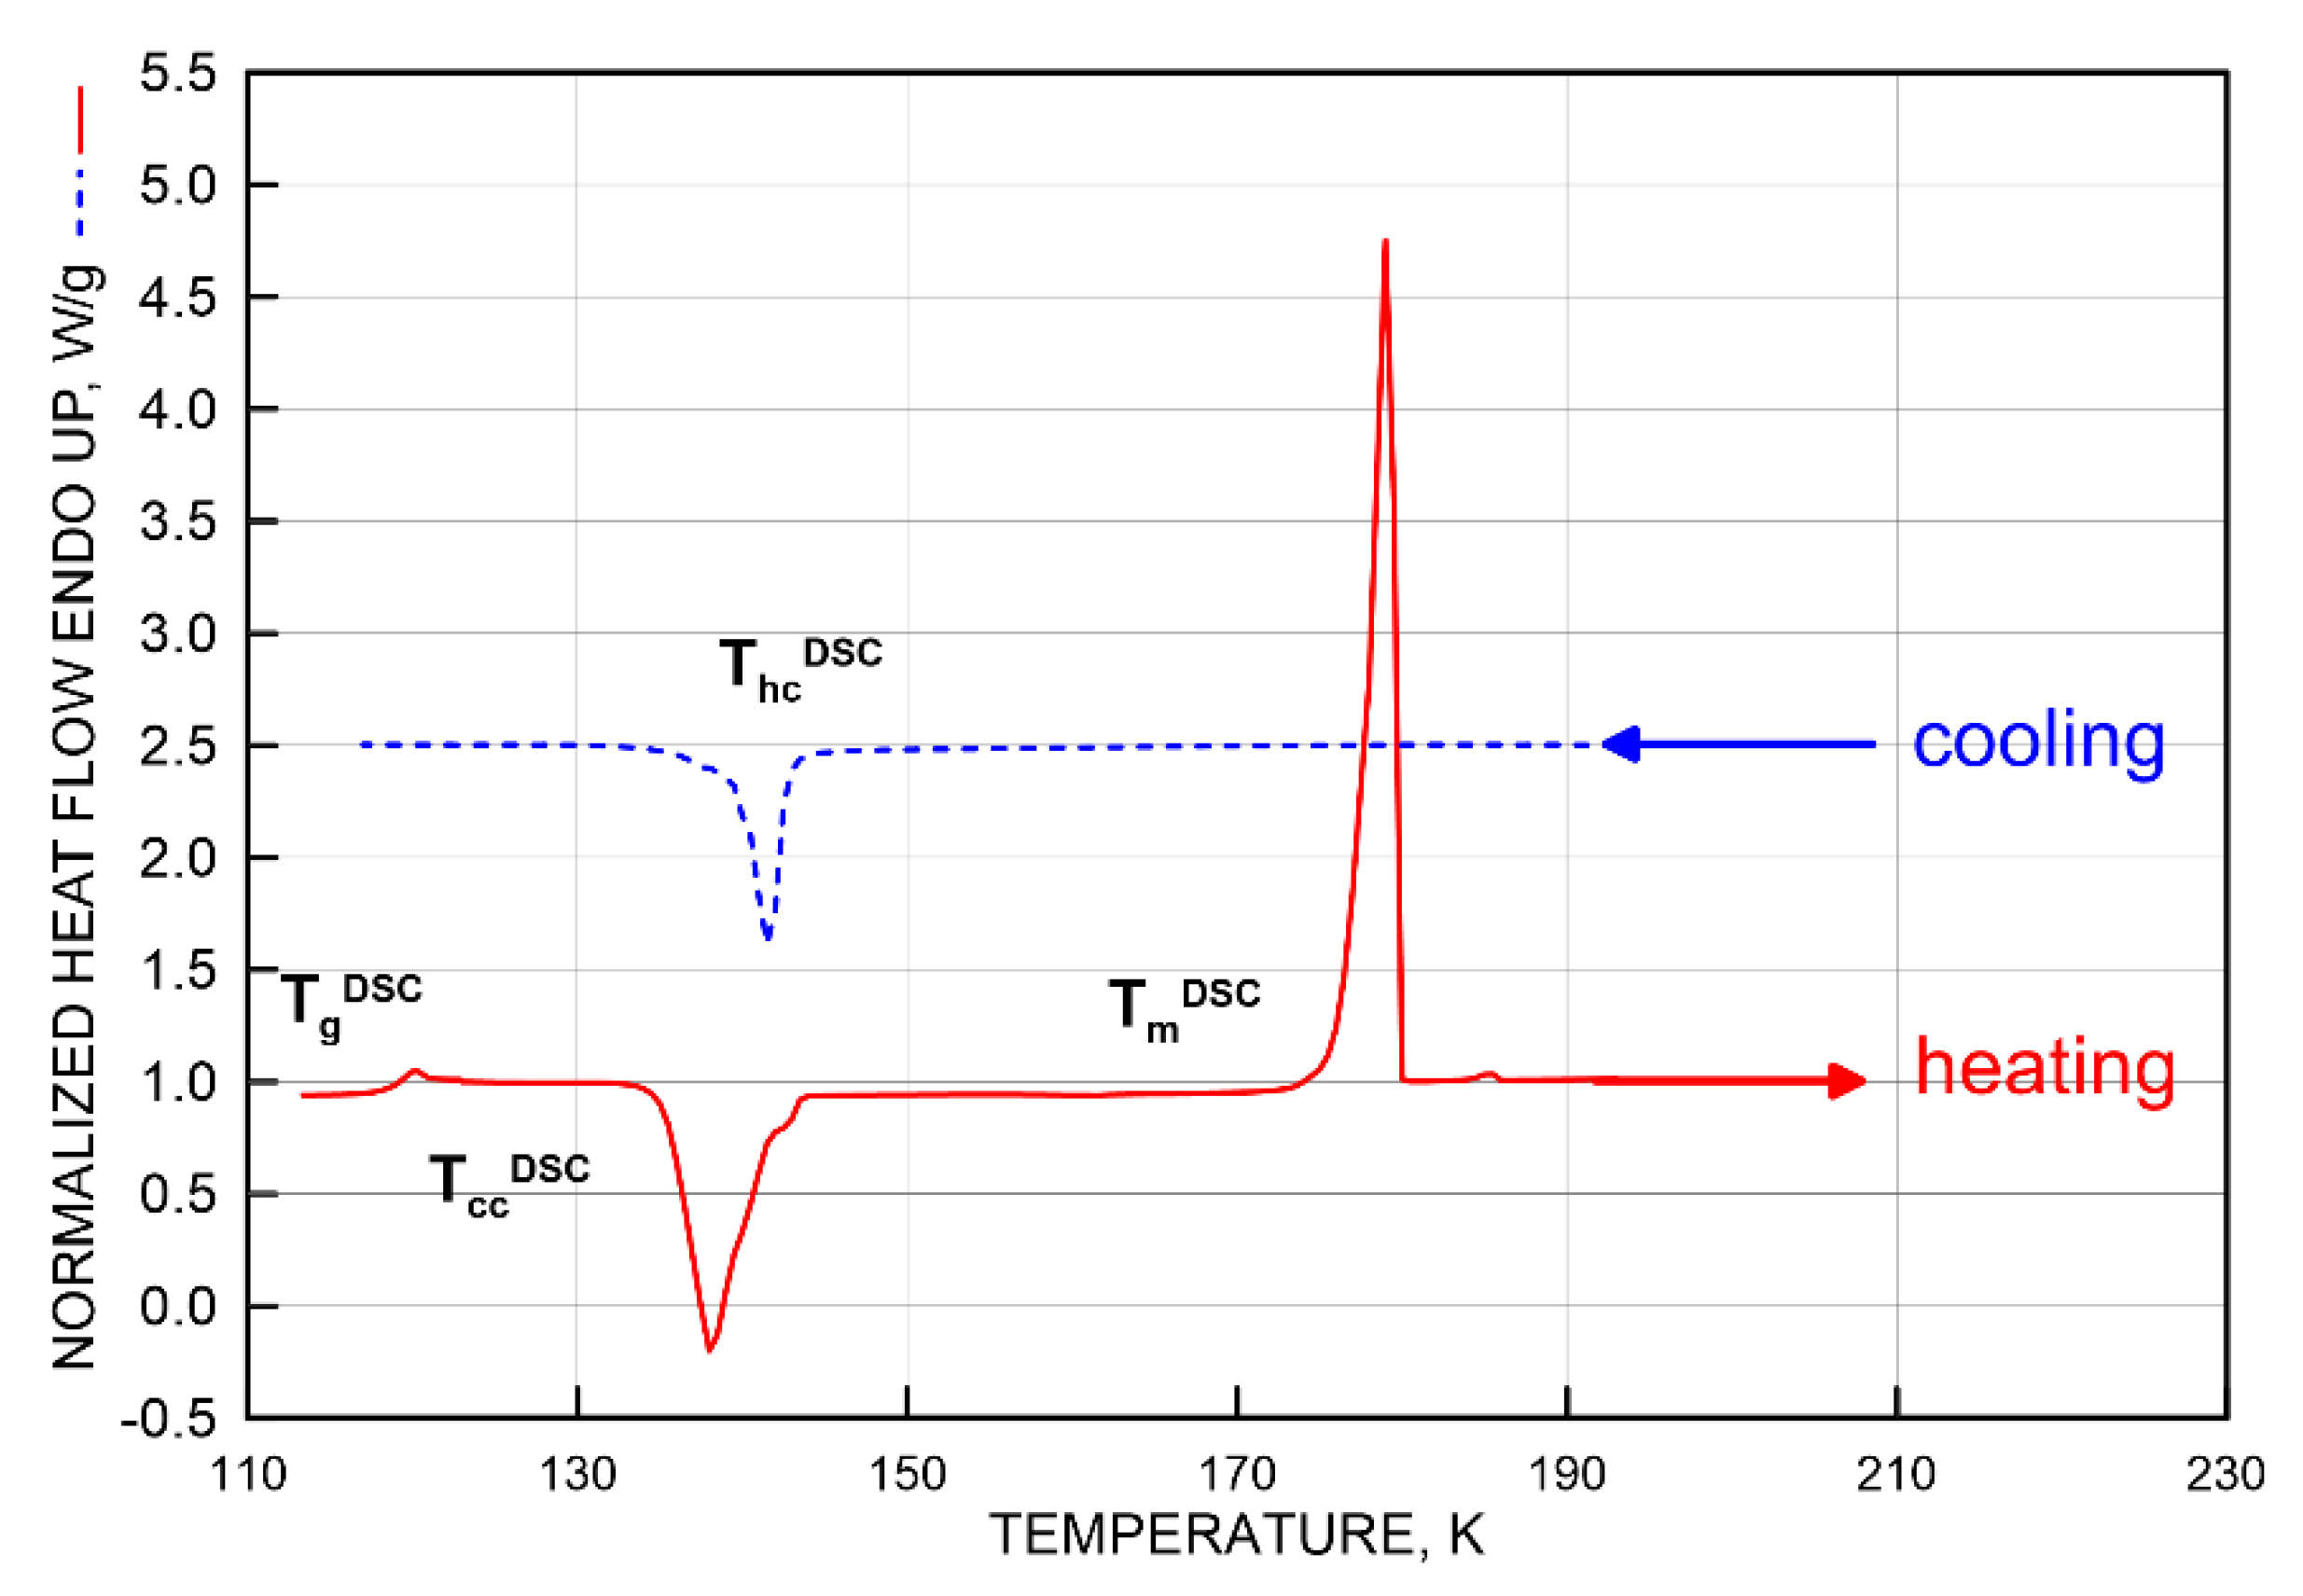
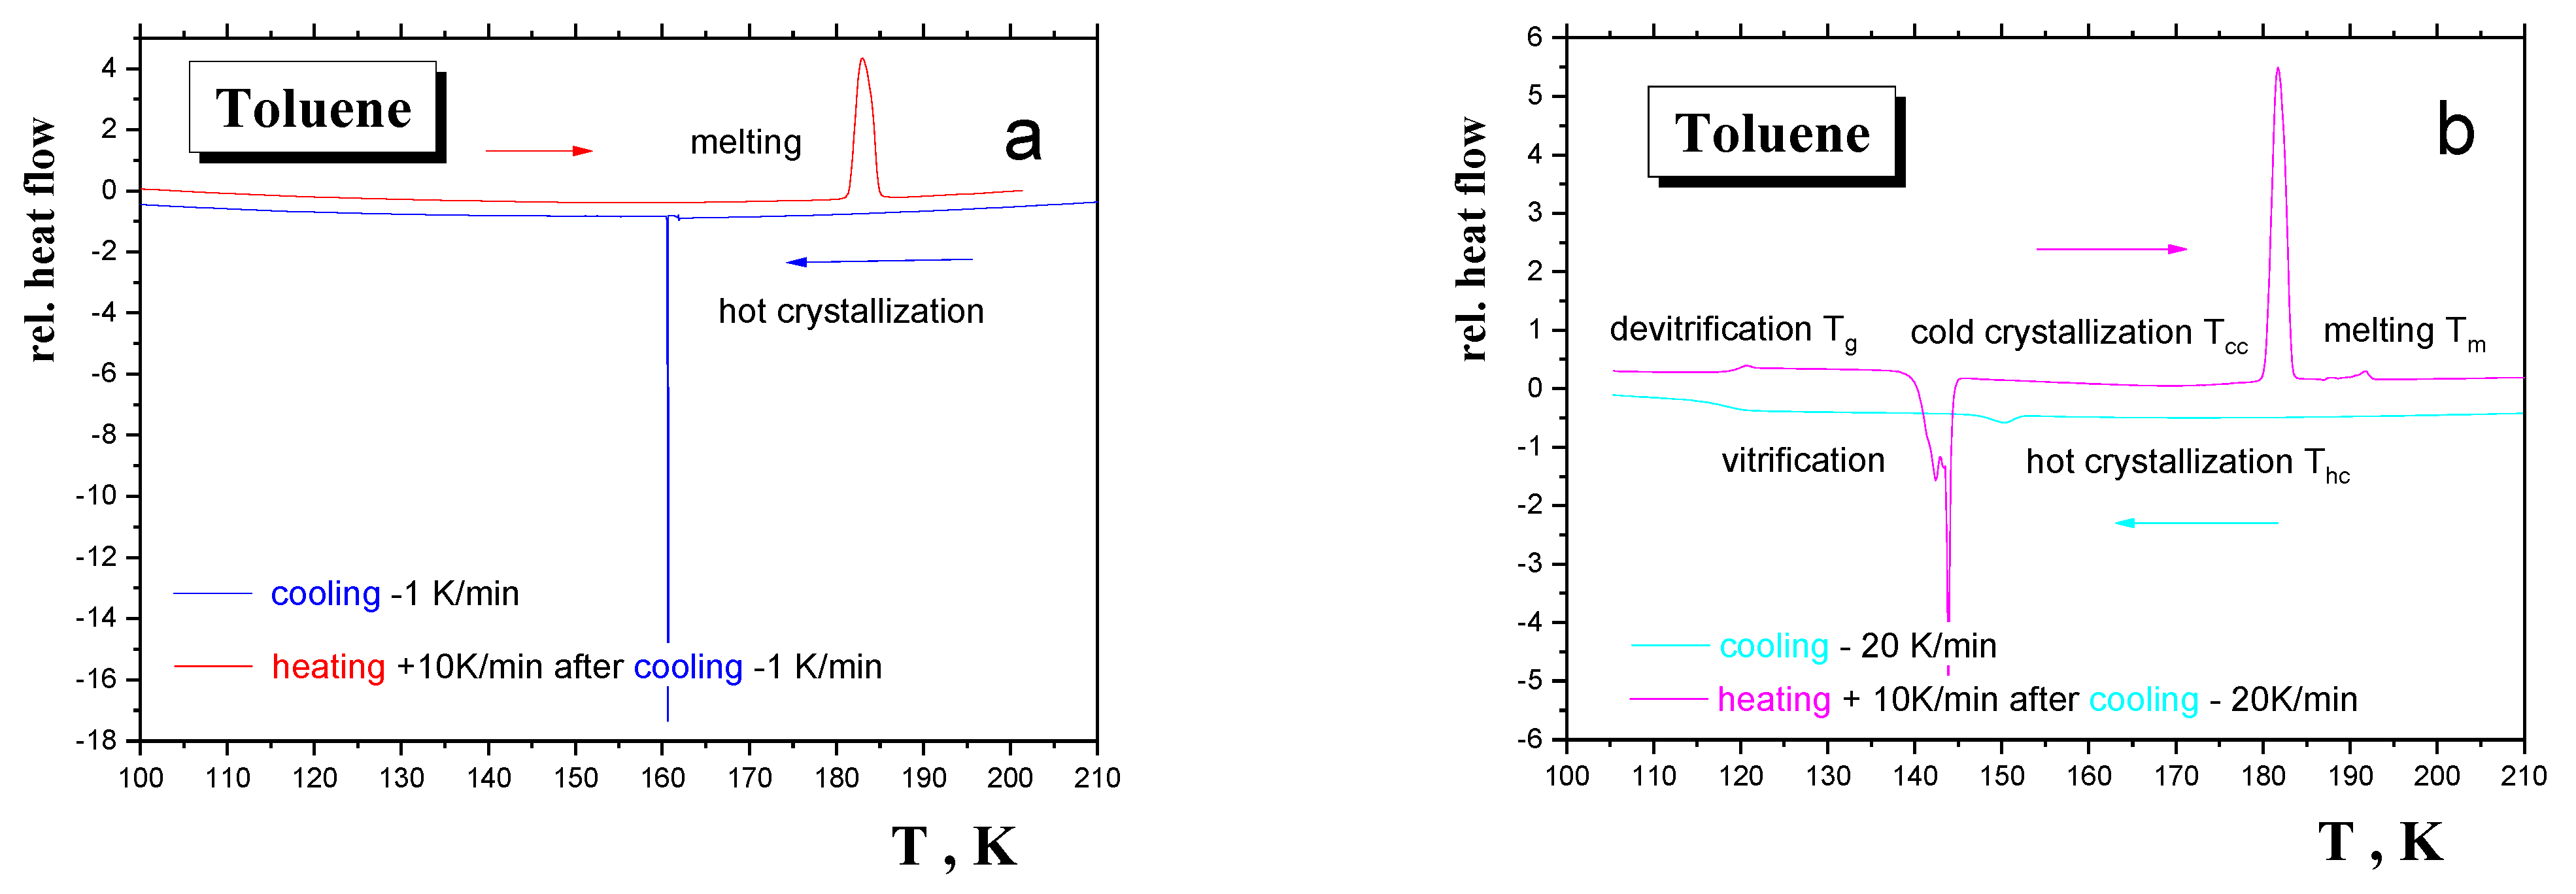
3.1. DSC Results
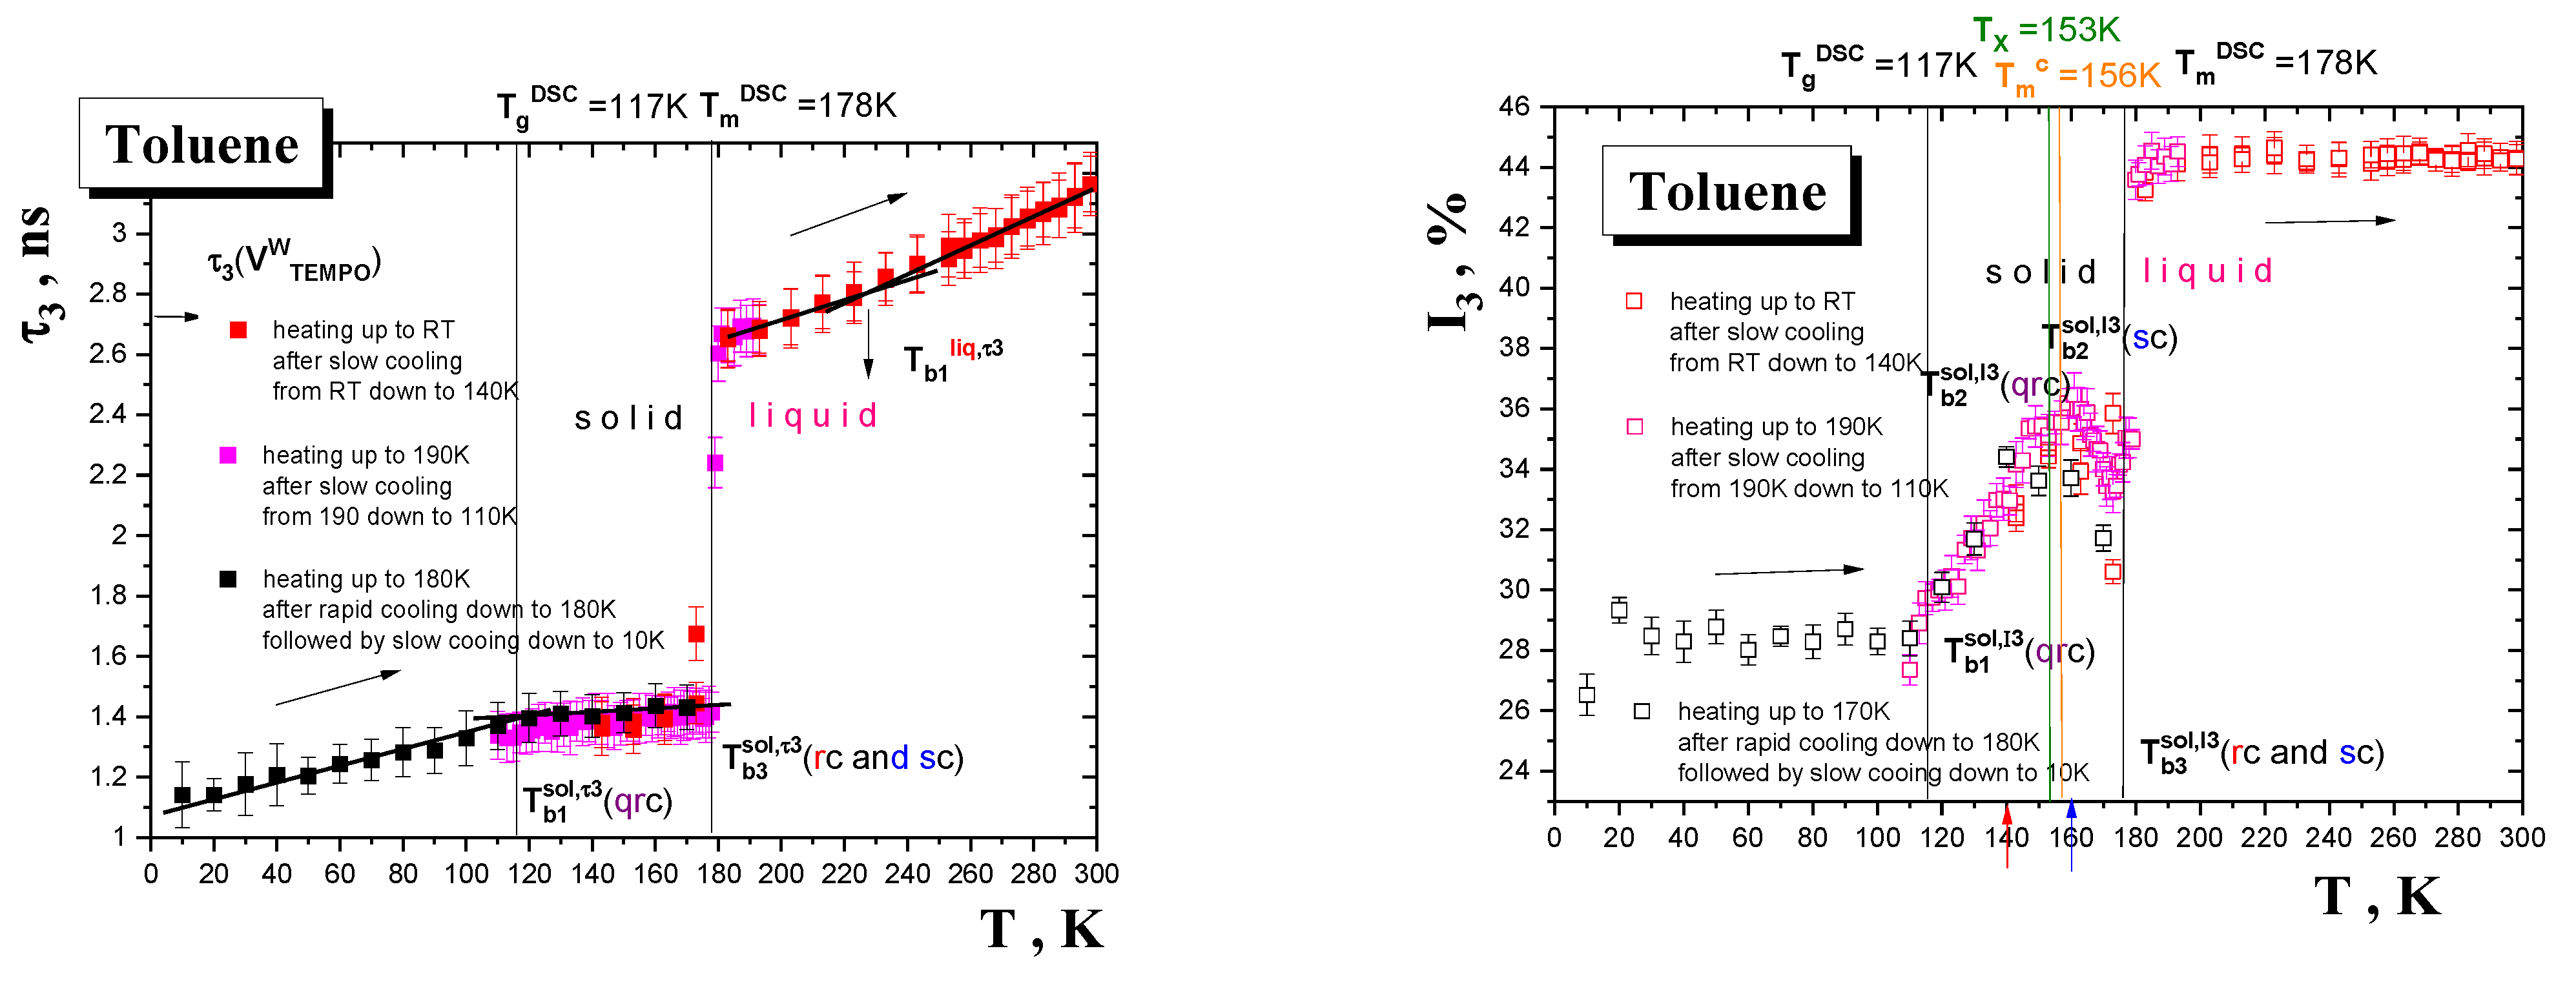
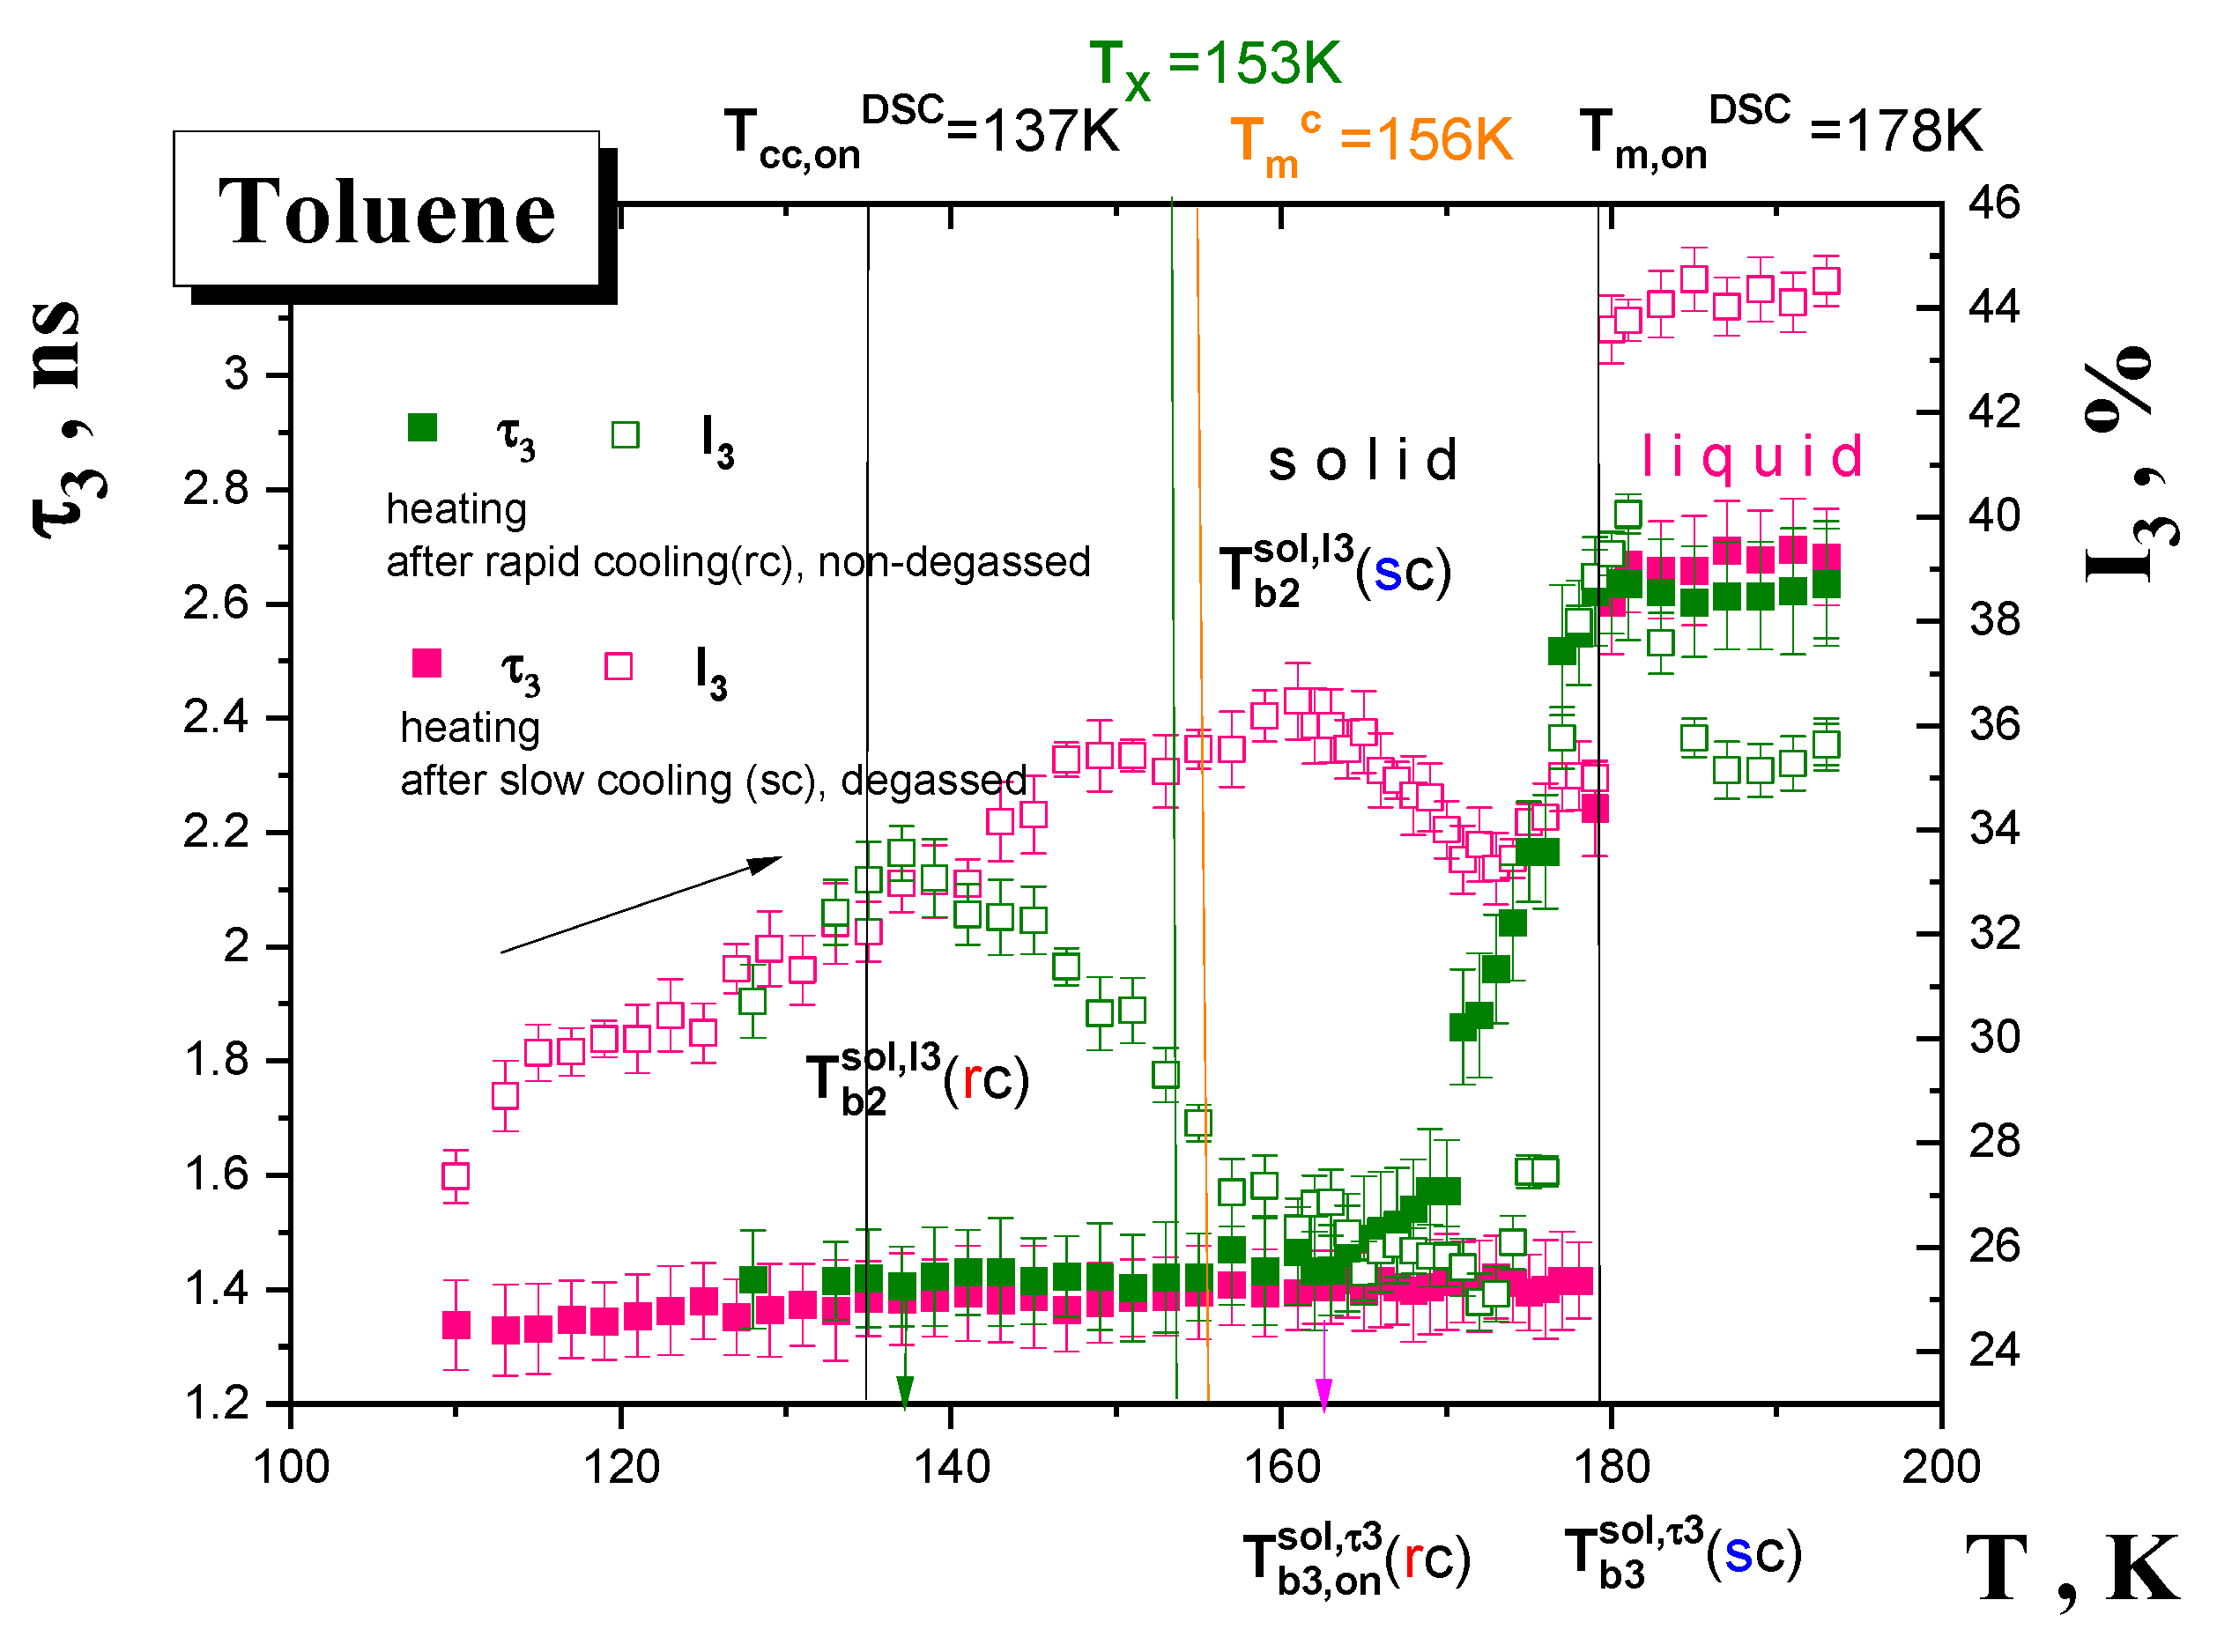
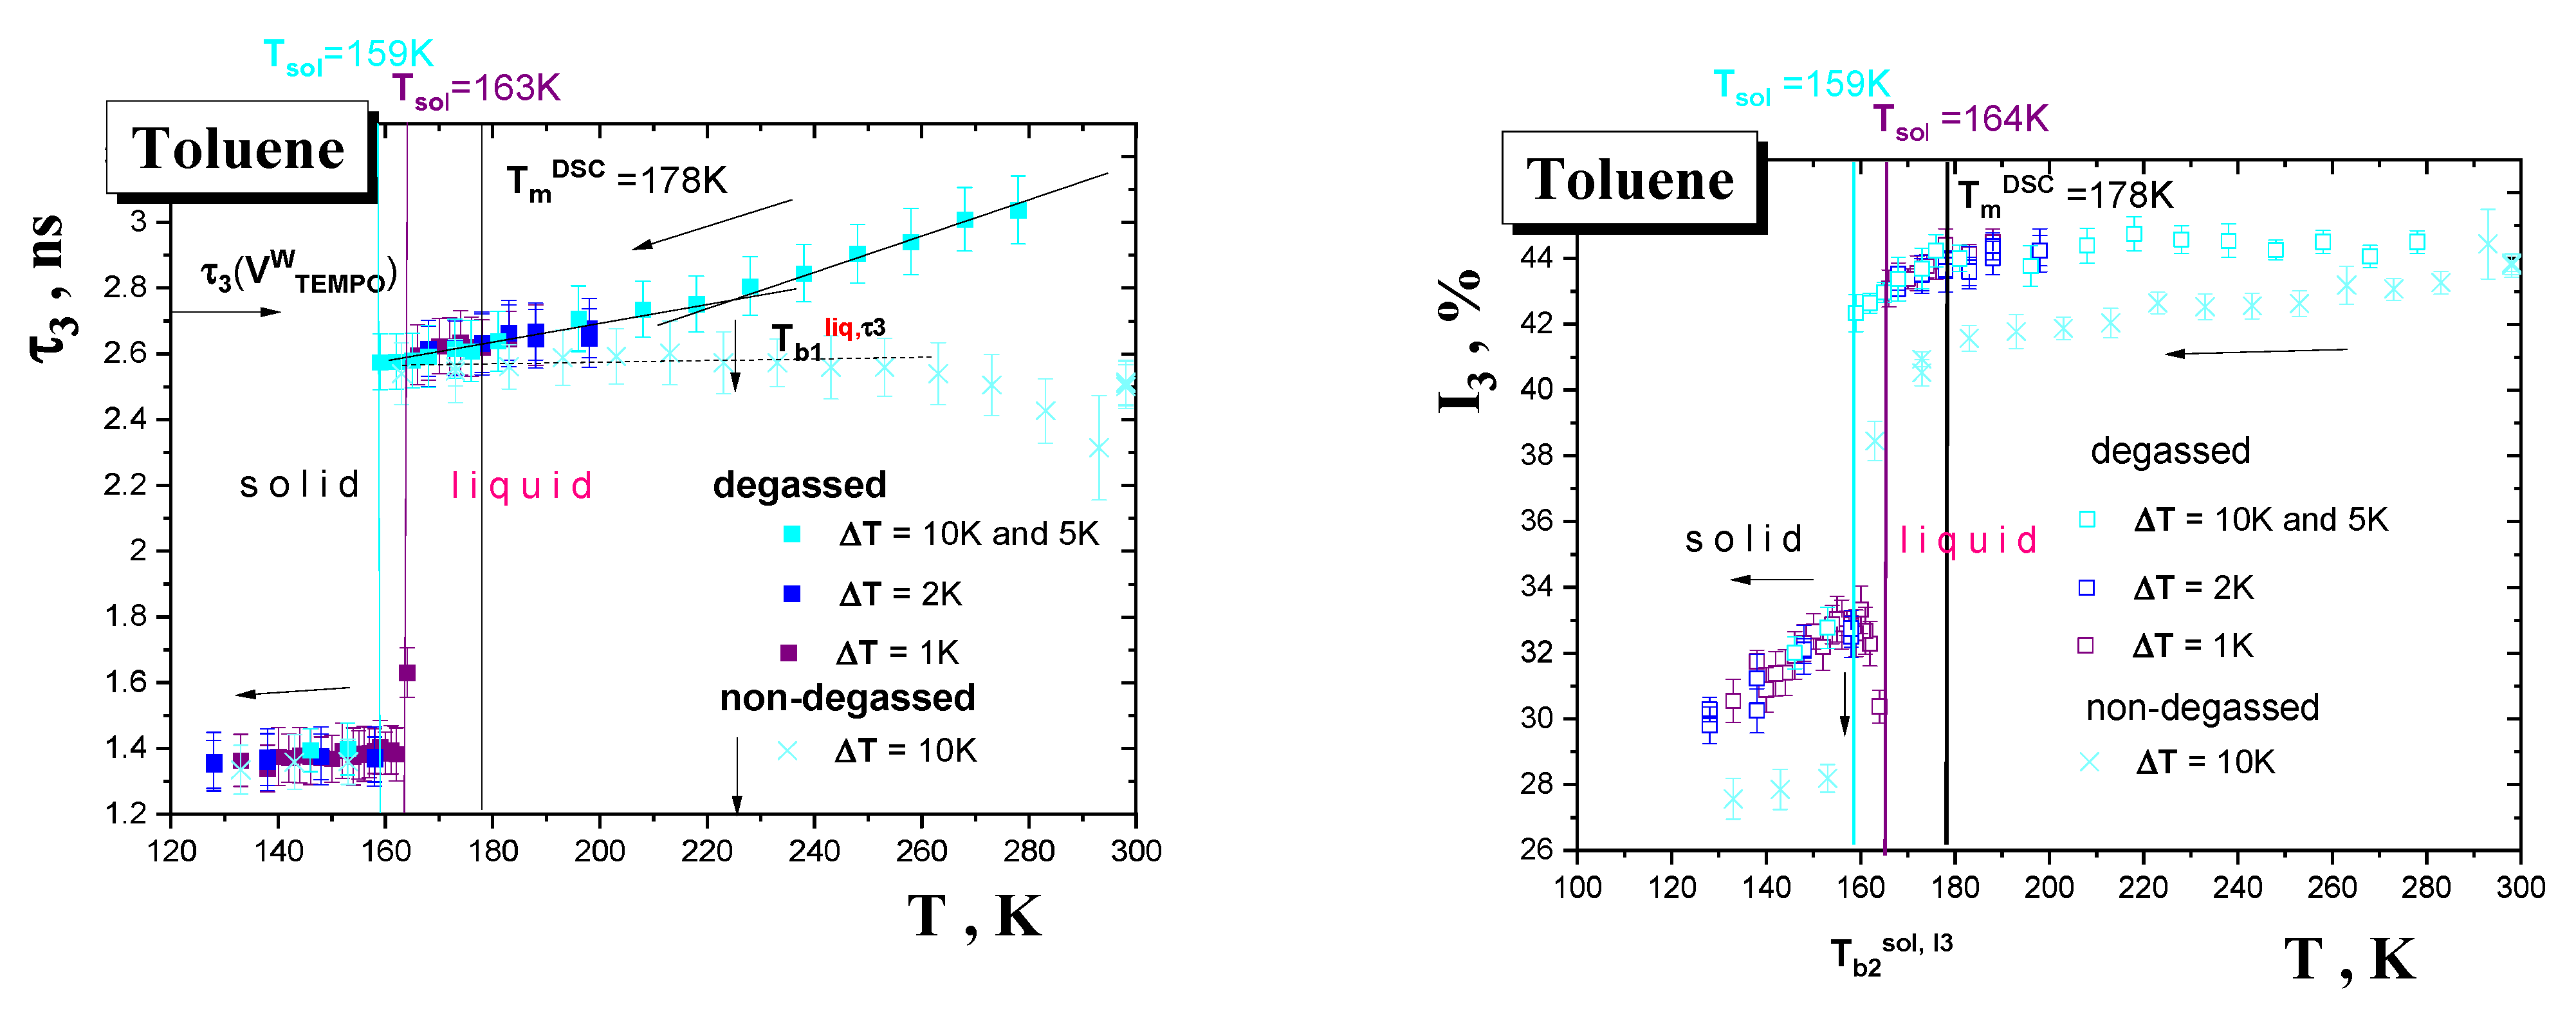
3.2. PALS Results
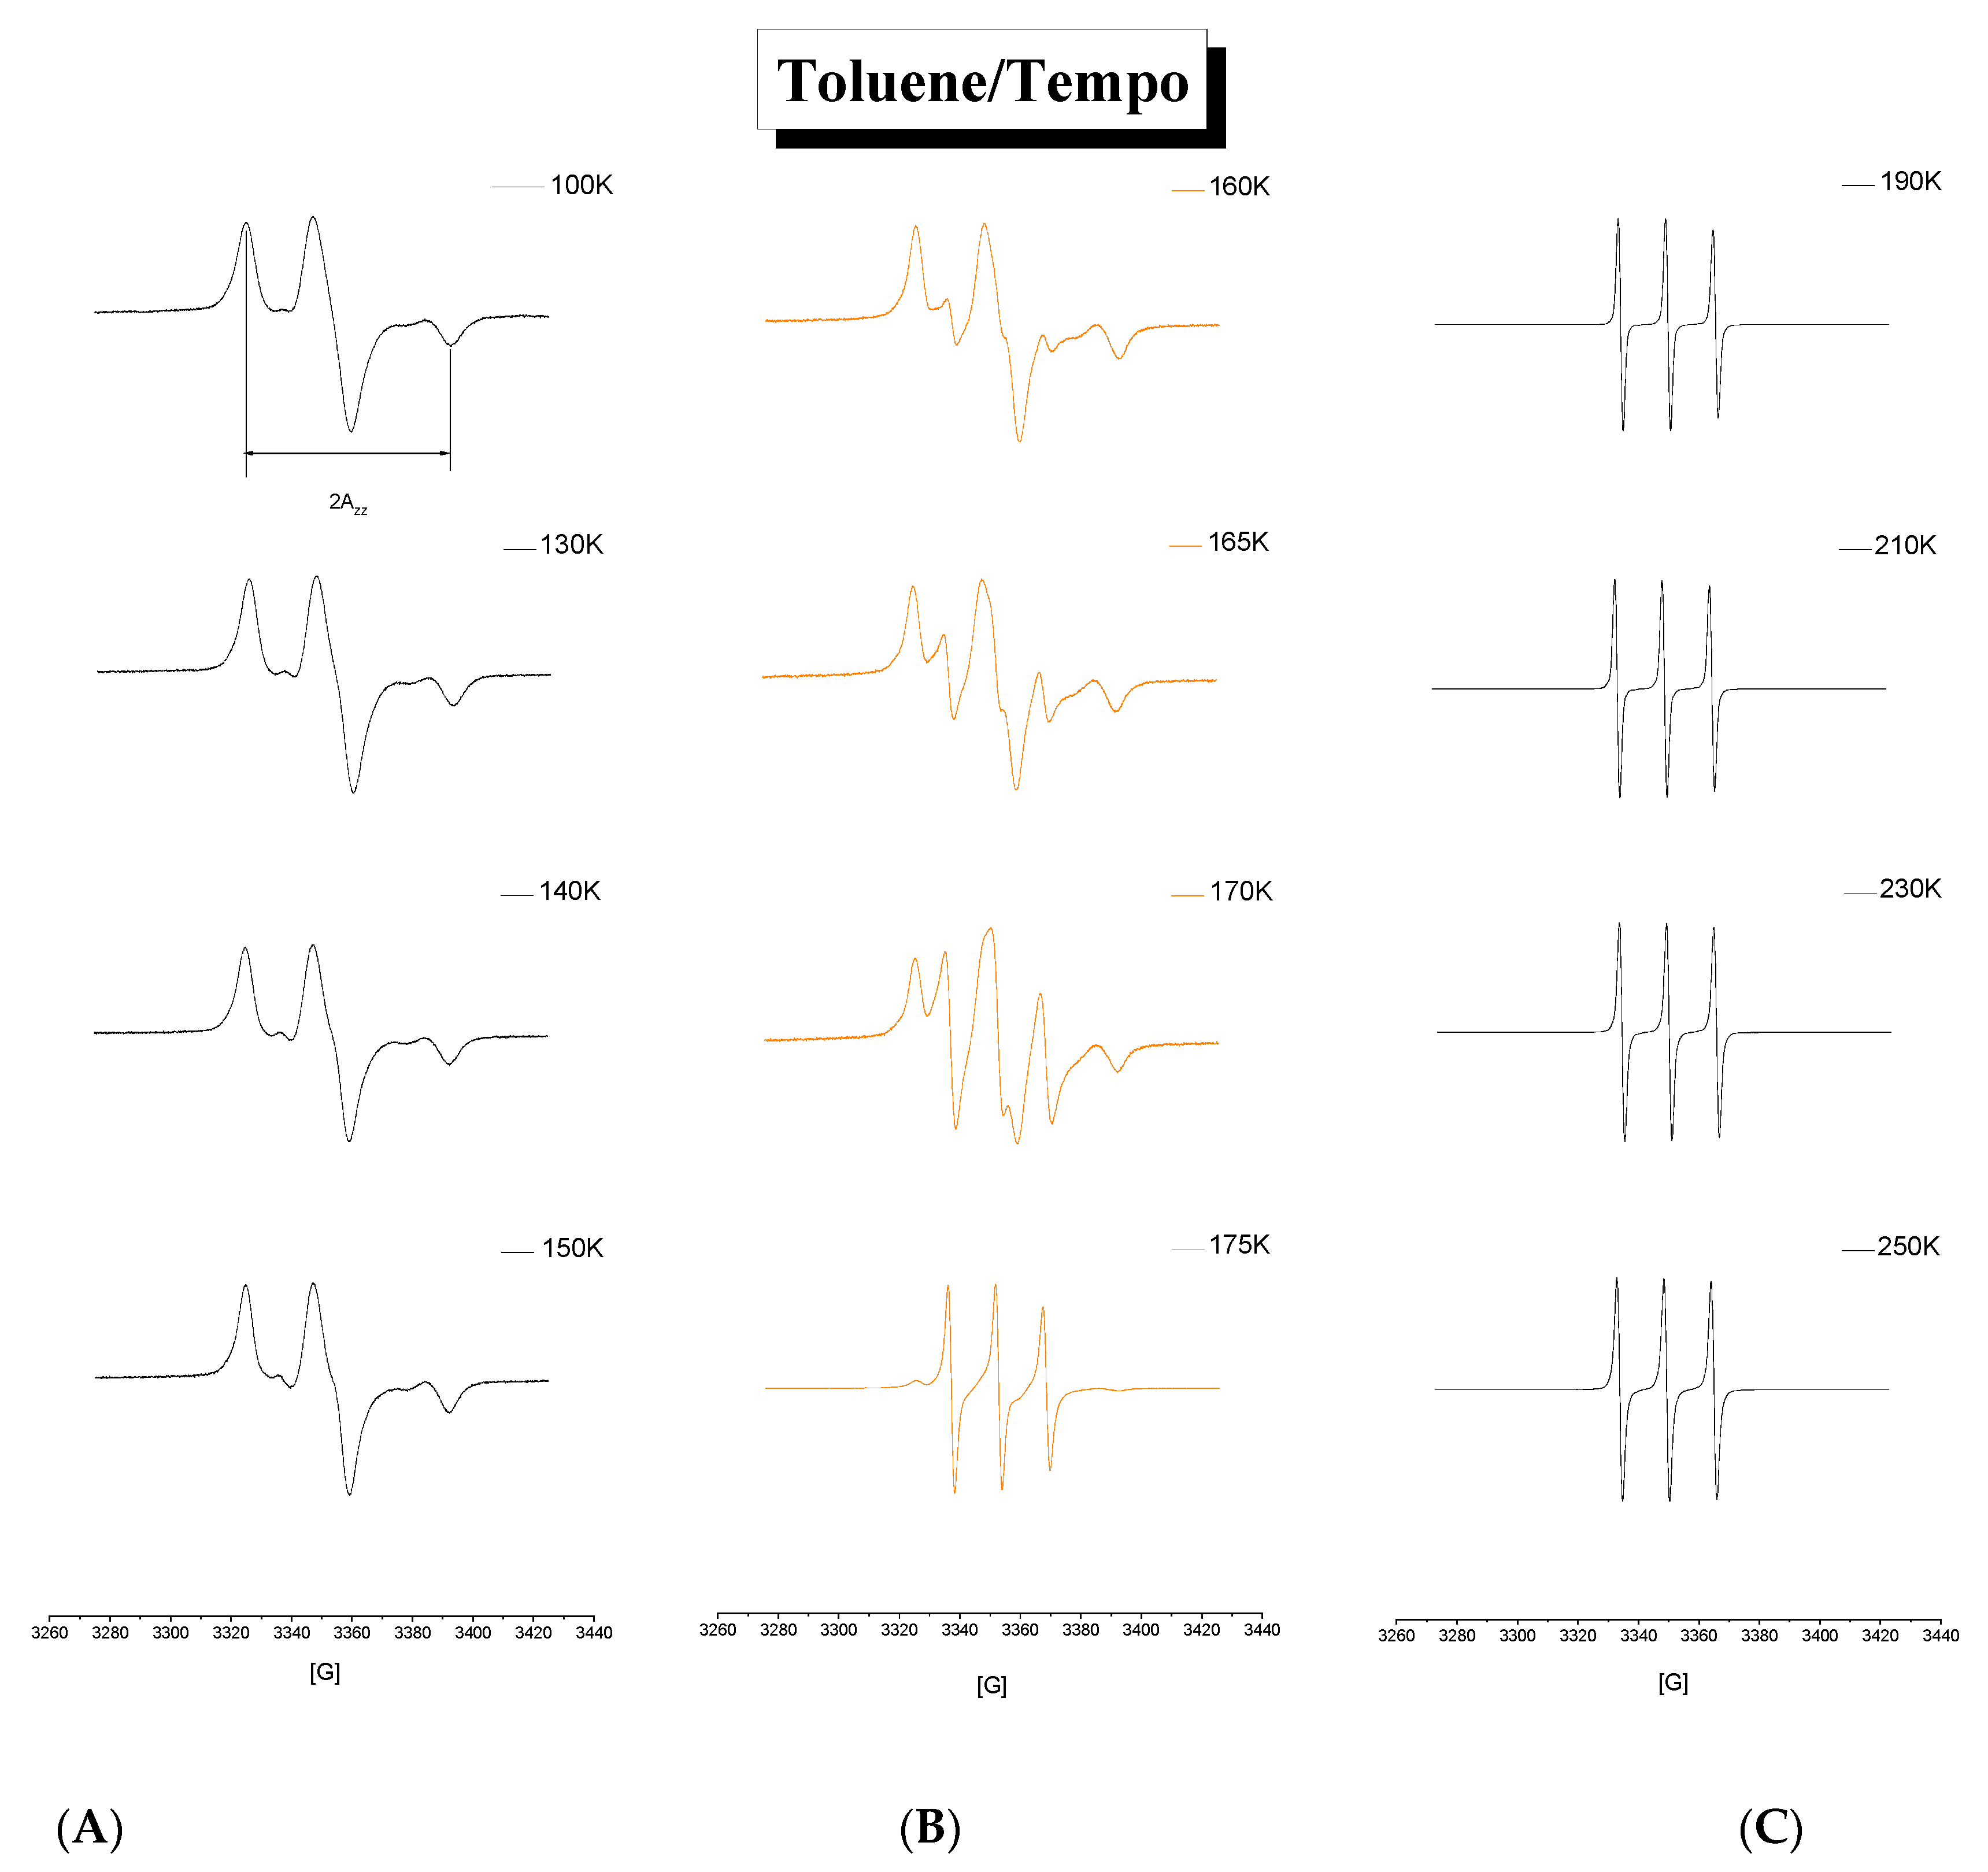
3.3. ESR Results
4. Discussion
4.1. The Mutual Relationships between the PALS and ESR Data
4.2. Thermodynamic Interpretation of the PALS and ESR Data
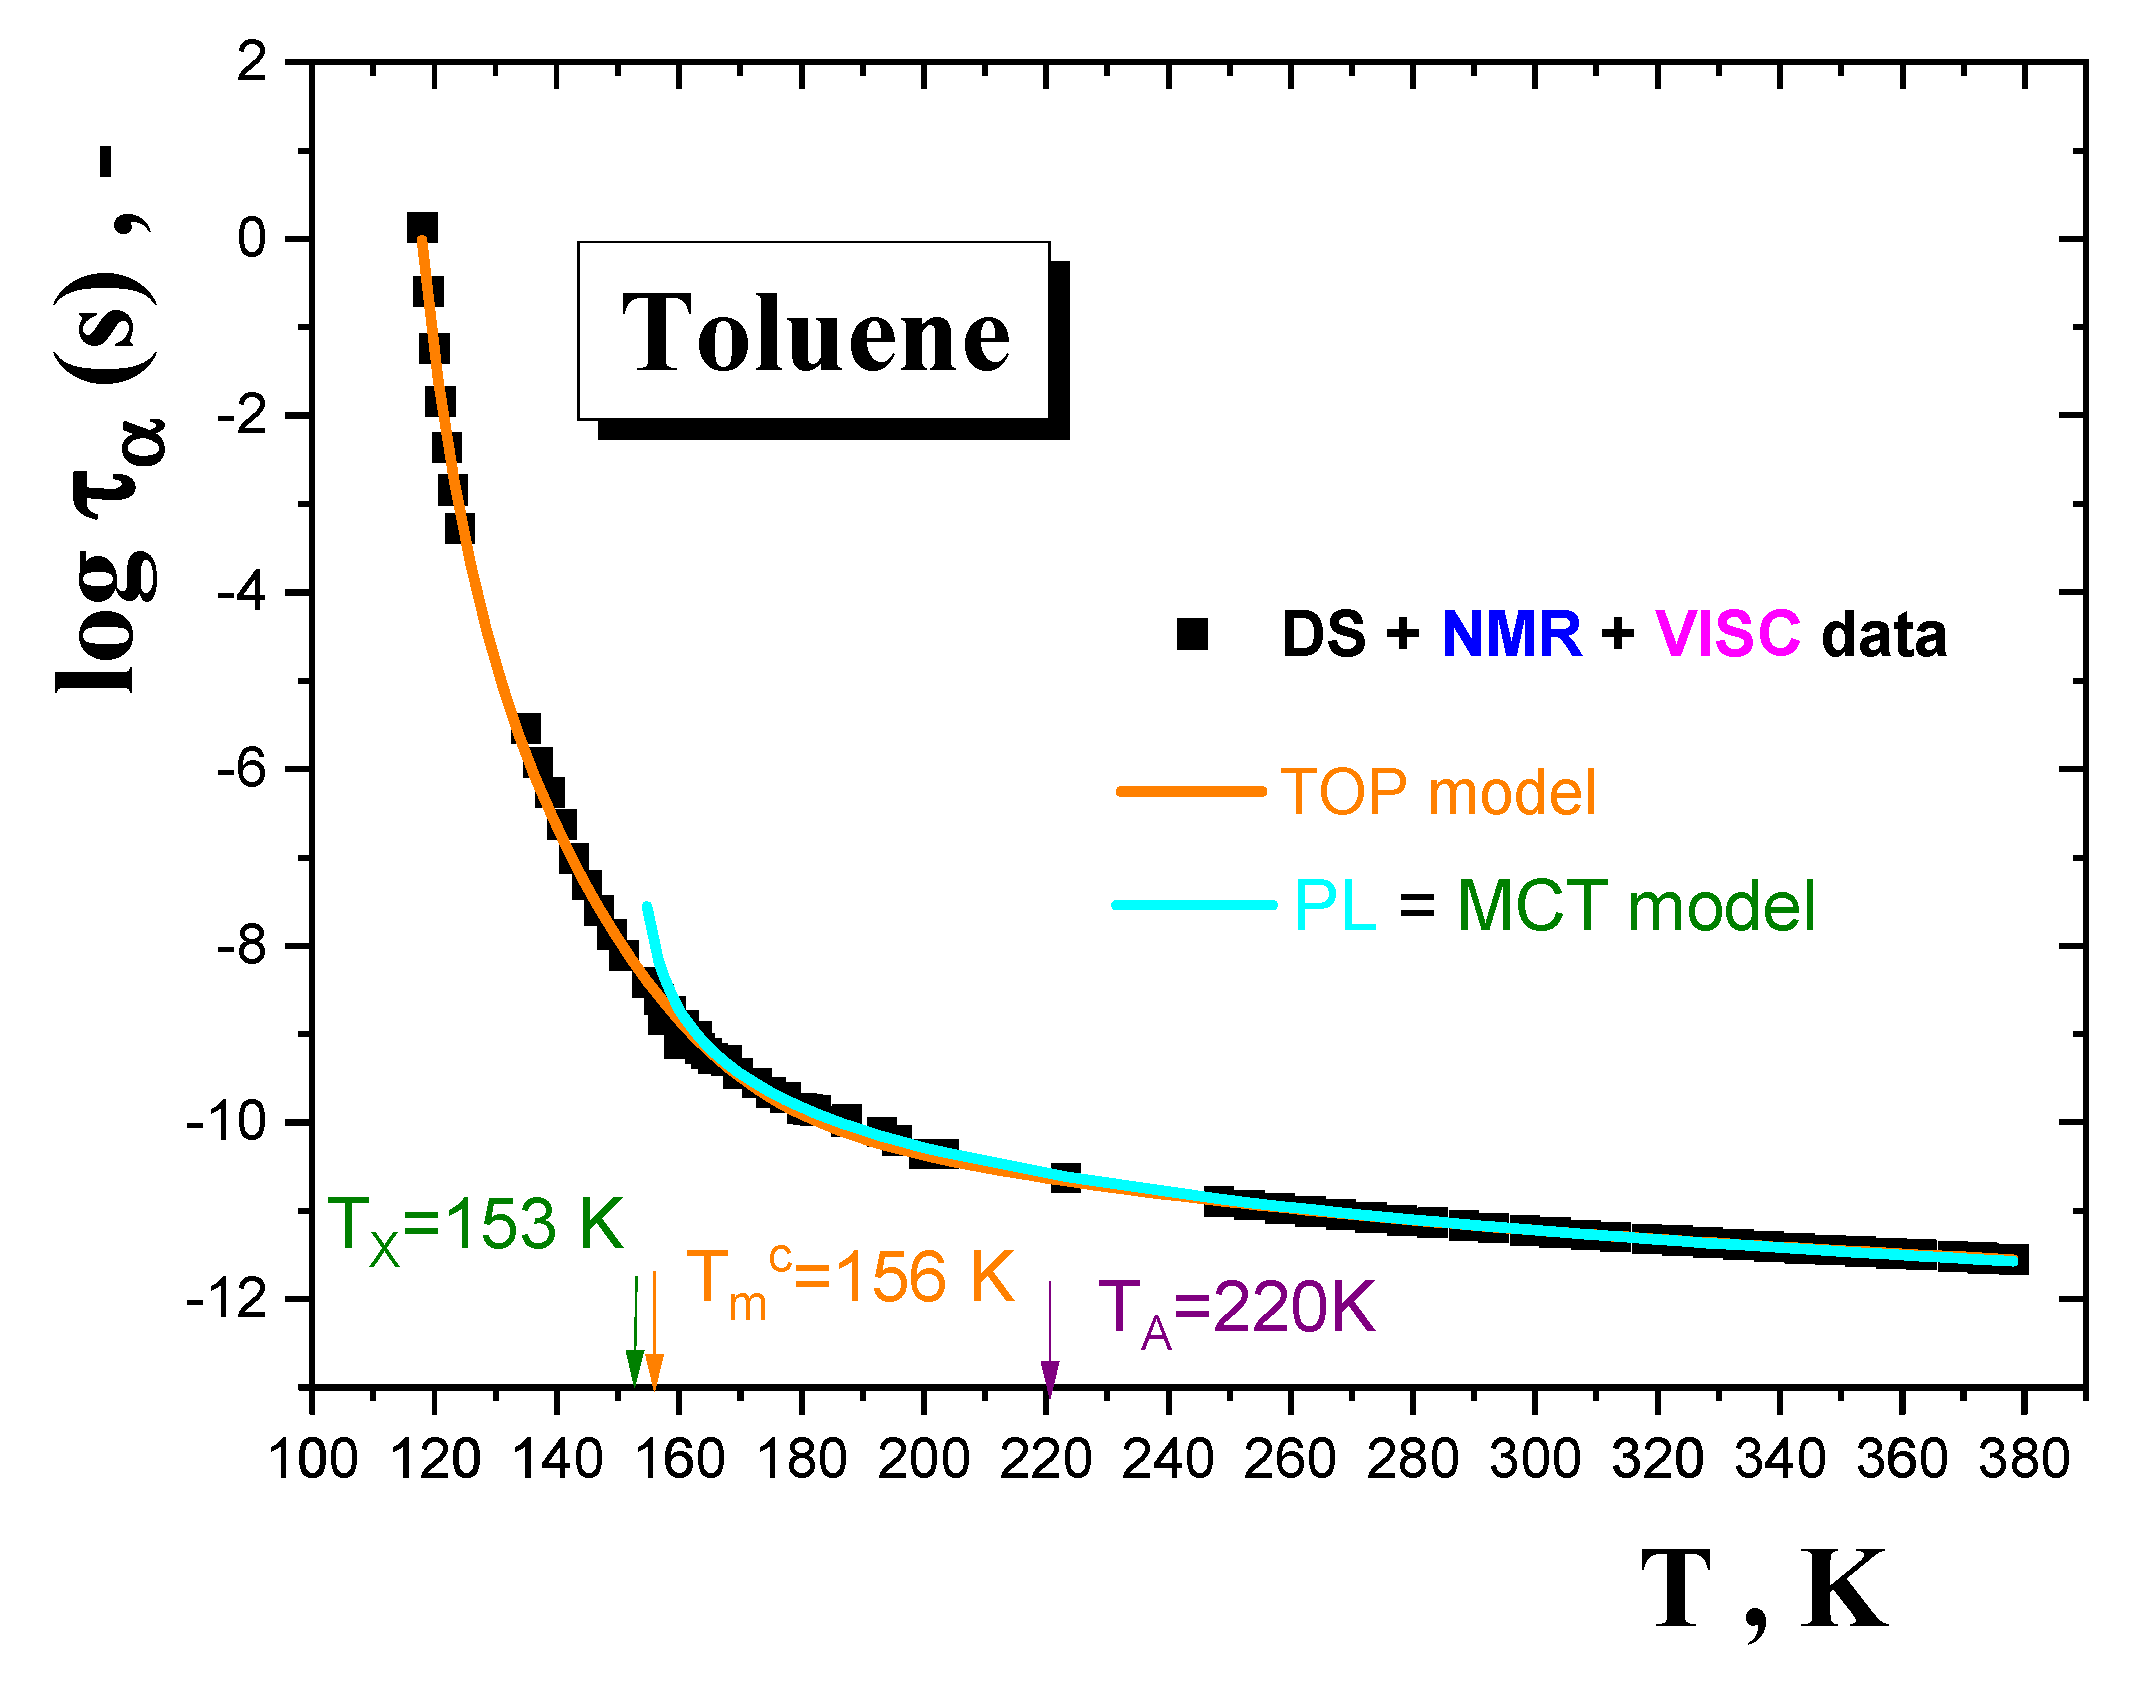
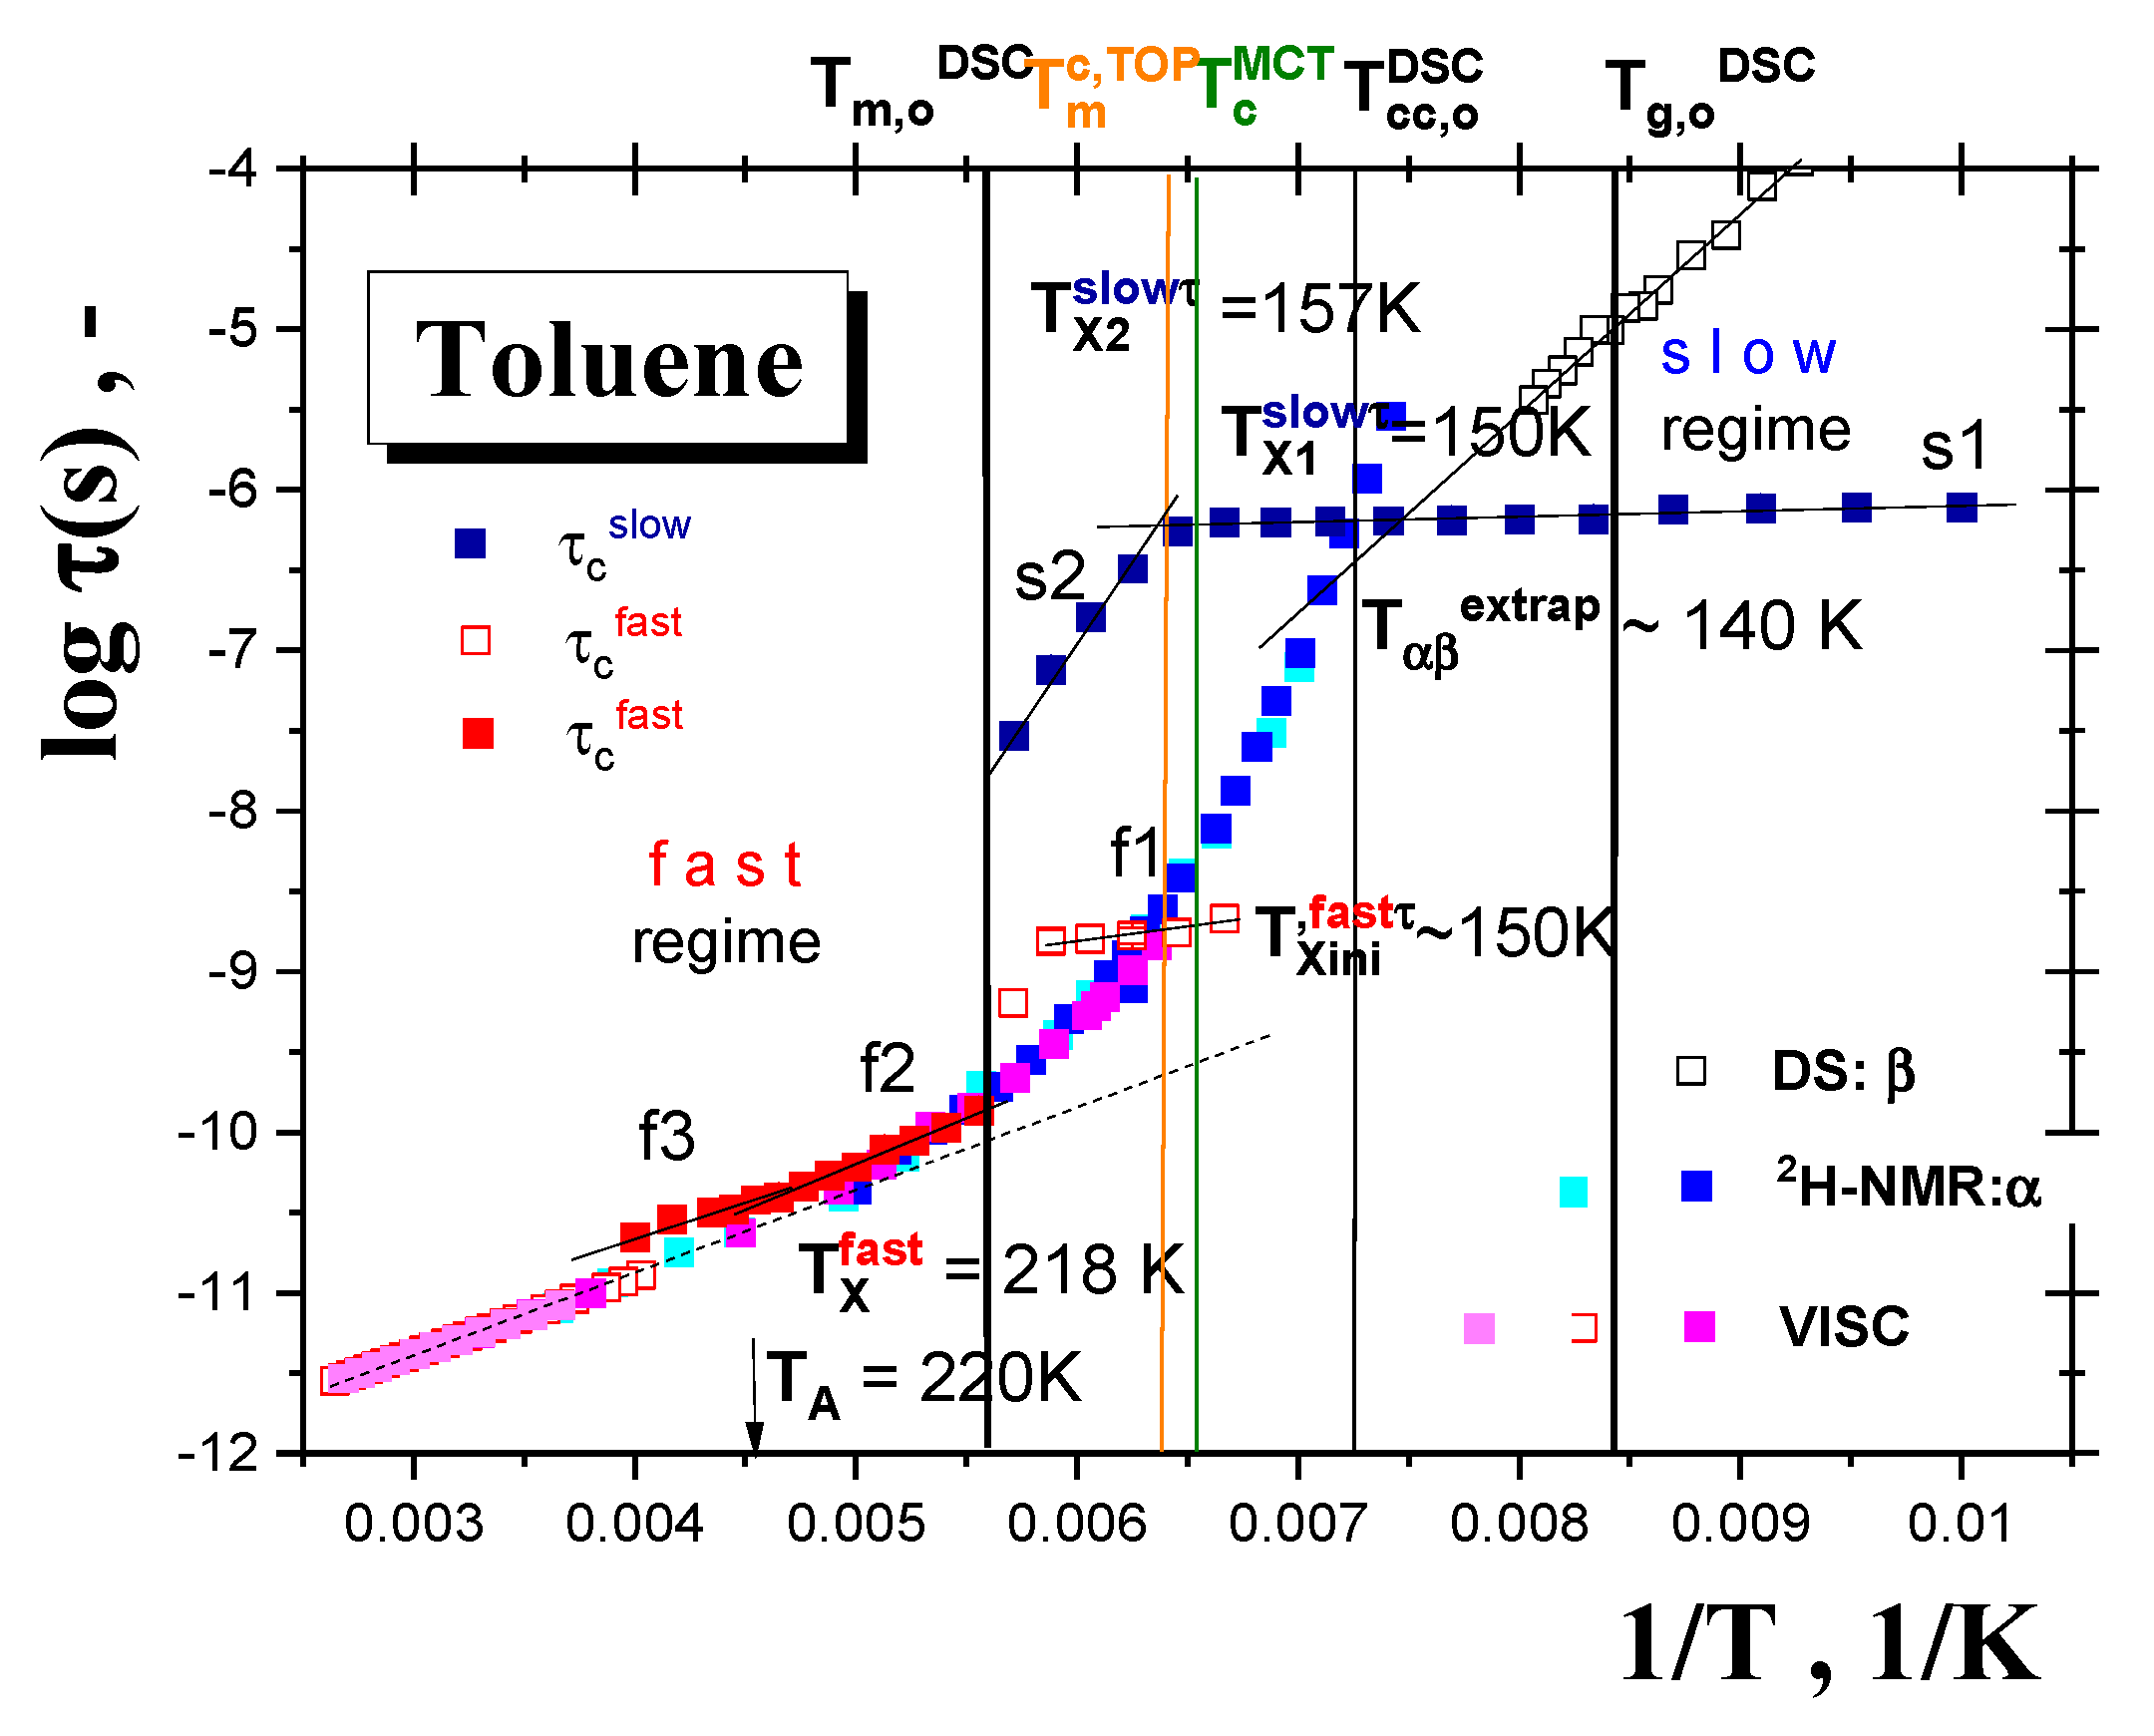
4.3. Dynamic Interpretation of the PALS and ESR Data
5. Conclusions
Author Contributions
Funding
Institutional Review Board Statement
Informed Consent Statement
Data Availability Statement
Conflicts of Interest
References
- Švajdlenková, H.; Šauša, O.; Iskrová-Miklošovicová, M.; Majerník, V.; Krištiak, J.; Bartoš, J. On the relationships between guest molecular dynamics and free volume in a series of small molecular and polymer glass-formers. Chem. Phys. Lett. 2012, 539, 39–44. [Google Scholar] [CrossRef]
- Švajdlenková, H.; Iskrová, M.; Šauša, O.; Dlubek, G.; Krištiak, J.; Bartoš, J. The Spin Probe Dynamics and the Free Volume in a Series of Amorphous Polymer Glass-Formers. Macromol. Symp. 2011, 305, 108–115. [Google Scholar] [CrossRef]
- Švajdlenková, H.; Bartoš, J. Spin probe mobility in relation to free volume and relaxation dynamics of glass-formers: A series of spin probes in poly (isobutylene). J. Polym. Sci. B Polym. Phys. 2009, 47, 1058–1068. [Google Scholar] [CrossRef]
- Bartoš, J.; Švajdlenková, H.; Šauša, O.; Lukešová, M.; Ehlers, D.; Michl, M.; Lunkenheimer, P.; Loidl, A. Molecular probe dynamics and free volume in organic glass-formers and their relationships to structural relaxation: 1-propanol. J. Phys.-Cond. Matter 2016, 28, 015101. [Google Scholar] [CrossRef]
- Bartoš, J.; Švajdlenková, H. On the mutual relationships between spin probe mobility, free volume and relaxation dynamics in organic glass-formers: Glycerol. Chem. Phys. 2017, 670, 58–63. [Google Scholar] [CrossRef]
- Švajdlenková, H.; Arrese-Igor, S.; Nógellová, Z.; Alegría, A.; Bartoš, J. Molecular dynamic heterogeneity in relation to free volume and relaxation dynamics in organic glass-formers: Oligomeric cis-1, 4-poly (isoprene). Phys. Chem. Chem. Phys. 2017, 19, 152015. [Google Scholar] [CrossRef] [Green Version]
- Bartoš, J.; Švajdlenková, H.; Zaleski, R.; Edelmann, M.; Lukešová, M. Spin probe dynamics in relation to free volume in crystalline organics by means of ESR and PALS: N-Hexadecane. Phys. B Cond. Mat. 2013, 430, 99–105. [Google Scholar] [CrossRef]
- Lukešová, M.; Zgardzinska, B.; Švajdlenková, H.; Zaleski, R.; Charmas, B.; Bartoš, J. Spin probe dynamics in relation to free volume in crystalline organics from ESR and PALS: N-tridecane. Phys. B Cond. Mat. 2015, 476, 100–108. [Google Scholar] [CrossRef]
- Bartoš, J.; Zgardzinska, B.; Švajdlenková, H.; Lukešová, M.; Zaleski, R. ESR and PALS detection of the dynamic crossover in the supercooled liquid states of short and medium-sized n-alkanes. Chem. Phys. Lett. 2018, 700, 102–107. [Google Scholar] [CrossRef]
- Švajdlenková, H.; Zgardzinska, B.; Lukešová, M.; Bartoš, J. pin probe dynamics in relation to free volume in crystalline organics from ESR and PALS: Cyclohexane. Chem. Phys. Lett. 2016, 643, 98–102. [Google Scholar] [CrossRef]
- Bartoš, J.; Corsaro, C.; Mallamace, D.; Švajdlenková, H.; Lukešová, M. ESR evidence of the dynamic crossover in the supercooled liquid states of a series of solid n-alkanes. Phys. Chem. Chem. Phys. 2018, 20, 11145. [Google Scholar] [CrossRef] [PubMed]
- De Nordwall, H.J.; Staveley, L.A.K. The formation and crystallization of simple organic and inorganic glasses. Trans. Far. Soc. 1956, 52, 1207–1215. [Google Scholar] [CrossRef]
- Alba, C.; Busse, L.E.; List, D.J.; Angell, C.A. Thermodynamic aspects of the vitrification of toluene, and xylene isomers, and the fragility of liquid hydrocarbons. J. Chem. Phys. 1990, 92, 617–624. [Google Scholar] [CrossRef]
- Domalski, E.S.; Hearing, E.D. Heat capacities and entropies of organic compounds in the condensed phase. Volume III. J. Phys. Chem. Ref. Data 1996, 25, 1–525. [Google Scholar] [CrossRef]
- Yamamuro, O.; Tsukushi, I.; Lindqvist, A.; Takahara, S.; Ishikawa, M.; Matsuo, T. Calorimetric study of glassy and liquid toluene and ethylbenzene: Thermodynamic approach to spatial heterogeneity in glass-forming molecular liquids. J. Phys. Chem. B 1998, 102, 1605–1609. [Google Scholar] [CrossRef]
- Hatase, M.; Hanaya, M.; Hikima, T.; Oguni, M. Discovery of homogeneous-nucleation-based crystallization in simple glass-forming liquid of toluene below its glass-transition temperature. Non-Cryst. Solids 2002, 307, 257–263. [Google Scholar] [CrossRef]
- Rössler, E.; Sillescu, H. 2H NMR Study of supercooled toluene. Chem. Phys. Lett. 1984, 112, 94–98. [Google Scholar] [CrossRef]
- Hinze, G.; Sillescu, H.; Fujara, F. Anisotropic motion of toluene above and below the glass transition studied by 2H NMR. Chem. Phys. Lett. 1995, 232, 154–158. [Google Scholar] [CrossRef]
- Hinze, G.; Sillescu, H.J. 2H nuclear magnetic resonance study of supercooled toluene: Slow and fast processes above and below the glass transition. Chem. Phys. 1996, 104, 314–319. [Google Scholar] [CrossRef]
- Hinze, G. Geometry and time scale of the rotational dynamics in supercooled toluene. Phys. Rev. E 1998, 57, 2010. [Google Scholar] [CrossRef]
- Döss, A.; Hinze, G.; Schiener, B.; Hemberger, J.; Böhmer, R. Dielectric relaxation in the fragile viscous liquid state of toluene. J. Chem. Phys. 1997, 107, 1740–1743. [Google Scholar] [CrossRef]
- Kudlik, A.; Tschirwitz, C.; Benkhof, S.; Blochowicz, T.; Rössler, E. Slow secondary relaxation process in supercooled liquids. Europhys. Lett. 1997, 40, 649. [Google Scholar] [CrossRef]
- Kudlik, A.; Tschirwitz, C.; Blochowicz, T.; Benkhof, S.; Rössler, E. Slow secondary relaxation in simple glass formers. J. Non-Cryst. Solids 1998, 235, 406–411. [Google Scholar] [CrossRef]
- Kudlik, A.; Benkhof, S.; Blochowicz, T.; Tschirwitz, C.; Rössler, E. The dielectric response of simple organic glass formers. J. Mol. Struct. 1999, 479, 201–218. [Google Scholar] [CrossRef]
- Wiedersich, J.; Surovtsev, N.V.; Rössler, E. A comprehensive light scattering study of the glass former toluene. J. Chem. Phys. 2000, 113, 1143–1153. [Google Scholar] [CrossRef]
- Adichtchev, S.V.; Surovtsev, N.V. Raman line shape analysis as a mean characterizing molecular glass-forming liquids. J. Non-Cryst. Solids 2011, 357, 3058–3063. [Google Scholar] [CrossRef]
- Ngai, K.L.; Capaccioli, S.; Prevosto, D.; Wang, L.M. Coupling of caged molecule dynamics to JG β-relaxation III: Van der Waals glasses. J. Phys. Chem. B 2015, 119, 12519–12525. [Google Scholar] [CrossRef]
- Berthier, L.; Ediger, M.D. Facets of glass physics. Phys. Today 2016, 69, 40. [Google Scholar] [CrossRef] [Green Version]
- Ishii, K.; Nakayama, H. Structural relaxation of vapor-deposited molecular glasses and supercooled liquids. Phys. Chem. Chem. Phys. 2014, 16, 12073–12092. [Google Scholar] [CrossRef] [PubMed]
- Leon-Gutierrez, E.; Sepúlveda, A.; Garcia, G.; Clavaguera-Mora, M.T.; Rodríguez-Viejo, J. Stability of thin film glasses of toluene and ethylbenzene formed by vapor deposition: An in situ nanocalorimetric study. Phys. Chem. Chem. Phys. 2010, 12, 1469–14698. [Google Scholar] [CrossRef]
- Yu, H.B.; Tylinski, M.; Guiseppi-Elie, A.; Ediger, M.D.; Richert, R. Suppression of β relaxation in vapor-deposited ultrastable glasses. Phys. Rev. Lett. 2015, 115, 185501. [Google Scholar] [CrossRef] [Green Version]
- Alba-Simionesco, C.; Coasne, B.; Dosseh, G.; Dudziak, G.; Gubbins, K.E.; Radhakrishnan, R.; Sliwinska-Bartkowiak, M. Effects of confinement on freezing and melting. J. Phys.-Cond. Matter 2006, 18, R15. [Google Scholar] [CrossRef]
- Alcoutlabi, M.; McKenna, G.B. Effects of confinement on material behaviour at the nanometre size scale. J. Phys.-Cond. Matter 2005, 17, R471. [Google Scholar] [CrossRef]
- Morineau, D.; Xia, Y.; Alba-Simionesco, C. Finite-size and surface effects on the glass transition of liquid toluene confined in cylindrical mesopores. J. Chem. Phys. 2002, 117, 8966–8972. [Google Scholar] [CrossRef]
- Alba-Simionesco, C.; Dosseh, C.; Dumont, E.; Frick, B.; Geil, B.; Morineau, D.; Teboul, V.; Xia, Y. Confinement of molecular liquids: Consequences on thermodynamic, static and dynamical properties of benzene and toluene. Eur. Phys. J. E 2003, 12, 19–28. [Google Scholar] [CrossRef]
- Audonnet, F.; Brodie–Linder, N.; Morineau, D.; Frick, B.; Alba-Simionesco, C. From the capillary condensation to the glass transition of a confined molecular liquid: Case of toluene. J. Non-Cryst. Solids 2015, 407, 262–269. [Google Scholar] [CrossRef]
- Lee, J.; Celitans, G.J. Oxygen Quenching of Positronium in Liquids. J. Chem. Phys. 1965, 42, 437–438. [Google Scholar] [CrossRef]
- Lee, J.; Celitans, G.J. Oxygen and nitric oxide quenching of positronium in liquids. J. Chem. Phys. 1966, 44, 2506–2511. [Google Scholar] [CrossRef]
- Gray, P.R.; Cook, C.F.; Sturm Jr, G.P. Correlation of triplet positronium annihilation parameters with structural and electronic properties of organic liquids. J. Chem. Phys. 1968, 48, 1145–1157. [Google Scholar] [CrossRef]
- Thosar, B.V.; Laciu, R.G.; Kulkarni, V.G.; Chandra, G. Dependence of Positron Lifetimes on the Temperature and Phase of Some Organic Media. Phys. Stat. Sol. 1973, B55, 415–426. [Google Scholar] [CrossRef]
- Mogensen, O.E.; Jacobsen, F.M. Positronium yields in liquids determined by lifetime and angular correlation measurements. Chem. Phys. 1982, 73, 223–234. [Google Scholar] [CrossRef]
- Buchachenko, A.L.; Wasserman, A.M.; Kovarskii, A.L. Kinetics of molecular motions in liquids and its correlation with kinetics of radical liquid-phase reactions. Int. J. Chem. Kinetics 1969, 1, 361–370. [Google Scholar] [CrossRef]
- Buchachenko, A.L.; Kovarskii, A.L.; Vasserman, A.M. Study of polymers by the paramagnetic probe method. In Advances in Polymer Science; Rogovin, Z.A., Ed.; Wiley: New York, NY, USA, 1974. [Google Scholar]
- Zgardzińska, B.; Białko, W.; Jasińska, B. Ortho-para spin conversion of Ps by paramagnetic O2 dissolved in organic compounds. Nukleonika 2015, 60, 801–804. [Google Scholar] [CrossRef] [Green Version]
- Kansy, J. Microcomputer program for analysis of positron annihilation lifetime spectra. Nucl. Instrum. Methods Phys. Res. A 1996, 374, 235–244. [Google Scholar] [CrossRef]
- Rabold, G.P. Spin-probe studies. I. Applications to latexes and micelle characterization; Spin-probe studies. II. Applications to polymer characterization. J. Polym. Sci. 1969, A17, 121. [Google Scholar]
- Goldman, S.A.; Bruno, G.V.; Polnaszke, C.F.; Freed, J.H. Local dynamics of polymers in solution by spin label ESR. J. Phys. Chem. 1972, 56, 716–735. [Google Scholar] [CrossRef]
- Freed, J.H.; Fraenkel, G.K. Theory of linewidths in electron spin resonance spectra. J. Chem. Phys. 1963, 39, 326–348. [Google Scholar] [CrossRef]
- Freed, J.H.; Fraenkel, G.K. Linewidth Studies in Electron Spin Resonance Spectra: The Para and Ortho Dinitrobenzene Anions. J. Chem. Phys. 1964, 40, 1815–1829. [Google Scholar] [CrossRef]
- Budil, D.E.; Lee, S.; Saxena, S.; Freed, J.H. Nonlinear-least-squares analysis of slow-motion EPR spectra in one and two dimensions using a modified Levenberg–Marquardt algorithm. J. Magn. Reson. Ser. A 1996, 120, 155–189. [Google Scholar] [CrossRef] [Green Version]
- Batschinski, A.J. Investigations of the internal friction of fluids. Z. Phys. Chem. 1913, 84, 643. [Google Scholar] [CrossRef]
- Rossini, G. Selected Values of Physical and Thermodynamic Properties of Hydrocarbons and Related Compounds. Comprising the Tables of the American Petroleum Institute Research Project 44, December 31, 1952; Carnegie Press: Pittsburgh, PA, USA, 1953. [Google Scholar]
- Barlow, A.J.; Lamb, J.; Matheson, A.J. Viscous behaviour of supercooled liquids. Proc. Roy. Soc. 1966, A292, 322–342. [Google Scholar]
- Popova, V.A.; Surovtsev, N.V. Temperature dependence of the Landau-Placzek ratio in glass forming liquids. J. Chem. Phys. 2011, 135, 134510. [Google Scholar] [CrossRef]
- Caruthers, J.M.; Medvedev, G.A. Quantitative model of super-Arrhenian behavior in glass forming materials. Phys. Rev. Mater. 2018, 2, 055604. [Google Scholar] [CrossRef]
- Malhotra, B.D.; Pethrick, R.A. Positron annihilation studies of supercooled liquids. ortho-terphenyl. Chem. Soc. Faraday Trans. II 1982, 78, 297–306. [Google Scholar] [CrossRef]
- Bartoš, J.; Šauša, O.; Krištiak, J.; Blochowicz, T.; Rössler, E. Free-volume microstructure of glycerol and its supercooled liquid-state dynamics. J. Phys.-Cond. Matt. 2001, 13, 11473. [Google Scholar] [CrossRef]
- Bartoš, J.; Šauša, O.; Račko, D.; Krištiak, J.; Fontanella, J.J. Positron annihilation lifetime response and relaxation dynamics in glycerol. J. Non-Cryst. Solids 2005, 351, 2599–2604. [Google Scholar] [CrossRef]
- Bartoš, J.; Majernik, V.; Iskrová, M.; Šauša, O.; Krištiak, J.; Lunkenheimer, P.; Loidl, A. Positron annihilation response and broadband dielectric spectroscopy: Propylene carbonate. J. Non-Cryst. Solids 2010, 356, 794–799. [Google Scholar] [CrossRef]
- Bartoš, J.; Iskrová, M.; Köhler, M.; Wehn, R.; Šauša, O.; Lunkenheimer, P.; Krištiak, J.; Loidl, A. ositron annihilation response and broadband dielectric spectroscopy: Salol. Eur. Phys. J. E 2011, 34, 104. [Google Scholar] [CrossRef]
- Ito, Y.; Mohamed, H.F.M.; Tanaka, K.; Okamoto, K.; Lee, K. Sorption of CO2 in polymers observed by positron annihilation technique. J. Radioanal. Nucl. Chem. 1996, 211, 211–218. [Google Scholar] [CrossRef]
- Zgardzińska, B.; Goworek, T. Positronium bubble in liquid alkanes and alcohols. Chem. Phys. 2012, 405, 32–39. [Google Scholar] [CrossRef]
- Winberg, P.; Eldrup, M.; Maurer, F.H.J. Free volume dilatation in polymers by ortho-positronium. Chem. Phys. 2012, 136, 244902. [Google Scholar] [CrossRef] [Green Version]
- Taborek, P.; Kleiman, R.N.; Bishop, D.J. Power-law behavior in the viscosity of supercooled liquids. Phys. Rev. B Condens. Matter Mater. Phys. 1986, 34, 1835. [Google Scholar] [CrossRef] [PubMed]
- Götze, W.; Sjögren, L. Relaxation processes in supercooled liquids. Rep. Prog. Phys. 1992, 55, 241. [Google Scholar] [CrossRef]
- Götze, W. Recent tests of the mode-coupling theory for glassy dynamics. J. Phys.-Condens. Matter 1999, 11, A1. [Google Scholar] [CrossRef]
- Krakoviack, V.; Alba-Simionesco, C.; Krauzman, M. Study of the depolarized light scattering spectra of supercooled liquids by a simple mode-coupling model. J. Chem. Phys. 1997, 107, 3417–3427. [Google Scholar] [CrossRef] [Green Version]
- Mallamace, F.; Branca, C.; Corsaro, C.; Leone, N.; Spooren, J.; Chen, S.H.; Stanley, H.E. Transport properties of glass-forming liquids suggest that dynamic crossover temperature is as important as the glass transition temperature. Proc. Natl. Acad. Sci. USA 2010, 107, 22457–22462. [Google Scholar] [CrossRef] [PubMed] [Green Version]
- Tanaka, H. A simple physical model of liquid-glass transition: Intrinsic fluctuating interactions and random fields hidden in glass-forming liquids. J. Phys.-Condens. Matter 1998, 10, L207. [Google Scholar] [CrossRef]
- Tanaka, H. Two-order-parameter description of liquids: Critical phenomena and phase separation of supercooled liquids. J. Phys.-Condens. Matter 1999, 11, L159. [Google Scholar] [CrossRef]
- Tanaka, H. Two-order-parameter description of liquids. I. A general model of glass transition covering its strong to fragile limit. J. Chem. Phys. 1999, 111, 3163. [Google Scholar] [CrossRef]
- Tanaka, H. Two-order-parameter description of liquids. II. Criteria for vitrification and predictions of our model. J. Chem. Phys. 1999, 111, 3175. [Google Scholar] [CrossRef]
- Tanaka, H. Two-order-parameter model of the liquid glass transition. I. Relation between glass transition and crystallization. J. Non-Cryst. Solids 2005, 351, 3371. [Google Scholar] [CrossRef]
- Tanaka, H. Two-order-parameter model of the liquid–glass transition. II. Structural relaxation and dynamic heterogeneity. J. Non-Cryst. Solids 2005, 351, 3385. [Google Scholar] [CrossRef]
- Tanaka, H. Two-order-parameter model of the liquid–glass transition. III. Universal patterns of relaxations in glass-forming liquids. J. Non-Cryst. Solids 2005, 351, 3396. [Google Scholar] [CrossRef]


Publisher’s Note: MDPI stays neutral with regard to jurisdictional claims in published maps and institutional affiliations. |
© 2022 by the authors. Licensee MDPI, Basel, Switzerland. This article is an open access article distributed under the terms and conditions of the Creative Commons Attribution (CC BY) license (https://creativecommons.org/licenses/by/4.0/).
Share and Cite
Bartoš, J.; Zgardzińska, B.; Švajdlenková, H.; Charmas, B.; Lukešová, M.; Wysogląd, K.; Goździuk, M. A Combined Atomic and Molecular Probe Characterization of Aromatic Hydrocarbons via PALS and ESR: Methylbenzene. Materials 2022, 15, 462. https://doi.org/10.3390/ma15020462
Bartoš J, Zgardzińska B, Švajdlenková H, Charmas B, Lukešová M, Wysogląd K, Goździuk M. A Combined Atomic and Molecular Probe Characterization of Aromatic Hydrocarbons via PALS and ESR: Methylbenzene. Materials. 2022; 15(2):462. https://doi.org/10.3390/ma15020462
Chicago/Turabian StyleBartoš, Josef, Bożena Zgardzińska, Helena Švajdlenková, Barbara Charmas, Miroslava Lukešová, Konrad Wysogląd, and Magdalena Goździuk. 2022. "A Combined Atomic and Molecular Probe Characterization of Aromatic Hydrocarbons via PALS and ESR: Methylbenzene" Materials 15, no. 2: 462. https://doi.org/10.3390/ma15020462