
The Preparation of a Carbonaceous Adsorbent via Batch Pyrolysis of Waste Hemp Shives

1
Department of Gaseous and Solid Fuels and Air Protection, University of Chemistry and Technology Prague, 166 28 Prague, Czech Republic
2
Department of Power Engineering, University of Chemistry and Technology Prague, 166 28 Prague, Czech Republic
3
Institute of Chemical Process Fundamentals, The Czech Academy of Sciences, 165 02 Prague, Czech Republic
*
Author to whom correspondence should be addressed.
Energies 2023, 16(3), 1202; https://doi.org/10.3390/en16031202
Submission received: 29 December 2022
/
Revised: 17 January 2023
/
Accepted: 18 January 2023
/
Published: 21 January 2023
Abstract
:The study focuses on the two-stage process of the thermal treatment of waste hemp shives aimed at obtaining a carbonaceous adsorbent. In the first stage, pyrolysis was carried out in a retort apparatus, which, at temperatures in the range of 450–850 °C, provided approximately 22.6–29.9% of the solid residue, 31.6–34.0% of the condensate, and 38.5–43.4% of gas with respect to the charge. The organic part of the condensates showed the net calorific value of 30.8–31.3 MJ kg−1, which makes it well suited for energy purposes. In the separated pyrolysis gases, GC-TCD-FID determined only five compounds, namely carbon dioxide, carbon monoxide, hydrogen, methane, and ethane, which together accounted for 98.5–99.8% of the gas volume. The remainder was composed mainly of ethene, propane, and propene. The highest net calorific value (14.7–14.8 MJ m−3) was exhibited by the gas collected in the range of 450–650 °C, which can be advantageously used for energy purposes. Non-activated solid pyrolysis residues had relatively low specific surface areas (BET), with the highest value determined being 294 m2 g−1. Therefore, they were activated by steam in a separate apparatus in the temperature range of 740–900 °C. The activation apparatus operated with a batch reactor of similar design to the pyrolysis retort. The activation increased the specific surface area of the pyrolysis residues up to the maximum of 915 m2 g−1. This study discusses the significant trends in specific surface area and total pore volume caused by a combination of different pyrolysis and activation temperatures. Better results were generally obtained for residues pyrolyzed at lower temperatures and then activated at high temperatures. The structure of the activated products mostly contained pores with a diameter of < 6 nm. Their development was mainly facilitated by the activation temperature of 850 °C, resulting in the relative presence of these pores in the range of 57.9–59.1%. All activated products were also characterized by an increased proportion of 20–80 nm pores, which formed, however, approximately one-third in comparison with the pores < 6 nm. Last but not least, the study also discusses the effect of activation conditions on the process loss of the product.
1. Introduction
Activated carbon (AC) is a widely used adsorbent material with a highly porous structure that is typically characterized by its specific surface area and total specific pore volume. This porous structure allows AC to have a high sorption capacity towards various substances. The most widespread industrial applications of AC are the adsorption of organic pollutants and heavy metals from wastewater or flue gas [1,2,3]. AC is also used in hydrogen storage, carbon dioxide capture [4,5], energy storage (capacitors and supercapacitors) [6], and advanced separation of highly hazardous micropollutants, such as drug residues and hormonal disruptors [7,8,9]. These applications, together with tightening emission limits, are leading to an increased demand for AC in the EU and globally. The continuously found directions for the further use of AC indicate the strengthening of its significance in the future, and the environmental and economic importance of its production from waste raw materials is increasing [10,11]. AC is produced by thermochemical processes involving carbonization and activation steps, the nature of which can be physical or chemical. Since the typical feedstock for AC production is non-renewable coal, the use of renewable lignocellulosic biomass, especially waste biomass, could be beneficial for the environment [1,2,3].
Industrial hemp is a fast-growing lignocellulosic biomass, the production of which is on the increase. Traditionally, hemp fibers were used in the manufacture of ropes, textiles, and paper, as well as sails for ships. In the middle of the 20th century, low production prices of jute and cotton led to a decline in hemp production [12,13]. Unlike cotton and other conventional crops, hemp requires less irrigation, it is resistant to pests and diseases, and it also needs lower doses of pesticides for weed control [13]. In the past, hemp was primarily cultivated for its fibers; now, on the other hand, it is also planted for its seeds and secondary metabolites, including cannabinoids (e.g., CBD), terpenes, and flavonoids from the leaves and stems of the inflorescence [14]. Along with the resulting recovery in cannabis cultivation, the amount of waste biomass is increasing as well. For example, the processing of hemp stems into fiber involves the separation of woody parts and hemp shives, the latter of which are mostly used as animal bedding [12,15], but also as a raw material for composite building materials [16]. Hemp shives, especially their low-quality and powder fraction, may be used for the production of AC as well.
Hemp-based AC was studied by many researchers, most of whom focused on its preparation by chemical activation and the interaction of the raw material (hemp fibers, shives) with acids, bases, or salts. Some of these researchers investigated potassium hydroxide as an activating agent and presented specific surfaces ranging from 1.324 to 3.241 m2 g−1 and specific pore volumes between 0.95 and 1.98 cm3 g−1 [17,18,19,20,21,22,23,24]. When phosphoric acid was used as an activating agent, the specific surface area ranged from 1.142 to 1.574 m2 g−1 and the total specific pore volume was between 0.6 and 1.25 cm3 g−1 [25,26,27]. Lupul et al. studied the preparation of AC from hemp stems by chemical activation with phosphoric acid while testing the effect of water vapor during this activation. This approach provided a specific surface area of 2560 m2 g−1 and resulted in the total specific pore volume of 2.12 cm3 g−1 [28]. Williams and Reed tested zinc chloride as an activating agent when preparing AC from hemp fabric (textile waste); they published a specific surface area of slightly over 2000 m2 g−1 and a total specific pore volume of 1.1 cm3 g−1 [29]. Liu et al. prepared AC from hemp shives using zinc chloride as an activating agent and obtained a specific surface area of 1431 m2 g−1 and the total specific pore volume of 0.58 cm3 g−1 [30].
The data reported from chemical activation thus indicate promising results. Yet there are also numerous studies dealing with AC prepared by physical activation of cannabis. They suggest that likewise physical activation involving the use of gaseous agents, such as carbon dioxide and steam, could provide an aqueous alternative. Liu et al. also prepared AC from hemp shives by physical activation with carbon dioxide; they published a specific surface area of 632 m2 g−1 and the total specific pore volume of 0.35 cm3 g−1 [30]. Williams and Reed produced AC by physical activation with steam from non-woven hemp fabrics and achieved a specific surface area of 900 m2 g−1 and the total specific pore volume of 0.57 cm3 g−1 [31]. The specific surface area and the total pore volume, as well as the yield of AC prepared by chemical activation, clearly exceeded these parameters for physical activation. Nevertheless, the main drawbacks of the chemical route are obvious: the use of the aforementioned chemicals as such and the associated wastewater production. Not only does physical activation avoid both of these drawbacks, but it is also capable of producing AC with satisfactory parameters. So far, however, the range of experimental conditions using physical activation is limited and, to our knowledge, no study is yet to address the preparation of AC from low-quality hemp shives as feedstock. Furthermore, the studies available do not clarify the trend created by varying activation conditions in the specific surface area, the total pore volume, pore size distribution, and AC yield over a wide range of pyrolysis temperatures and activating-agent exposure times. On the basis of the described current state of knowledge, corresponding objectives of the study were formulated.
2. Materials and Methods
2.1. Input Raw Material
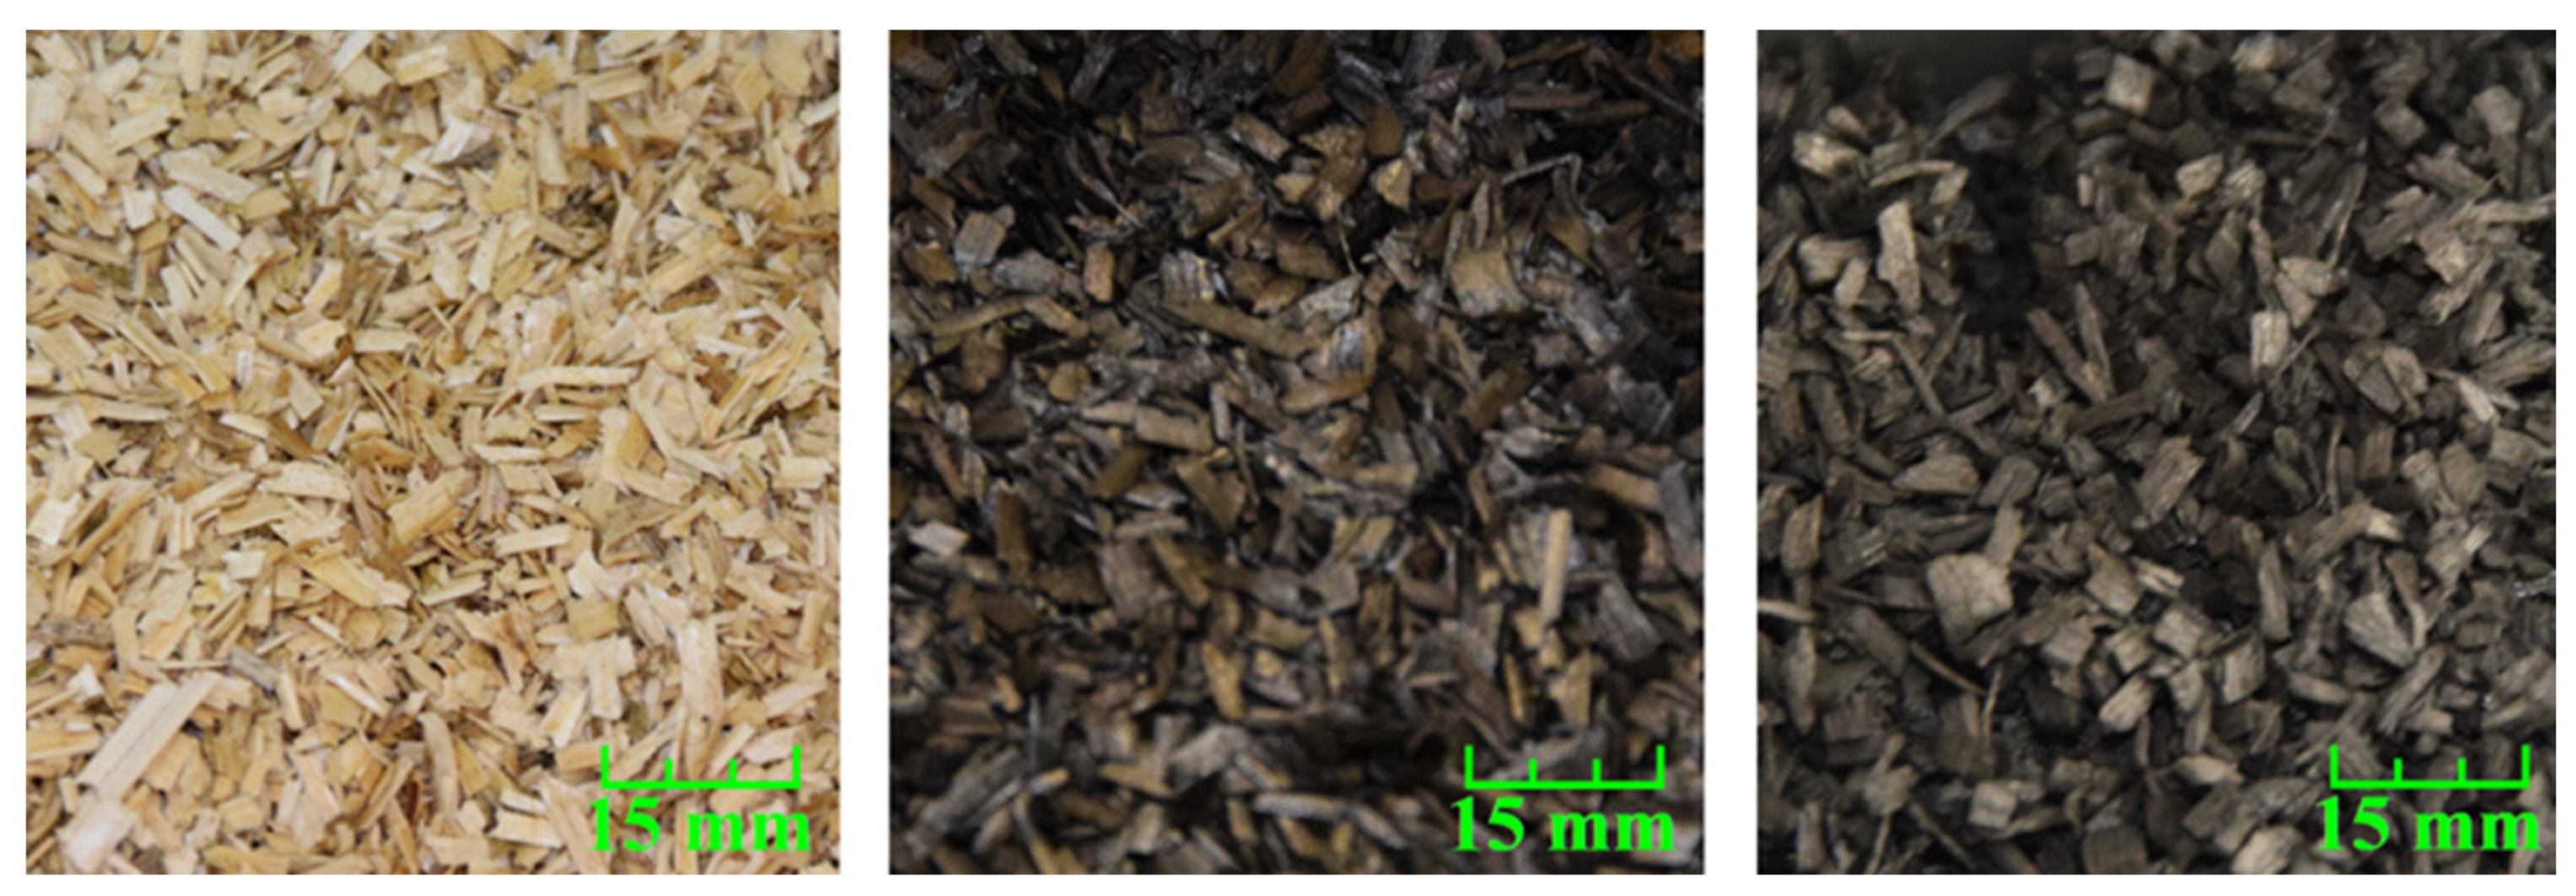
The carbon sorbent from the waste biomass was prepared from the shives and stalks of Cannabis sativa, commonly known as industrial hemp. These comprised the residue from the industrial processing of hemp for fiber. During the process of retting, the fibers are separated from the rest of the stalk, a large part of which consists of a woody part, or shives. The polydisperse material, comprising mainly oblong stem residues, was sieved to a fraction of 5–10 mm. Photographs of the raw material and the solid residues before activation are shown in Figure 1. The basic technical parameters of the tested material are summarized in Table 1.
2.2. Experimental Equipment and Conditions
During the experiments, two batch self-designed apparatuses were used. The first one provided solid pyrolysis residue and the second one enabled its activation by steam. Both apparatuses used identically designed retorts/reactors, with an inner diameter of 30 mm and the total length of 310 mm. The retorts/reactors, were heated by vertical electric furnaces. A detailed description of the two apparatuses is attached in the Appendix A. Steam activation consisted of controlled injection of distilled water by a high-pressure pump into an inert gas stream, followed by heating the mixture as it passed through a heated capillary. The prepared steam was then introduced into the layer of solid pyrolysis residue preheated to the desired temperature.
Each experiment thus consisted of two independent phases: pyrolysis and the activation of the pyrolysis residue. Basic numerical data on the experimental conditions are summarized in Table 2. A detailed description of the pyrolysis and activation is also available in the Appendix B.
2.3. Analytical Methods
Mainly the following analytical methods were used to characterize the feedstock and the products obtained.
Textural properties, namely the specific surface area, the total pore volume, and the pore size distribution, were determined by a Coulter SA 3100 automatic analyzer (manufactured by Beckman Coulter, Inc., Brea, CA, USA). The system uses reversible adsorption of nitrogen vapor at the boiling point of liquid nitrogen at atmospheric pressure (−196 °C). The samples were degassed at 150 °C before the measurement. The pressure difference was measured by stepwise addition of defined amounts of nitrogen to the measuring cell. After the formation of a molecular monolayer on the sample surface, the specific surface area was calculated using the BET equation based on the knowledge of the area occupied by one N2 molecule and the number of adsorbed molecules. In the next step, adsorption was performed, which led to the formation of multilayers, and the pore size distribution was calculated from the obtained adsorption isotherm by the BJH method. Once the pores were completely filled, the total pore volume was determined based on the knowledge of the adsorbate density.
In addition to the textural properties, the values of true and apparent density, as well as bulk density, were determined to compare the unactivated and activated solid pyrolysis residues. An Ultrapyc 5000 helium pycnometer (manufactured by Anton Paar QuantaTec Inc., Boynton Beach, FL, USA) was used to determine the true density. The helium pycnometer used works on the principle of measuring the He 6.0 pressure difference between the measuring and reference cells at constant temperature. Measurements were carried out at the target pressure of 19.0 psi (131 kPa) and the target temperature of 25.0 °C, as recommended by the manufacturer. The space of the measuring cell with the sample was evacuated between the measurement cycles. The apparent density was also determined by the pycnometric method, using a pycnometric medium in the form of a liquid that did not wet the surface of the sample and did not penetrate the pores, but filled the free space between the sample particles. Specifically, a PoreMaster 60 mercury porosimeter (manufactured by Anton Paar GmbH, Graz, Austria) was used.
Since there is no specific standard for the assessment of bulk density in the case adsorbents, this parameter was determined in accordance with EN ISO 23145-2: fine ceramics (advanced ceramics and advanced technical ceramics) and determination of bulk density of the untapped density of ceramic powders.
The solid products were also subjected to organic elemental analysis (OEA). The method consists of the combustion of the sample at high temperature in a stream of pure oxygen in order to convert all thermolabile and combustible forms of C, H, N, and S to gaseous oxides; their concentration is subsequently determined chromatographically using a thermal conductivity detector (TCD). Specifically, a Flash EA 1112 analyzer (manufactured by Thermo Electron Corporation, Bennekom, The Netherlands) was utilized. The instrument uses a modified Dumas method of the flash combustion of a sample dosed by an autosampler into a combustion chamber preheated to 900–1000 °C, followed by oxygen injection.
The pyrolysis gases collected were analyzed on an Agilent 6890 gas chromatograph (manufactured by Agilent Technologies, Santa Clara, CA, USA) with a packed pre-column and three capillary columns, using a combination of TCD and FID detectors for component detection.
The calorific values of the organic part of the pyrolysis condensates were determined by a C 200 combustion calorimeter (manufactured by IKA-Werke GmbH & Co. KG, Staufen, Germany) in accordance with DIN 51900.
3. Results and Discussion
3.1. Pyrolysis
During pyrolysis, gas volumes and condensate masses were recorded online, whereas solid residue masses were recorded once after the test. The online data records are commented on in more detail in the Appendix C. The mass balance presented below is given by the arithmetic averages of nine independent tests at each final temperature, which served as a source of a sufficient amount of solid residue for subsequent activation experiments.
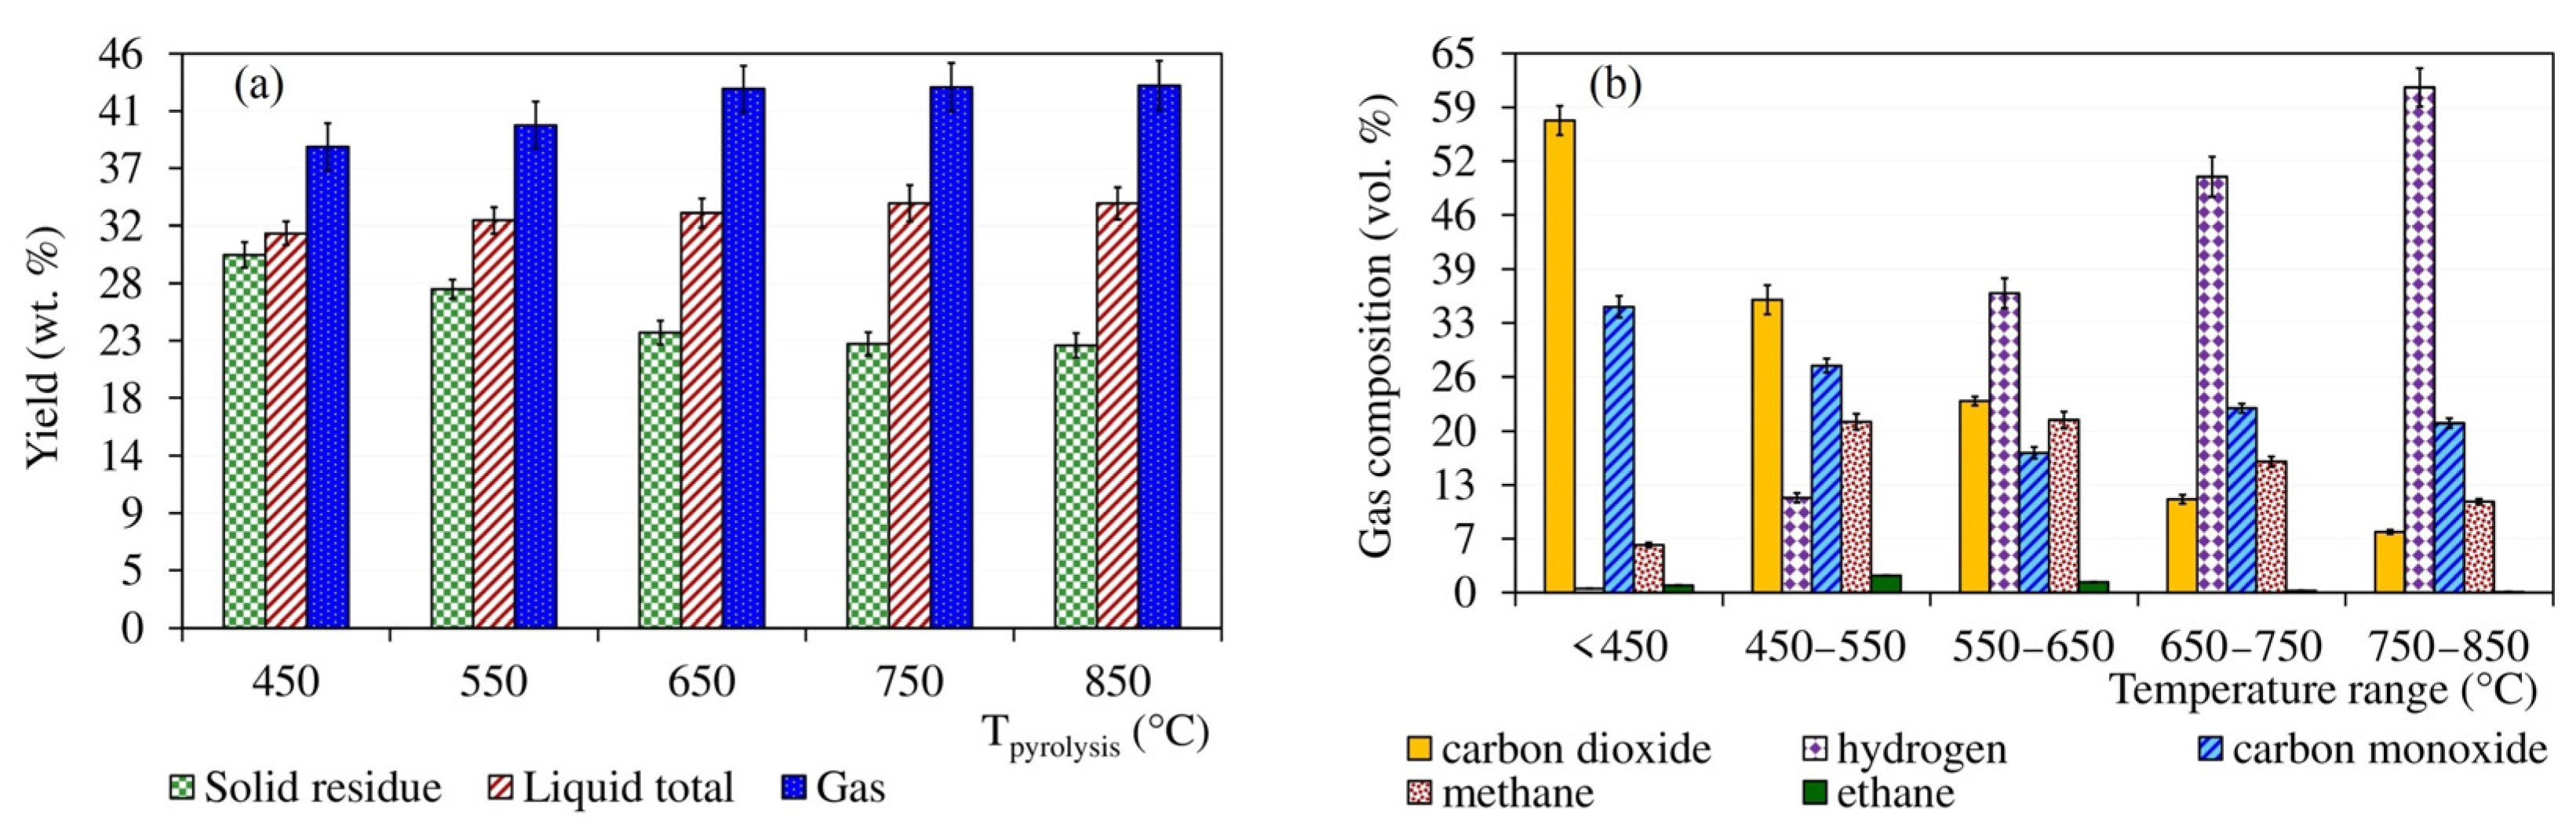
The bar graph in Figure 2 on the left (a) compares the mass balances of the solid, liquid, and gas phases for independent pyrolysis tests carried out up to the final temperatures of 450–850 °C. In contrast, the bar graph in Figure 2 on the right (b) shows the changes in the volume fractions of the five most important components of the gas collected at different temperature intervals of the pyrolysis up to the final temperature of 850 °C. The gas masses and compositions shown in the graph in Figure 2a,b were calculated based on chromatographic analysis using GC-TCD-FID.
The ratio of the yields of solid, liquid, and gaseous products as a function of the final pyrolysis temperature can be commented on as follows: The yield of solid residue generally decreased with increasing final pyrolysis temperature, significantly at 450 and 550°C, when it decreased from 29.9% (with respect to feedstock charge) to 27.1% on average. Conversely, between 750 and 850 °C, the decrease was minimal and the residue yield was 22.7 and 22.6%, respectively. Taking into account standard deviations of 0.93–1.02 g 100 g−1 (see the error bars in Figure 2), this difference is negligible. Condensate production increased with the final pyrolysis temperature from 31.6% at 450 °C until 750 °C, when it stagnated at 34.0%. In terms of potential energy utilization of the condensate, the problem is that most of it was composed of aqueous phase. The organic-to-aqueous-phase mass ratio was in the range of 1:12–1:13. The net calorific value of the organic part of the condensate, determined according to DIN 51900, was independent of the final pyrolysis temperature and was in the range of 30.8–31.3 MJ kg−1. The analysis of the feedstock in Table 2 shows that most of the water came from the pyrolysis process and not from the moisture content of the sample. The separated aqueous phase showed an acidic pH in the range of 1.8–2.2, with no apparent trend depending on the final pyrolysis temperature.
Cannabis generally produced large amounts of gas, the volume of which depended on the final pyrolysis temperature. In contrast to the solid residue and condensate, the total gas volume increased over the entire range of the set pyrolysis temperatures. Under normal pressure and temperature of 25 °C, the volume of the gas generated by pyrolysis up to 450 °C was 271 cm3 g−1 (with respect to sample charge), which pyrolysis up to 850 °C increased to 334 cm3 g−1. A total of five compounds, namely carbon dioxide, carbon monoxide, hydrogen, methane, and ethane, accounted for 98.5–99.8% of the volume of the gas produced. The rest up to 100% was composed mainly of ethene, propane, and propene. The graph in Figure 2, right, shows the dominance of carbon dioxide and carbon monoxide at lower gas temperatures. In gas samples collected up to 450 °C, they represented almost 57.0 and 34.5 vol.%, respectively. In samples accumulated between 750 and 850 °C, the volume fractions of these components were only 7.3 and 20.4%. The trend of hydrogen release was exactly the opposite. In the gas collected up to 450 °C, its volume fraction was only 0.5%, whereas in the gas obtained in the range of 750–850 °C, it represented the main component with the content of 60.9%. Methane production, on the other hand, peaked at intermediate temperatures in the range of 450–650 °C, when its volume fraction reached 20.8%.
The evolution of the total gas mass obtained by pyrolysis up to different final temperatures corresponded to these trends as well. The total mass yield of the gas significantly increased, namely from 38.5 to 43.2%, with pyrolysis temperature between 450 and 650 °C. However, due to the predominance of hydrogen at higher temperatures, the yield increased only slightly—from 43.3 at 750 °C to 43.4% at 850 °C. If standard deviations in the range of 1.86–2.00 g 100 g−1 (see Figure 2) are taken into account, the last-mentioned increase in gas yield can be considered inconclusive. The composition of the gas was also reflected in its relatively low calorific value. The gas obtained up to 450 °C reached only 7.7 MJ m−3 (101 kPa, 20 °C). The highest net calorific value of 14.7–14.8 MJ m−3 was exhibited by gas collected between 450 and 650 °C. This was followed by another decline due to the dominance of hydrogen, resulting in a low net calorific value, below 13 MJ m−3, for the gas obtained in the range of 750–850 °C.
3.2. Activation
The essential parameter to be increased by activation was the specific surface. In order to assess whether the proposed raw material and process are effective for the production of activated carbon sorbent in practice, it is necessary to discuss the effect of activation conditions on the yield or on the loss of the desired product. The experiments were divided into two series differing in the time of the sample exposure of steam. The contact time was 25 min in series “A” and 15 min in series “B”.
3.2.1. Textural Properties of the Products
In this study, textural properties include specific surface area, total pore volume, and pore size distribution. Since these are the key parameters for the intended use of the products of the thermal processing of hemp waste, the largest space is devoted to their discussion.
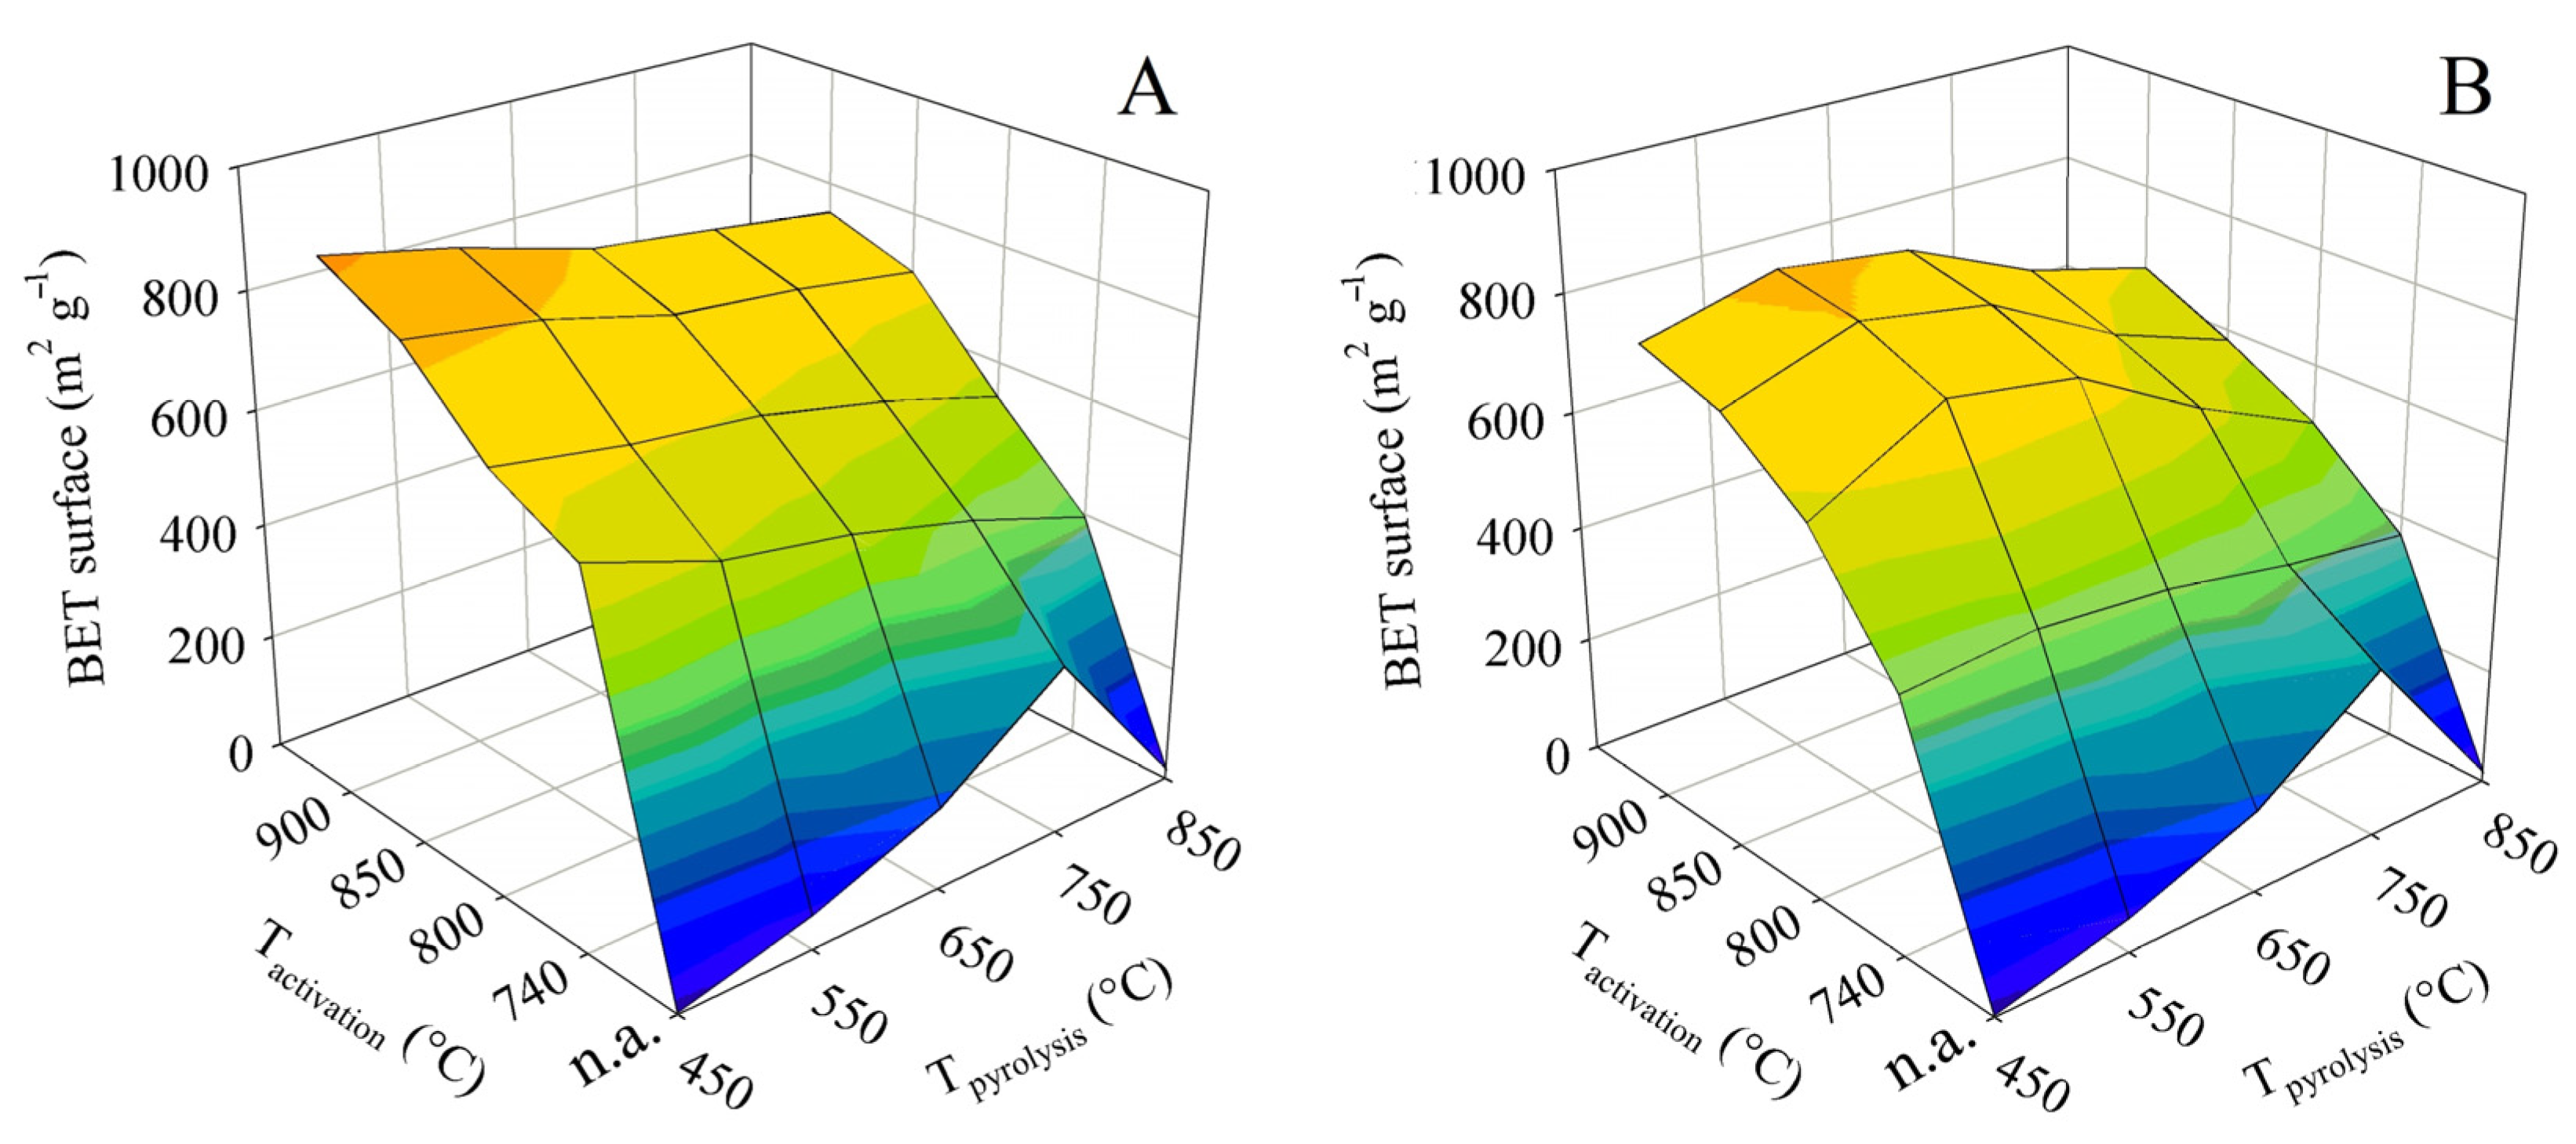
The specific surface area, determined in this case by BET, is a crucial parameter for the use of hemp pyrolysis residues as an adsorbent. It is thus the first textural parameter discussed. The measured values were used to construct the two 3D surface plots shown in Figure 3. The plot on the left shows the dependence of the BET surface on the final pyrolysis temperature and activation temperature for experiments with contact time A, whereas the plot on the right is a visualization of the same for time B. Both graphs show a very distinct trend.
The non-activated pyrolysis residues are abbreviated as “n.a.” in the graphs below. Pyrolysis alone yielded a residue with the maximum BET surface area of 294 m2 g−1 at the final temperature of 750 °C. A higher temperature, on the other hand, led to the damage to the porous structure, manifested by an order-of-magnitude reduction in the BET surface.
In the case of steam activation, an increase in the activation temperature led to a concomitant increase in specific surface area. Nevertheless, there were some differences between experiments with contact time A and B. In the A-series activation tests, the process provided the highest BET surface values of 915 m2 g−1 when the lowest final pyrolysis temperature of 450 °C was combined with the highest activation temperature of 900 °C. However, it was interesting to compare the surfaces achieved at the same activation temperature applied to samples produced by pyrolysis to different final temperatures. In general, the BET surface was slightly reduced with increasing pyrolysis temperature.
The series of experiments with contact time B resulted in a product with the largest BET surface area (837 m2 g−1) when the final pyrolysis temperature of 550 °C was combined with the activation temperature of 900 °C. Nevertheless, very similar results were obtained when pyrolysis up to 550 °C was followed by activation at 850 °C (811 m2 g−1) and pyrolysis up to 650 °C was followed by activation at 900 °C (807 m2 g−1). Unlike in series A, here pyrolysis up to 450 °C at each activation temperature always resulted in worse BET surfaces than pyrolysis up to 550 or 650 °C. However, with the pyrolysis temperature being at least 650 °C, it was possible to observe the same effect as above—the specific surface at the same activation temperature decreased with increasing pyrolysis temperature. Despite the differences in the behavior of the samples between series A and B, it can be assumed that the high pyrolysis temperature reduced the reactivity of the residue to steam.
The comparison with chemical activation published in the literature can be summarized as follows: The maximum specific surface area achieved in this study represents only about 30–70% of the value reported for KOH [17,18,19,20,21,22,23,24], 60–80% of the value reported for H3PO4 [25,26,27], and almost 65% of the surface area published for ZnCl2 activated shives [30]. However, as mentioned in the introduction, chemical activation is primarily environmentally problematic. The comparison with published results for physical activation is therefore significantly more relevant. The maximum BET surface area achieved in this study was 145% of the value published for activation with CO2. The same specific surface as Williams and Reed obtained by activating textile fibers was achieved here with the use of waste shives [31]. Textile fibers, however, represent a significantly higher quality feedstock compared to shives. The importance of testing a wider range of conditions is therefore obvious.
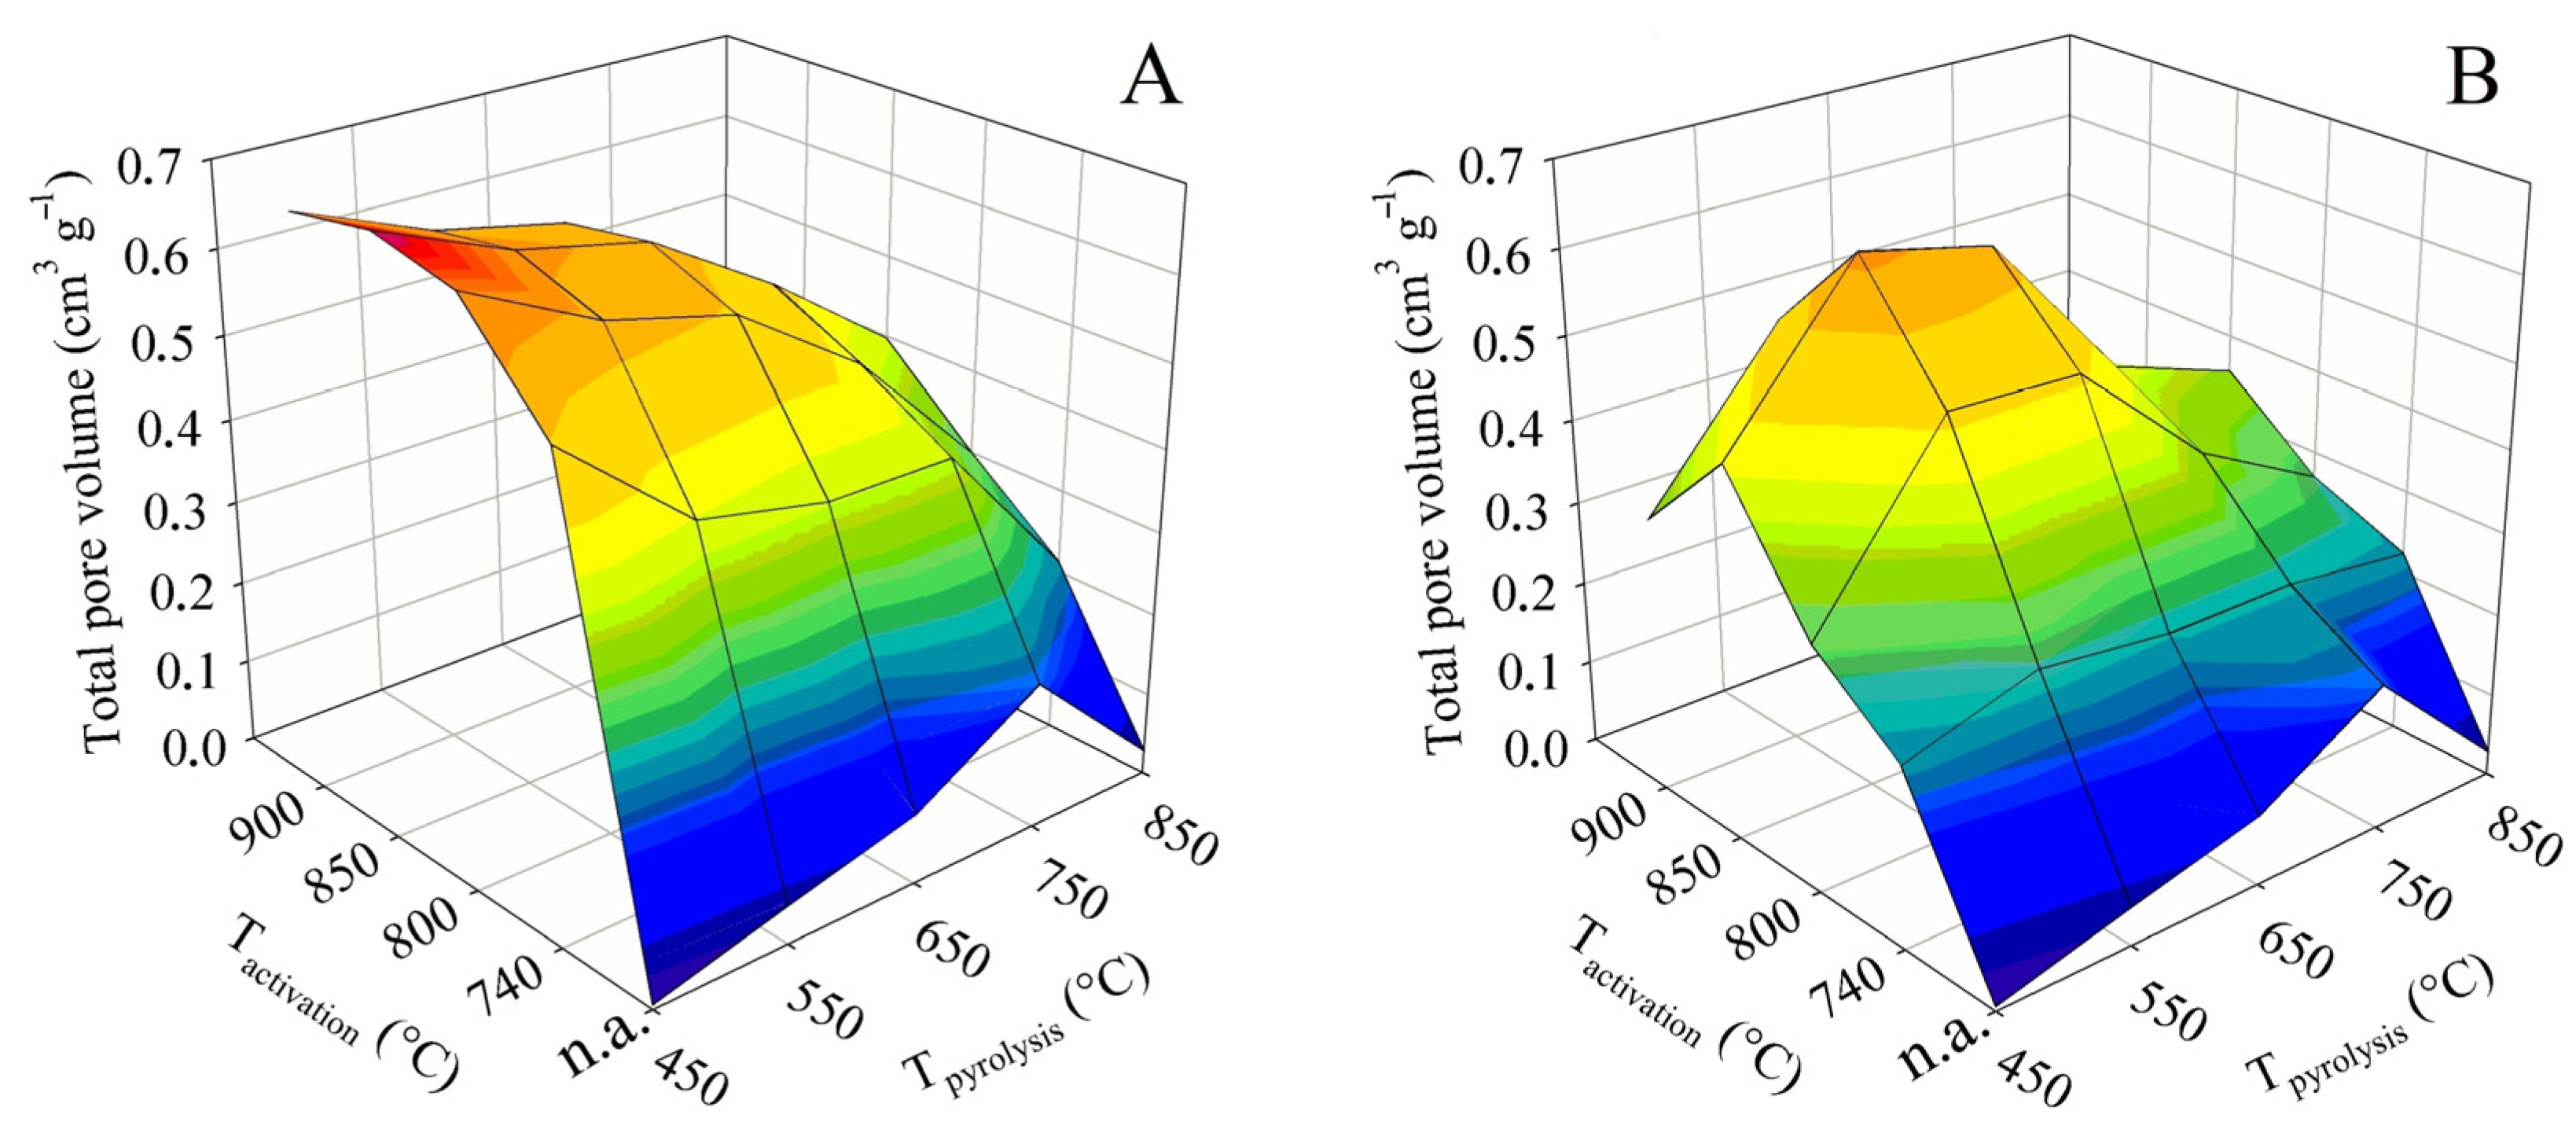
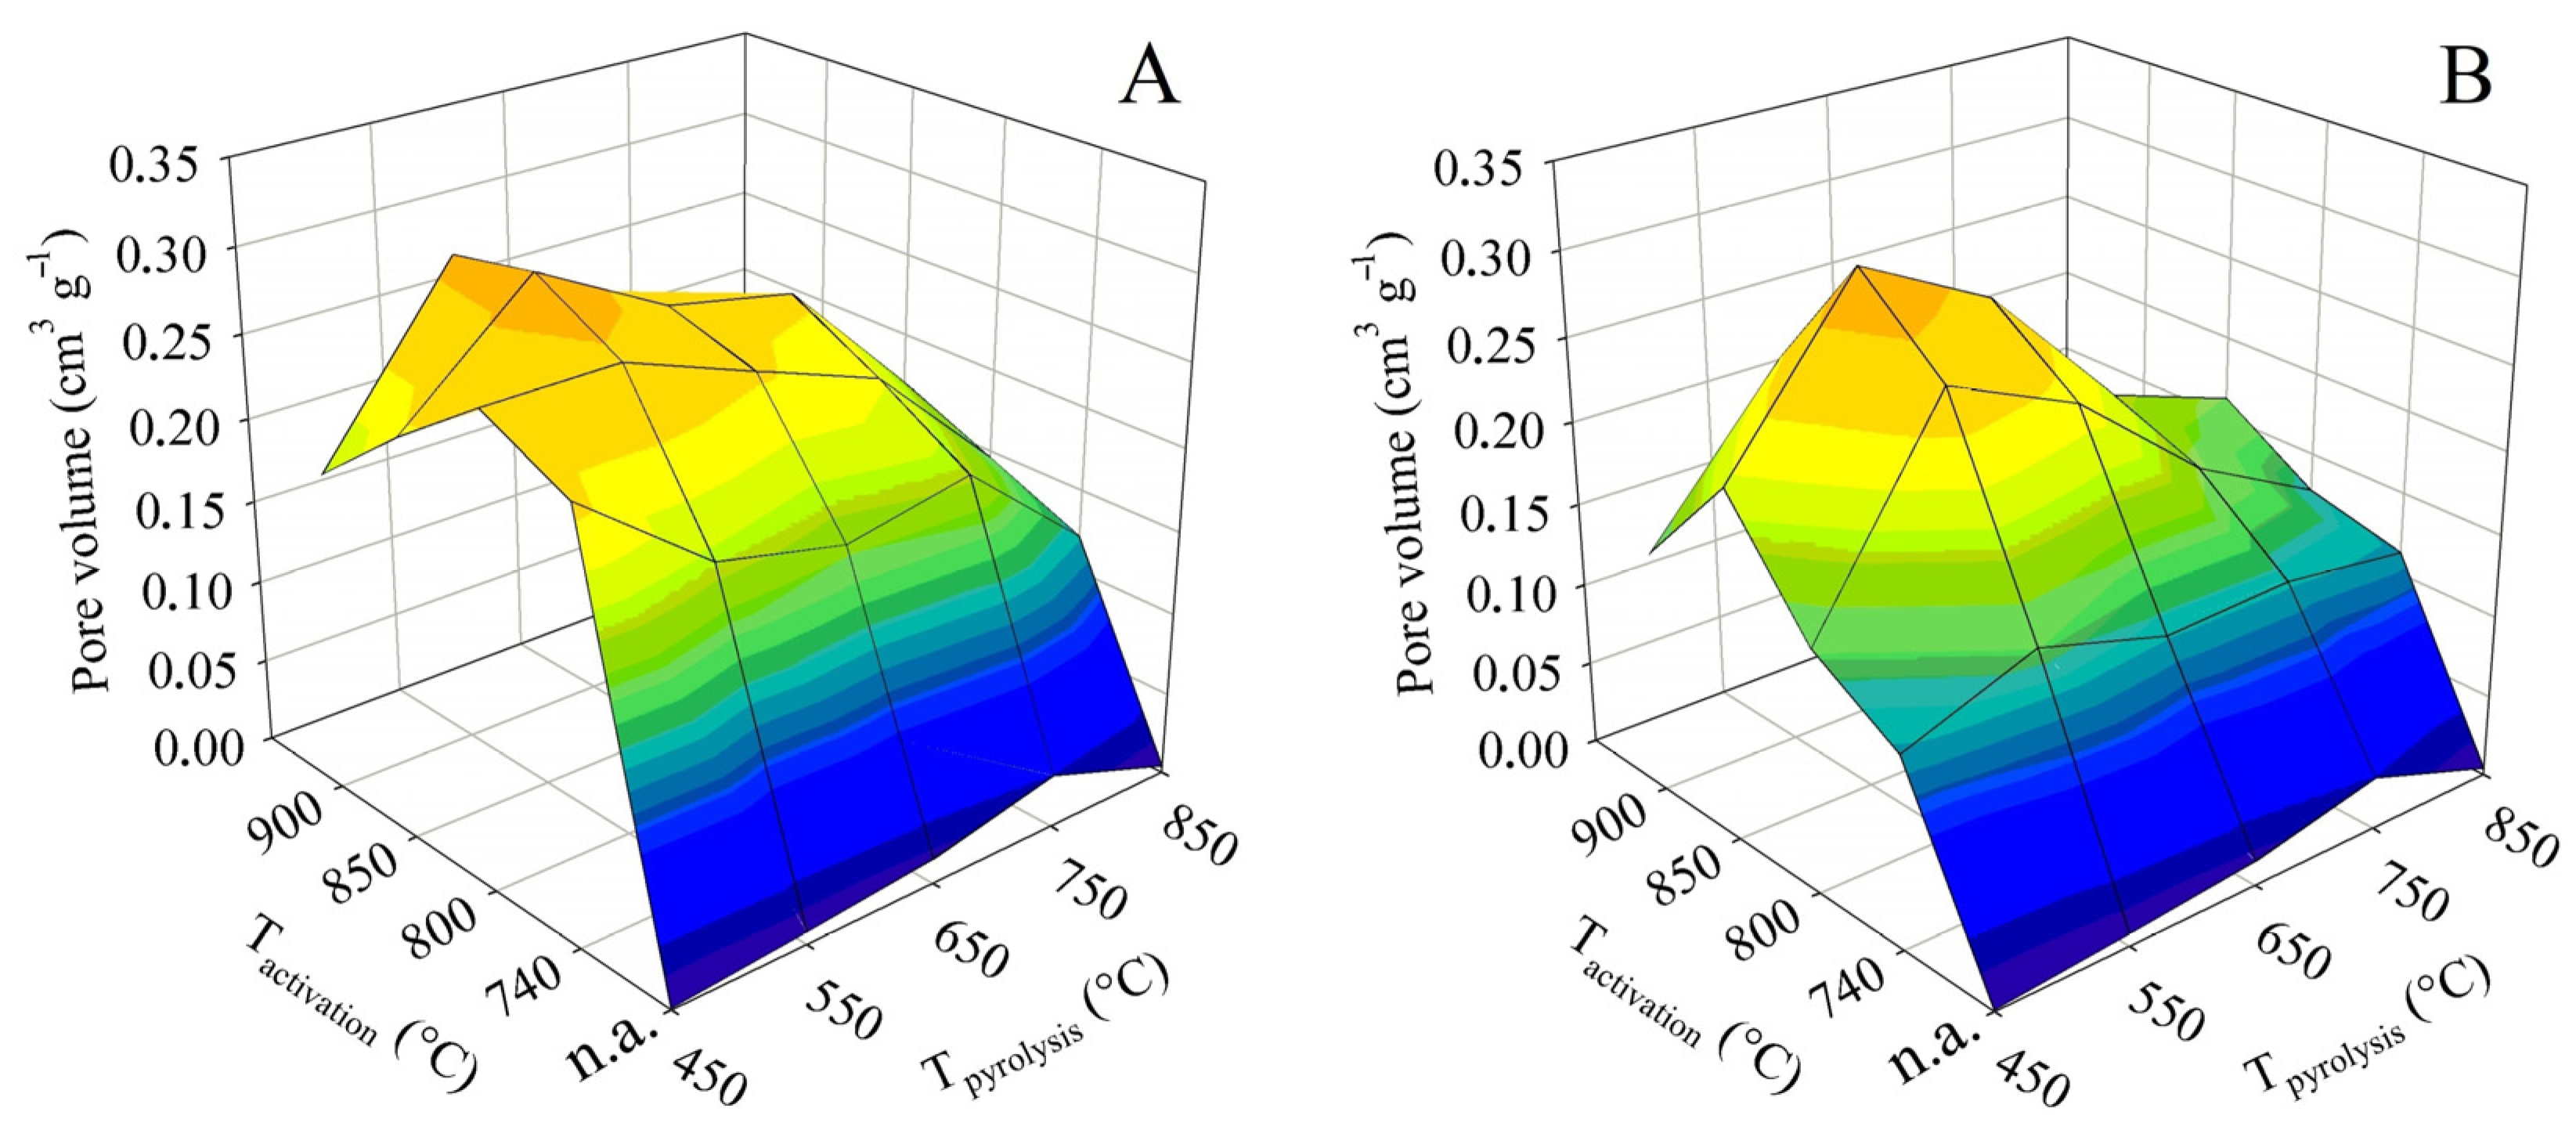
The total pore volume is not in itself such an important parameter as the specific surface. However, it is largely complementary to it. In addition, it can play an important role, for example, if it is decided that the sorbent obtained should be refined by some impregnation technique. The 3D surface plots in Figure 4 were constructed in the same way as for the BET surface. They thus show the dependence of the total pore volume on the final pyrolysis temperature, as well as the activation temperature. The graph on the left again shows the trend for contact time A and the graph on the right for contact time B.
The non-activated samples generally showed very low values of the total pore volume. Up to the final pyrolysis temperature of 750 °C, the pyrolysis had a positive effect on the total pore volume. At this temperature, the value was 0.35 cm3 g−1. Nevertheless, as with the BET surface, an increase in the pyrolysis temperature above this limit caused a sharp decrease in the total pore volume to only 0.03 cm3 g−1.
As far as the BET surface is concerned, its value increased with activation temperature and, conversely, gradually decreased with increasing pyrolysis temperature. For the total pore volume, both trends were similar, with the only difference being that both the increases and decreases in values were much steeper. In the case of the tests with contact time A, the highest pore volume was associated with pyrolysis up to 450 °C, when the maximum of 0.70 cm3 g−1 was reached at an activation temperature of 850 °C. Similarly high values, 0.68 cm3 g−1, were also determined at the adjacent activation temperatures of 800 and 900 °C. Any other pyrolysis or activation temperature then induced a significant decrease in the total pore volume. The samples behaved somewhat differently in the tests with the contact time B. The maximum of the total pore volume was shifted to a higher final pyrolysis temperature. The highest pore volume was determined for samples obtained by pyrolysis up to 550 and 650 °C, and subsequently activated at 850 °C. Under these conditions, values of 0.63 and 0.60 cm3 g−1, respectively, were obtained. Again, any other combination of pyrolysis temperature and activation resulted in a marked reduction in the total pore volume.
The percentage comparison of the determined total pore volumes with the values available from the literature was similar or higher to that of the BET surface area, and 35–75% of the values reported for chemical activation with KOH [17,18,19,20,21,22,23,24] and 55–115% with H3PO4 [25,26,27] were achieved. Compared to the BET surface, the total pore volume even reached 120% of the value published for ZnCl2 [30]. The comparison with literature data for physical activation also showed significantly higher values: 200% compared to the use of CO2 and more than 120% compared to steam activation of textile fibers. Although the specific surface area is the more important parameter for adsorbents, the large total pore volume achieved by this study may be positive for some product applications.
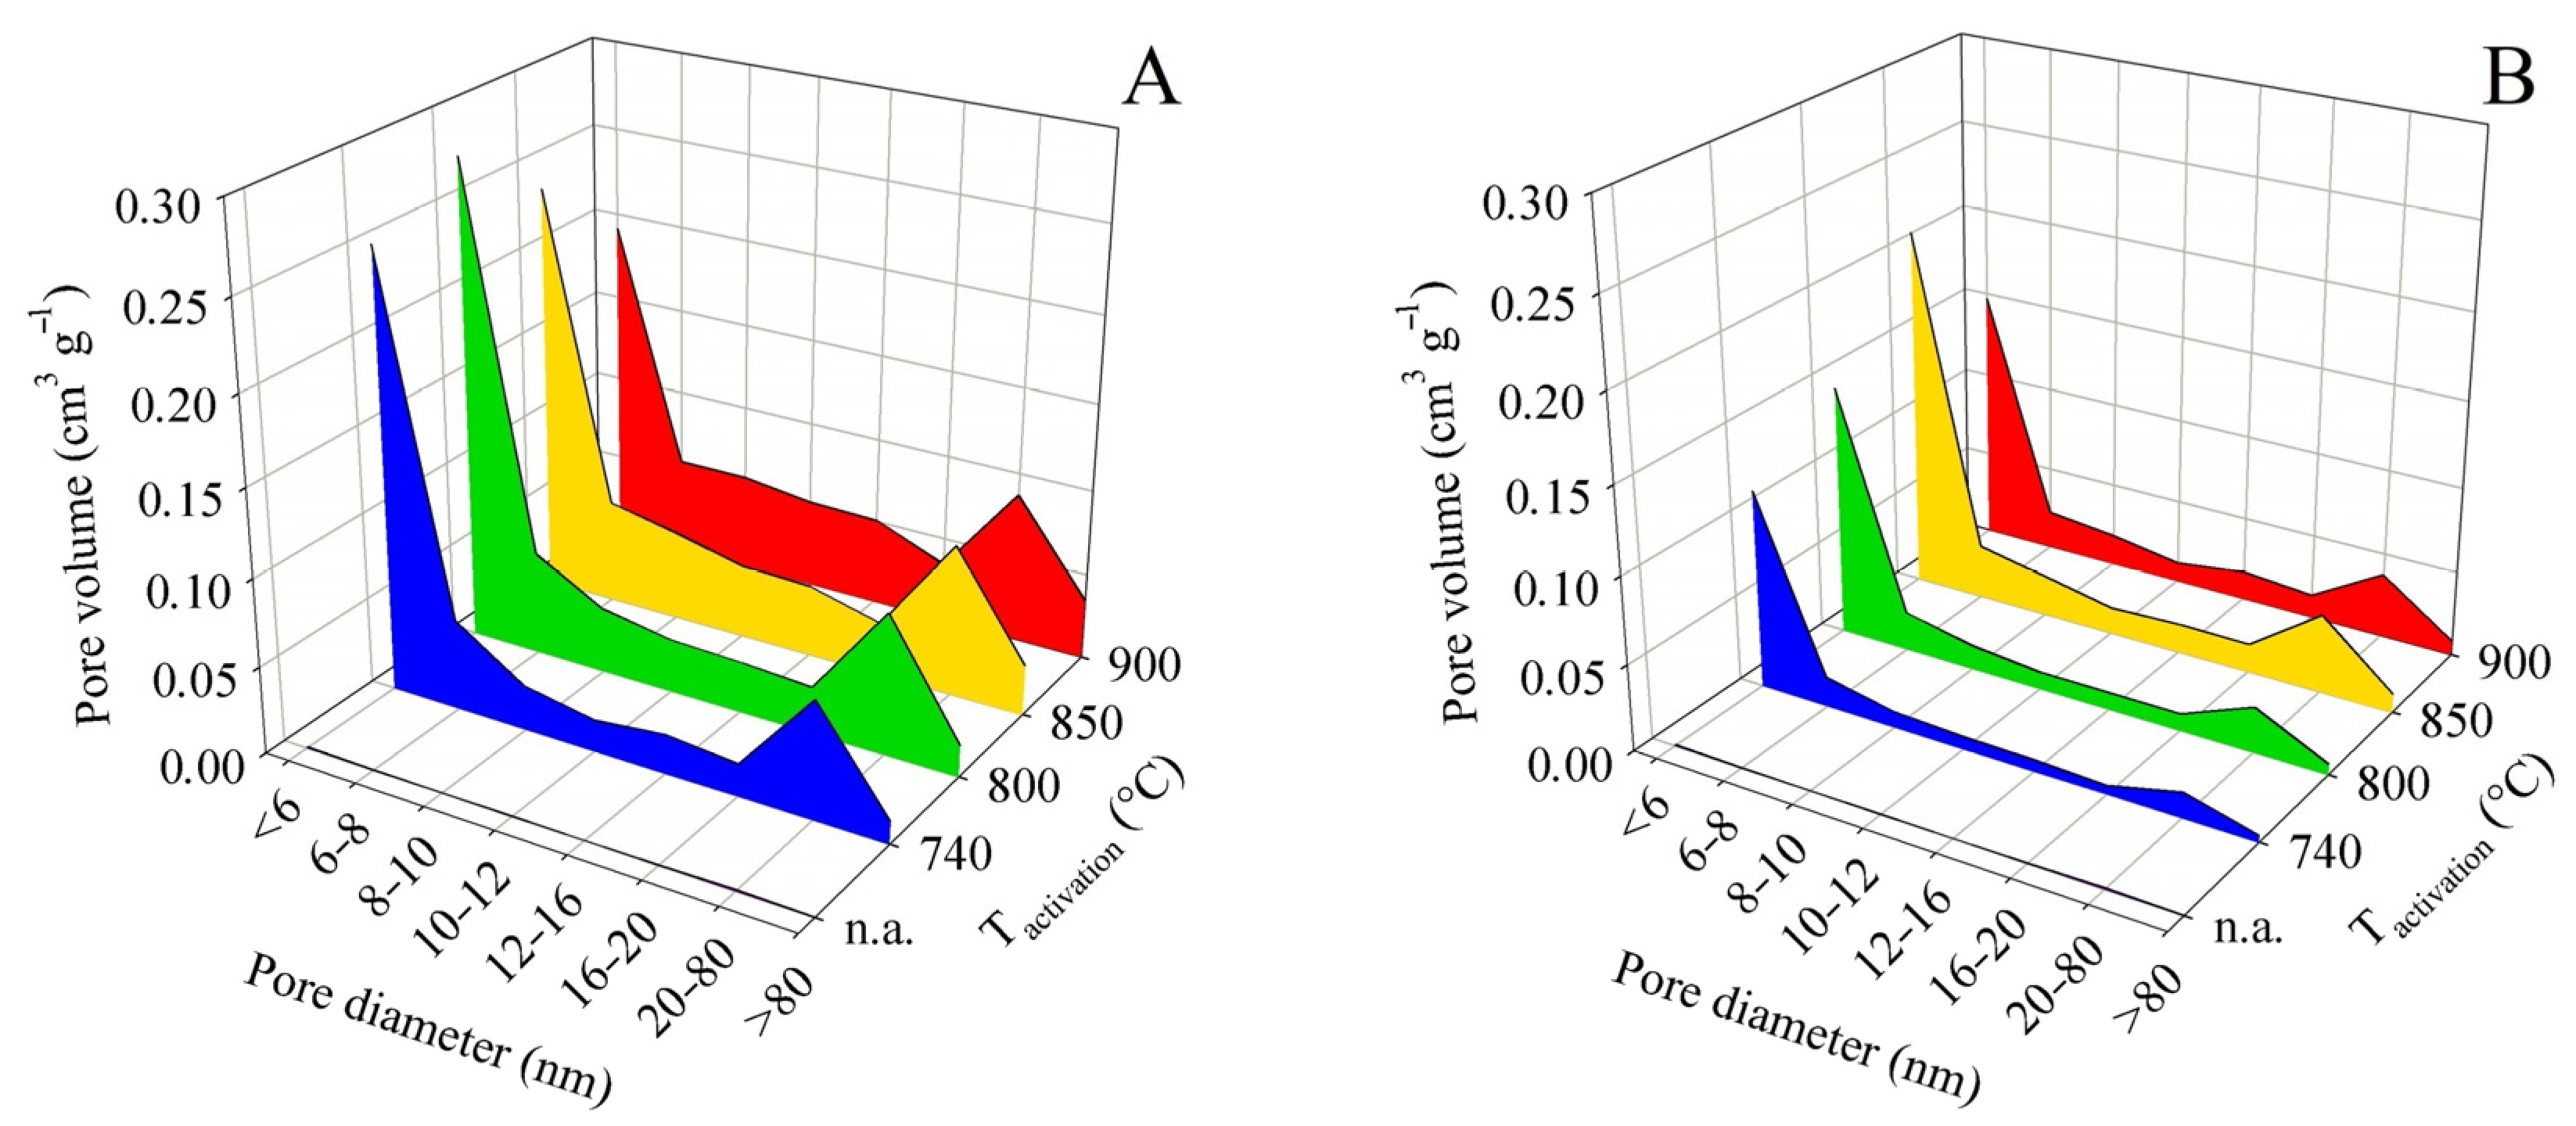
In the pore distribution evaluation based on the BJH method, the pores were divided into eight categories according to their diameter. The first category included pores with a diameter of less than 6 nm, whereas the last category contained all detectable pores with a diameter above 80 nm. The described screening enabled a clear and time-saving comparison of the large number of samples obtained in the experiments. Area charts of pore-volume distribution according to the pore diameter were constructed for each final pyrolysis temperature. The graphs did not include the relative (percentage) data of pore representation but the absolute values of component volumes according to BJH. The dependence of the sum of the component volumes of the pores on activation and pyrolysis temperature naturally followed the trends of the total pore volume.
In all experiments, without exception, the following was found: The largest contribution to the total volume was made by pores with a diameter of <6 nm, followed less significantly by pores with a diameter of 20–80 nm. Pores with diameters between these maxima (i.e., 6 and 20 nm) were distributed more or less uniformly. The relative contributions of pores with diameters of 6–20 nm to the total volume ranged from 19.9 to 44.4% for contact time A experiments and from 20.5 to 31.3% for contact time B. In terms of the practical application of the products as adsorbents, it can be considered positive that the contribution of pores > 80 nm was small and ranged from 1.4 to 6.2% for contact time A and from 2.2 to 3.9% for contact time B.
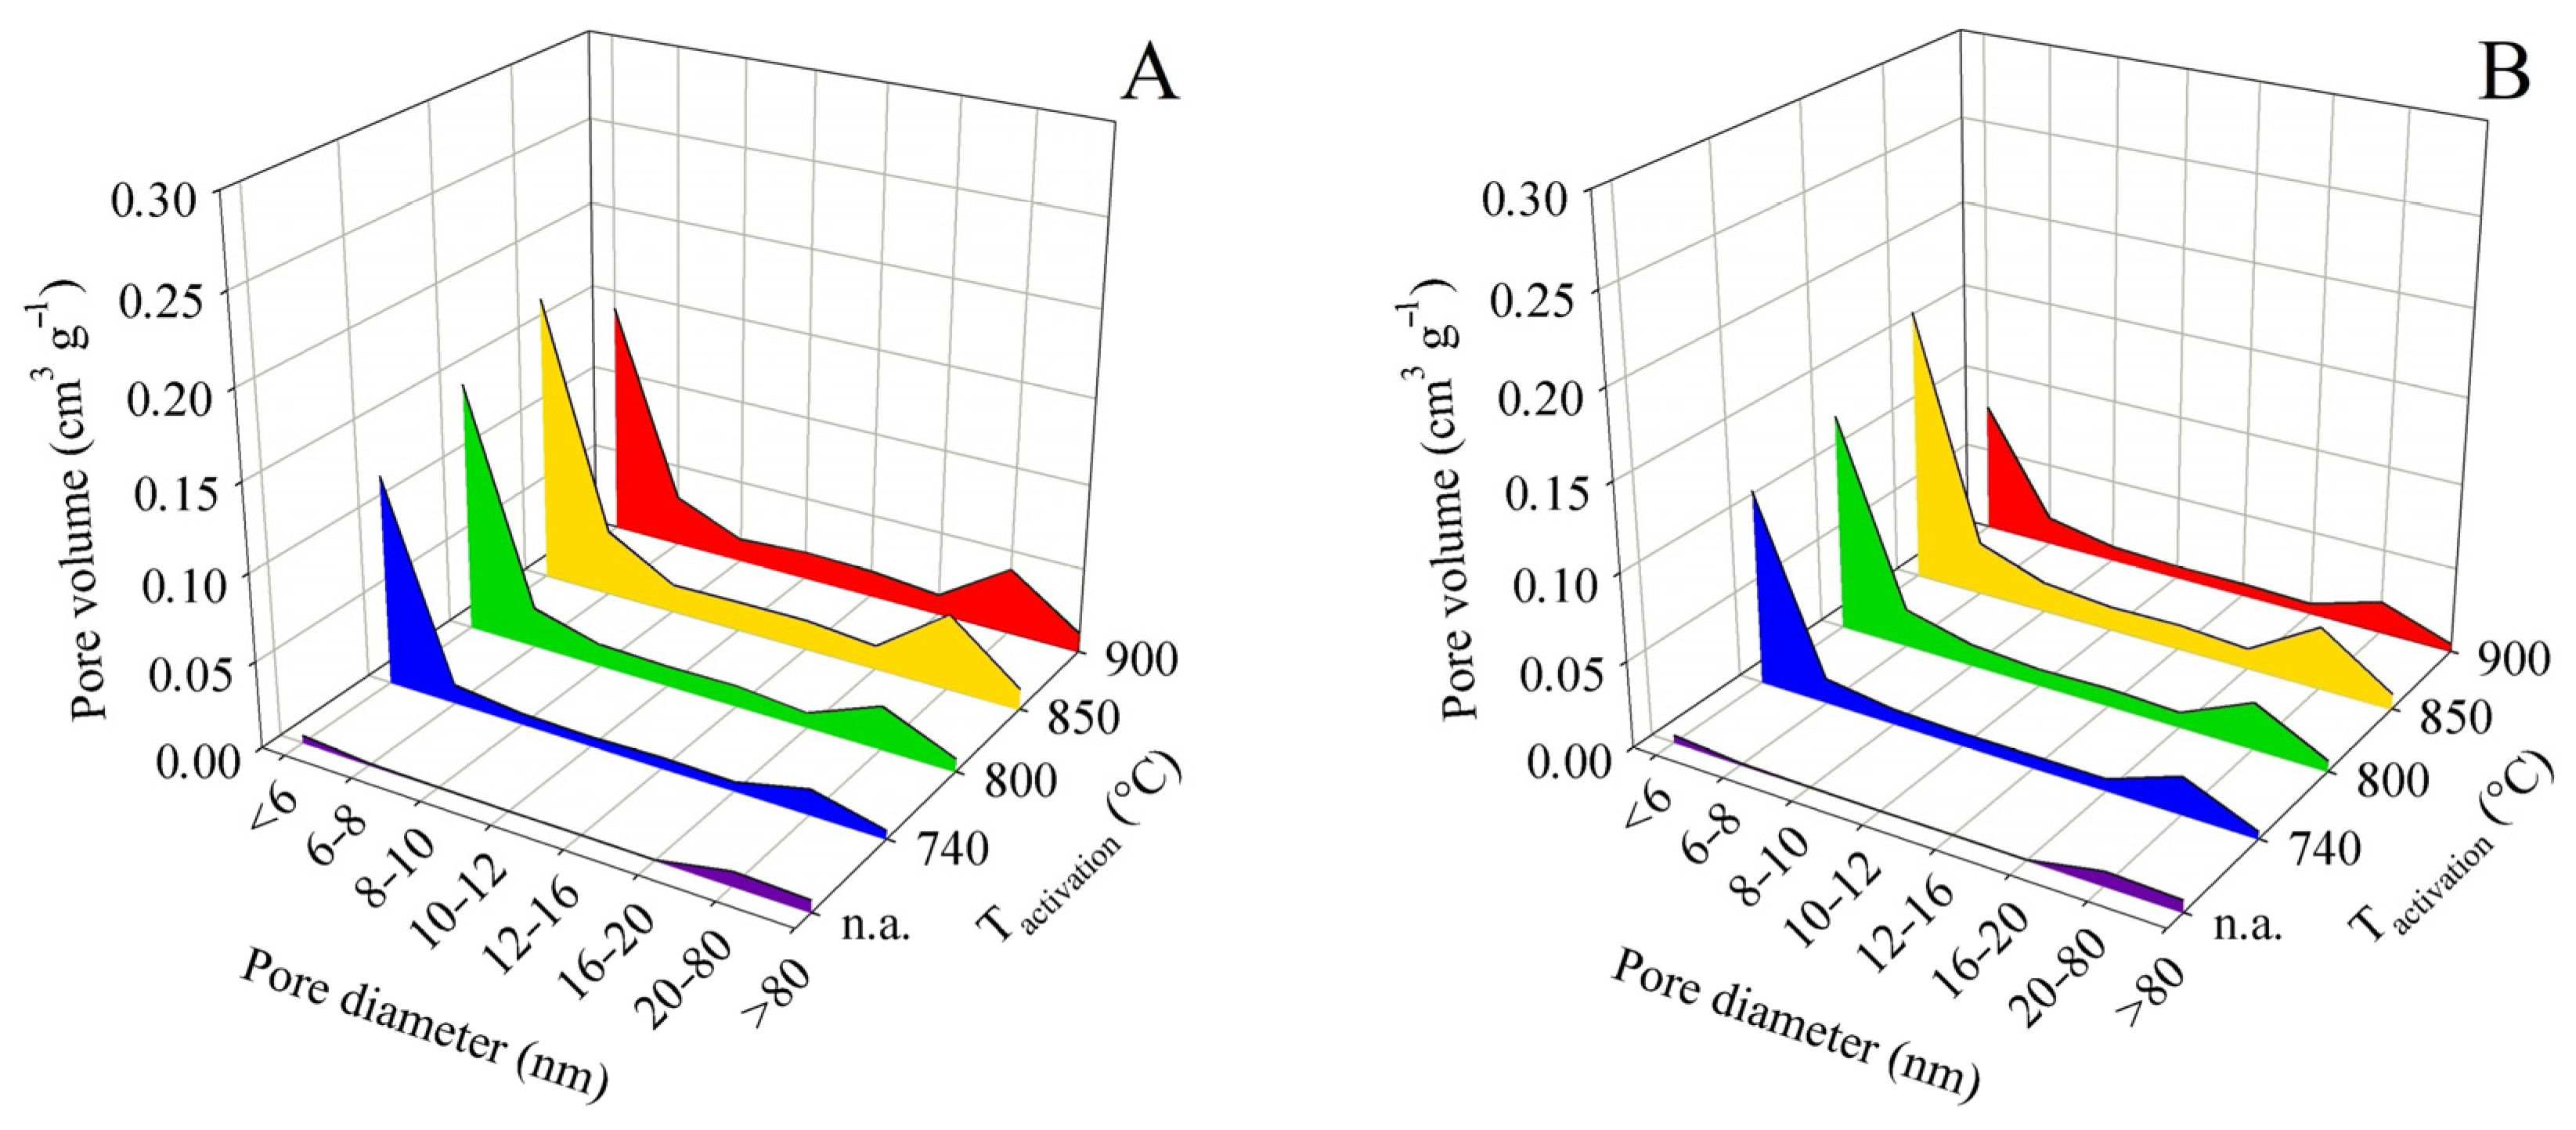
For these reasons, it is not necessary to attach all the pore size distribution plots here. Figure 5 shows the pore size distribution for samples obtained from pyrolysis up to 450 °C and Figure 6 shows the same for pyrolysis up to 850 °C. Both pairs of graphs use the same scale to facilitate intercomparison.
Micropores and small mesopores play an important role in many practical applications of adsorption. For this reason, the authors find it necessary to discuss the formation of pores in this category separately. For this purpose, the two 3D surface plots shown in Figure 7 were created. As in the case of representation of the BET surface and the total pore volume, the volume occupied by pores of < 6 nm in diameter was plotted against the activation temperature and the final pyrolysis temperature. A similar trend in the representation of these pores was found for both contact times (A and B). Non-activated samples (n.a.) showed only negligible volumes of the pores of this diameter, essentially regardless of the final pyrolysis temperature. Across all pyrolysis temperatures, the volume occupied by pores of <6 nm increased with activation temperature up to 850 °C. The steepest trends were observed for samples obtained by pyrolysis up to 550–650 °C. In all experiments, the activation temperature of 850 °C proved to be the most suitable for the development of the pore fraction discussed. In the experiments with contact time A, the maximum volume of these pores was 0.305 cm3 g−1, which was achieved for samples obtained by pyrolysis up to 550 °C, followed by activation at 850 °C. In the case of contact time B, the maximum representation of pores of < 6 nm was achieved under the same conditions, with the maximum volume (0.310 cm3 g−1) being slightly higher than in the previous case. Expressing the data in relative terms, the maximum contribution to the total pore volume was 57.9% for time A and 59.1% for time B.
On the other hand, the application of the highest activation temperature tested, 900 °C, sometimes caused stagnation, but in most cases even a significant decrease in the volume of these pores. For example, for samples prepared by pyrolysis up to 550 °C, the application of an activation temperature of 900 °C resulted in a volume of 0.294 cm3 g−1 at contact time A and 0.237 cm3 g−1 at contact time B.
The literature states that production of AC through physical activation yields narrow pore distribution, concentrating at micropores. However, according to published works, the representation of pores of different sizes depends on the specific activation conditions [32]. This study confirms and supplements the aforementioned findings with data from a wide range of temperatures. Thus, the sometimes-stated claim that steam activation, in contrast with CO2, usually produces wide pore size distribution [33] was not confirmed. On the other hand, such a narrow distribution of pores as in hydrothermal processing was not achieved [34].
3.2.2. Activation Losses
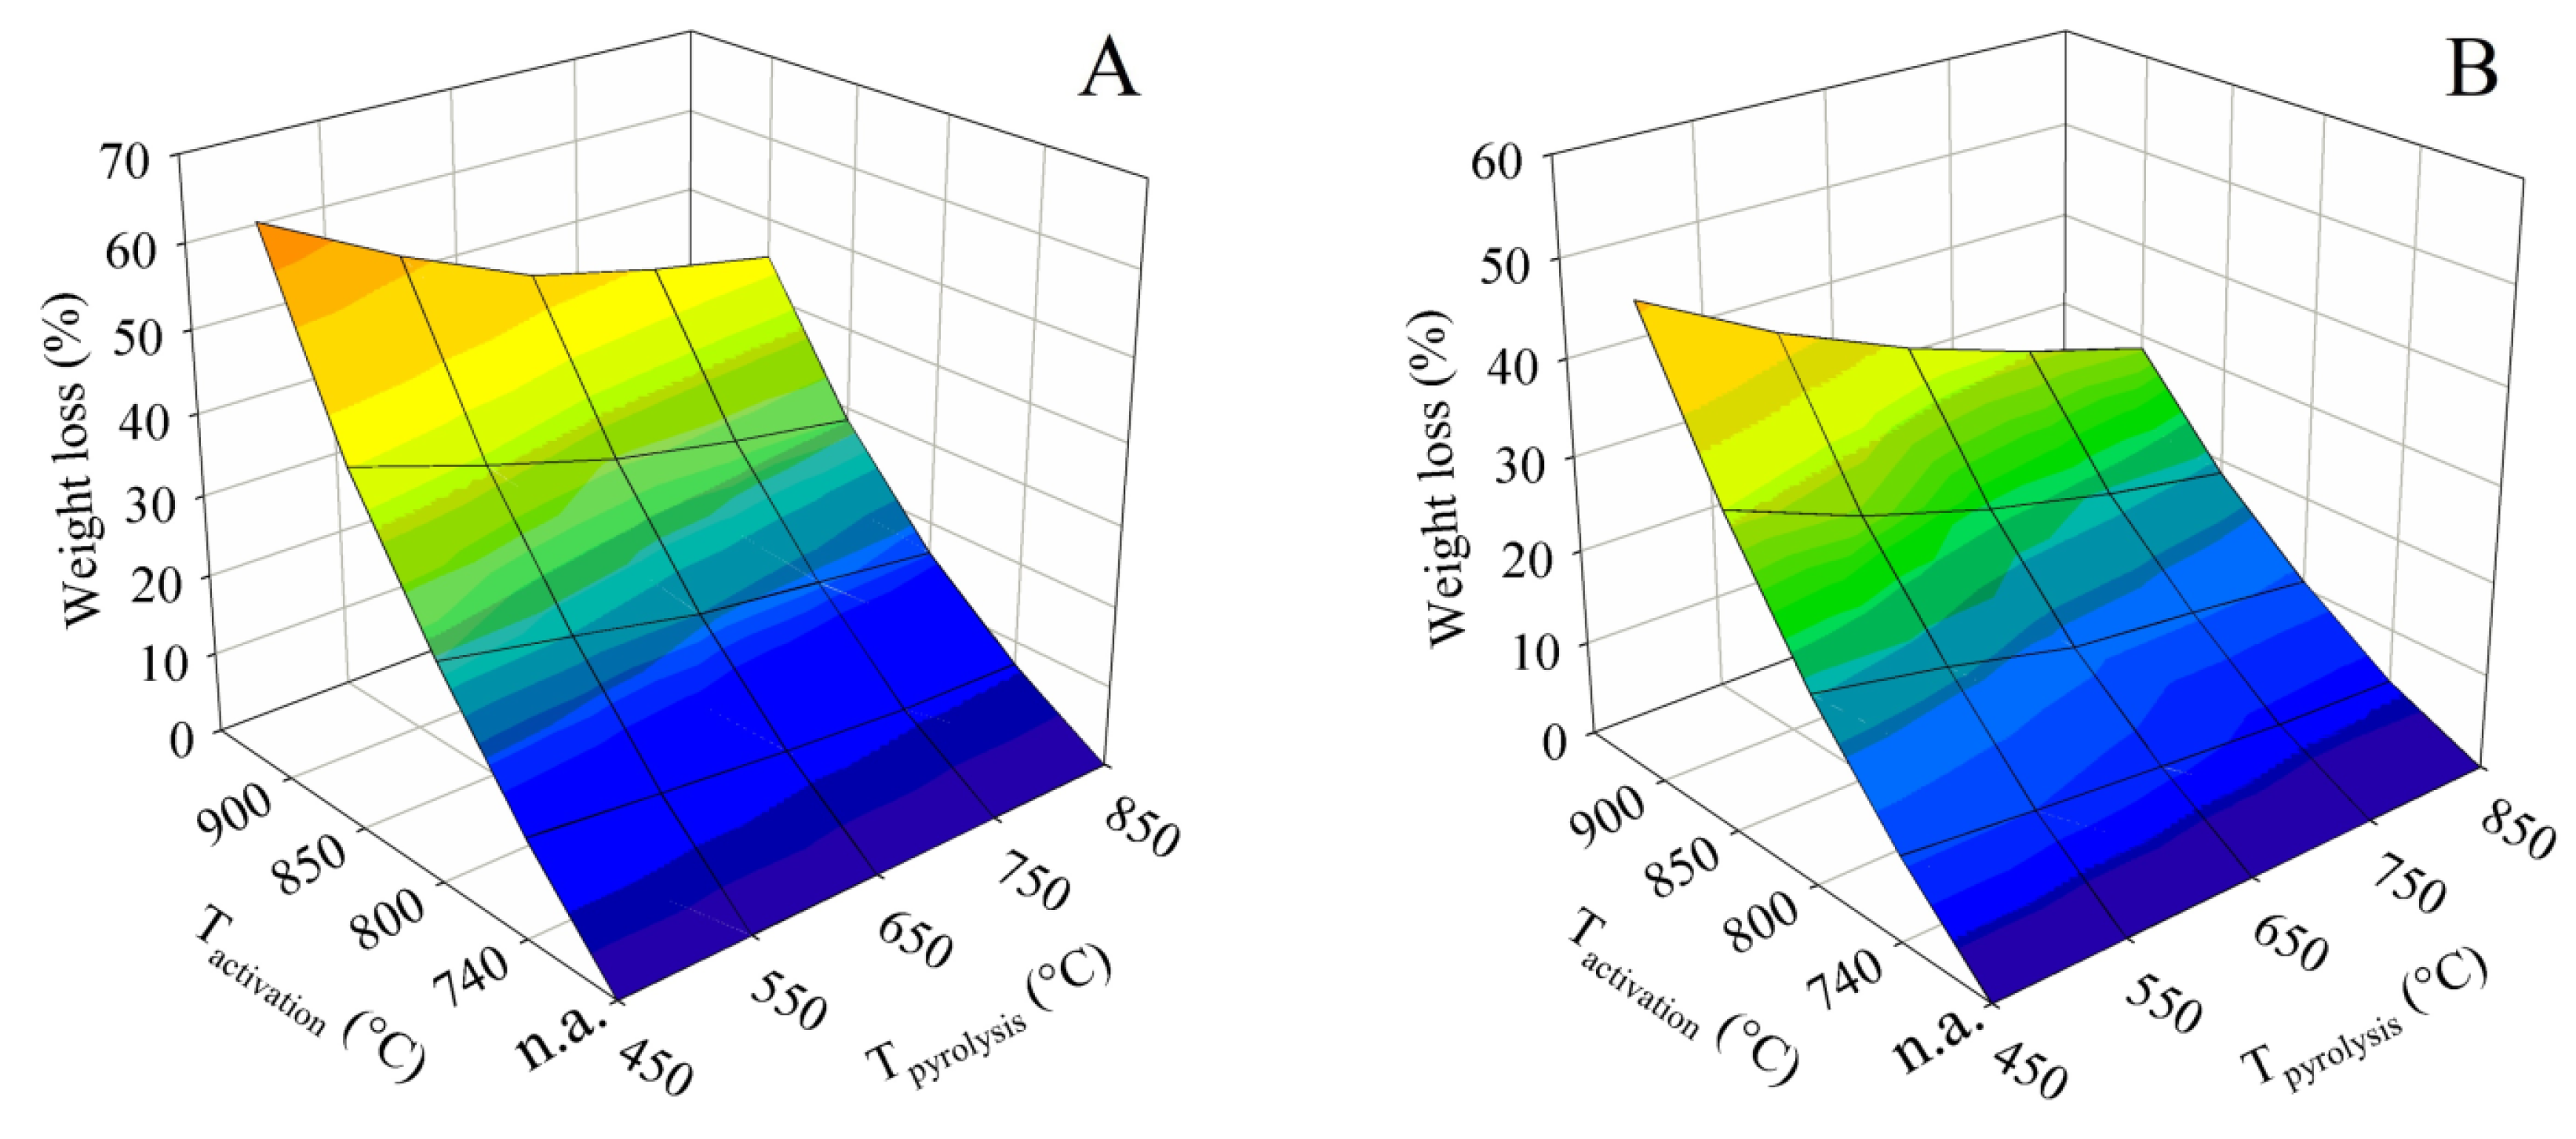
The principle of the activation using water vapor inevitably leads to a loss in the mass of the solid phase. The dependence of these losses on the pyrolysis and activation temperature was visualized for both contact times in the form of 3D surface plots, which are shown in Figure 8. Samples without activation (marked “n.a.”) are shown as a zero-loss state. It is evident from the plots that the losses increased with activation temperature and, conversely, slightly decreased with increasing final pyrolysis temperature. Similarly to the BET surface and the total pore volume, it can also be deduced from Figure 8 that the high pyrolysis temperature suppressed the reactivity of the obtained residue in terms of improving its resistance to steam gasification.
In the case of contact time A, the loss increased very steeply with increasing activation temperature. Samples obtained by pyrolysis up to 450 °C showed a loss of 12.2% when activated at 740 °C. However, this rose to 66.3% at an activation temperature of 900 °C. When samples obtained by pyrolysis up to the maximum temperature of 850 °C were subjected to the process, the loss at the activation temperature of 740 °C was only 7.1%. However, the activation temperature of 900 °C again resulted in a large loss of 45.2%.
The tests with contact time B were significantly more favorable in terms of process losses. The material generated by pyrolysis up to 450 °C showed a loss of 8.9% when activated at 740 °C, which increased to 49.5% when activated at 900 °C. The combination of the highest pyrolysis temperature of 850 °C and contact time B proved to be the best for process loss reduction. These conditions led to a loss of only 4.4% for the activation temperature of 740 °C, and the activation temperature of 900 °C resulted in a relatively small loss of 28.7% as well.
Therefore, the maximization of the BET surface during activation had exactly the opposite trend to the maximization of the solid phase yield. In the preparation of an activated sorbent from hemp residues in practice, a decision will have to be made as to how large a specific surface area to achieve to make the loss still acceptable.
Losses during physical activation observed in this study partially corresponded with data published in the literature. The tests showed approximately 10% lower losses while maintaining the specific surface of the product than reported in the literature for comparable biomass [35]. Some authors reported a sharp increase in losses occurring at temperatures above ca. 800 °C due to rapid gasification of the structure during the physical activation of carbonaceous materials [36,37]. In the case of hemp shives, however, the increase in loss was rather smooth at activation temperatures of 740–900 °C. Due to the wide range of raw materials, information about losses cannot be generalized too much.
3.2.3. Changes in Other Activation-Related Parameters
Pyrolysis and subsequent activation change the structure of the material and its other properties. The gasification of part of the organic matter of the sample in the activation process inevitably led to a change in the elemental composition of the sample. Therefore, the mass fraction of ash increased with activation temperature and steam exposure time. In the case of activated samples, the lowest ash fraction was 5.7% for the material pyrolyzed up to 450 °C and then activated at the temperature of 740 °C and contact time B. In contrast, the highest ash content (15.3%) was observed for the material pyrolyzed up to 450 °C and then activated at 900 °C and contact time A.
The mass fractions of carbon showed more or less opposite trends. Depending on the reactivity of the pyrolysis residue used, the carbon content decreased with increasing activation temperature and contact time with steam. On the contrary, it increased with pyrolysis temperature. Among limit values, it is worth mentioning the minimum carbon mass fraction of 72.1% for the material pyrolyzed up to 450 °C and activated at 900 °C and time A. On the other hand, the highest carbon content (87.7%) was found for the sample pyrolyzed up to 850 °C and activated at 740 °C and time B.
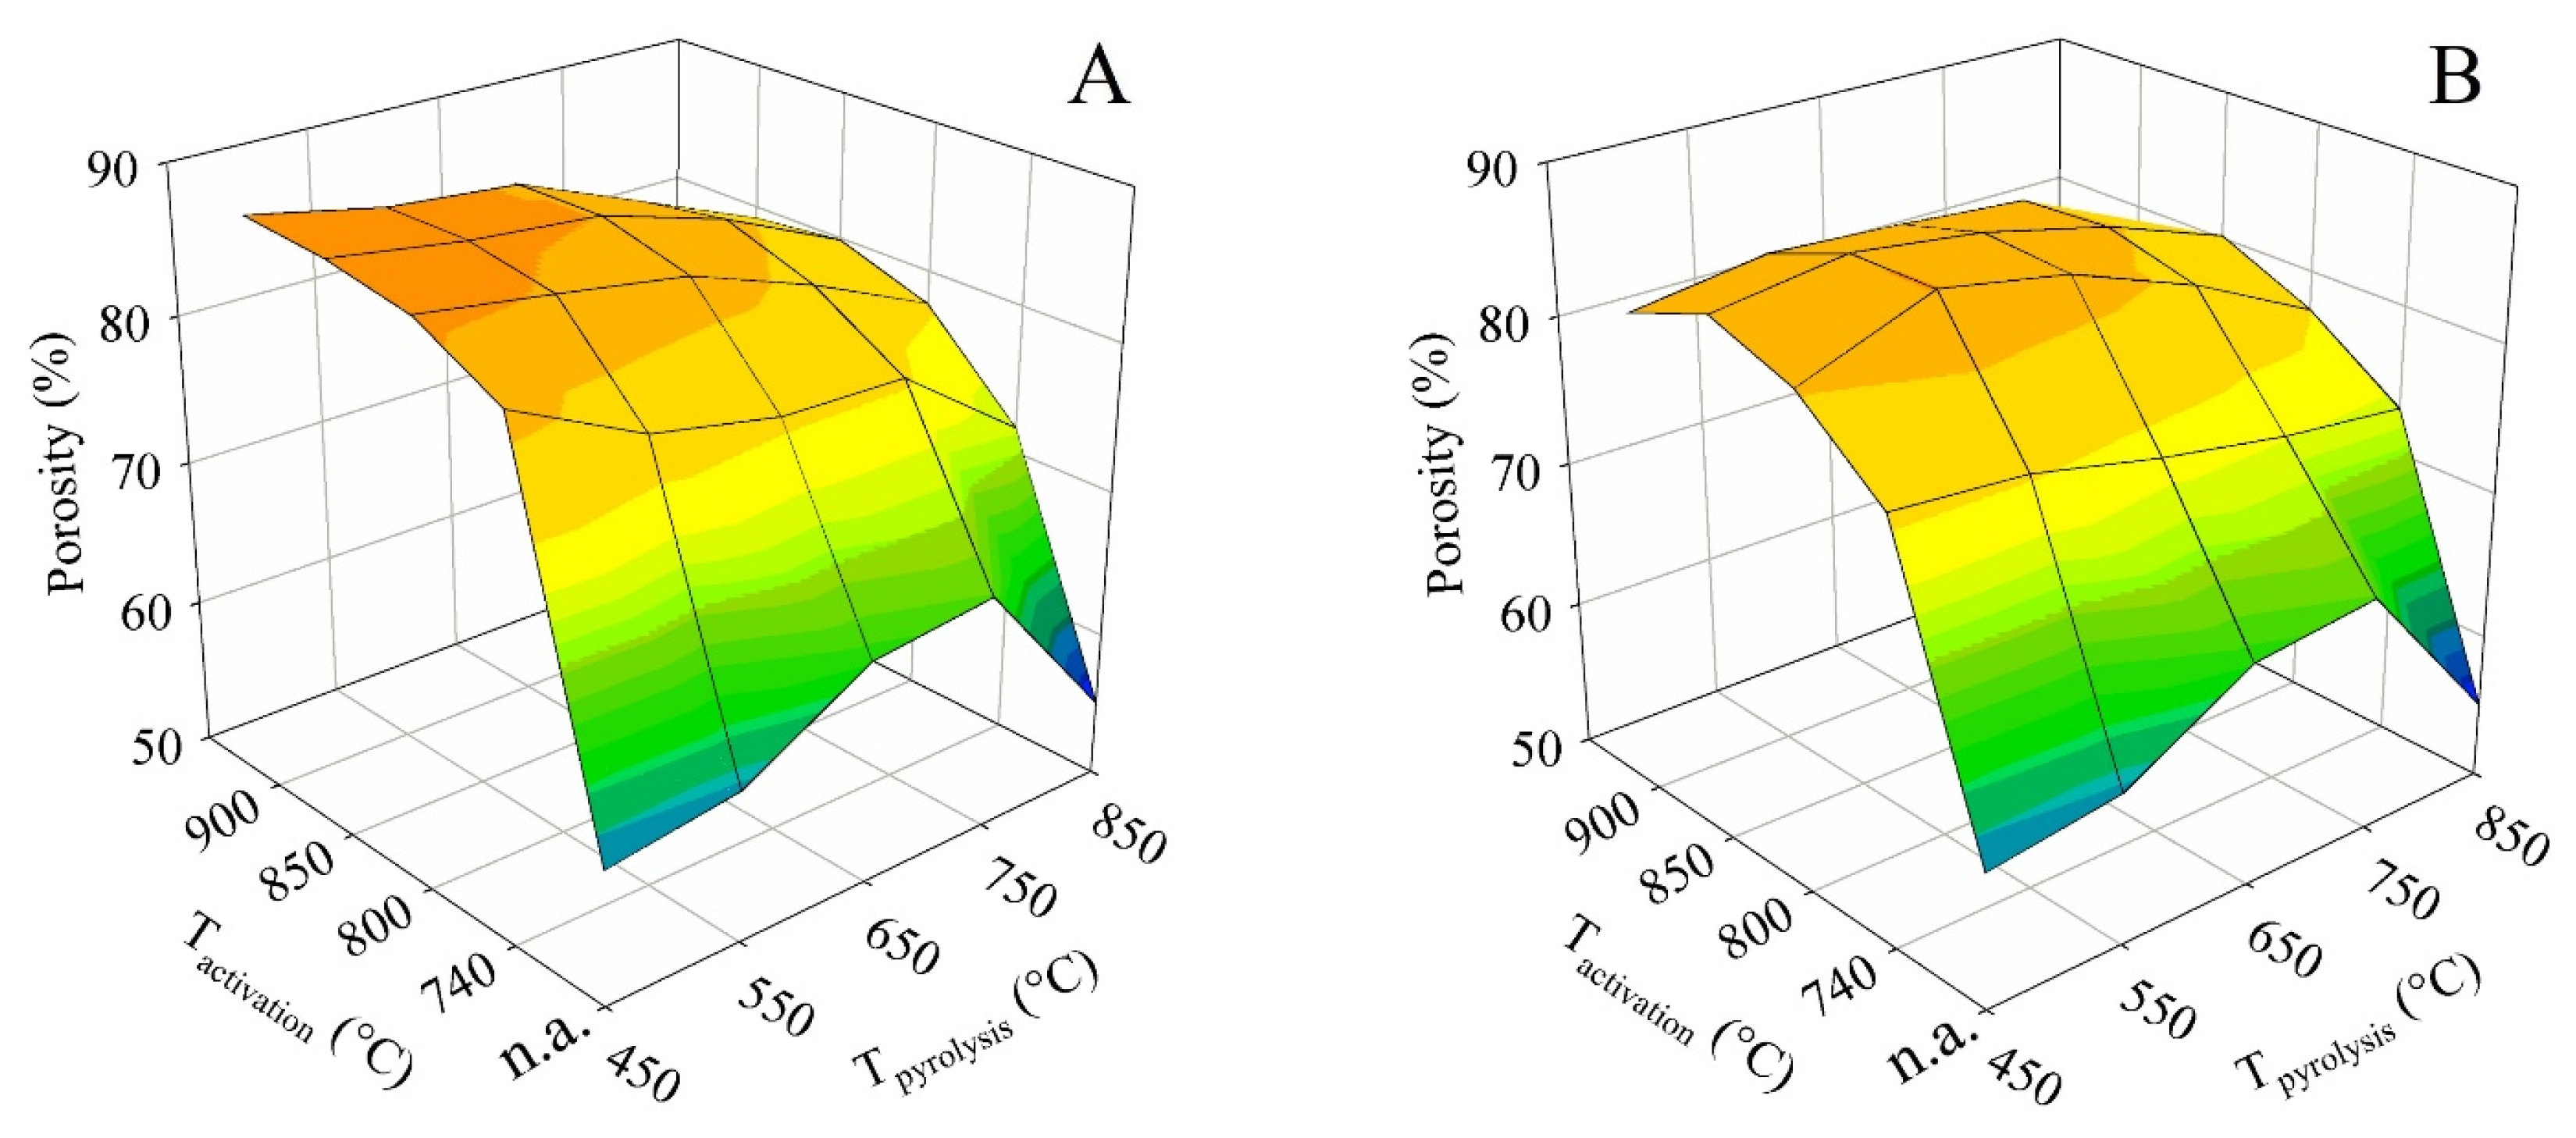
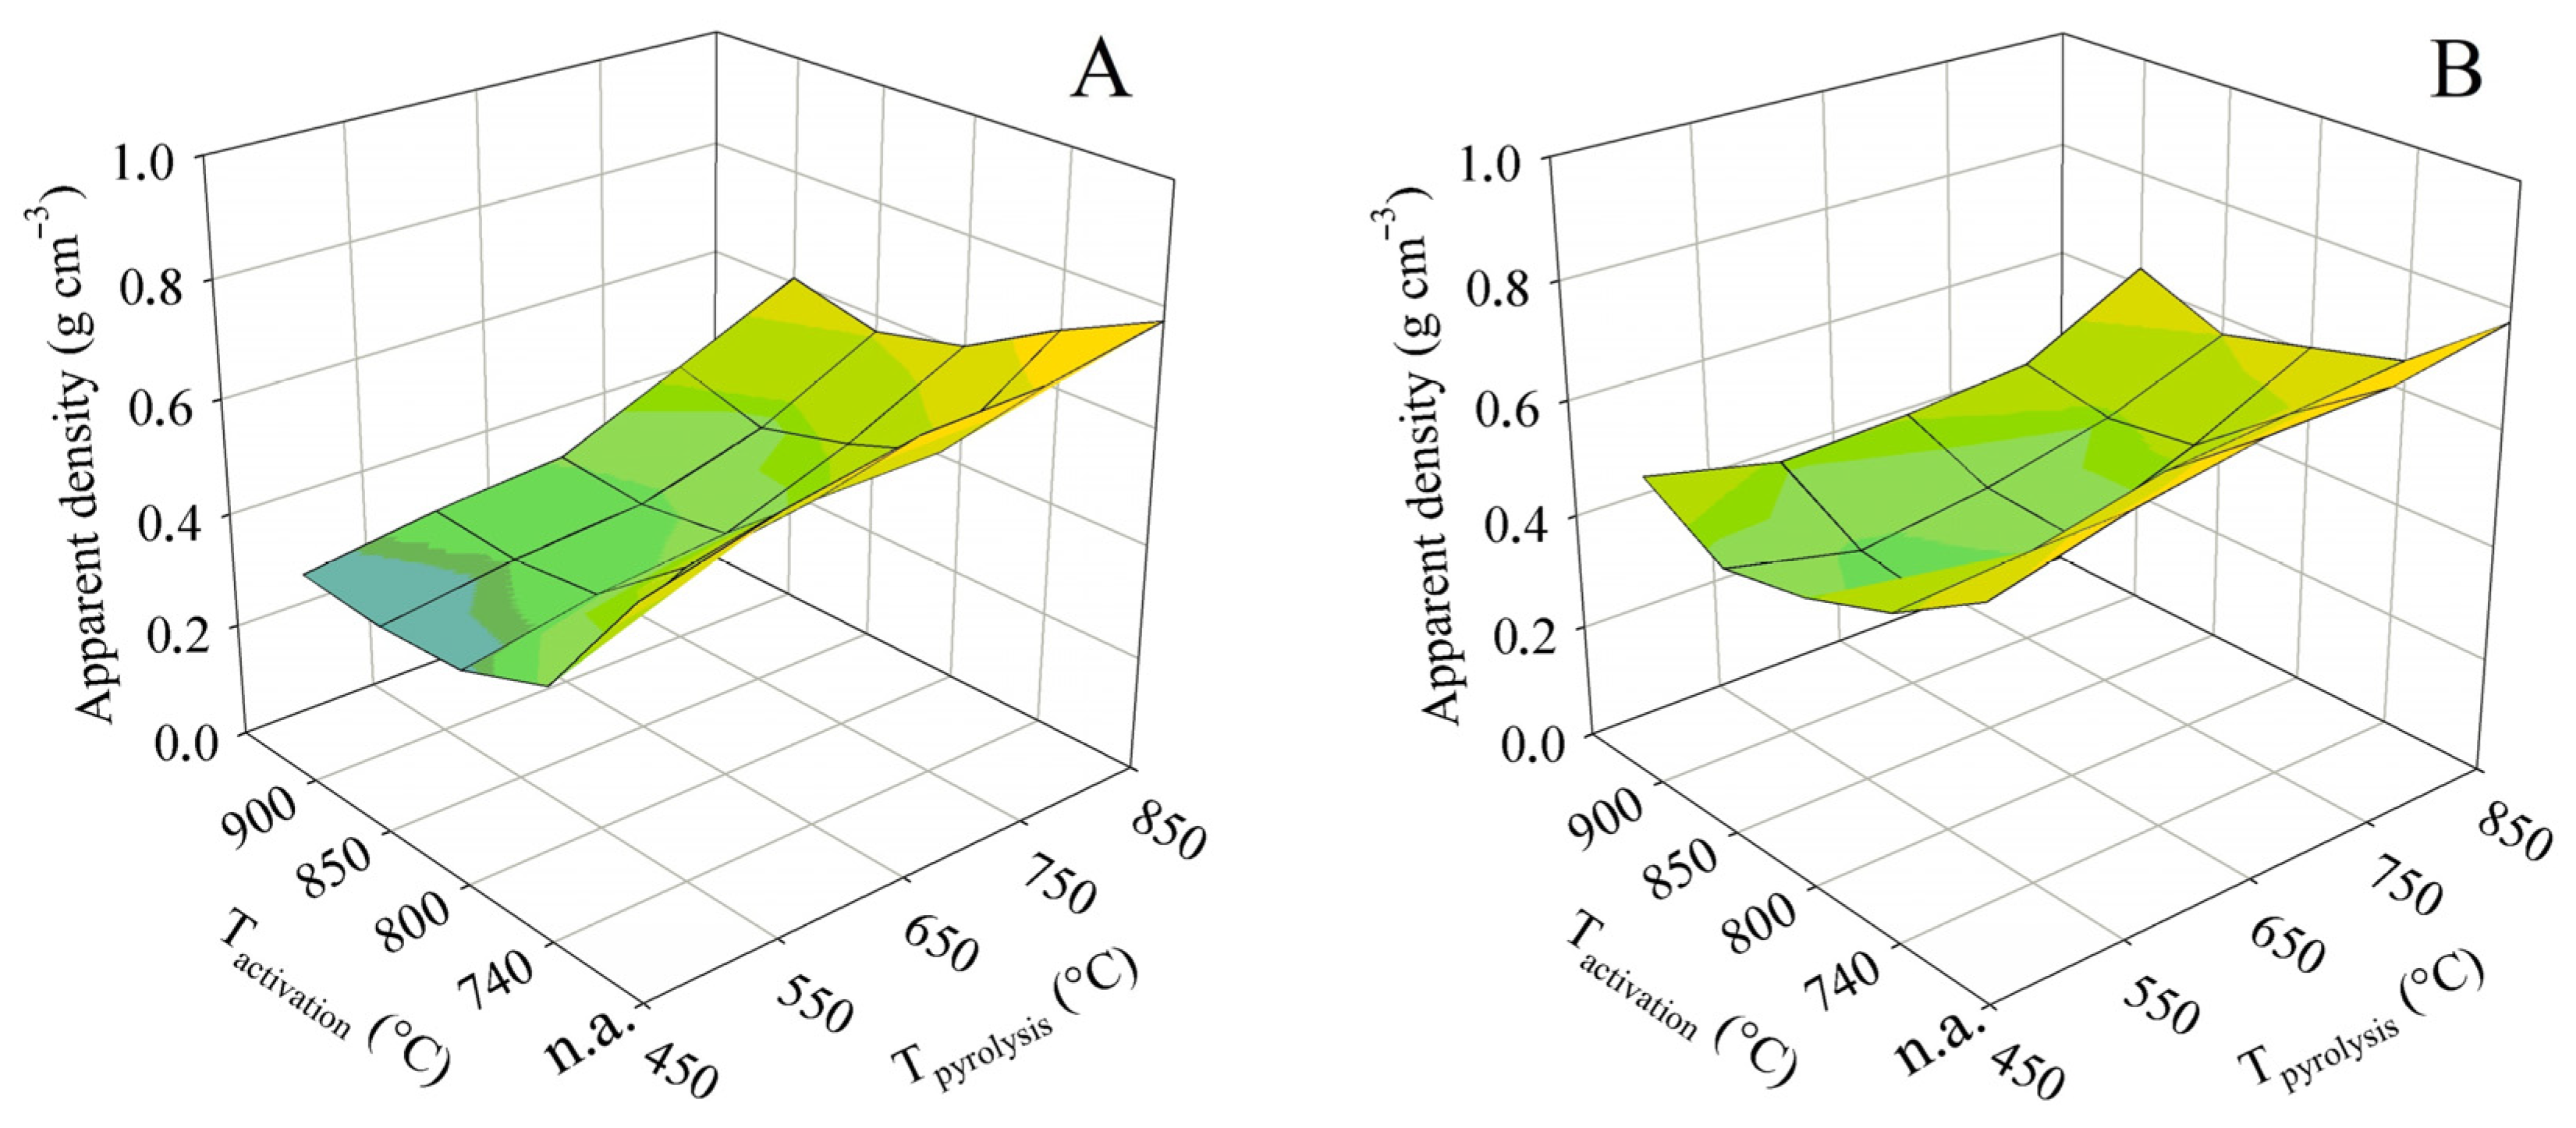
The activation conditions also led to measurable changes in true (helium) and apparent (mercury) density and the resulting porosity. Just as most of the other parameters, the porosity values were also plotted in the form of 3D surface plots (see Figure 9). The same treatment of the apparent density values is then shown in Figure 10. The porosity and apparent density were plotted against the final (set) pyrolysis temperature and the activation temperature.
For both contact times (A and B), the porosity trends were similar to those of the specific surface area and the total pore volume. At contact time A, the maximum of 88.4% was likewise achieved for pyrolysis up to 450 °C combined with activations at 850 and 900 °C. In contrast, for contact time B, the maximum of 86.4% was found for pyrolysis up to 550 °C, followed by activations at 800 and 850 °C.
It was possible to observe a non-significant but persistent increase in true density with activation temperature. In the case of contact time A, pyrolysis up to 450 °C led to an increase in the true density from 1.56 g cm−3 (non-activated material) to 2.94 g cm−3 (the activation temperature of 900 °C). For contact time B, an increase to 2.96 g cm−3 was recorded, which can be considered essentially the same. In contrast, the lowest activation temperature of 740 °C during pyrolysis up to 850 °C caused an increase in the true density from 1.73 g cm−3 to only 2.47 (contact time A) and 2.42 g cm−3 (contact time B). When samples activated at the same temperature but originating from pyrolysis up to different final temperatures were compared, the true density decreased very slightly with increasing pyrolysis temperature.
For pyrolysis without subsequent activation, it can be noted that the trend of the true density of the residues essentially followed what had been observed for pore volume and specific surface area. The value increased up to the final temperature of 750 °C, which was followed by a significant decrease at 850 °C.
The changes in the true density were probably caused by three factors. In the actual pyrolysis, it was the removal of higher-boiling substances that were potentially present in the solid residue at lower test temperatures. The opening of the porous system in the sample particles enabled the entry of the He atoms used in pycnometry. This was manifested in an increase in the measured true density. Conversely, the structural change that took place at 850 °C, when a decrease in BET surface area was also observed, caused pore closure. He atoms were thus prevented from penetrating into the interior of the particles and the method showed a lower density value. The third factor was not related to pyrolysis but to the subsequent activation. As mentioned above, the gasification reaction with steam caused a relatively large loss of the organic component of the material. Therefore, higher activation temperatures led to the creation of products with a higher mass fraction of inorganic components and hence a higher true density.
The apparent density exhibited trends different from those above because its calculation takes into account the volume of the solid skeleton and the pores. At both contact times, the apparent density decreased from the highest pyrolysis temperature to the lowest. The area formed by the 3D surface plot was concave in shape, with minima in apparent density being reached at activation temperatures of 800 or 850 °C. In such cases, the apparent densities were 0.36 g cm−3 (contact time A) and 0.39 g cm−3 (contact time B). In contrast, the highest pyrolysis temperature combined with a low activation temperature resulted in the maximum apparent densities of 0.70 and 0.65 g cm−3, respectively. However, the changes in apparent density do not fully reflect the course of the total pore volume shown in Figure 4. The reason is that the plots in Figure 4 show only the pores detectable by the nitrogen vapor adsorption method, but apparent density includes all pores determined by mercury porosimetry.
4. Conclusions
The experiments conducted proved that the pyrolysis of waste hemp shives and subsequent physical activation of the residues can produce AC with a specific surface area greater than 900 m2 g−1 and the total pore volume of up to 0.7 cm3 g−1.
An important finding was the negative effect of the double exposure of the material to high temperatures on the obtained textural properties of the product. The optimum temperature for pyrolysis was found to be 550 °C. Samples exposed to higher pyrolysis temperatures always achieved inferior specific surface areas during activation, regardless of the activation temperature. If the specific surface was considered the only parameter, the best activation temperature would be 900 °C, which was, however, associated with large material losses.
Compared to previously published works, this study brought comprehensive data in the sense of mapping the relationship between the temperatures of pyrolysis, activation, and the achieved textural properties of the solid product. In addition, the relationship between the aforementioned temperatures and process loss of solid product was described in a wide range of temperature conditions. This is important information for potentially introducing the waste hemp shives processing into industrial practice. According to the authors, a good compromise is a combination of the final pyrolysis temperature of 550 °C, an activation temperature of 850 °C, and 15 min of steam exposure. These conditions resulted in an AC with a specific surface area of 811 m2 g−1, while leading to a loss of only 27.9% with respect to the charge of the solid residue. This combination of conditions also resulted in the highest percentage of pores of <6 nm, slightly exceeding 59%.
Author Contributions
Conceptualization, M.P. and M.S.; methodology, M.S. and V.Š.; investigation, M.P., M.S. and V.Š.; data curation, V.Š.; writing—original draft preparation, M.S. and V.Š.; writing—review and editing, M.P.; supervision, M.P.; funding acquisition, M.P. and V.Š. All authors have read and agreed to the published version of the manuscript.
Funding
This research was funded by the Specific university research grant of the University of Chemistry and Technology, Prague, grant number A2_FTOP_2020_006 and A1_FTOP_2022_001 and by Czech Academy of Sciences, grant number AV 21—Sustainable energy.
Data Availability Statement
Data is contained within the article.
Acknowledgments
The results presented in this article were supported by the grant of Specific university research—grant No A2_FTOP_2020_006, No. A1_FTOP_2022_001 and Czech Academy of Sciences AV 21—Sustainable energy.
Conflicts of Interest
The authors declare no conflict of interest. The funders had no role in the design of the study; in the collection, analyses, or interpretation of data; in the writing of the manuscript; or in the decision to publish the results.
Appendix A. A Detailed Description of the Experimental Apparatuses and Procedures
Except for the flexible connection of pressure cylinders with the gas analyzer and the gas meter, the retorts/reactors and all piping of the pyrolysis and activation apparatus were made of stainless steel. Tubular furnaces with the same input power of 3.0 kW and internal diameter of 80 mm were used for both apparatuses as well.
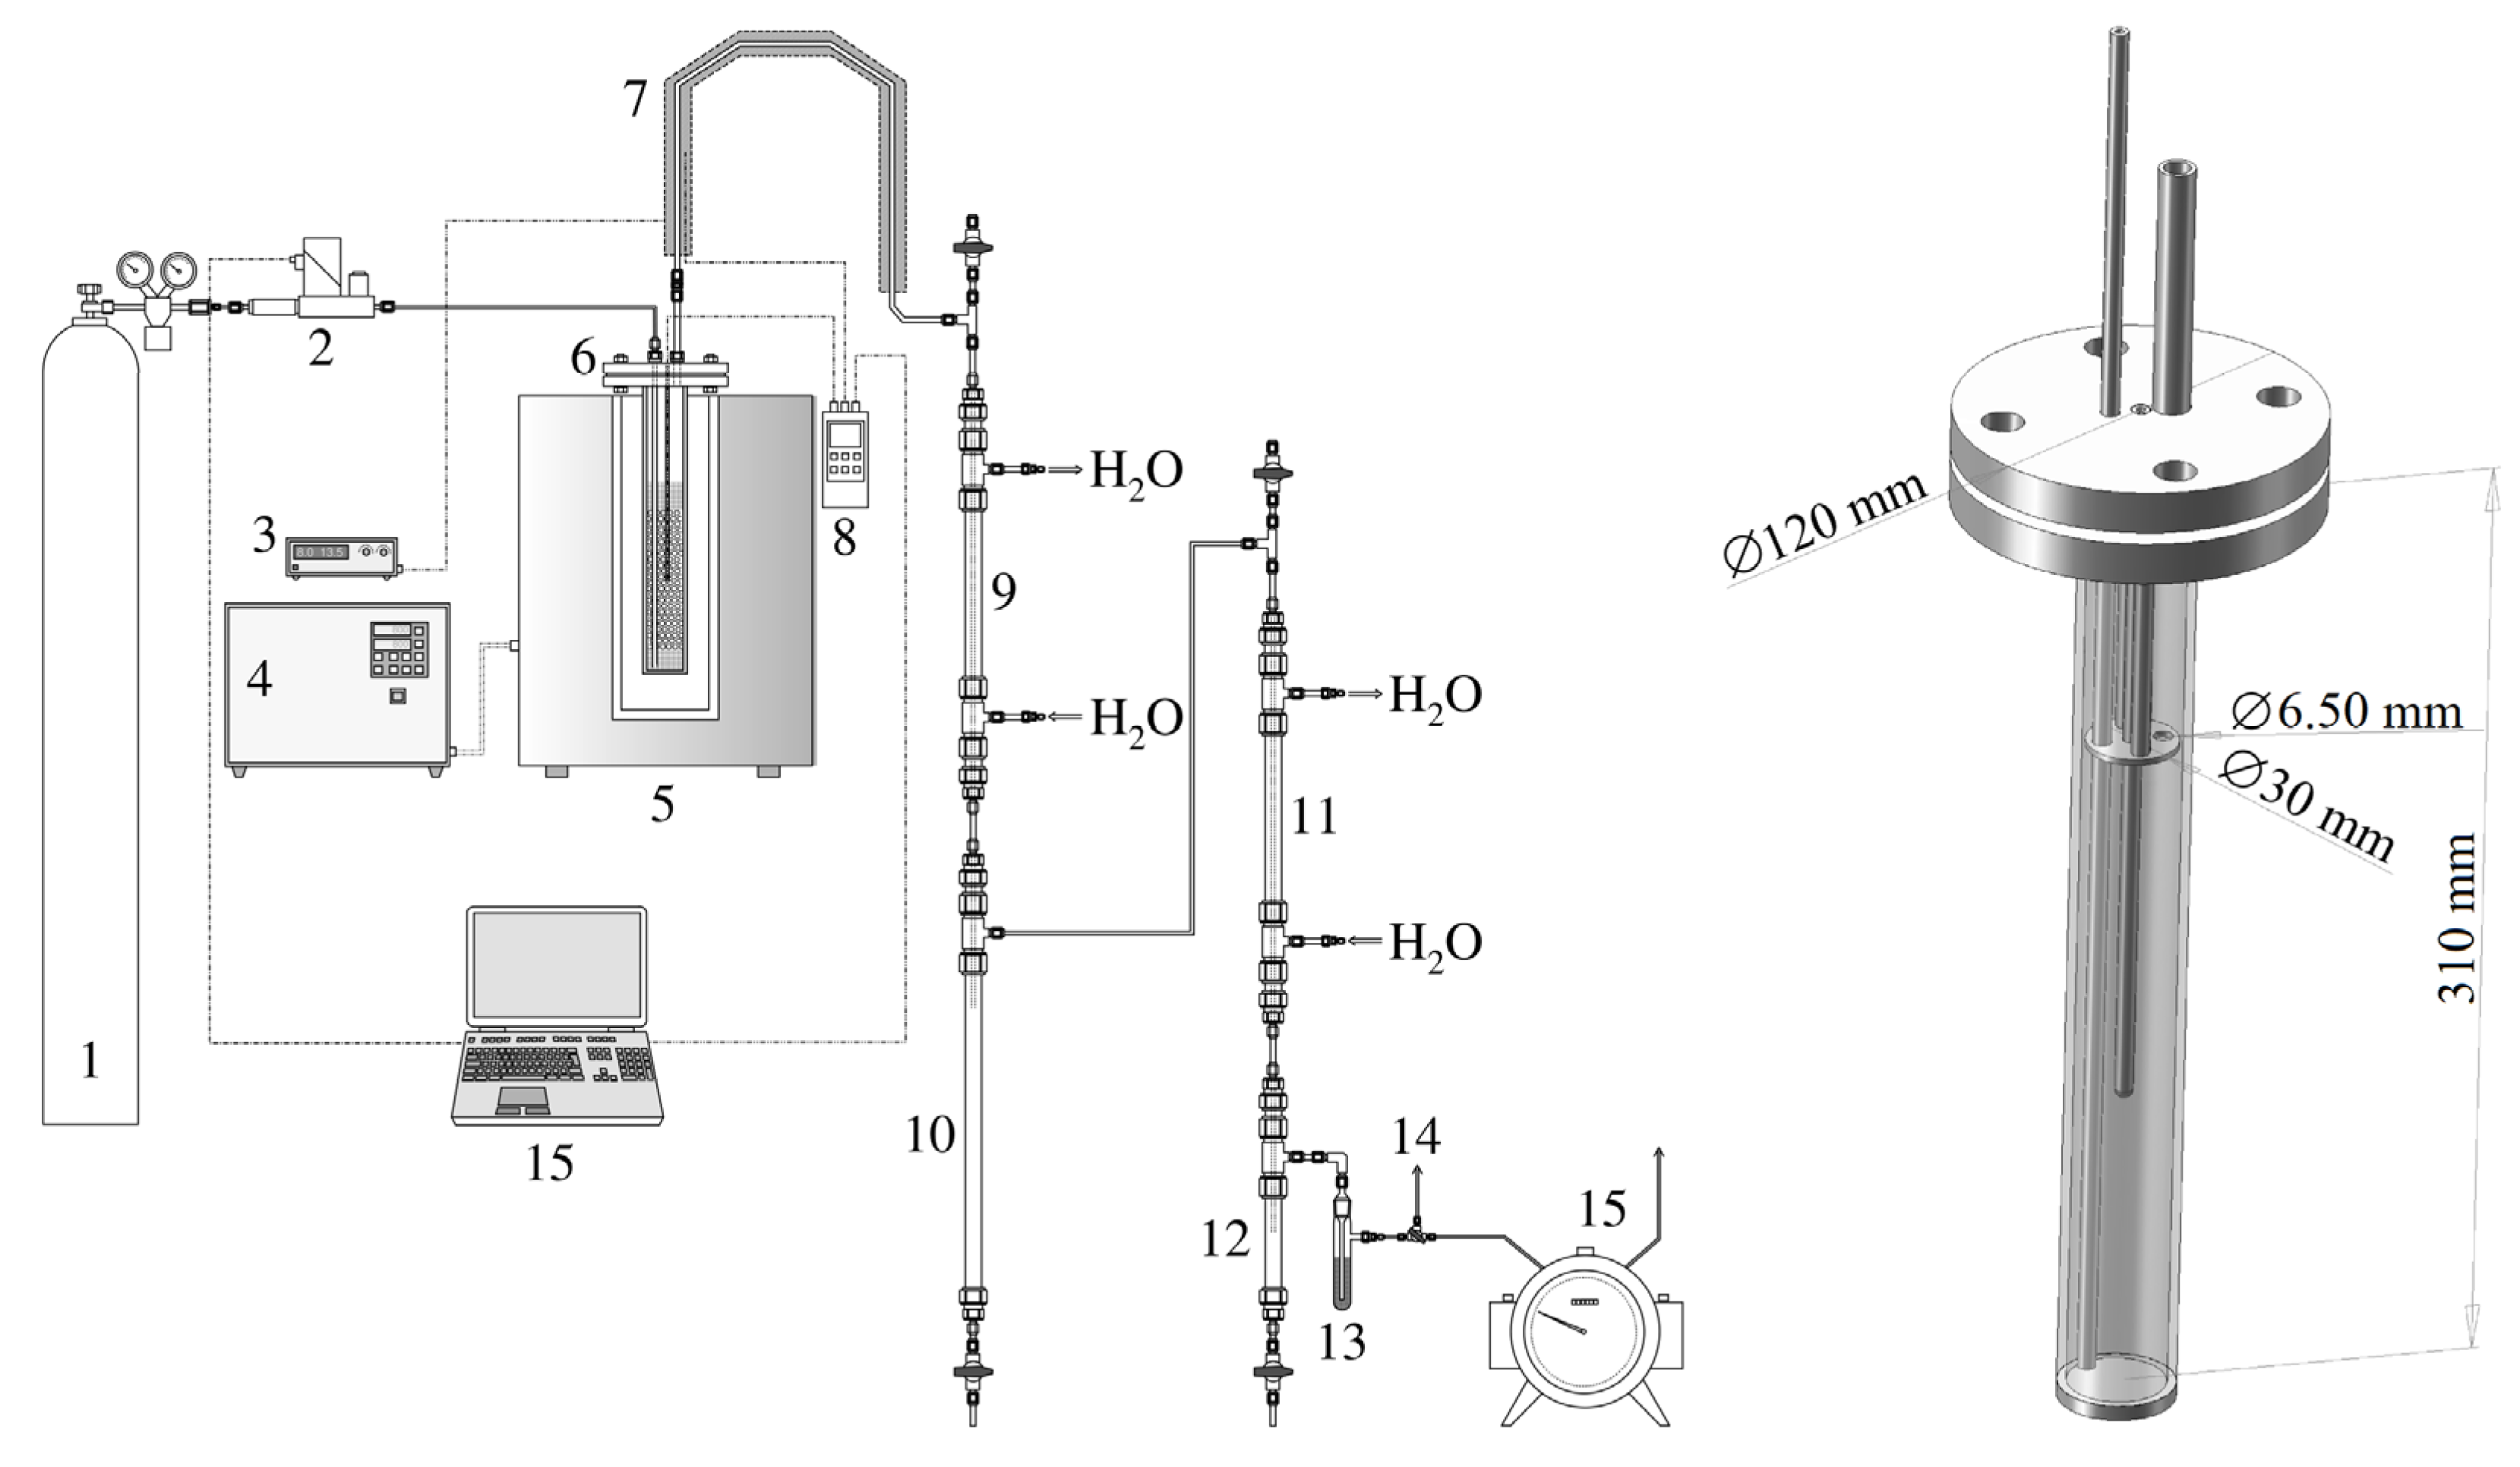
The arrangement of the pyrolysis apparatus is shown in Figure A1. For the sake of clarity, thermal insulation is not depicted. The same figure also shows a cross-section of the pyrolysis retort, which, in the same form, served as an activation reactor as well. The top filling flange was always located outside the furnace. The sample of biomass or pyrolysis residue for activation was placed under the pressure ring (see Figure A1, right). In addition, the retort/reactor axis contained a closed well of a Ni-NiCr (type K) thermocouple connected to a Greisinger GMH 3250 thermometer/datalogger (manufactured by GHM Messtechnik GmbH, Remscheid, Germany).
So as to make the interior of the apparatus inert, a pressure cylinder containing nitrogen (grade 4.0) was connected to it. The gas flow rate was regulated by an EL-FLOW Prestige FG-111BP thermal mass flow meter/controller (manufactured by Bronkhorst High-Tech B.V., Ruurlo, The Netherlands). The primary pyrolysis gas leaving the retort was conducted to the condenser through a heated pipe. Condensation occurred in two stages in steel liquid coolers of tube-in-tube design. The liquid pyrolysis products were either accumulated in cylindrical collectors located below the coolers or continuously weighed. Permanent gases could be collected in sampling bags, or their volume was read from a drum gas meter, which was the final element of the apparatus.
Figure A1.
The pyrolysis apparatus and a removed pyrolysis/activation retort (1—pressure cylinder with N2, 2—gas flow meter/controller, 3—heating controller of the retort output, 4—furnace heating controller, 5—cylindrical furnace, 6—retort with a sample, 7—heated pipe of the primary pyrolysis gas, 8—thermometer, 9—primary cooler, 10—primary condensate collector, 11—secondary cooler, 12—secondary condensate collector, 13—aerosol filter, 14—three-way valve for gas sampling, and 15—drum gas meter).

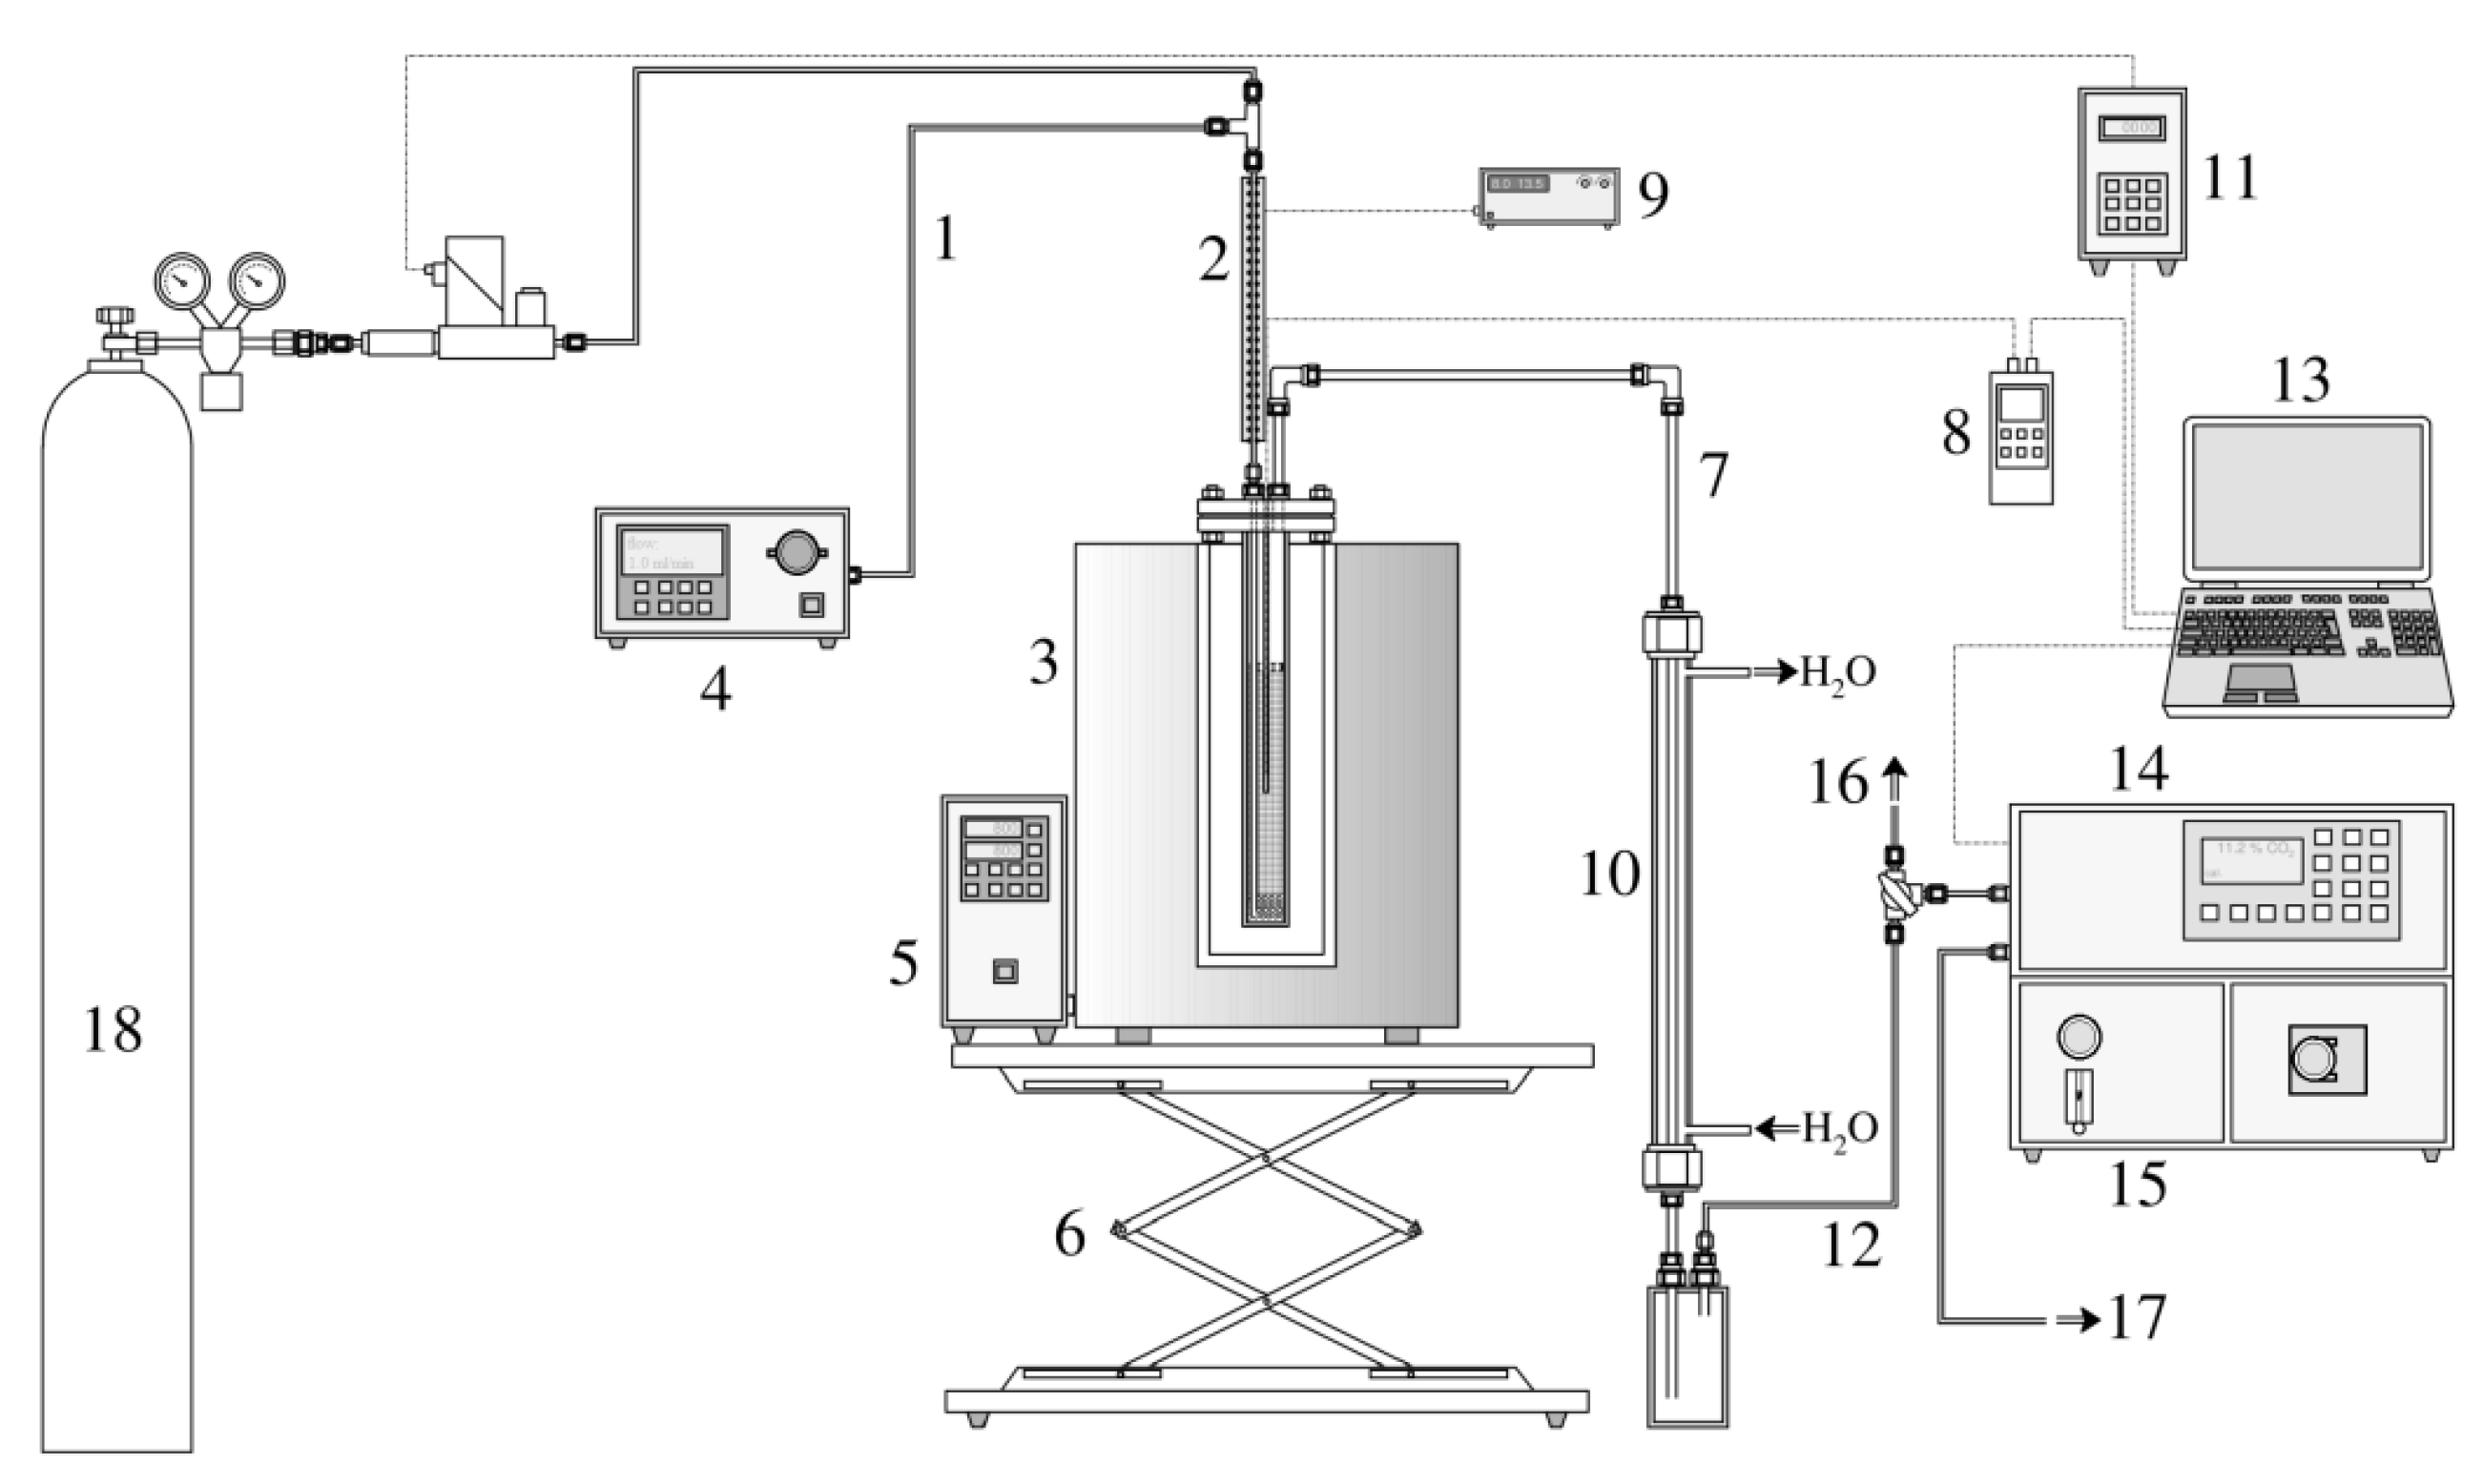
The interconnection of the key components of the activation apparatus can be seen in the diagram in Figure A2.
Figure A2.
The activation apparatus (1—inlet water capillary, 2—inlet preheating, 3—furnace, 4—water dosing pump, 5—furnace controller, 6—furnace scissor lift, 7—reactor output pipe, 8—thermometer/datalogger, 9—preheating controller, 10—water cooler, 11—programming unit of the gas flow meter/controller, 12—gas output to the analyzer, 13—PC for data recording, 14—gas analyzer, 15—chilling and filtering unit of the analyzer, 16—excess gas flow valve, 17—gas output, and 18—pressure cylinder containing N2).

Nitrogen 4.0 entered the apparatus through an EL-FLOW Prestige FG-111BP thermal mass flow meter with an electromagnetic controller (manufactured by Bronkhorst High-Tech B.V, Ruurlo, The Netherlands). Before the gas entered the reactor, distilled water was injected into the gas stream using a DeltaChrom SDS020 high-pressure dosing pump (manufactured by Watrex Praha, s.r.o., Prague, Czech Republic). The mixture passed through a capillary externally heated to 200 °C using a resistance spiral. In this form, the activation medium was fed through a flange into the reactor space, which was heated to the activation temperature. The steam was superheated by passing through a capillary running inside the reactor to its base, where the steam was distributed through perforations in the capillary wall into the sample bed (see Figure A1, right). The temperature in the sample bed was measured in the vertical axis of the reactor using a Ni-NiCr thermocouple (type K) connected to a Greisinger GMH 3250 thermometer/datalogger (manufactured by GHM Messtechnik GmbH, Remscheid, Germany). The activation process could be monitored in real time in two ways. The first was the temperature fluctuation in the reactor, or its short-term slight decrease, which occurred at the beginning of the endothermic reaction. The furnace PID controller quickly compensated for this drop, which resulted in a negative peak in the temperature record. At the end of the process, the opposite phenomenon occurred in the form of a positive peak. The second method was to detect the gaseous activation products formed. For this purpose, an Advance Optima Uras 14/Caldos 17 continuous analyzer (manufactured by ABB Ltd., Zürich, Switzerland) was used, displaying the volume fractions of CO, CO2, CH4, and H2. Both activation monitoring methods were used to detect e.g., non-standard sample behavior, system blockage, etc., but they did not make it possible to predict activated product parameters.
Appendix B. A Detailed Description of the Experimental Procedure
Pyrolysis was always carried out with sample charges of 79–80 g. After the retort was closed, the entire interior of the apparatus was rendered inert with nitrogen at atmospheric pressure. The nitrogen flow was then stopped and the furnace was heated at 10 °C min−1 until one of the five target temperatures chosen for the experiment was reached. Pyrolysis was then continued under isothermal conditions. During the pyrolysis, the temperature in the retort was continuously recorded every 10 s. Pyrolysis was terminated 15 min later when no gas or condensate production was detected. Cooling of the retort took place again under the nitrogen flow.
The mass balance of the process was always based on a combination of data obtained in triplicate. In the first experiment, the mass of condensate was continuously recorded every 10 s using a Kern PEJ balance with RS232 interface and SCD-4.0-PRO recording software (manufactured by KERN & SOHN GmbH, Balingen, Germany). In the second experiment, the condensate outlets were closed and the volume of the gas released was recorded at 60 s intervals (gas meter 15 in Figure A1). In the third experiment, the gas with condensation components removed was collected for chromatographic analysis. The total number of repetitions for each of the final temperatures was always equal to 3 × 3 = 9 pyrolyses with a new sample charge. The pyrolysis residues from the triple tests described were homogenized and served as feedstock for activation experiments.
Activation began by loading the same biochar charge into the reactor each time, closing the reactor, and starting the process of rendering the cold apparatus inert with nitrogen at a flow rate of 1.0 dm3 min−1 for 10 min. After the process was completed, the nitrogen flow rate was reduced to a working level of 0.5 dm3 min−1 and the furnace began to be heated at the rate of 10 °C min−1 to one of four activation temperatures. Once this was reached, steam dosing was activated. Throughout the activation period, data on the reactor temperature and the composition of the outlet gas were stored at 10 s intervals for process monitoring purposes. At the end of the activation, the steam source was first shut down. The reactor heating was disconnected only after the gas analyzer no longer displayed any emerging reaction products. The nitrogen supply was not stopped until the reactor temperature dropped to laboratory levels. The activated product obtained was then weighed and analyzed.
Appendix C. Online Recorded Data of the Pyrolysis Tests
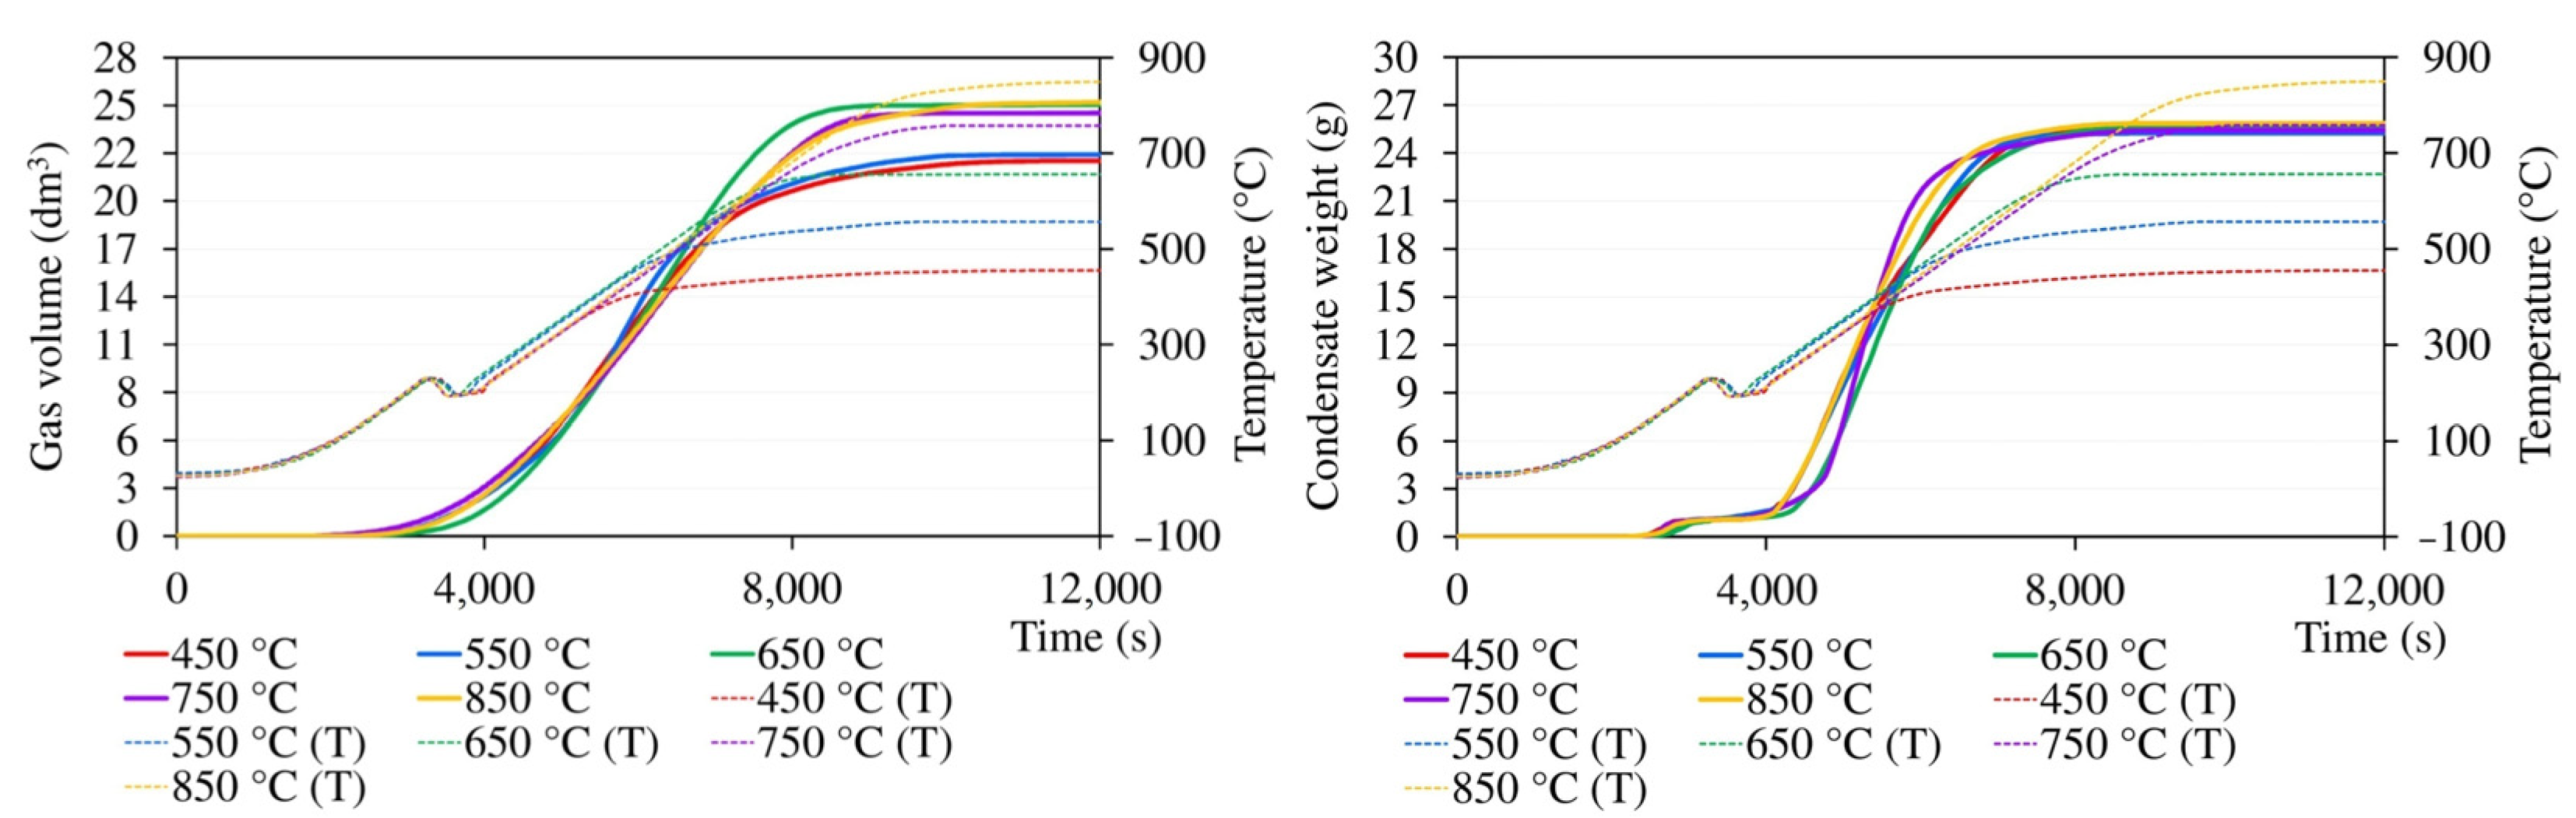
Gas and condensate release curves are demonstrated in Figure A3, where they are referenced to the time axis and complemented by instantaneous temperatures in the sample layer within the same sub-experiment. The temperature curve shows a short-term drop in temperature, which occurred whenever the temperature exceeded 215–225 °C and was caused by the onset of a strong endothermic decomposition of the sample. Because of the thermal capacity of the retort and furnace, it took some time for the heating controller to compensate for this drop. As is evident from Figure A3, negligible gas formation was already observed at temperatures as low as 130–140 °C. However, significant gas generation coincided with the temperature fluctuations mentioned above. The pyrolysis gas was generated up to very high temperatures; in experiments with the final temperature of 850 °C, its formation ceased at about 830 °C. The formation of condensate was first detected at a temperature of approximately 110–120 °C when the material was losing moisture. Significant condensate formation started at temperatures above 230–240 °C, slowed down at about 570 °C, and stopped completely at ca 700 °C.
Figure A3.
The course of the release of the gas and total condensates during pyrolysis (T indicates temperature inside the sample layer).
Figure A3.
The course of the release of the gas and total condensates during pyrolysis (T indicates temperature inside the sample layer).

References
- Castiglioni, M.; Rivoira, L.; Ingrando, I.; Meucci, L.; Binetti, R.; Fungi, M.; El-Ghadraoui, A.; Bakari, Z.; Del Bubba, M.; Bruzzoniti, M.C. Biochars intended for water filtration: A comparative study with activated carbons of their physicochemical properties and removal efficiency towards neutral and anionic organic pollutants. Chemosphere 2022, 288, 132538. [Google Scholar] [CrossRef] [PubMed]
- Ma, X.; Li, S.; Hou, Y.; Lv, H.; Li, J.; Cheng, T.; Yang, L.; Wu, H. Adsorption of low-concentration organic pollutants from typical coal-fired power plants by activated carbon injection. Process. Saf. Environ. Prot. 2022, 159, 1174–1183. [Google Scholar] [CrossRef]
- Song, G.; Deng, R.; Yao, Z.; Chen, H.; Romero, C.; Lowe, T.; Driscoll, G.; Kreglow, B.; Schobert, H.; Baltrusaitis, J. Anthracite coal-based activated carbon for elemental Hg adsorption in simulated flue gas: Preparation and evaluation. Fuel 2020, 275, 117921. [Google Scholar] [CrossRef]
- Doğan, M.; Sabaz, P.; Biçil, Z.; Kizilduman, B.K.; Turhan, Y. Activated carbon synthesis from tangerine peel and its use in hydrogen storage. J. Energy Inst. 2020, 93, 2176–2185. [Google Scholar] [CrossRef]
- Majchrzak-Kucęba, I.; Wawrzyńczak, D.; Ściubidło, A. Experimental investigation into CO2 capture from the cement plant by VPSA technology using zeolite 13X and activated carbon. J. CO2 Util. 2022, 61, 102027. [Google Scholar] [CrossRef]
- Lobato-Peralta, D.R.; Ayala-Cortés, A.; Longoria, A.; Pacheco-Catalán, D.E.; Okoye, P.U.; Villafán-Vidales, H.I.; Arancibia-Bulnes, C.A.; Cuentas-Gallegos, A.K. Activated carbons obtained by environmentally friendly activation using solar energy for their use in neutral electrolyte supercapacitors. J. Energy Storage 2022, 52B, 104888. [Google Scholar] [CrossRef]
- Mestre, A.S.; Viegas, R.M.C.; Mesquita, E.; Rosa, M.J.; Carvalho, A.P. Engineered pine nut shell derived activated carbons for improved removal of recalcitrant pharmaceuticals in urban wastewater treatment. J. Hazard. Mater. 2022, 437, 129319. [Google Scholar] [CrossRef]
- Wirasnita, R.; Mori, K.; Toyama, T. Effect of activated carbon on removal of four phenolic endocrine-disrupting compounds, bisphenol A, bisphenol F, bisphenol S, and 4-tert-butylphenol in constructed wetlands. Chemosphere 2018, 210, 717–725. [Google Scholar] [CrossRef]
- Elias, K.D.; Ejidike, I.P.; Mtunzi, F.M.; Pakade, V.E. Endocrine Disruptors-(estrone and β-estradiol) removal from water by Nutshell activated carbon: Kinetic, Isotherms and Thermodynamic studies. Chem. Thermodyn. Therm. Anal. 2021, 3–4, 100013. [Google Scholar] [CrossRef]
- Tibor, S.T.; Grande, C.A. Industrial production of activated carbon using circular bioeconomy principles: Case study from a Romanian company. Clean. Eng. Technol. 2022, 7, 100443. [Google Scholar] [CrossRef]
- Jaria, G.; Calisto, V.; Esteves, V.I.; Otero, M. Overview of relevant economic and environmental aspects of waste-based activated carbons aimed at adsorptive water treatments. J. Clean. Prod. 2022, 344, 130984. [Google Scholar] [CrossRef]
- Zatta, A.; Monti, A.; Venturi, G. Eighty Years of Studies on Industrial Hemp in the Po Valley (1930–2010). J. Nat. Fibers 2012, 9, 180–196. [Google Scholar] [CrossRef]
- Ranalli, P.; Venturi, G. Hemp as a raw material for industrial applications. Euphytica 2004, 140, 1–6. [Google Scholar] [CrossRef]
- Amaducci, S.; Scordia, D.; Liu, F.H.; Zhang, Q.; Guo, H.; Testa, G.; Cosentino, S.L. Key cultivation techniques for hemp in Europe and China. Ind. Crops Prod. 2015, 68, 2–16. [Google Scholar] [CrossRef]
- Karus, M.; Vogt, D. European hemp industry: Cultivation, processing and product lines. Euphytica 2004, 140, 7–12. [Google Scholar] [CrossRef]
- Stevulova, N.; Kidalova, L.; Cigasova, J.; Junak, J.; Sicakova, A.; Terpakova, E. Lightweight Composites Containing Hemp Hurds. Procedia Eng. 2013, 65, 69–74. [Google Scholar] [CrossRef] [Green Version]
- Doczekalska, B.; Kuśmierek, K.; Świątkowski, A.; Bartkowiak, M. Adsorption of 2,4-dichlorophenoxyacetic acid and 4-chloro-2-metylphenoxyacetic acid onto activated carbons derived from various lignocellulosic materials. J. Environ. Sci. Health Part B 2018, 53, 290–297. [Google Scholar] [CrossRef]
- Lupul, I.; Yperman, J.; Carleer, R.; Gryglewicz, G. Adsorption of atrazine on hemp stem-based activated carbons with different surface chemistry. Adsorption 2015, 21, 489–498. [Google Scholar] [CrossRef] [Green Version]
- Vukcevic, M.; Kalijadis, A.; Radisic, M.; Pejic, B.; Kostic, M.; Lausevic, Z.; Lausevic, M. Application of carbonized hemp fibers as a new solid-phase extraction sorbent for analysis of pesticides in water samples. Chem. Eng. J. 2012, 211, 224–232. [Google Scholar] [CrossRef]
- Vukčević, M.M.; Kalijadis, A.M.; Vasiljević, T.M.; Babić, B.M.; Laušević, Z.V.; Laušević, M.D. Production of activated carbon derived from waste hemp (Cannabis sativa) fibers and its performance in pesticide adsorption. Microporous Mesoporous Mater. 2015, 214, 156–165. [Google Scholar] [CrossRef]
- Zhang, J.; Gao, J.; Chen, Y.; Hao, X.; Jin, X. Characterization, preparation, and reaction mechanism of hemp stem based activated carbon. Results Phys. 2017, 7, 1628–1633. [Google Scholar] [CrossRef]
- Sun, W.; Lipka, S.M.; Swartz, C.; Williams, D.; Yang, F. Hemp-derived activated carbons for supercapacitors. Carbon 2016, 103, 181–192. [Google Scholar] [CrossRef] [Green Version]
- Yang, R.; Liu, G.; Li, M.; Zhang, J.; Hao, X. Preparation and N2, CO2 and H2 adsorption of super activated carbon derived from biomass source hemp (Cannabis sativa L.) stem. Microporous Mesoporous Mater. 2012, 158, 108–116. [Google Scholar] [CrossRef]
- Wang, Y.; Yang, R.; Li, M.; Zhao, Z. Hydrothermal preparation of highly porous carbon spheres from hemp (Cannabis sativa L.) stem hemicellulose for use in energy-related applications. Ind. Crops Prod. 2015, 65, 216–226. [Google Scholar] [CrossRef]
- Rosas, J.M.; Bedia, J.; Rodríguez-Mirasol, J.; Cordero, T. Preparation of Hemp-Derived Activated Carbon Monoliths. Adsorption of Water Vapor. Ind. Eng. Chem. Res. 2008, 47, 1288–1296. [Google Scholar] [CrossRef]
- Rosas, J.M.; Bedia, J.; Rodríguez-Mirasol, J.; Cordero, T. HEMP-derived activated carbon fibers by chemical activation with phosphoric acid. Fuel 2009, 88, 19–26. [Google Scholar] [CrossRef]
- Yang, R.; Liu, G.; Xu, X.; Li, M.; Zhang, J.; Hao, X. Surface texture, chemistry and adsorption properties of acid blue 9 of hemp (Cannabis sativa L.) bast-based activated carbon fibers prepared by phosphoric acid activation. Biomass Bioenergy 2011, 35, 437–445. [Google Scholar] [CrossRef]
- Lupul, I.; Yperman, J.; Carleer, R.; Gryglewicz, G. Tailoring of porous texture of hemp stem-based activated carbon produced by phosphoric acid activation in steam atmosphere. J. Porous Mater. 2015, 22, 283–289. [Google Scholar] [CrossRef] [Green Version]
- Williams, P.T.; Reed, A.R. High grade activated carbon matting derived from the chemical activation and pyrolysis of natural fibre textile waste. J. Anal. Appl. Pyrolysis 2004, 71, 971–986. [Google Scholar] [CrossRef]
- Liu, S.; Ge, L.; Gao, S.; Zhuang, L.; Zhu, Z.; Wang, H. Activated carbon derived from bio-waste hemp hurd and retted hemp hurd for CO2 adsorption. Compos. Commun. 2017, 5, 27–30. [Google Scholar] [CrossRef]
- Williams, P.T.; Reed, A.R. Pre-formed activated carbon matting derived from the pyrolysis of biomass natural fibre textile waste. J. Anal. Appl. Pyrolysis 2003, 70, 563–577. [Google Scholar] [CrossRef]
- Azmi, N.Z.M.; Buthiyappan, A.; Raman, A.A.A.; Patah, M.F.A.; Sufian, S. Recent advances in biomass based activated carbon for carbon dioxide capture—A review. J. Ind. Eng. Chem. 2022, 116, 1–20. [Google Scholar] [CrossRef]
- Hassan, M.F.; Sabri, M.A.; Fazal, H.; Hafeez, A.; Shezad, N.; Hussain, M. Recent trends in activated carbon fibers production from various precursors and applications—A comparative review. J. Anal. Appl. Pyrolysis 2020, 145, 104715. [Google Scholar] [CrossRef]
- Kanjana, K.; Harding, P.; Kwamman, T.; Kingkam, W.; Chutimasakul, T. Biomass-derived activated carbons with extremely narrow pore size distribution via eco-friendly synthesis for supercapacitor application. Biomass Bioenergy 2021, 153, 106206. [Google Scholar] [CrossRef]
- Pallarés, J.; González-Cencerrado, A.; Arauzo, I. Production and characterization of activated carbon from barley straw by physical activation with carbon dioxide and steam. Biomass Bioenergy 2018, 115, 64–73. [Google Scholar] [CrossRef] [Green Version]
- Kim, D.-W.; Kil, H.-S.; Nakabayashi, K.; Yoon, S.-H.; Miyawaki, J. Structural elucidation of physical and chemical activation mechanisms based on the microdomain structure model. Carbon 2017, 114, 98–105. [Google Scholar] [CrossRef]
- Hadi, P.; Yeung, K.Y.; Guo, J.; Wang, H.; McKay, G. Sustainable development of tyre char-based activated carbons with different textural properties for value-added applications. J. Environ. Manag. 2016, 170, 1–7. [Google Scholar] [CrossRef]
Figure 1.
Visual appearance of the sample (left—raw material, middle—residue after the pyrolysis up to 450 °C, and right—residue after the pyrolysis up to 750 °C).
Figure 1.
Visual appearance of the sample (left—raw material, middle—residue after the pyrolysis up to 450 °C, and right—residue after the pyrolysis up to 750 °C).

Figure 2.
The yields of condensates, solid residues, and gases (a) complemented by the temperature dependence of the gas composition (b).
Figure 2.
The yields of condensates, solid residues, and gases (a) complemented by the temperature dependence of the gas composition (b).

Figure 3.
Changes in specific surface in dependence on pyrolysis and activation conditions for series (A,B).
Figure 3.
Changes in specific surface in dependence on pyrolysis and activation conditions for series (A,B).

Figure 4.
Changes in the total pore volume in dependence on pyrolysis and activation conditions for series (A,B).
Figure 4.
Changes in the total pore volume in dependence on pyrolysis and activation conditions for series (A,B).

Figure 5.
Changes in pore size distribution in dependence on activation conditions applied to the solid residue obtained by pyrolysis up to 450 °C for series (A,B).
Figure 5.
Changes in pore size distribution in dependence on activation conditions applied to the solid residue obtained by pyrolysis up to 450 °C for series (A,B).

Figure 6.
Changes in pore size distribution in dependence on activation conditions applied to the solid residue obtained by pyrolysis up to 850 °C for series (A,B).
Figure 6.
Changes in pore size distribution in dependence on activation conditions applied to the solid residue obtained by pyrolysis up to 850 °C for series (A,B).

Figure 7.
Changes in the volume of the pores with the diameter of <6 nm in dependence on pyrolysis and activation conditions for series (A,B).
Figure 7.
Changes in the volume of the pores with the diameter of <6 nm in dependence on pyrolysis and activation conditions for series (A,B).

Figure 8.
The evolution of the process losses caused by different pyrolysis and activation conditions for series (A,B).
Figure 8.
The evolution of the process losses caused by different pyrolysis and activation conditions for series (A,B).

Figure 9.
The impact of the pyrolysis and activation conditions on porosity for series (A,B).

Figure 10.
The impact of the pyrolysis and activation conditions on apparent density for series (A,B).
Figure 10.
The impact of the pyrolysis and activation conditions on apparent density for series (A,B).


Table 1.
The parameters of the tested material based on proximate and ultimate analysis.
| Parameter | Unit | Value | Method |
|---|---|---|---|
| Moisture | (wt.%) | 4.1 | ASTM E1756-08 |
| Ash in dry matter | (wt.%) | 1.55 | ASTM E1755-01 |
| Volatiles | (wt.%) | 77.0 | ASTM E1756-08 |
| C in dry matter | (wt.%) | 40.7 | OEA |
| H in dry matter | (wt.%) | 5.7 | OEA |
| N in dry matter | (wt.%) | 1.9 | OEA |
| S in dry matter | (wt.%) | 0.1 | OEA |
Table 2.
The main parameters of the pyrolysis and activation parts of the experiment.
| Parameter | Unit | Pyrolysis | Activation |
|---|---|---|---|
| Sample weight | (g) | 79–80 | 10 |
| Temperature ramp | (°C min−1) | 10 | 10 |
| Final temperature | (°C) | 450, 550, 650, 750, 850 | 740, 800, 850, 900 |
| Pressure | (barabs.) | 1.0 | 1.1 |
| N2 flow | (dm3 min−1) | 0.0 | 0.5 |
| Steam flow | (g min−1) | N/A | 2.0 |
| Contact time with steam | (min) | N/A | 25 and 15 |
| Steam/sample ratio | (g g−1) | N/A | 3 and 5 |
Disclaimer/Publisher’s Note: The statements, opinions and data contained in all publications are solely those of the individual author(s) and contributor(s) and not of MDPI and/or the editor(s). MDPI and/or the editor(s) disclaim responsibility for any injury to people or property resulting from any ideas, methods, instructions or products referred to in the content. |
© 2023 by the authors. Licensee MDPI, Basel, Switzerland. This article is an open access article distributed under the terms and conditions of the Creative Commons Attribution (CC BY) license (https://creativecommons.org/licenses/by/4.0/).
Share and Cite
MDPI and ACS Style
Staf, M.; Šrámek, V.; Pohořelý, M. The Preparation of a Carbonaceous Adsorbent via Batch Pyrolysis of Waste Hemp Shives. Energies 2023, 16, 1202. https://doi.org/10.3390/en16031202
AMA Style
Staf M, Šrámek V, Pohořelý M. The Preparation of a Carbonaceous Adsorbent via Batch Pyrolysis of Waste Hemp Shives. Energies. 2023; 16(3):1202. https://doi.org/10.3390/en16031202
Chicago/Turabian StyleStaf, Marek, Vít Šrámek, and Michael Pohořelý. 2023. "The Preparation of a Carbonaceous Adsorbent via Batch Pyrolysis of Waste Hemp Shives" Energies 16, no. 3: 1202. https://doi.org/10.3390/en16031202
Note that from the first issue of 2016, this journal uses article numbers instead of page numbers. See further details here.