
Perspective Design of Algae Photobioreactor for Greenhouses—A Comparative Study
by
 , ,
, ,
Kateřina Sukačová
1,* ,
,
Pavel Lošák
2, 
Vladimír Brummer
2, 
Vítězslav Máša
2,
Daniel Vícha
1 and
Tomáš Zavřel
1
1
Global Change Research Institute, Academy of Sciences of the Czech Republic, Bělidla 986/4a, 603 00 Brno, Czech Republic
2
Institute of Process Engineering, Brno University of Technology, Technická 2896/2, 616 69 Brno, Czech Republic
*
Author to whom correspondence should be addressed.
Energies 2021, 14(5), 1338; https://doi.org/10.3390/en14051338
Submission received: 2 February 2021
/
Revised: 25 February 2021
/
Accepted: 25 February 2021
/
Published: 1 March 2021
(This article belongs to the Special Issue Microalgae Cultures: Environmental Tool and Bioenergy Source)
Abstract
:The continued growth and evolving lifestyles of the human population require the urgent development of sustainable production in all its aspects. Microalgae have the potential of the sustainable production of various commodities; however, the energetic requirements of algae cultivation still largely contribute to the overall negative balance of many operation plants. Here, we evaluate energetic efficiency of biomass and lipids production by Chlorella pyrenoidosa in multi-tubular, helical-tubular, and flat-panel airlift pilot scale photobioreactors, placed in an indoor environment of greenhouse laboratory in Central Europe. Our results show that the main energy consumption was related to the maintenance of constant light intensity in the flat-panel photobioreactor and the culture circulation in the helical-tubular photobioreactor. The specific power input ranged between 0.79 W L−1 in the multi-tubular photobioreactor and 6.8 W L−1 in the flat-panel photobioreactor. The construction of multi-tubular photobioreactor allowed for the lowest energy requirements but also predetermined the highest temperature sensitivity and led to a significant reduction of Chlorella productivity in extraordinary warm summers 2018 and 2019. To meet the requirements of sustainable yearlong microalgal production in the context of global change, further development towards hybrid microalgal cultivation systems, combining the advantages of open and closed systems, can be expected.
1. Introduction
We are currently experiencing a growing demand for products that do not burden our planet with the co-production of greenhouse gases, as well as for products that respect the principles of sustainability [1]. In line with these requirements, we can see a growing demand for bio-based products [2]. These trends are very well met by the possibilities offered by the use of microalgae, especially in the field of pharmacy [3], food industry [4,5,6], and industrial lipids production [7,8]. In the pharmaceutical and food industries, a high added value of products entering the market can be often predicted, which opens a wide range of possibilities for microalgae production applications. Lipid production is currently investigated mainly regarding biofuels production, which is, however, still not competitive enough compared to the existing technologies [9,10], even though the algae biodiesel is of comparable quality with other biodiesels [11]. Intensive research on microalgae cultivation, system optimization, and other aspects of the supply chain is currently being carried out using the most advanced algorithms [12]. Microalgae have also high potential for wastewater and industrial waste gases treatment [9,13].
Microalgae come in many forms and one of the indisputable advantages is the possibility of cultivating adapted strains according to the chosen applications. In addition, the current technological level allows for the subsequent cultivation of selected strains in order to perform specific tasks. For this purpose, a molecular sieve [14] or genome editing tools [15] can be used.
The presented article focuses on the usage of closed photobioreactors (PBRs) technology for microalgal cultivation in Central European region. The climate conditions of a temperate zone predetermine the need to use the PBR technology as the environment does not provide stable sunlight and a suitable temperature for a sufficient part of the year to use open-air cultivation systems. Even though the climate conditions are far from optimal, the use of closed PBRs in temperate zone makes sense. Unlike in open-air cultivation systems, the use of PBRs prevents or reduces contamination (by bacteria, protozoa, or unwanted algal species [2]). Cultivation in PBRs also allows for better control of the cultivation process, including the maintenance of balanced growth conditions (nutrients, light, temperature) for effective biomass production [16]. Because of these advantages, it can be assumed that PBRs will remain a necessary technology in the algae cultivation industry as open-air cultivation systems and their modifications cannot offer a sufficient product quality. The future challenges of algae cultivation technology will be to improve the construction of PBRs, to reduce their energy consumption, and to optimize cultivation processes, together with the optimization of the algae strains according to specific applications.
This work provides a comparison of three different PBRs designs (geometry) in the context of biomass and lipid production and energy consumption. The choice of cultivation strategy strongly depends on the operation site [17]. The advantages of open-air cultivation systems over closed systems [18] are lower investment costs [19] and lower energy consumption [20]; however, only in the areas with high solar exposure. Acién Fernández et al. [21] reported the average yearly energetic consumption of raceway pond around 1 W/m3 compared to the energetic consumption of tubular PBR about 500 W/m3. On the contrary, the disadvantages of the open systems are the higher chance of contamination and lower biomass production compared to the closed PBRs [16,21,22]. A closed PBRs technology generally allows for better regulation and control of the main biotic and abiotic growth factors [1,18,23].
Closed PBRs can be operated indoors, using natural or artificial lighting, or outdoors. Outdoor applications will require less energy for lighting; however, depending on the location, this benefit may be eliminated by the need to cool the PBRs to avoid overheating [17]. Wang et al. [18] highlighted that an efficient cooling method, such as water spraying, may increase a cost especially for large scale operation.
Many authors have studied specific aspects of efficient production in individual PBRs types, including light and temperature management, energetic management or optimization of cultivation parameters [2,24,25,26]. However, most of the studies focus on one specific PBR type [24,26] or compare results from different cultivation conditions [2,17,25]. Only few studies evaluate PBRs design during parallel PBRs operation under identical environmental conditions. For instance, Wolf et al., [27] compared five specific microalgae production systems (high-rate ponds, low and high flat panel, low and high tubular PBRs) under sub-tropical Australian conditions that are well suited for microalgal production. The work of Wolf et al. [27] described the relationship between temperature, heat load and PBR geometry in the context of biomass production and highlighted the importance of the surface-to-volume ratio for maximizing biomass production in PBRs.
The aim of this study is the comparison of biomass and lipid production during parallel cultivation in three specific PBRs and evaluation of impact of different design (geometry) on energy consumption as a crucial factor for evaluating cultivation cost. The Multi-Tubular airlift PBR and Helical-Tubular airlift PBRs were placed in an indoor environment of greenhouse laboratory that ensured a sufficient supply of natural light through the glass ceiling and walls and provided protection against cool temperatures in the spring or autumn. Moreover, Flat Panel airlift PBR with full control of cultivation conditions was included in the study and placed in the same greenhouse laboratory. To the best of our knowledge, the presented results evaluate, for the first-time, energy consumption and biomass and lipid productivity in parallel microalgae cultivation in the Central European region, which allows us to directly assess the impact of PBR design on cultivation process and costs.
2. Materials and Methods
2.1. Cultivation Conditions and Experimental Design
Chlorella pyrenoidosa Chick (IPPAS C2, denoted as C. pyrenoidosa hereafter), was kindly provided by Dr. Maria Sinetova (Institute of Plant Physiology, Moscow, Russia). The stock cultures were maintained in BG-11 medium [28] at 25 °C, under light intensity of 70 μmol m−2 s−1 in a cultivation chamber (Algaetron, Photon System Instruments, Drásov, Czech Republic) with CO2 enriched air (final concentration of 2%).
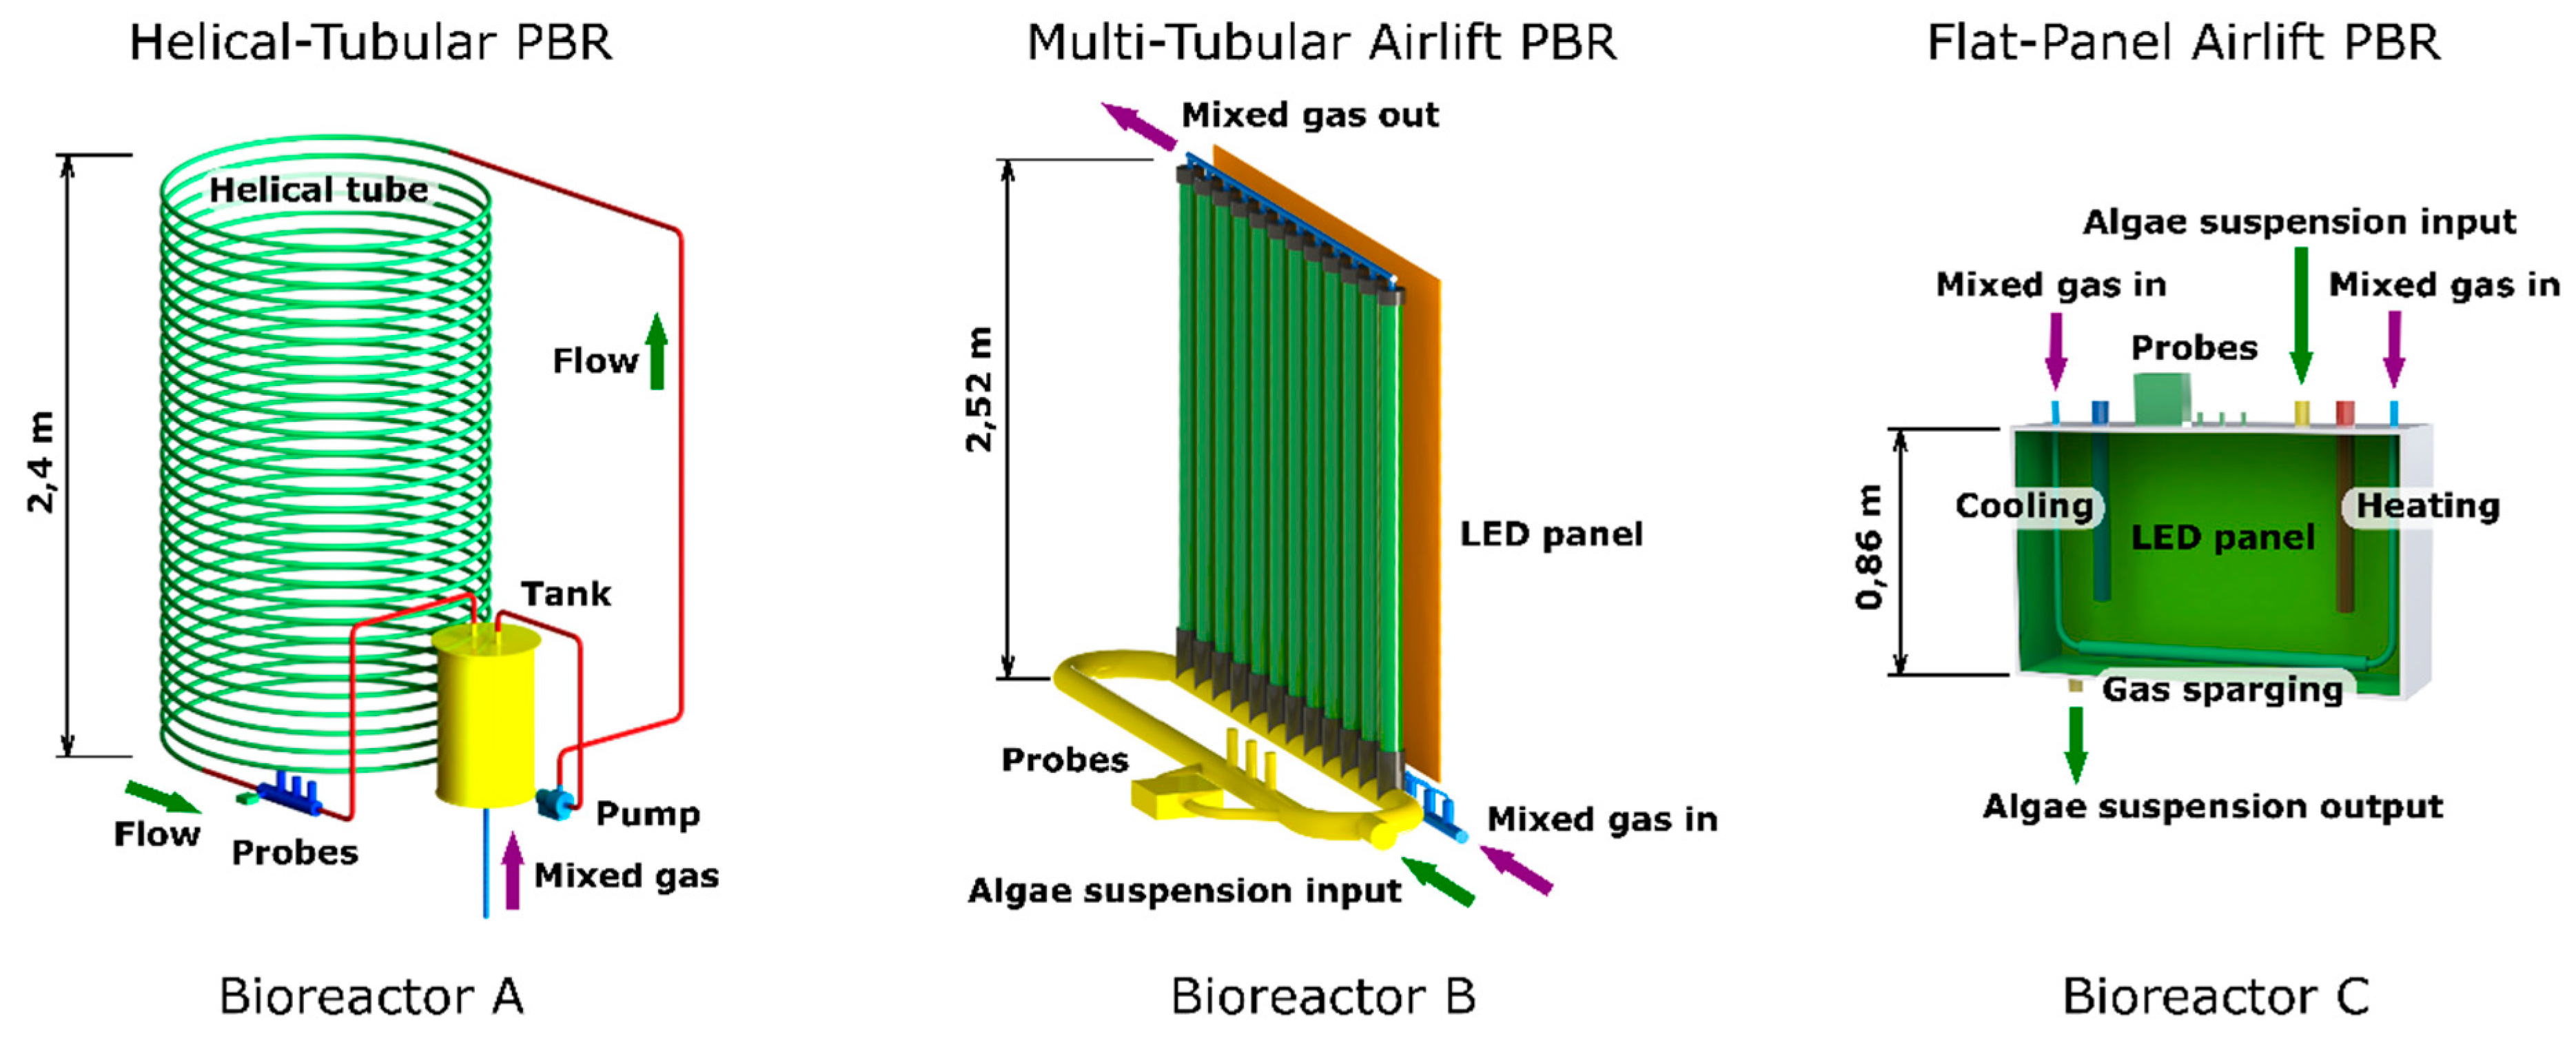
The experiments were performed throughout two consecutive years, 2018 and 2019. C. pyrenoidosa was cultivated in three photobioreactors of specific construction: Multi-Tubular Airlift photobioreactor (MTA PBR, working volume 60 L), Helical-Tubular Photobioreactor (H-T PBR, working volume 200 L) and Flat-Panel Airlift Photobioreactor (FPA PBR, working volume of 25 L, see Figure 1 and Section 2.2 for details).
Two types of experiments were performed: C. pyrenoidosa was cultivated in batch cultures in full BG-11 medium and in the N-limited BG-11 medium where NO3− concentration was decreased to 150 mg/L (10 times lower compared to the original BG-11 medium). This concentration was identified as optimal for lipid accumulation [29]. The cultures for the inoculation of MTA and H-T PBRs were prepared in FPA PBR and the biomass content of inoculum cultures was 1.5 g L−1 (dry weight). Inoculum volume was 8 L for MTA PBR (16% working volume) and 15 L for H-T PBR (15% working volume). Cultures in both MTA PBR and H-T PBR were initiated simultaneously to ensure identical environmental conditions (light and temperature) for both cultivations. Both MTA PBR and H-T PBR were illuminated solely by solar irradiance, and the temperature was monitored but not controlled. Both photobioreactors were aerated by CO2-enriched air (final CO2 concentration of 3%) with flow rate of 0.4 L min−1 Lculture−1 (20 L min−1 for MTA PBR and 40 L min−1 for H-T PBR).
In the FPA PBR, the cultivation conditions were controlled as follows: white light was set to 400 μmol m−2 s−1 (provided by LED panel at back side of the PBR, in addition to day light penetrating front side), temperature was set to 25 °C and 3% CO2 concentration in the air mixture was bubbled through the culture with flow rate of 2 L min−1 (0.08 L min−1 Lculture−1, according Sukačová et al. [30]). All cultivations lasted for eight days.
2.2. Photobioreactor Units
MTA PBR consisted of 12 transparent PVC tubes with a diameter of 0.05 m and a height of 2.52 m, arranged in a vertical position. The distance between the tubes was 0.06 m. Each vertical tube contained an inlet port for the air/CO2 mixture at the bottom part. At the bottom of the PBR, the transparent tubes were inserted in polyurethane interconnected T-shape tubes. The upper part of the PBR consisted of interconnected T-shape tubes in which the transparent tubes were fixed and that allowed for headspace presence over the cultures (10–15% of total volume). The total volume (V) of MTA PBR was 60 L. The illuminated surface area (SA) was 4.68 m2, which resulted in the SA/V ratio 78 m2 m−3.
H-T PBR consisted of a spiral coiled tube (illuminated part of PBR) and a tank with a pump that secured the culture circulation (dark part of PBR). The spiral coiled tube (diameter of 0.034 m) with working volume of 170 L was made of transparent fluorinated ethylene propylene. The outer diameter of the H-T PBR was 1.7 m and the height was 2.4 m. The position of the transparent spiral tubes was secured by fixing the tubes to a metal frame placed inside the PBR. The tubes were connected to the dark part of PBR with a working volume of 30 L from which the algal suspension was pumped to the upper part of the PBR to circulate through the illuminated part back to the tank. The illuminated surface area (SA) was 25 m2. The total volume of H-T PBR was 200 L. The SA/V ratio was 125 m2 m−3. Flow rate of algal suspension was 6 L min−1. Both the MTA PBR and H-T PBR were equipped by sensors that allowed for the real time monitoring of culture temperature, pH, optical density (at both 680 nm and 720 nm), and steady-state fluorescence parameters (FT, FM, Y(II)).
The flat panel PBR consisted of closed glass cultivation tank (25 L) fitted in a metal frame (outer dimensions of the PBR were 0.86 × 1.03 × 0.17 m). The aeration element was placed horizontally at the bottom part inside the tank. The PBR was equipped with light regulation and temperature control. The temperature control consisted of a heating element (not turned on throughout the entire experimental period) and a custom-made cooling system connected to the chilled water distribution pipes and a solenoid valve controlling the chilled water inlet into the cooling element of the FPA PBR. The PBR monitoring system allowed for measuring the same parameters as in MTA PBR and H-T PBR. Additional FPA PBR accessories are described in Sukačová et al. [30].
The aeration of all PBRs was secured by a gas mixing system GMS 150 (Photon Systems Instruments, Drásov, Czech Republic). PBRs were placed in an indoor greenhouse laboratory that ensured a supply of natural light through the glass ceiling and glass walls in South Moravia Region of the Czech Republic (49.3373761 N, 16.4751258 E). Inside the greenhouse, the temperature was not regulated.
2.3. Analytical Procedures
2.3.1. Determination of Dry Weight, Total Lipid Content and Productivity
The dry weight (DW) of algal biomass was detected gravimetrically. First, 1 mL of C. pyrenoidosa culture was centrifuged (10,000× g, MegaStar 3.0R, VWR, Wayne, PA, USA) and pellet freeze-dried (ScanVac CoolSafe, LaboGene, Lillerød, Denmark) in pre-weighed Eppendorf tubes. The tubes were then weighted using XA105DR analytical balances (Mettler Tolledo, Greifensee, Switzerland). For each sampling, DW determinations were performed in triplicates.
To derive the culture productivity parameters, the dry weight data were interpolated by a logistic function:
where N0 represents the population size at the beginning of the cultivation, Nt represents the population size in time t, K represents the maximum population size, and r represents the population growth rate constant. To derive the culture doubling time in the exponential growth phase, the initial two days of the logistic interpolations were subjected to further analysis:
where TD represents the doubling time and Nt1 and Nt2 represent the biomass content as derived from the logistic function in times t1 and t2, respectively.
The total lipid content was determined by a gravimetric method based on Folch et al. [31] on ice. The freeze-dried biomass (15 mg for each sample, measured on XA105DR analytical balances) was extracted with a 2:1 (v/v) chloroform-methanol mixture under ultrasound bath (SonoPlus Ultrasonic Homogenizer, Bandelin, Berlin, Germany: amplitude 100%, pulse 5 s, break 0.2 s) containing the ice-cooled water for 30 min. The biomass-chemical mixture was additionally vortexed with sea sand for 30 s (3 cycles) at room temperature (25 °C) using an amalgamator (Silamat S6, Ivoclar Vivadent AG). The mixture was further centrifuged at 2000× g for 10 min at 4 °C (MegaStar 3.0R, VWR, Wayne, PA, USA) which allowed the chemical mixture to be separated into two layers. The upper layer (methanol-water phase) was removed by a pipette and discarded. The lower chloroform layer containing lipids was stored in pre-weighed tubes. The extraction steps were repeated three times, and the chloroform layers with lipids were collected in the same tubes. Finally, the chloroform phase was evaporated in a vacuum desiccator at 45 °C under vacuum (Concentrator Plus, Eppendorf, Hamburg, Germany). The lipid residues in the tubes were weighed using XA105DR analytical balances.
The biomass and lipid productivities were determined from logistic interpolation of the dry weight measurements (according to Equation (1)), and from the lipid content data as measured after 8 days of cultivation. The effect of temperature on the biomass productivity was quantified by calculating the temperature coefficient Q10:
where P1 and P2 are biomass productivities at temperatures T1 and T2, respectively.
2.3.2. Measurement of Photosynthetic Activity
To further probe the effect of temperature on C. pyrenoidosa physiology, photosynthesis-irradiance (P-I) curves were measured by Multi-Color-PAM fluorometer (Walz, Effeltrich, Germany), using Light Curves protocol. The light curves consisted of 21 individual steps with stepwise increased white actinic light intensities between 0–4500 µmol (photons) m−2 s−1, each step took 30 s. Prior to the measurement, no culture treatment or dilution was applied, and besides the first (dark) step, no extra dark acclimation was applied. For each light curve, the temperature was controlled by Temperature Control Unit US-T (Walz) to correspond with the actual temperature as measured in each PBR in time of sample withdrawal.
To derive the parameters of photosynthesis efficiency, the light curves were interpolated by a function according to [32]:
where ETR is electron transport rate, ETRmPot is maximal potential ETR capacity without photoinhibition included, PAR is photosynthetically active irradiance, α is the initial slope of ETR increase under low PAR, and β is photoinhibition factor, with the same units as α. The parameters α, β and ETRmPot resulted directly from light curves fitting. To derive ETRmax, the maximal ETR capacity with photoinhibition included, the following equation was further applied:
2.3.3. Elemental Composition and Calorific Value
Biomass samples obtained after 8 days of cultivation were subjected to an elemental analysis. A proximate analysis was carried out—the dry matter together with ash content at 550 °C of the original samples was measured, and subsequently the samples were fully dried. The elemental analysis (CHNS, Vario Macro Cube analyser, Elementar Analysensysteme GmbH, Langenselbold, Germany) was performed on dried samples, and the Higher heating Values (HHV) of dried samples were measured (calorimeter Parr 6100, Parr Instrument Company, Moline, IL, USA). Lower Heating Values (LHV) at 20 °C were calculated according to HHV values, hydrogen and water content. Oxygen values were calculated to 100% balance (concentrations of Cl and F were neglected). To verify the results, the HHV values were also calculated from the results of the elemental analysis using the average values of 10 different empirical equations for calculation of HHV from the measured CHNS composition [33]. All results were provided for the original sample, the dry matter of the sample, and the volatile matter of the sample, and were further used for the calculations of biomass calorific values.
2.3.4. Measurement of Electric Input Power
The energy consumption of each PBR can be expressed as the sum of the electric input power P (W) of individual components. All three PBRs include a gas mixing and monitoring system. This default configuration is complemented by the pump for the MTA and H-T PBR and LED lighting and cooling for the FPA PBR.
The measurement methodology consisted of several consecutive steps. First, the electric input power of individual components was measured for the three selected PBRs. The total input power (PTOT) was then calculated as the sum of these partial values as follows:
where P is the electric input power and the indexes represent the gas mixing system (GMS), the monitoring unit (MU), LED lighting (LED), LED cooling (COOL), and the circulating pump (CP) in MTA, H-T and FPA PBRs. Subsequently, the total electric input power was measured at full operation for each PBR, and the results were compared. A confidence interval was determined for the measured values. The confidence interval includes the standard deviation of the measurement and the accuracy of the measuring device. Each PBR has a different working capacity, so the specific electric input power PS related to one liter of working volume (W L−1) was finally calculated. During the measurement, the stability of the electrical network was checked by voltage and frequency. The electric input power was measured by the wattmeter analyzer LUTRON DW-6092 with the accuracy of 1%.
PTOT_H-T = PGMS_H-T + PMU_H-T + PCP_H-T,
PTOT_MTA = PGMS_MTA + PMU_MTA + PCP_MTA,
PTOT_FPA = PGMS_FPA + PMU_FPA + PLED_FPA + PCOOL_FPA,
2.4. Statistical Analysis
To determine the effect of PBR design on the biomass and lipid content, the data were analyzed by one-way ANOVA, followed by Tukey’s HSD post-hoc test (p < 0.05). Data normality was verified using the Shapiro–Wilk test, which showed that all data followed normal distribution (p > 0.05). Since number of replicates was small, the data normality was also verified by inspecting distribution histograms. Homogeneity of variances was verified by the Cochran’s C–Hartley–Bartlett test (p > 0.05). The analysis was performed using Statistica software (TIBCO Software Inc., Palo Alto, CA, USA).
3. Results
3.1. Biomass Productivity
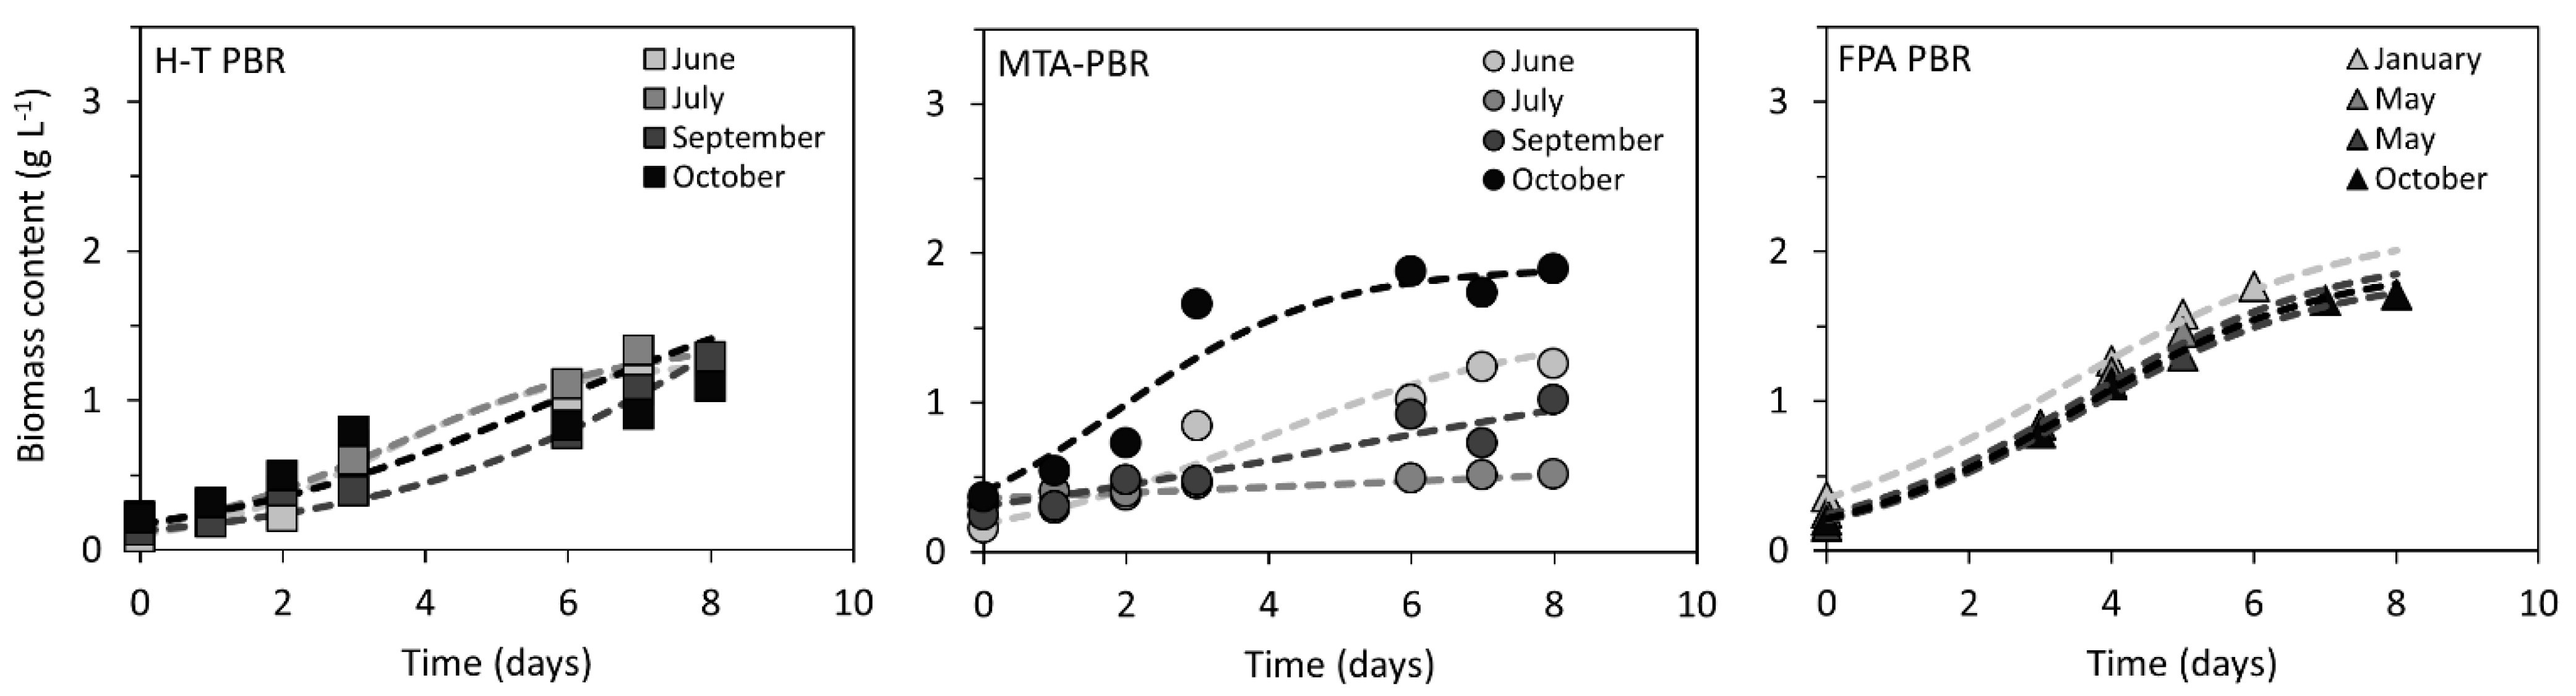
The photobioreactors were operated in two successive years of 2018 and 2019. The microalga C. pyrenoidosa was cultivated in two distinct growth media: in full BG-11 medium (under nutrient sufficiency) in 2018 and in BG-11 medium with 10-times reduced nitrogen content (under N limitation) in 2019. Growth of biomass under nutrient sufficient conditions in MTA, H-T and FPA PBRs is summarized in Figure 2. In MTA PBR, the slowest growth of C. pyrenoidosa was detected in July when the biomass content increased from 0.31 to 0.52 g L−1 after 8 days of cultivation. The fastest growth was detected in October when the biomass content increased from 0.36 to 1.90 g L−1 after 8 days (doubling time in exponential phase was TD = 1.7 days). In H-T PBR, the slowest growth was detected in September when biomass increased from 0.13 to 1.29 g L−1 after 8 days (TD = 2.2 days), while the fastest growth (TD = 1.2 days) was determined in June; however, with a very similar biomass increase as in September (biomass increased from 0.08 to 1.28 g L−1 after 8 days). The difference in growth rates between June and September was related to potentially higher maximal populations size K, as derived from data interpolation by the logistic function (K = 1.27 and 4.50 g L−1 for June and September, respectively, for details of K determination see Equation (1)). The lowest variation in growth throughout 2018 was detected in FPA PBR: TD was detected as 1.52–1.94 days in January and May, respectively. The biomass increased from 0.24 ± 0.07 to 1.84 ± 0.11 g L−1) after 8 days (Figure 2).
The biomass accumulation under N-limited conditions is summarized in Figure S1. The average biomass content after 8 days of cultivation in N-limited medium achieved 1.81 ± 0.87 g L−1 for MTA PBR, 1.27 ± 0.35 g L−1 for H-T PBR and 1.35 ± 0.08 g L−1 for FPA PBR.
The highest variance in biomass productivity under both nutrient sufficiency and N limitation was found in MTA PBR, throughout both years of 2018 and 2019. In H-T PBR, the variability was reduced compared to MTA PBR, and the lowest variability was determined in FPA PBR with the possibility of temperature control. As discussed further in Section 3.3 and Section 3.4, temperature was identified as the main factor responsible for the variability in biomass production. The average biomass productivity under nutrient sufficient conditions was 107 ± 72 mg L−1 d−1 in MTA PBR, 147 ± 6 mg L−1 d−1 in H-T PBR and 199 ± 6 mg L−1 d−1 in FPA PBR. Under N limitation, the productivities were 202 ± 109 mg L−1 d−1 in MTA PBR, 143 ± 30 mg L−1 d−1 in H-T PBR and 148 ± 6 mg L−1 d−1 in FPA PBR (Table 1). The highest determined biomass productivities achieved for respective PBR types were 178 mg L−1 d−1 in H-T PBR (July 2019), 279 mg L−1 d−1 in MTA PBR (September 2019) and 207 mg L−1 d−1 in FPA PBR (January 2018). However, the effect of N availability, the same as the effect of PBR design on the biomass productivity, was not found (Table 1, ANOVA: p > 0.05).
3.2. Lipid Productivity
Lipid accumulation under both nutrient sufficient and N-limited conditions during cultivation in three photobioreactors is summarized in Table 1. In full BG-11 medium, the average lipid content was established as 35 ± 9% (of dry weight) in MTA PBR and 26 ± 3% in H-T PBR. Under N limitation, the lipid content was 44 ± 2% in MTA PBR, 41 ± 5% in H-T PBR and 47 ± 3% in FPA PBR (Table 1). The lipid content was not significantly different between the three PBRs (ANOVA: p > 0.05). However, the lipid content in N-limited medium was significantly higher compared to full BG-11 (ANOVA: p < 0.05).
Lipid productivity under nutrient sufficiency was 34 ± 19 mg L−1 d−1 in MTA PBR and 35 ± 8 mg L−1 d−1 in H-T PBR. Under N-limitation, lipid productivity was 87 ± 44 mg L−1 d−1 in MTA PBR, 60 ± 21 mg L−1 d−1 in H-T PBR and 70 ± 2 mg L−1 d−1 in FPA PBR (Table 1). Lipid productivity was not different between photobioreactors (ANOVA: p > 0.05), but it increased significantly under N-limitation (ANOVA: p < 0.05).
The elemental composition and calorific values of C. pyrenoidosa biomass under N-limitation are described in Table 2. The N content ranged from 3.15 ± 0.05% in FPA PBR to 4.24 ± 0.85% in HT PBR. The calorific values ranged between 24.0 ± 1.85 MJ kg−1 in H-T PBR and 25.2 ± 1.4 MJ kg−1 in FPA PBR. Neither the measured elemental composition parameters nor the calorific values were significantly different between the three photobioreactors (ANOVA: p > 0.05).
3.3. Temperature
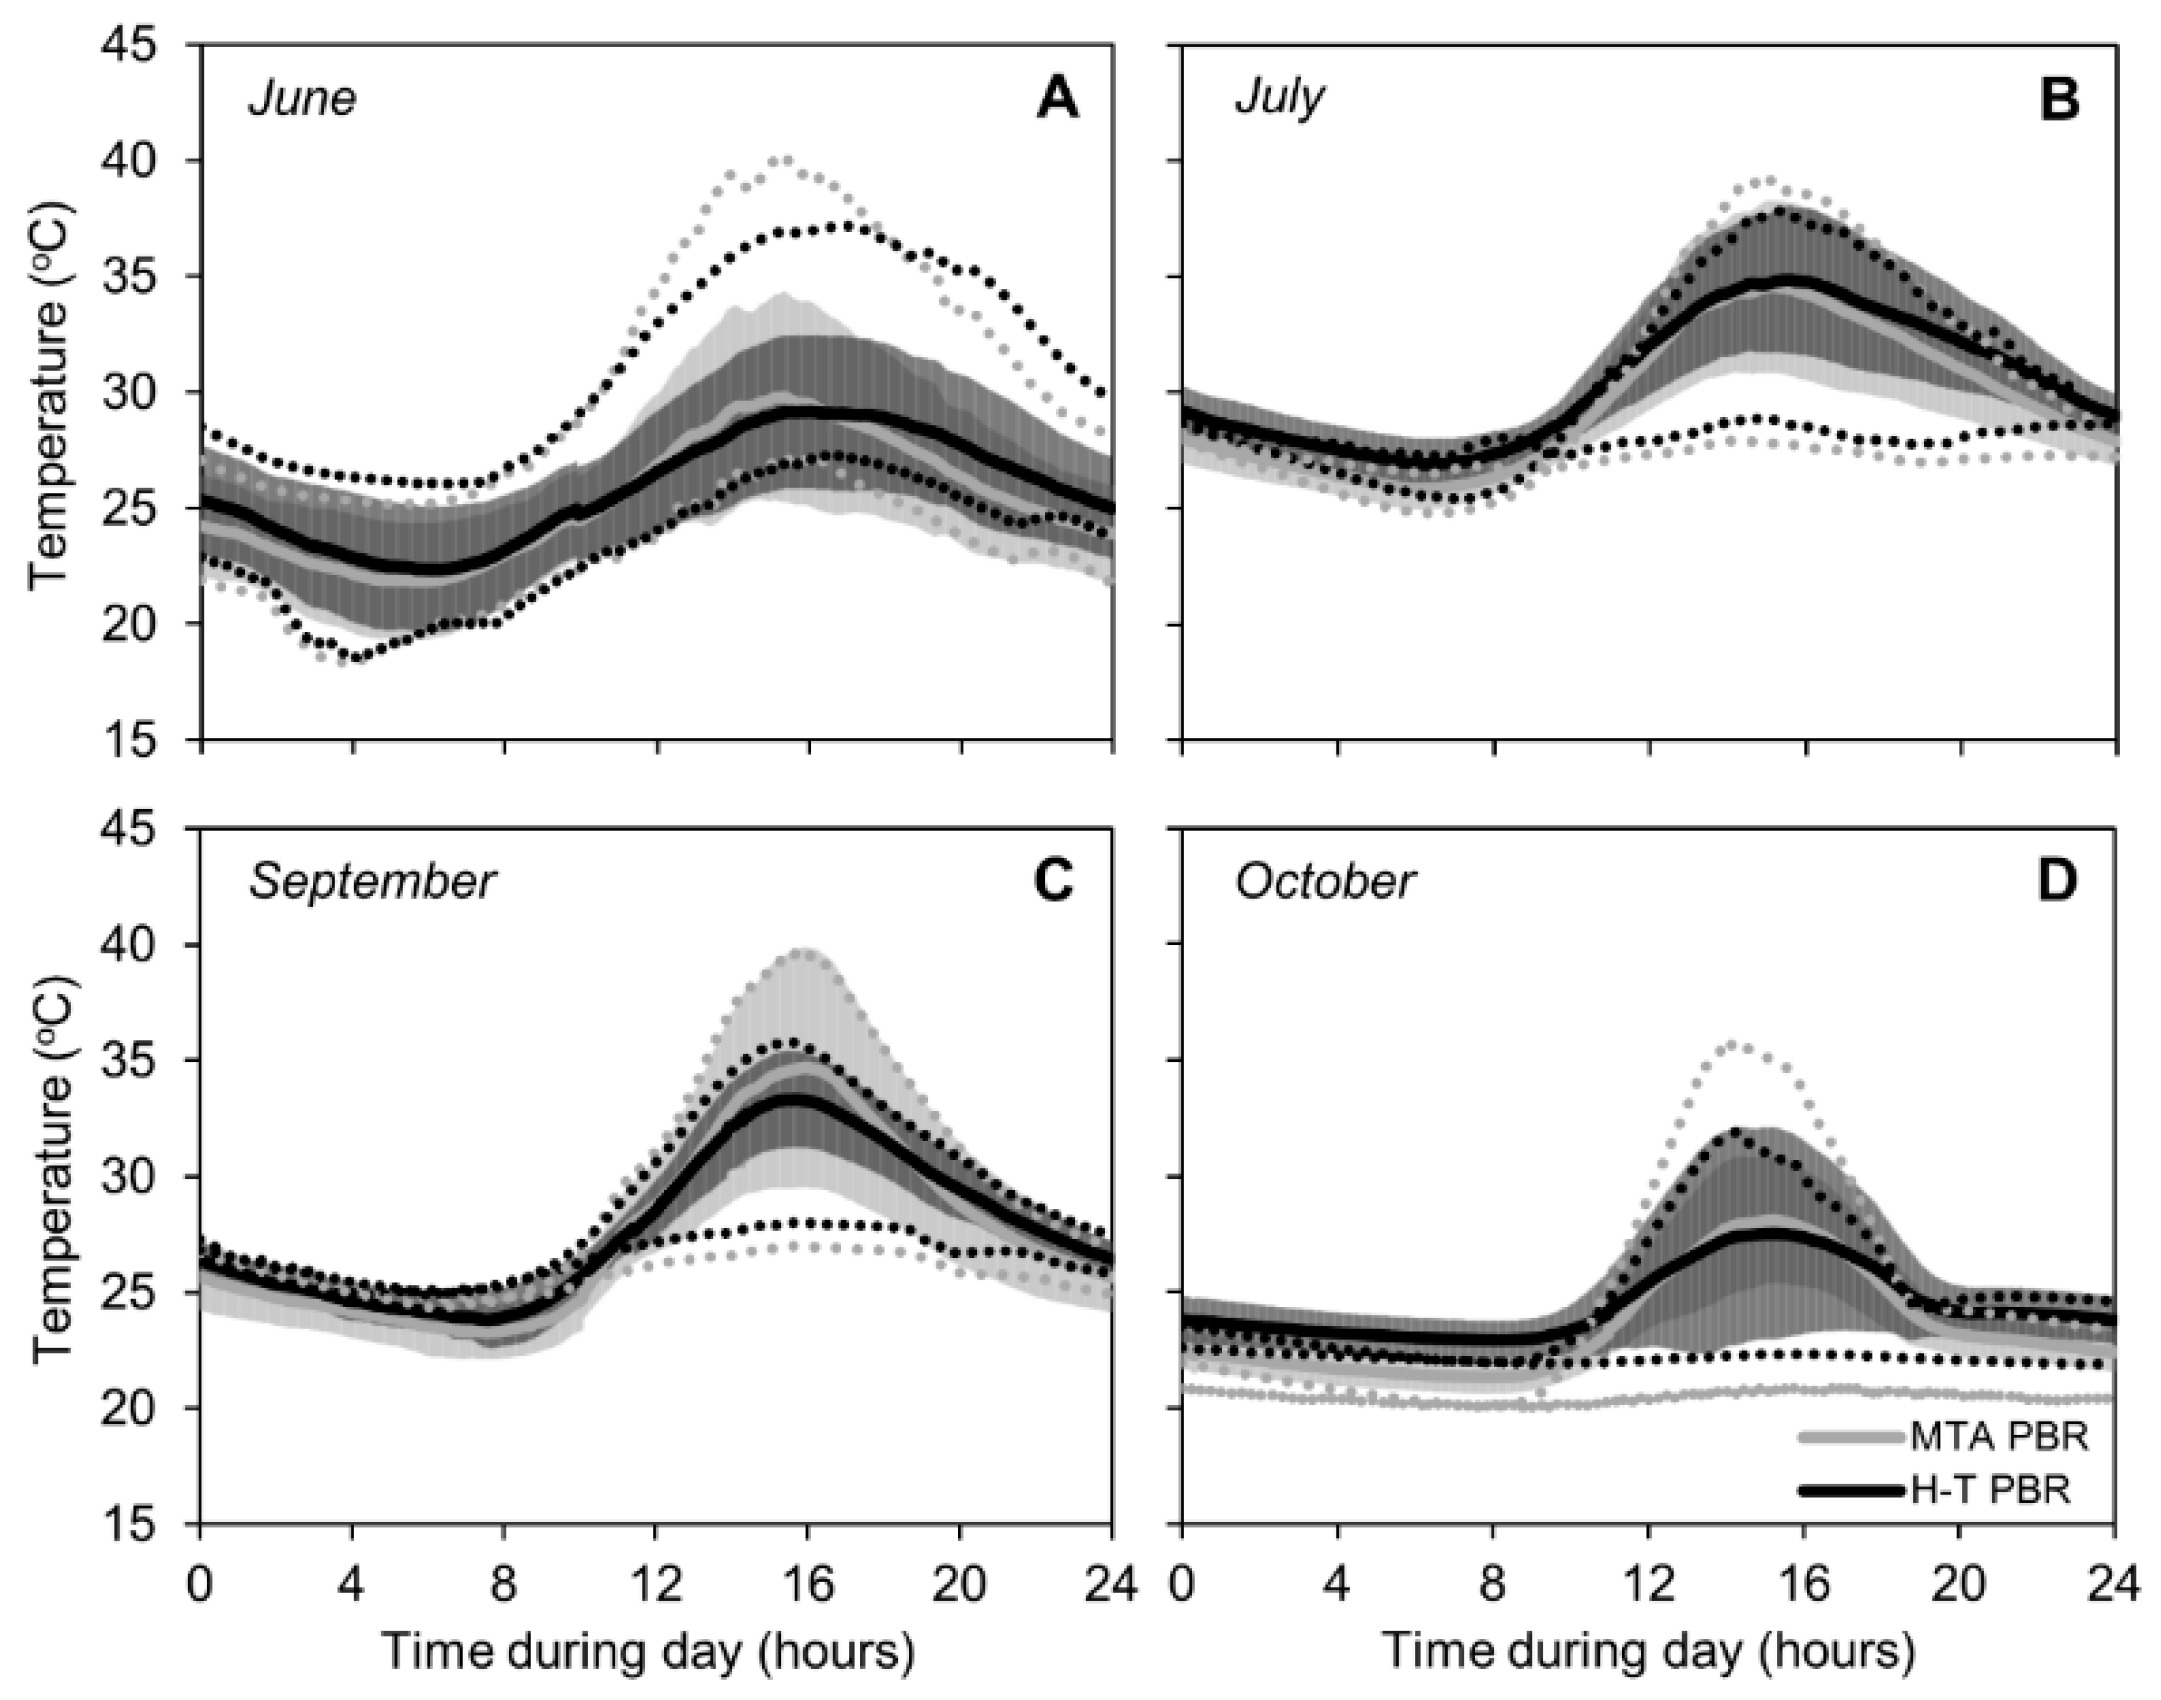
The daily temperature of C. pyrenoidosa cultures in MTA and H-T PBRs varied between 18 °C and 40 °C (during the monitored period). In FPA PBR, the temperature was regulated and kept constant at 25 °C. Daily temperature profiles during June, July, September, and October 2018 in MTA and H-T PBRs are shown in Figure 3. The daily temperature courses showed similar trends between months: the lowest temperatures were recorded at night until 8 a.m., and maximal temperatures were detected in the afternoon between 2–4 p.m. During the whole monitoring period of June–October 2018, higher temperatures were measured in MTA PBR compared to H-T PBR: while the maximum culture temperature of 40 °C was recorded in several individual days during June, July and September 2018 in MTA PBR, maximal temperature in the H-T PBR did not exceed 38 °C. Minimal culture temperatures of 18 °C were measured in June in both MTA and H-T PBRs. Overall, as indicated in Figure 3, a temperature difference between day and night was higher in MTA PBR compared to H-T PBR.
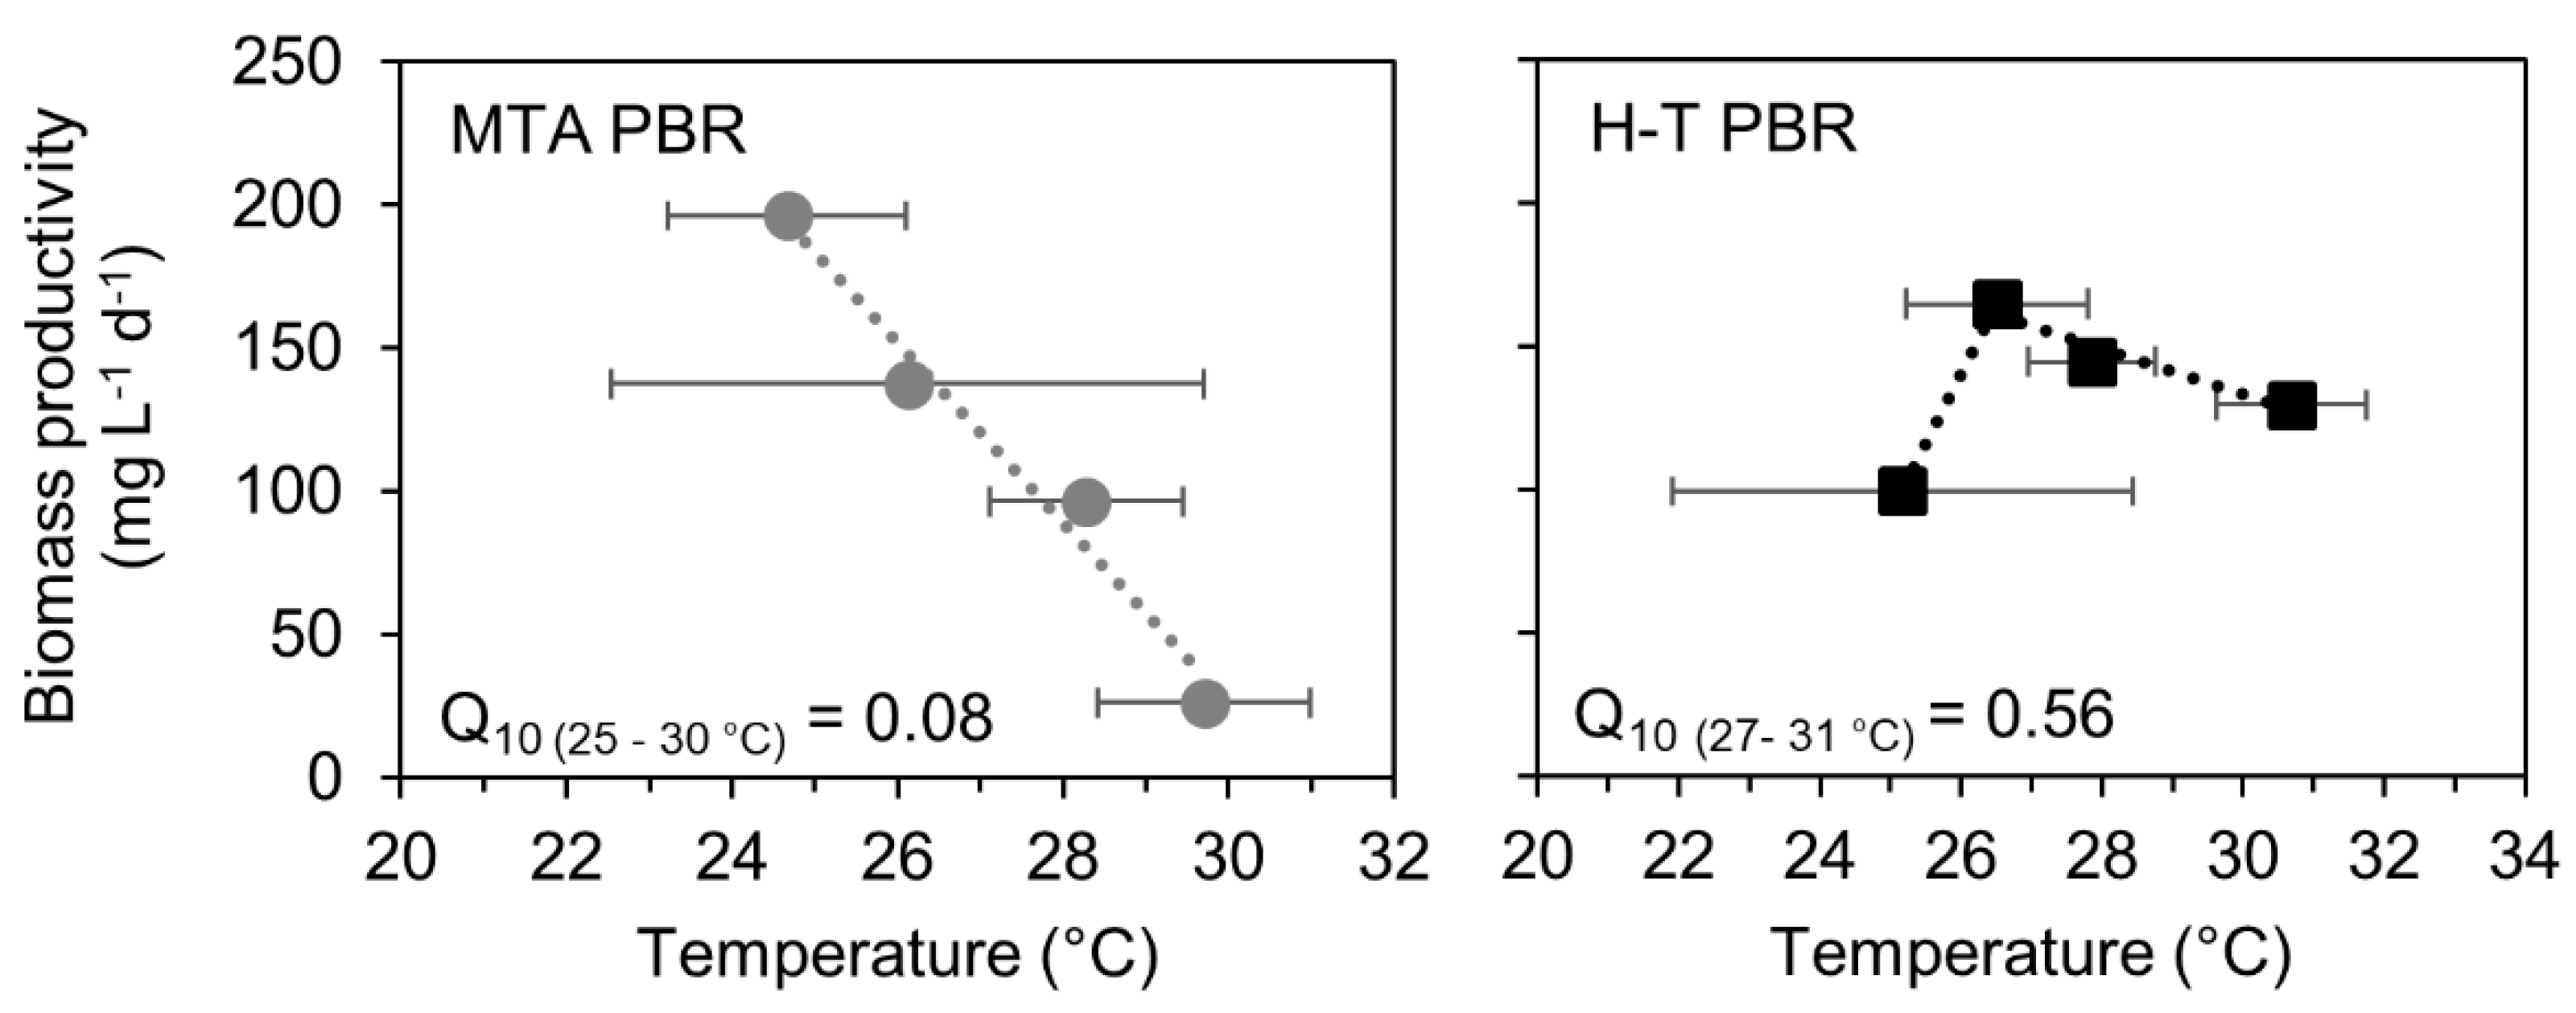
The productivity of C. pyrenoidosa cultures showed a higher temperature sensitivity in MTA PBR compared to H-T PBR. Temperature coefficient Q10 (see Equation (3)) was identified as 0.08 in MTA-PBR between 25–30 °C, whereas in H-T PBR it was identified as 0.56 between 27–30 °C (Figure 4). This suggests, in addition to the increased sensitivity of MTA PBR to high temperatures, a shift in temperature optima between the photobioreactors. In MTA PBR, the biomass productivity was decreasing between 25–30 °C, which suggests a temperature optimum equal or lower to 25 °C. On the other hand, the productivity in the H-T PBR increased between 25–27 °C and decreased between 27–31 °C (Figure 3), which suggests optimal temperature for culture productivity of 27 °C.
3.4. Photosynthetic Activity
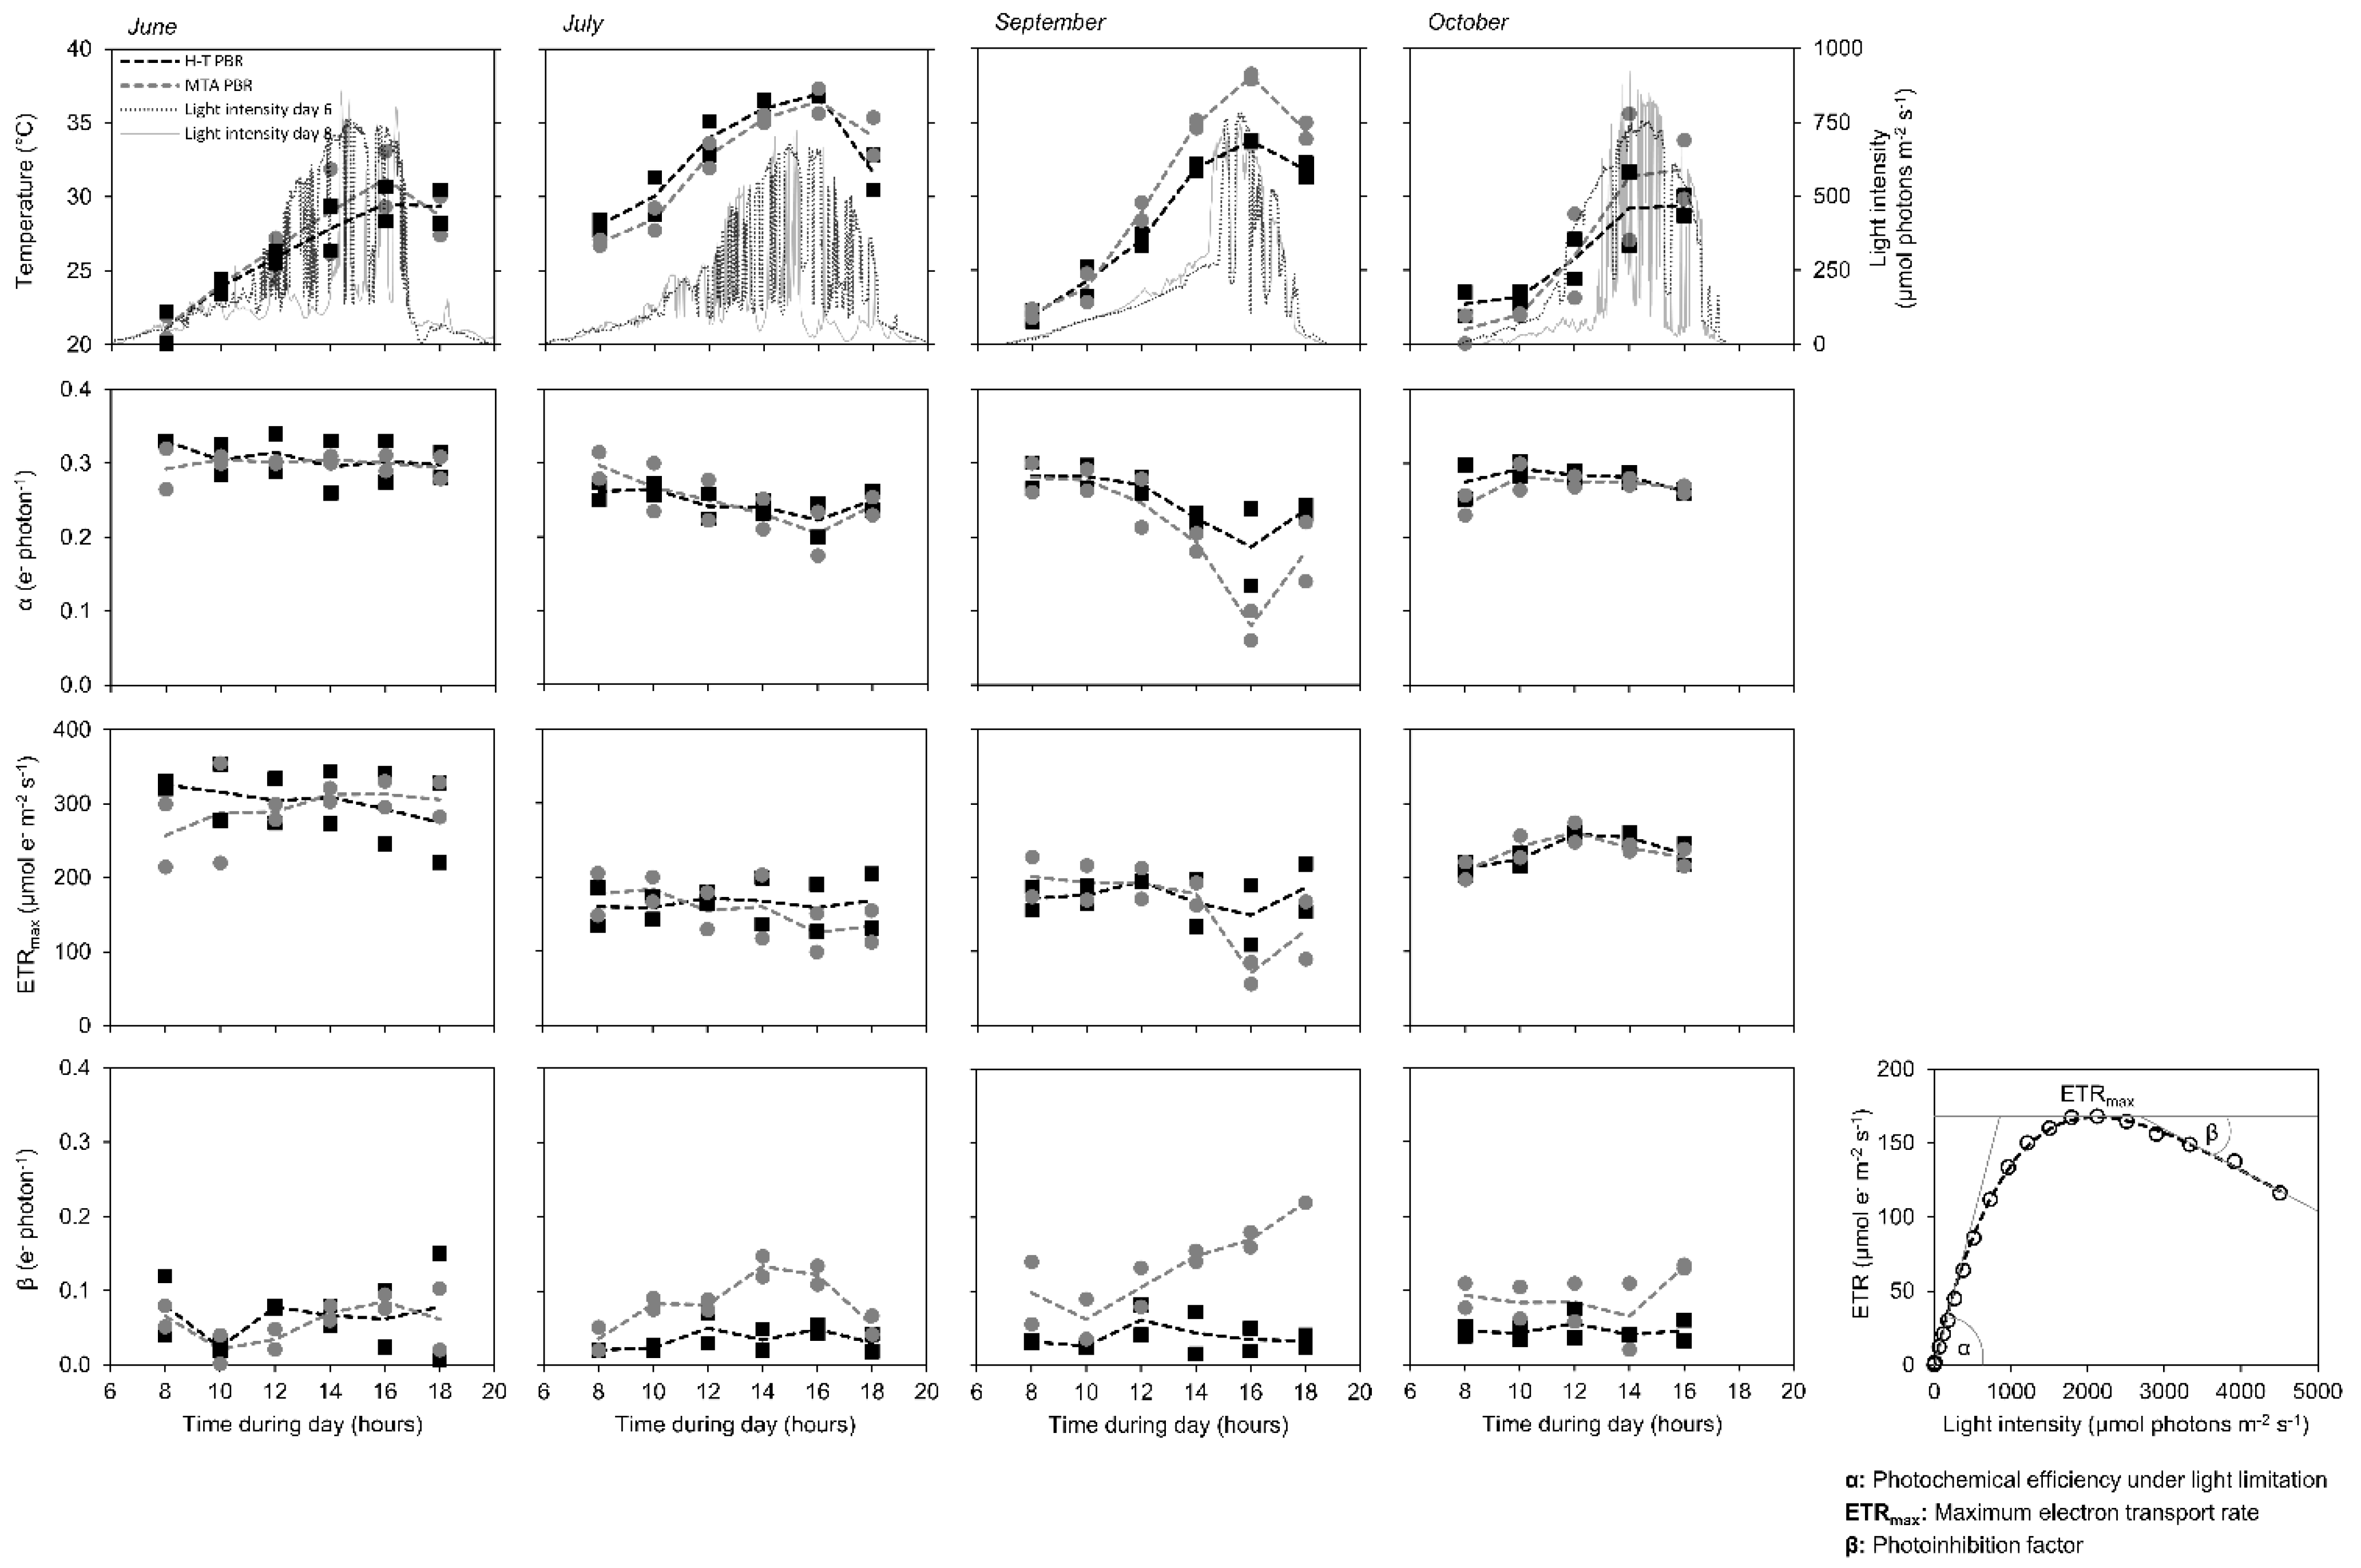
The photosynthetic activity was monitored in June, July, September and October 2018 during 6th and 8th day of each cultivation, each day between 6 a.m. and 6 p.m., with a temporal resolution of two hours. The highest photosynthesis efficiency and capacity in C. pyrenoidosa cultures were determined in June and October when the daily temperature maxima did not exceed 36 °C (Figure 5). In July and September, when the temperature rose to 38 °C, both photosynthetic efficiency and photosynthetic capacity decreased. The maximal photosynthesis drops in the daytime were measured in both July and September at 4 p.m., and the drop was higher in MTA PBR compared to H-T PBR. The reduction of photosynthesis efficiency was accompanied by a slight increase of photoinhibition factor β (see Equation (4) for details). However, we noted that during the photosynthesis efficiency measurement, the cultures were light-limited rather than photo-inhibited, as reflected by the courses of light curves showing that both ETRmax (see Equation (5) for details) and β were detected at actinic light intensities of 2000 µmol photons m−2 s−1 or higher (Supplementary Figure S1), whereas light available for both photobioreactors did not exceed 1000 µmol photons m−2 s−1 in any of the measured days (Figure 5).
Rather minor differences in photosynthetic performance between both H-T and MTA PBRs correlate with the results of biomass and lipid productivity, as summarized in Table 1. Higher sensitivity of the MTA PBR to increased temperature is consistent with reduced productivity under the increasing temperature in this photobioreactor, as reflected by coefficient Q10 (Figure 4, see Section 3.3 for details).
3.5. Electric Input Power of the Tested PBRs
All three PBRs included two basic components: gas mixing system and monitoring unit which allowed for real-time measurement of temperature, pH, optical density and fluorescence signals. The electric input power of these components was PGMS_FPA = 17.2 W for gas mixing system and PMU = 25.3 W for monitoring system.
The FPA PBR was supplemented with LED lighting with an average electric input power of PLED_FPA = 105.6 W and three fans for cooling LED lights with an electric input power of PCOOL_FPA = 21.5 W. H-T PBR was equipped with a circulating pump with PCP_H-T = 516.5 W. A smaller pump with PCP_MTA = 7.3 W was installed in MTA PBR as an external part of the monitoring system.
Knowing the partial power input of all components, the total power input (PTOT) of the three PBRs was estimated (according to Equations (6)–(8)) as: PTOT_H-T = 561 ± 9 W for H-T PBR, PTOT_MTA = 48 ± 2 W for MTA PBR and PTOT_FPA = 169 ± 3 W for FPA PBR. The corresponding daily electricity consumption was 13.5 kWh for H-T PBR, 1.1 kWh for MTA PBR and 4.1 kWh for FPA PBR.
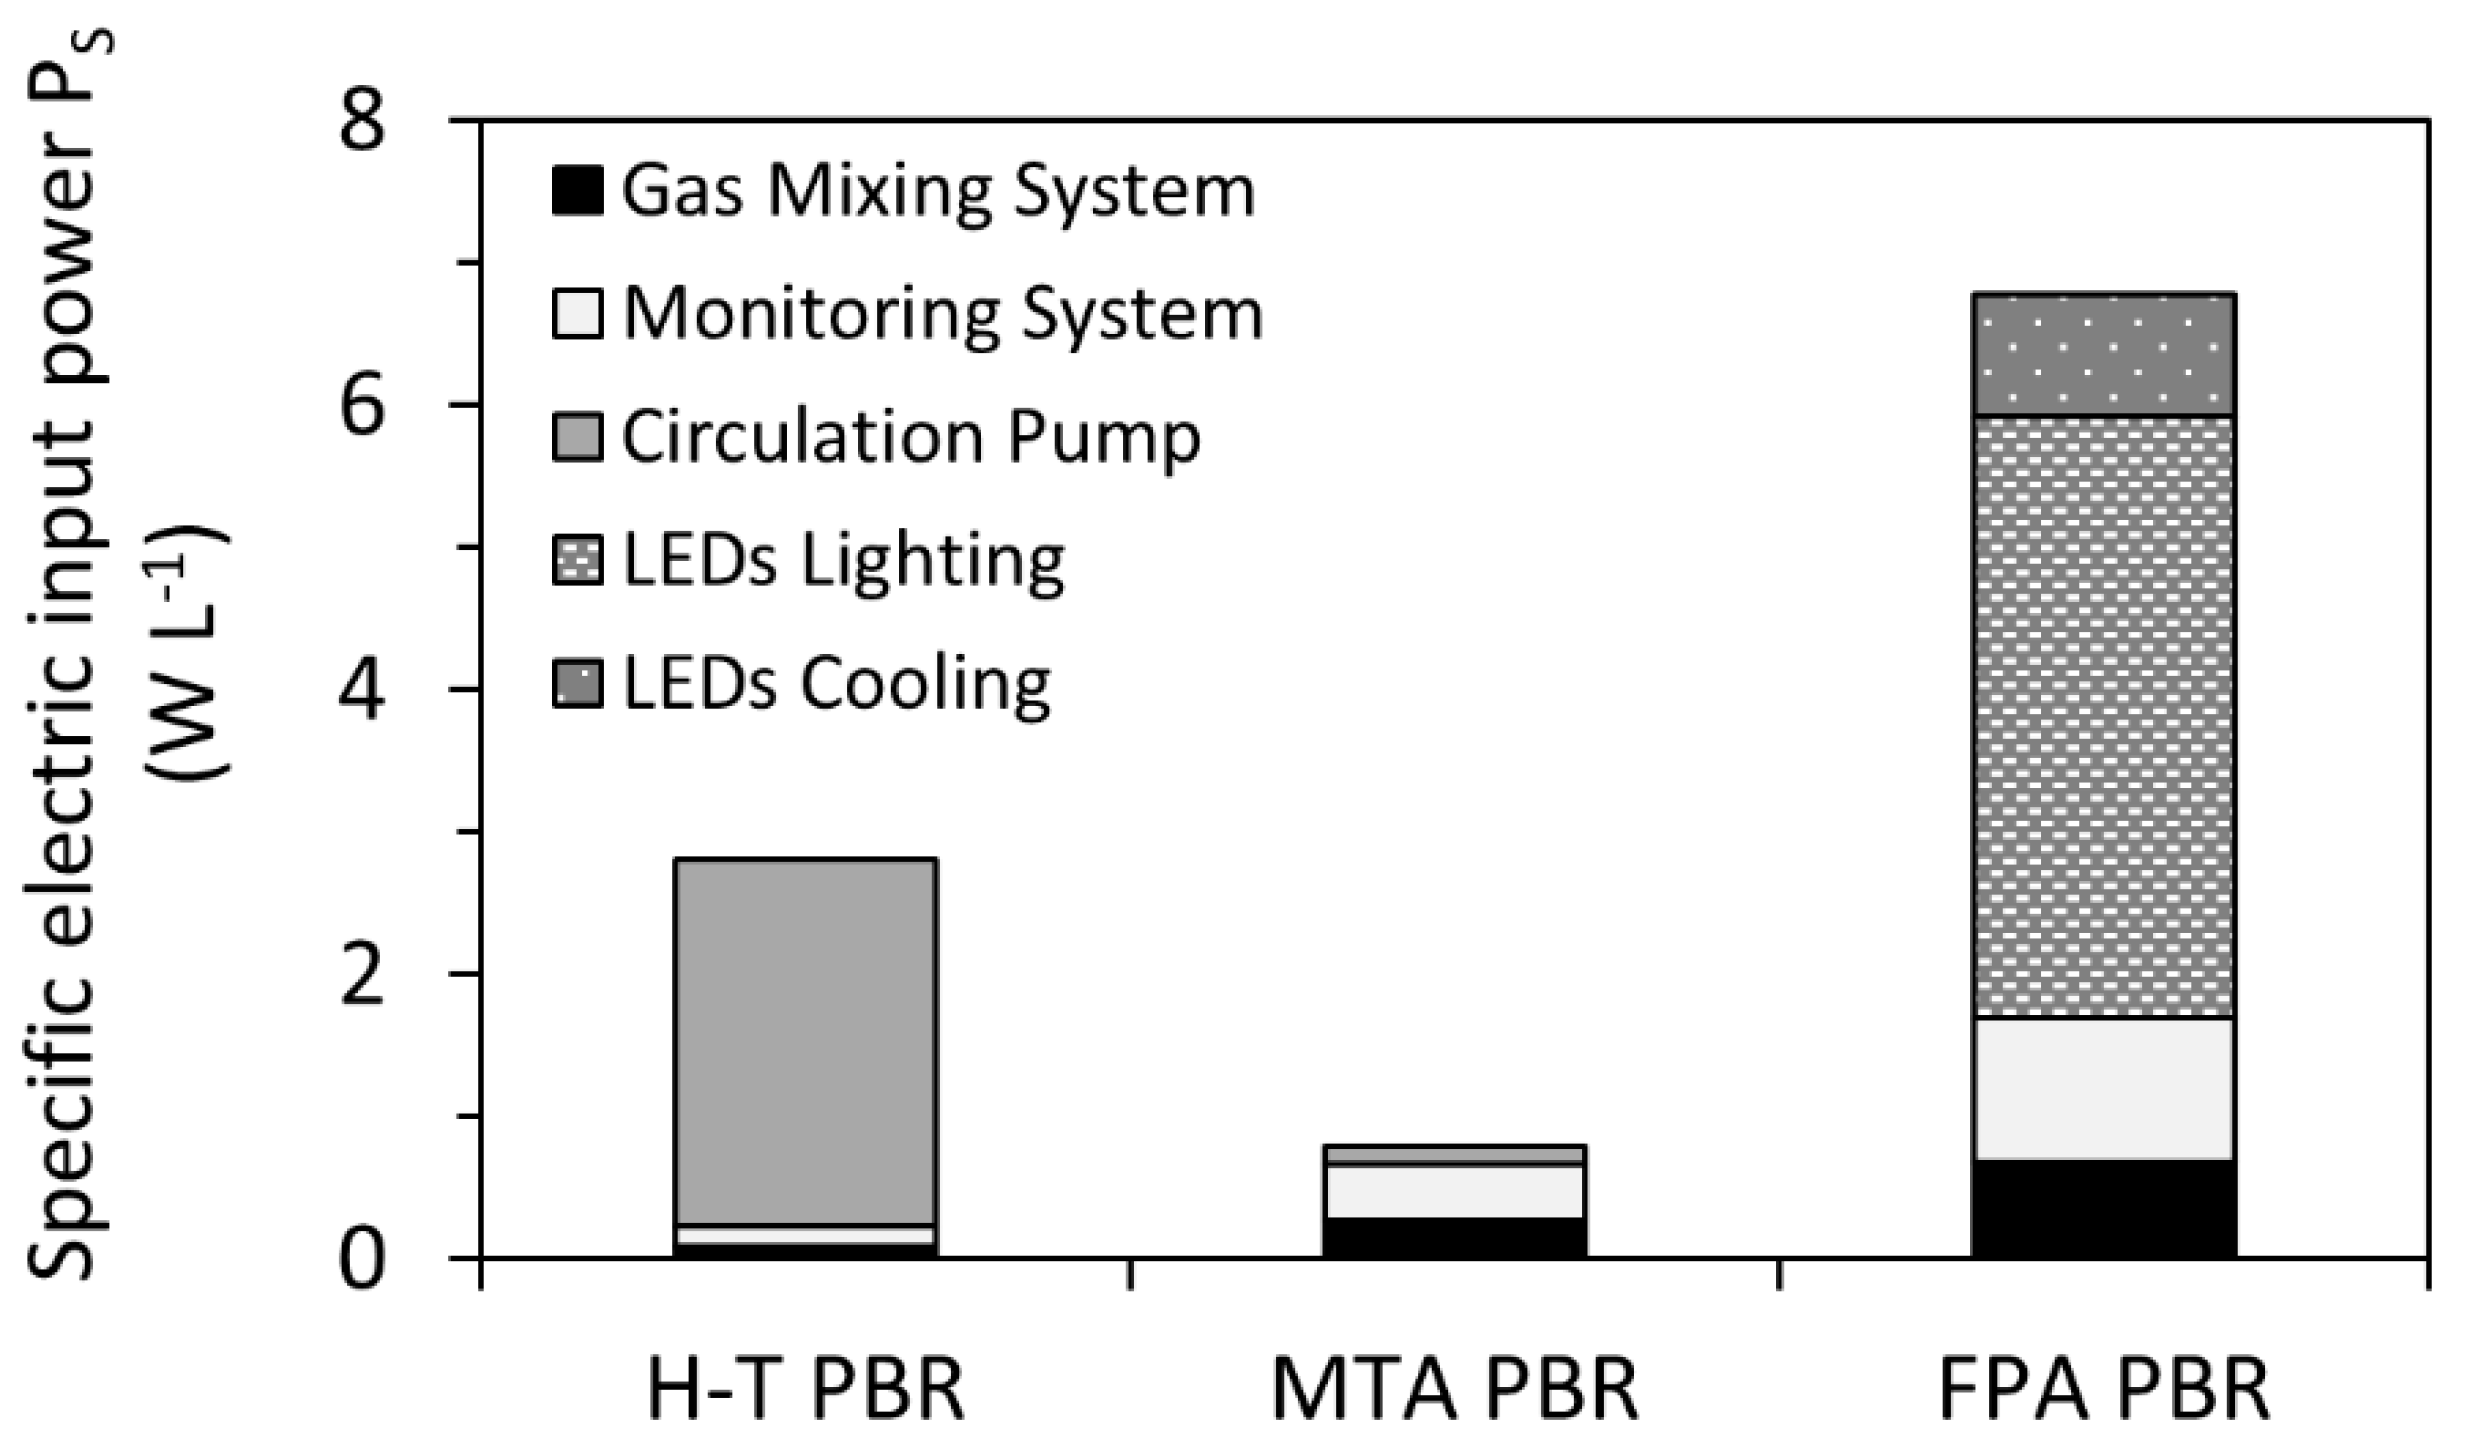
However, since the working volumes of H-T, MTA, and FPA PBRs were not identical, for direct electric input power comparison it was necessary, to further normalize the specific values per L culture. As summarized in Figure 6, the highest specific electric input power PS was identified in FPA PBR (working volume 25 L) as PS_FPA = 6.8 ± 0.1 W L−1. Such a high value is related specially to LED lighting and cooling which accounts for about 75% of the total FPA input power (Figure 6). In H-T PBR (working volume 200 L), PS_H-T was identified as 2.8 ± 0.1 W L−1, and to the power consumption was mainly related to the operation of a circulation pump which accounted for more than 92% of the total H-T PBR’s specific electric input power. The lowest consumption was determined in the MTA PBR (of working volume 60 L) with PS_MTA = 0.79 ± 0.03 W L−1. In addition to the basic components (gas mixing and monitoring systems), the MTA PBR was only equipped with a small external pump which secured a culture flow through the monitoring system.
4. Discussion
4.1. Biomass and Lipid Productivity
In this study, three photobioreactors with different geometries were compared in the context of biomass and lipid production and power consumption required for operation. Moreover, the photosynthetic activity of microalgal cells during the cultivation process was studied in order to compare sensitivity to environmental stress in various PBRs. The average biomass production of 0.20 g L−1 d−1 in MTA PBR (Table 1) was similar to the Chlorella production as reported by both de Morais and Costa [34] in vertical tubular PBR and Huang et al. [35] in multi-column airlift PBR, and it was higher compared to biomass yield of 0.032 g L−1 d−1 in a pilot-scale sequential-baffled column PBR as reported by Lam et al. [36]. On the other hand, the biomass production in MTA PBR was lower than the values reported for other tubular PBRs, such as outdoor inclined tubular PBR operated under solar irradiation (biomass production 0.3–1.47 g L−1 d−1, [37]), small volume (0.6 L) bubbled tubular PBR operated under artificial illumination (Chlorella sp. production of 0.5–1.2 g L−1 d−1, [38]), or the horizontal tubular system in a sub-tropical Australia climate with Chlorella sp. production of 0.43 g L−1 d−1 [27]. Indeed, a comparison with other works reveals that distinct biomass production can be achieved in various PBRs systems and that specific improvements of the PBR design (such as inclination of PBR tubes or insertion of static mixers inside the tubes, [37]) can lead to a significant production increase. However, the goal of this work was not maximizing the production, but rather providing solid data on direct evaluation of energetic efficiency of various PBR types. In addition, it should be noted that, as suggested by Wolf et al. [27], a comparison of different PBRs systems is often limited due to the use of different strains and exposure to distinct climate and operational conditions.
Data on Chlorella production in H-T PBRs are rather scarce. The average production in H-T PBR in this study (0.15 g L−1 d−1) was three times higher than the production described by Scragg et al. [39] for C. vulgaris and C. emersonii, where a lower flow rate of microalgal suspension and lower illumination were used. Similarly, our results are higher than productions reported for microalga Tetraselmis sp. in Biocoil (helical tubular) PBR [23], where, in addition to differences in PBRs design, also higher temperature fluctuations were reported.
The average biomass production of 0.20 g L−1 d−1 achieved in FPA PBR was nearly identical to the production reported for C. sorokiniana [27] and higher than the production reported for C. zofingiensis [40]. On the other hand, it was lower than the Chlorella production in flat panel PBRs improved by baffles insertion, where the productions varied between 0.6–1.1 g L−1 d−1 [41,42]. An important parameter related to the culture productivity is the culture depth that determines the length of the light path. The culture depth of our FPA PBR was 7 cm, whereas the light path of PBRs in Zhang et al. [42] and Degen et al. [41] was 2.5 cm and 3 cm, respectively. The exceptional Chlorella production of 2.64 g L−1 d−1 was described for flat panel PBRs with baffles and the light path of 1.5 cm [41]. These results suggest that the construction of FPA as used here was far from optimal. However, same as in case of MTA PBR and H-T PBR, the focus of this study was a comparison of energetic requirements rather than yield maximization. From this perspective, rather low energetic efficiency of biomass production is not surprising (95–810 kWh kg−1, only energy for cultivation considered, energy required for biomass harvesting and drying not included to calculations). A direct comparison with previous studies shows that the productivity increase or input power reduction can lead to significant energetic efficiency increase, up to 12 kWh kg−1 in tubular PBR or 2.4 kWh kg−1 in raceway pond [21]. It should be noted here that total energy requirements higher than 8 kWh kg−1 of dry algal biomass were reported as not sustainable [43].
Also, the initial biomass concentration is related tightly to the biomass productivity. During our experiments we used nearly ten times lower initial biomass concentration than recommended by Holdmann et al. [24] which can be considered as another factor related to rather low biomass and lipid yields.
Lipid yields in C. pyrenoidosa under nitrogen limitation (60–87 mg L−1 d−1) were in the range of the previously reported yields in other Chlorella strains in laboratory conditions (41–106 mg L−1 d−1; [30,44,45,46,47]). In line with this, the maximal lipid production in MTA PBR (118 mg L−1 d−1) was only 11% lower than the maximum values reported up to date [48]. Also, lipid yields of different microalgae strains cultivated in (pilot scale) flat panel PBRs (36–91 mg L−1 d−1) correspond well with our results [49,50,51], same as the lipid content (41–47%) and calorific values (24–25 MJ kg−1, [30,39,52]). Considering the suboptimal cultivation conditions in our setup, the comparative lipid yields suggest possible lipid production limitation in the previous studies.
4.2. PBR Design and Susceptibility to Temperature Fluctuations
As shown in Figure 3, biomass productivity was strongly related to temperature. The results of photosynthetic activity measurement (Figure 4) further suggest that: 1) temperature was the main stress factor for C. pyrenoidosa, and 2) the PBR geometry allowed for a shift in C. pyrenoidosa temperature optimum from 27 °C in H-T PBR to ≤25 °C in MTA PBR. The increased temperature sensitivity of C. pyrenoidosa cultures in MTA PBR is likely related to the surface-to-volume ratio (see next paragraph for details) and the amount of irradiance received by both PBRs. The MTA PBR was exposed to direct solar irradiance over its whole illuminated area, which included also light (of weaker intensity) reflected by the back side plate. In contrast, in H-T PBR, from the nature of helical tubes stacked on the top of each other (see Figure 1 and Section 2.2 for details), the illuminated part consisted of the directly illuminated zone that received full sunlight irradiance and the indirectly illuminated zone with reduced light availability. We note that size of the dark zones in both MTA and H-T PBRs represented 10–15% of the working volumes and the effect of dark zone size on productivities can be there for considered similar for both PBRs.
The relation between temperature, heat load and PBR geometry was studied previously [27], and special importance in terms of microalgae productivity was assigned to the surface-to-volume ratio (SA/V ratio). Optimal SA/V ratio for maximization of microalgal production was determined as 43–73 m2 m−3 [27]. Higher SA/V ratio led to increased heat load and resulted in susceptibility to temperature fluctuations, algal stress and reduced growth rates. MTA PBR in this study had the SA/V ratio of 78 m2 m−3 and H-T PBR had the SA/V ratio of 125 m2 m−3. However, as shown in Figure 4, culture in H-T PBR had lower temperature sensitivity compared to MTA PBR. This result can be assigned to the specific geometry of H-T PBR which allowed for reduced heat transfer in partially shaded coils, and it suggests that the optimal value of SA/V ratio can be specific for different PBRs designs.
Several ways that can prevent PBR from overheating have been described. Water spraying is considered as an efficient method of PBR cooling; however, water pumping is connected with additional costs [18]. More recent approach preventing cultures from overheating is represented by utilization of spectrally selective glass or plastic material that filter the infrared part of (sun) light spectra [2,27]. Operation of PBRs in 2018 and 2019 was affected by extremely warm and sunny weather (see temperature profiles in Figure 3). As a consequence, the culture temperature in many days exceeded 35 °C. According to Wolf et al. [27], such a temperature acts as a stress factor for Chlorella and leads to a significant growth reduction. This is consistent with temperature optimum of 25 °C and growth reduction observed already at 29 °C, as identified by Sukačová et al. [29]. The lowest biomass productivity in the MTA PBR in summers 2018 and 2019 (Figure 2 and Figure S1) as well as both the reduced photosynthesis efficiency and the increased sensitivity to photoinhibition under temperatures close to 40 °C (Figure 5) are in full agreement with the previous results, and document stress in C. pyrenoidosa cultures during our cultivations.
4.3. Energetic Requirements for Chlorella Production
The energetic requirements for microalgal biomass production have been described in a number of works [17,25,53]. Acién Fernández et al. [21] reported an average power consumption of 500 W m−3 for tubular large scale PBRs, which is lower than the consumption identified for H-T PBR (2800 W m−3) and MTA PBR (790 W m−3) here. According to our evaluation, the MTA PBR had at least 8.5 times lower energy consumption per L culture than FPA PBR that was operated under fully controlled cultivation conditions, including illumination by LED and active cooling (however, the cooling power input was not considered in the energy consumption, see the next paragraph for details). The average biomass productivity in FPA PBR was not different from MTA PBR, and the maximum production was even 25% higher in MTA PBR compared to FPA PBR. Similarly, the operation of FPA PBR consumed at least 2.5 times more energy than H-T PBR but the average biomass production was again not different between these two PBRs. Here, the maximum measured production was 15% higher in FPA PBR compared to H-T PBR.
From the perspective of energy efficiency of biomass production, maintaining constant conditions (including artificial light and cooling/heating) seems disadvantageous. Lam et al. [36] reported 69% reduced energy cost for outdoor cultivation in pilot-scale sequential-baffled column PBR using solar irradiance when compared to the identical system with artificial light. Itoiz et al. [22] also highlighted 85% reduction in energy requirements for the outdoor system compared to the indoor production. Also PBR cooling/heating requires substantial amount of energy. In our work, the FPA PBR was actively cooled during the summers 2018 and 2019 by a chilled water (see Section 2.2 for details) to maintain constant temperature of 25 °C. Since the chilled water distribution pipes were common for the whole greenhouse facility in which the PBRs were placed, it was not possible to separate cooling requirements of the FPA PBR from other systems. However, as shown on the example of FPA plant operated in southern Europe (Toscana, Italy), active cooling can cost up to 12% of the annual energy consumption in warm climate [54]. From this perspective, the effort towards reduction of the cooling energy costs [55] is only logical.
The concept of this work was based on placement of PBRs in the greenhouse that allowed for usage of solar irradiance for microalgal cultivation and simultaneously protected the cultivation system during periods of colder and rainy weather that may occur from spring to autumn in the temperate climate zone of Central Europe. On the other hand, the cultivation process in PBRs was affected by extremely warm and sunny weather in the summers of 2018 and 2019. This extraordinary hot weather is expected to become a standard in next decades and rising average temperatures that are well documented worldwide [56,57] may lead to considering relocation of microalgae cultivations outside of greenhouses in the forthcoming period.
5. Conclusions
We did not determine significant differences in biomass and lipid production among the studied PBRs. MTA PBR showed the lowest energy consumption but was more temperature sensitive than H-T PBR, even though the maximum achieved biomass production was found in MTA PBR during colder period of October 2018. Our results suggest MTA PBR as the most appropriate design for further development, especially in the context of energy efficiency. The possibilities of biomass and lipid production increase are related to the prevention of overheating (for instance by usage of infrared irradiance filtering) and the optimization of initial biomass concentration and culture depth/thickness. Our results show the need of reconsidering the concept of algae cultivation inside greenhouses in the central European region. For the development of feasible yearlong microalgal cultivation in Central Europe, it will be necessary to develop hybrid systems for microalgal cultivation, combining the advantages of the open system in summer and the closed one in winter.
Supplementary Materials
The following are available online at https://www.mdpi.com/1996-1073/14/5/1338/s1, Figure S1: Growth of C. pyrenoidosa in H-T PBR, MTA PBR and FPA PBR under N-limitation (as determined throughout summer–autumn 2019), Figure S2: Photosynthesis-irradiance (P-I) curves measured during 6th day and 8th day of C. pyrenoidosa cultivation in June, July, September and October 2018.
Author Contributions
Conceptualization, K.S., V.M., T.Z.; methodology, K.S., P.L., V.B., V.M., D.V., T.Z.; formal analysis, K.S., V.B., T.Z.; investigation, K.S., P.L., V.B., V.M., D.V., T.Z.; data curation, V.M., T.Z.; writing—original draft preparation, K.S., P.L., V.B., V.M., T.Z.; writing—review and editing, K.S., P.L., V.B., V.M., T.Z.; visualization, V.M., T.Z.; supervision, T.Z.; project administration K.S., D.V. All authors have read and agreed to the published version of the manuscript.
Funding
This research was funded by the Ministry of Education, Youth and Sports of the Czech Republic under the OP RDE grant number CZ.02.1.01/0.0/0.0/16_026/0008413 ‘Strategic Partnership for Environmental Technologies and Energy Production’ and by Czech Science Foundation (GA ČR, grant number 18–24397S).
Institutional Review Board Statement
Not applicable.
Informed Consent Statement
Not applicable.
Data Availability Statement
Not applicable.
Conflicts of Interest
The authors declare no conflict of interest.
References
- Brennan, L.; Owende, P. Biofuels from microalgae—A review of technologies for production, processing, and extractions of biofuels and co-products. Renew. Sustain. Energy Rev. 2010, 14, 557–577. [Google Scholar] [CrossRef]
- Nwoba, E.G.; Parlevliet, D.A.; Laird, D.W.; Alameh, K.; Moheimani, N.R. Light management technologies for increasing algal photobioreactor efficiency. Algal Res. 2019, 39, 101433. [Google Scholar] [CrossRef]
- Manirafasha, E.; Ndikubwimana, T.; Zeng, X.; Lu, Y.; Jing, K. Phycobiliprotein: Potential microalgae derived pharmaceutical and biological reagent. Biochem. Eng. J. 2016, 109, 282–296. [Google Scholar] [CrossRef]
- Batista, A.P.; Niccolai, A.; Fradinho, P.; Fragoso, S.; Bursic, I.; Rodolfi, L.; Biondi, N.; Tredici, M.R.; Sousa, I.; Raymundo, A. Microalgae biomass as an alternative ingredient in cookies: Sensory, physical and chemical properties, antioxidant activity and in vitro digestibility. Algal Res. 2017, 26, 161–171. [Google Scholar] [CrossRef]
- Adarme-Vega, T.C.; Thomas-Hall, S.R.; Schenk, P.M. Towards sustainable sources for omega-3 fatty acids production. Curr. Opin. Biotechnol. 2014, 26, 14–18. [Google Scholar] [CrossRef]
- Sathasivam, R.; Radhakrishnan, R.; Hashem, A.; Abd_Allah, E.F. Microalgae metabolites: A rich source for food and medicine. Saudi J. Biol. Sci. 2019, 26, 709–722. [Google Scholar] [CrossRef] [PubMed]
- Gouveia, L.; Oliveira, A.C. Microalgae as a raw material for biofuels production. J. Ind. Microbiol. Biotechnol. 2009, 36, 269–274. [Google Scholar] [CrossRef]
- Richmond, A.; Hu, E.Q. Handbook of Microalgal Culture: Applied Phycology and Biotechnology; John Wiley & Sons, Ltd.: Oxford, UK, 2013. [Google Scholar]
- Yadav, G.; Dash, S.K.; Sen, R. A biorefinery for valorization of industrial waste-water and flue gas by microalgae for waste mitigation, carbon-dioxide sequestration and algal biomass production. Sci. Total Environ. 2019, 688, 129–135. [Google Scholar] [CrossRef]
- Garcia, R.; Figueiredo, F.; Brandão, M.; Hegg, M.; Castanheira, É.; Malça, J.; Nilsson, A.; Freire, F. A meta-analysis of the life cycle greenhouse gas balances of microalgae biodiesel. Int. J. Life Cycle Assess. 2020, 25, 1737–1748. [Google Scholar] [CrossRef]
- Kokkinos, N.; Lazaridou, A.; Stamatis, N.; Orfanidis, S.; Mitropoulos, A.C.; Christoforidis, A.; Nikolaou, N. Biodiesel production from selected microalgae strains and determination of its properties and combustion specific characteristics. J. Eng. Sci. Technol. Rev. 2015, 8, 1–6. [Google Scholar] [CrossRef]
- Teng, S.Y.; Yew, G.Y.; Sukačová, K.; Show, P.L.; Máša, V.; Chang, J. Microalgae with artificial intelligence: A digitalized perspective on genetics, systems and products. Biotechnol. Adv. 2020, 44, 1–17. [Google Scholar] [CrossRef]
- Sukačová, K.; Kočí, R.; Žídková, M.; Vítěz, T.; Trtílek, M. Novel insight into the process of nutrients removal using an algal biofilm: The evaluation of mechanism and efficiency. Int. J. Phytoremed. 2017, 19, 909–914. [Google Scholar] [CrossRef] [PubMed]
- Chen, J.Z.; Wang, S.; Zhou, B.; Dai, L.; Liu, D.; Du, W. A robust process for lipase-mediated biodiesel production from microalgae lipid. RSC Adv. 2016, 6, 48515–48522. [Google Scholar] [CrossRef]
- Zhang, Y.-T.; Jiang, J.-Y.; Shi, T.-Q.; Sun, X.-M.; Zhao, Q.-Y.; Huang, H.; Ren, L.-J. Application of the CRISPR/Cas system for genome editing in microalgae. Appl. Microbiol. Biotechnol. 2019, 103, 3239–3248. [Google Scholar] [CrossRef]
- Chisti, Y. Biodiesel from microalgae. Biotechnol. Adv. 2007, 25, 294–306. [Google Scholar] [CrossRef]
- Schade, S.; Meier, T. A comparative analysis of the environmental impacts of cultivating microalgae in different production systems and climatic zones: A systematic review and meta-analysis. Algal Res. 2019, 40, 101485. [Google Scholar] [CrossRef]
- Wang, B.; Lan, C.Q.; Horsman, M. Closed photobioreactors for production of microalgal biomasses. Biotechnol. Adv. 2012, 30, 904–912. [Google Scholar] [CrossRef] [PubMed]
- Jorquera, O.; Kiperstok, A.; Sales, E.A.; Embiruçu, M.; Ghirardi, M.L. Comparative energy life-cycle analyses of microalgal biomass production in open ponds and photobioreactors. Bioresour. Technol. 2010, 101, 1406–1413. [Google Scholar] [CrossRef] [PubMed]
- Pawar, S.B. Process Engineering Aspects of Vertical Column Photobioreactors for Mass Production of Microalgae. ChemBioEng Rev. 2016, 3, 101–115. [Google Scholar] [CrossRef]
- Acién Fernández, F.G.; Fernández Sevilla, J.M.; Molina Grima, E. Photobioreactors for the production of microalgae. Rev. Environ. Sci. Biotechnol. 2013, 12, 131–151. [Google Scholar] [CrossRef]
- Itoiz, E.S.; Fuentes-Grünewald, C.; Gasol, C.M.; Garcés, E.; Alacid, E.; Rossi, S.; Rieradevall, J. Energy balance and Environmental impact analysis of microalgal biomass production for biodieselgeneration in a photobioreactor pilot plant. Biomass Bioenergy 2012, 39, 324–335. [Google Scholar] [CrossRef] [Green Version]
- Raes, E.J.; Isdepsky, A.; Muylert, K.; Borowitzka, M.A.; Moheimani, N.R. Comparison of growth of Tetraselmis in a tubular photobioreactor (Biocoil) and a raceway pond. J. Appl. Phycol. 2014, 26, 247–255. [Google Scholar] [CrossRef]
- Holdmann, C.; Schmid-Staiger, U.; Hirth, T. Outdoor microalgae cultivation at different biomass concentrations—Assesment of different daily and seasonal light scenarios by modeling. Algal Res. 2019, 38, 101405. [Google Scholar] [CrossRef]
- Pegallapati, A.K.; Arudchelvam, Y.; Nirmalakhandan, N. Energetic performance of photobioreactors for algal cultivation. Environ. Sci. Technol. Lett. 2014, 1, 2–7. [Google Scholar] [CrossRef]
- Endres, C.H.; Roth, A.; Brück, T.B. Modeling Microalgae Productivity in Industrial-Scale Vertical Flat Panel Phototbioreactors. Environ. Sci Technol. 2018, 52, 5490–5498. [Google Scholar] [CrossRef]
- Wolf, J.; Stephens, E.; Steinbusch, S.; Yarnold, J.; Ross, I.L.; Steinweg, C.; Doebbe, A.; Krolovitsch, C.; Müller, S.; Jakob, G.; et al. Multifactorial comparison of photobioreactor geometries in parallel microalgae cultivations. Algal Res. 2016, 15, 187–201. [Google Scholar] [CrossRef]
- Stanier, R.Y.; Kunisawa, R.; Mandel, M.; Cohen-Bazire, G. Purification and properties of unicellular blue-green algae (Order Chroococcales). Bacteriol. Rev. 1971, 35, 171–205. [Google Scholar] [CrossRef]
- Sukačová, K.; Búzová, D.; Červený, J. Biphasic optimization approach for maximization of lipid production by the microalga Chlorella pyrenoidosa. Folia Microbiol. 2020, 65, 901–908. [Google Scholar] [CrossRef] [PubMed]
- Sukačová, K.; Búzová, D.; Trávníček, P.; Červený, J.; Vítězová, M.; Vítěz, T. Optimization of microalgal growth and cultivation parameters for increasing bioenergy potential: Case study using the oleaginous microalga Chlorella pyrenoidosa Chick (IPPAS C2). Algal Res. 2019, 40, 101519. [Google Scholar] [CrossRef]
- Folch, J.; Lees, M.; Sloane Stanley, G.H. A simple method for the isolation and purification of total lipides from animal tissues. J. Biol. Chem. 1957, 226, 497–509. [Google Scholar] [CrossRef]
- Platt, T.; Gallegos, C.L.; Harrison, W.G. Photoinhibition of photosynthesis in natural assemblages of marine phytoplankton. J. Mar. Res. 1980, 38, 687–701. [Google Scholar]
- Friedl, A.; Padouvas, E.; Rotter, H.; Varmuza, K. Prediction of heating values of biomass fuel from elemental composition. Anal. Chim. Acta 2005, 544, 191–198. [Google Scholar] [CrossRef]
- de Morais, M.G.; Costa, J.A.V. Carbon dioxide fixation by Chlorella kessleri, C. vulgaris, Scenedesmus obliquus and Spirulina sp. cultivated in flasks and vertical tubular photobioreactors. Biotechnol. Lett. 2007, 29, 1349–1352. [Google Scholar] [CrossRef]
- Huang, J.; Ying, J.; Fan, F.; Yang, Q.; Wang, J.; Li, Y. Development of a novel multi-column airlift photobioreactor with easy scalability by means of computational fluid dynamics simulations and experiments. Bioresour. Technol. 2016, 222, 399–407. [Google Scholar] [CrossRef]
- Lam, M.K.; Lee, K.T. Cultivation of Chlorella vulgaris in a pilot-scale sequential-baffled column photobioreactor for biomass and biodiesel production. Energy Convers. Manag. 2014, 88, 399–410. [Google Scholar] [CrossRef]
- Ugwu, C.U.; Ogbonna, J.C.; Tanaka, H. Improvement of mass transfer characteristics and productivities of iclined tubular photobioreactors by installation of internal static mixers. Appl. Microbiol. Biotechnol. 2002, 58, 600–607. [Google Scholar] [CrossRef] [PubMed]
- Rodolfi, L.; Chini Zittelli, G.; Bassi, N.; Padovani, G.; Biondi, N.; Bonini, G.; Tredici, M.R. Microalgae for oil: Strain selection, induction of lipid synthesis and outdoor mass cultivation in a low-cost photobioreactor. Biotechnol. Bioeng. 2009, 102, 100–112. [Google Scholar] [CrossRef] [PubMed]
- Scragg, A.H.; Illman, A.M.; Carden, A.; Shales, S.W. Growth of microalgae with increased calorific values in a tubular bioreactor. Biomass Bioenergy 2002, 23, 67–73. [Google Scholar] [CrossRef]
- Feng, P.; Deng, Z.; Hu, Z.; Fan, L. Lipid accumulation and growth of Chlorella zofingienis in flat plate photobioreactors outdoors. Bioresour. Technol. 2011, 102, 10577–10584. [Google Scholar] [CrossRef]
- Degen, J.; Uebele, A.; Retze, A.; Schmid-Staiger, U.; Walter, T. A novel airlift photobioreactor with baffles for improved light utilization through the flashing light effect. J. Biotechnol. 2001, 92, 89–94. [Google Scholar] [CrossRef]
- Zhang, Q.H.; Wu, X.; Xue, S.Z.; Wang, Z.H.; Yan, C.H.; Cong, W. Hydrodynamic Characteristics and Microalgae Cultivation in a Novel Flat-Plate Photobioreactor. Biotechnol. Prog. 2013, 29, 127–134. [Google Scholar] [CrossRef]
- Martinez-Guerra, E.; Gude, V.G. Energy aspects of microalgal biodiesel production. AIMS Energy 2016, 4, 347–362. [Google Scholar] [CrossRef]
- Ördög, V.; Stirk, W.A.; Bálint, P.; Aremu, A.O.; Okem, A.; Lóvázs, C.; Molnár, Z.; van Staden, J. Effect of temperature and nitrogen concentration on lipid productivity and fatty acid composition in three Chlorella strains. Algal Res. 2016, 16, 141–149. [Google Scholar] [CrossRef]
- Kakarla, R.; Choi, J.W.; Yun, J.H.; Kim, B.H.; Heo, J.; Lee, S.; Cho, D.H.; Ramanam, R.; Kim, H.S. Application of high-salinity stress for enhancing the lipid productivity of Chlorella sorokiniana HS1 in a two-phase process. J. Microbiol. 2018, 56, 56–64. [Google Scholar] [CrossRef] [PubMed]
- He, Q.; Yang, H.; Wu, L.; Hu, C. Effect of light intensity on physiological changes, carbon allocation and neutral lipid accumulation in oleaginous microalgae. Bioresour. Technol. 2015, 191, 219–228. [Google Scholar] [CrossRef] [PubMed]
- Sajjadi, B.; Chen, W.-Y.; Raman, A.A.A.; Ibrahim, S. Microalgae lipid and biomass for biofuel production: A comprehensive review on lipid enhancement strategies and their effects on fatty acid composition. Renew. Sustain. Energy Rev. 2018, 97, 200–232. [Google Scholar] [CrossRef]
- Yeh, K.L.; Chang, J.S. Nitrogen starvation strategies and photobioreactor design for enhancing lipid content and lipid production of a newly isolated microalgae Chlorella vulgaris ESP-31: Implication of biofuel. Biotechnol. J. 2011, 6, 1358–1366. [Google Scholar] [CrossRef]
- Piligaev, A.V.; Sorokina, K.N.; Samoylova, Y.V.; Parmon, V.N. Lipid production by microalga Micractinium sp. IC-76 in a flat panel photobioreactor and its transesterification with cross-linked enzyme aggregates of Burkholderia cepacia lipase. Energy Convers. Manag. 2018, 156, 1–9. [Google Scholar] [CrossRef]
- Sarayloo, E.; Simsek, S.; Unlu, Y.S.; Cevahir, G.; Erkey, C.; Kavakli, I.H. Enhancement of the lipid productivity and fatty acid methyl ester profile of Chlorella vulgaris by two rounds mutagenesis. Bioresour. Technol. 2018, 250, 764–769. [Google Scholar] [CrossRef]
- Khichi, S.S.; Anis, A.; Ghosh, S. Mathematical modeling of light energy flux balance in flat panel photobioreactor for Botryococcus braunii growth, CO2 biofixation and lipid production under varying light regimes. Biochem. Eng. J. 2018, 134, 44–56. [Google Scholar] [CrossRef]
- Illman, A.; Scragg, A.; Shales, S. Increase in Chlorella strains calorific values when grown in low nitrogen medium. Enzyme Microb. Technol. 2000, 27, 631–635. [Google Scholar] [CrossRef]
- Slade, R.; Bauen, A. Micro-algae cultivation for biofuels: Cost, energy balance, environmental impacts and future prospects. Biomass Bioenergy 2013, 53, 29–38. [Google Scholar] [CrossRef] [Green Version]
- Tredici, M.R.; Rodolfi, L.; Biondi, N.; Bassi, N.; Sampietro, G. Techno-economic analysis of microalgal biomass production in a 1-ha Green Wall Panel (GWP®) plant. Algal Res. 2016, 19, 253–263. [Google Scholar] [CrossRef] [Green Version]
- Nwoba, E.G.; Parlevliet, D.A.; Laird, D.W.; Alameh, K.; Moheimani, N.R. Pilot-scale self-cooling microalgal closed photobioreactor for biomass production and electricity generation. Algal Res. 2020, 45, 1–11. [Google Scholar] [CrossRef]
- Tripathy, A.; Tripathi, D.K.; Chauhan, D.K.; Kumar, N. Paradigms of climate change impacts on some major food sources of the worls: A review on current knowledge and future prospects. Agric. Ecosyst. Environ. 2016, 216, 356–373. [Google Scholar] [CrossRef]
- Barati, B.; Lim, P.E.; Gan, S.Y.; Poong, S.W.; Phang, S.M.; Beardall, J. Effect of elevated temperature on the physiological responses of marine Chlorella strains from different latitudes. J. Appl. Phycol. 2018, 30, 1–13. [Google Scholar] [CrossRef]
Figure 1.
Schematic representation of design of the three photobioreactors used in this study: Helical-tubular PBR (Bioreactor A), Multi-tubular airlift PBR (Bioreactor B) and Flat panel PBR (Bioreactor C). Green parts of each PBR represent sunlight illuminated zones, yellow parts in Helical-Tubular Photobioreactor (H-T PBR), and Multi-Tubular Airlift photobioreactor (MTA PBR) represent dark zones. Total volumes of H-T PBR, MTA PBR, and Flat-Panel Airlift Photobioreactor FPA PBR were 200 L, 60 L and 25 L, respectively. LED panel in FPA PBR was placed at the back side of the cultivation tank.

Figure 2.
Growth of C. pyrenoidosa in H-T PBR, MTA PBR, and FPA PBR under nutrient sufficiency (as determined throughout the year 2018). Measured data points from individual cultivations were interpolated by logistic function (Equation (1)) using least squares fitting method. Data of C. pyrenoidosa growth under N limitation are summarized in Supplementary Figure S1.

Figure 3.
Temperature profiles in H-T PBR (black lines) and MTA PBR (grey lines) in June (A), July (B), September (C), and October 2018 (D). The full lines represent averages from 8 days of cultivation in each photobioreactor, the dark and light grey error intervals represent standard deviations for H-T PBR and MTA PBR, respectively. The doted lines represent temperature profiles in days when minimal and maximal temperatures during the light phase of the day were detected (within each month). Temperature in FPA PBR was regulated to 25 °C.

Figure 4.
Temperature dependence of biomass productivity in MTA PBR (left panel) and H-T PBR (right panel) under nutrient sufficiency. Each point represents average daily temperature as measured during 8 days of C. pyrenoidosa cultivation in June, July, September and October 2018, error bars represent standard deviations. Biomass productivity was determined from a single point measurement at 8th cultivation day, data of C. pyrenoidosa growth are summarized in Figure 2. Temperature coefficient Q10 was calculated according to Equation (2).

Figure 5.
Light intensity and temperature profiles (upper row panels) and photosynthesis efficiency parameters (bottom rows panels) during 6th and 8th day of C. pyrenoidosa cultivation in June, July, September, and October 2018 (left to right columns) in H-T PBR (black lines, black squares) and MTA PBR (grey lines, grey circles). The points represent measured data throughout the light phase of each 6th and 8th cultivation day, the dashed lines represent particular averages. The photosynthesis efficiency parameters, schematically represented in the bottom right panel, were determined according to Equations (4) and (5). All photosynthesis-irradiance curves from which the parameters were derived are summarized in Supplementary Figure S2.

Figure 6.
Specific electric input power PS (W L−1) as measured for H-T PBR, MTA PBR, and FPA PBR. Distribution of individual components within each PBR is summarized in Equations (6)–(8). Note that the circulation pump was not part of FPA PBR and, on the contrary, LEDs lighting and cooling were specific for FPA only.


Table 1.
Biomass and lipid accumulation in C. pyrenoidosa cultures cultivated under nutrient sufficiency (full BG-11 medium) and under N limitation (BG-11 medium with 10 times lower N content) in the Multi-tubular airlift photobioreactor (MTA PBR), Helical-tubular photobioreactor (H-T PBR) and Flat panel photobioreactor (FPA PBR, for details on PBRs construction see Figure 1). The data represent mean values ± standard deviations, n = 2–4. In both 2018 and 2019, no significant differences in biomass or lipid accumulation and production were found between individual photobioreactors (ANOVA followed by Tukey’s HSD test: p > 0.05). N.D.: not determined.
| Parameters (Determined after 8 Days of Cultivation) | Nutrient Sufficiency | N-Limitation | ||||
|---|---|---|---|---|---|---|
| MTA PBR | H-T PBR | FPA | MTA PBR | H-T PBR | FPA | |
| PBR | PBR | |||||
| Biomass content | 1.17 ± 0.58 | 1.32 ± 0.08 | 1.84 ± 0.12 | 1.81 ± 0.87 | 1.27 ± 0.35 | 1.35 ± 0.08 |
| (g L−1) | ||||||
| Biomass productivity | 107 ± 72 | 147 ± 6 | 199 ± 7 | 202 ± 109 | 143 ± 30 | 148 ± 6 |
| (mg L−1 d−1) | ||||||
| Lipid content | 34 ± 9 | 26 ± 3 | N.D. | 44 ± 2 | 41 ± 5 | 47 ± 3 |
| (%) | ||||||
| Lipid productivity | 34 ± 19 | 38 ± 5 | N.D. | 87 ± 44 | 60 ± 21 | 70 ± 2 |
Table 2.
Calorific values and the elemental analysis of C. pyrenoidosa biomass produced under nitrogen limited conditions. The data represent averages ± standard deviations, n = 2–3. No differences between photobioreactors were identified (ANOVA followed by Tukey’s HSD test: p > 0.05).
Table 2.
Calorific values and the elemental analysis of C. pyrenoidosa biomass produced under nitrogen limited conditions. The data represent averages ± standard deviations, n = 2–3. No differences between photobioreactors were identified (ANOVA followed by Tukey’s HSD test: p > 0.05).
| H-T PBR | MTA PBR | FPA PBR | |
|---|---|---|---|
| Carbon (%) | 54.2 ± 1.6 | 56.0 ± 1.2 | 57.8 ± 0.6 |
| Hydrogen (%) | 7.7 ± 0.4 | 7.8 ± 0.2 | 8.0 ± 0.06 |
| Nitrogen (%) | 4.2 ± 0.9 | 4.1 ± 0.1 | 3.2 ± 0.05 |
| Sulphur (%) | 0.36 ± 0.03 | 0.38 ± 0.04 | 0.3 ± 0.01 |
| Oxygen (%) | 29.4 ± 1.3 | 27.9 ± 1.3 | 27.2 ± 1.2 |
| Calorific values (MJ kg−1) | 24.0 ± 1.9 | 25.2 ± 1.1 | 25.2 ± 1.4 |
Publisher’s Note: MDPI stays neutral with regard to jurisdictional claims in published maps and institutional affiliations. |
© 2021 by the authors. Licensee MDPI, Basel, Switzerland. This article is an open access article distributed under the terms and conditions of the Creative Commons Attribution (CC BY) license (http://creativecommons.org/licenses/by/4.0/).
Share and Cite
MDPI and ACS Style
Sukačová, K.; Lošák, P.; Brummer, V.; Máša, V.; Vícha, D.; Zavřel, T. Perspective Design of Algae Photobioreactor for Greenhouses—A Comparative Study. Energies 2021, 14, 1338. https://doi.org/10.3390/en14051338
AMA Style
Sukačová K, Lošák P, Brummer V, Máša V, Vícha D, Zavřel T. Perspective Design of Algae Photobioreactor for Greenhouses—A Comparative Study. Energies. 2021; 14(5):1338. https://doi.org/10.3390/en14051338
Chicago/Turabian StyleSukačová, Kateřina, Pavel Lošák, Vladimír Brummer, Vítězslav Máša, Daniel Vícha, and Tomáš Zavřel. 2021. "Perspective Design of Algae Photobioreactor for Greenhouses—A Comparative Study" Energies 14, no. 5: 1338. https://doi.org/10.3390/en14051338
Note that from the first issue of 2016, this journal uses article numbers instead of page numbers. See further details here.