A Novel Check-List Strategy to Evaluate the Potential of Operational Improvements in Wastewater Treatment Plants


1
Institute of Process Engineering & NETME Centre, Brno University of Technology, Technická 2896/2, 616 69 Brno, Czech Republic
2
Department of Environmental Engineering, Institute of Chemical Process Fundamentals of the CAS, V.v.i., Rozvojova 135, 165 02 Prague 6, Czech Republic
*
Author to whom correspondence should be addressed.
Energies 2020, 13(19), 5005; https://doi.org/10.3390/en13195005
Submission received: 10 August 2020
/
Revised: 17 September 2020
/
Accepted: 21 September 2020
/
Published: 23 September 2020
(This article belongs to the Section A: Sustainable Energy)
Abstract
:With increasing demands for cleaning and purification of water, wastewater treatment plants (WWTP) require their most efficient operation. The operators are thus obliged to constantly review the efficiency of the processing units and technological equipment of WWTPs and seek opportunities for improvements. To increase the efficiency of particular equipment, the important parameters to be used for the intensification must be correctly selected. A common WWTP consists of different types of processing units, where the basic parameters can be changed to achieve the highest efficiency (i.e., maximum output with minimum energy consumption) in the WWTP. However, due to many possible technologies in the wastewater treatment process, the combinations of processing units can be complex. In such cases, the efficiency assessment can be misleading if only basic parameters were accessed. Moreover, single-unit intensification can potentially improve the efficiency of the unit itself but cannot guarantee full process improvement. This can be due to negative causal effects in the downstream due to that unit intensification. This work reviews of key parameters at five selected pieces of WWTP equipment (inlet pump station, airlift pump, primary sedimentation tank, aeration chamber, and mixing of anaerobic digester) to demonstrate the correct selection of all affected parameters for the efficiency assessment. In the context of the whole WWTP process, it is necessary to take into account several other parameters to evaluate the efficiency of the equipment. Finally, a methodology for assessing the significance of the identified parameters is proposed. This methodology is effectively applied and demonstrated in the WWTP case study.
1. Introduction
Wastewater treatment plants (WWTPs) are considered to be environmentally strategic facilities, where the reliability of their operation is essential [1]. However, the wastewater treatment process has high operating costs, which can reach up to 33% of local government expenditure [2]. For these reasons, WWTPs are the subject of many research projects aimed to improve the quality of discharged water [3], to improve the value of secondary products [4], and to reduce the energy consumption of the wastewater treatment process [5]. In order to implement the obtained knowledge in practice, it is necessary to constantly evaluate best available technologies for WWTP (e.g., Reference [6,7]). Optimizing the current equipment is one of the ways to adapt current technologies to new requirements, streamline their operation, or save costs.
To optimize a WWTP process is not an easy task, as each plant differs in its devices and technological equipment [8]. A number of research studies focus on the possibilities of optimization of WWTP technologies. Single-objective optimizations aimed at reducing batch time in sludge activated chamber [9] or multi-objective optimizations seeking the best compromise between technology running conditions and specific targets, such as, e.g., maximum performance of sludge activated chamber at minimum operating costs [10], were assessed. These studies dealt with optimization in simulated or real WWTPs [11,12]. The success of any improvement depends on the correct definition of the objectives and the correct identification of all the parameters affected by the intervention. However, there is no defined approach to this initial step; thus, the identification of important parameters is the key and demanding process [13].
A common objective of the optimization is to increase the efficiency of WWTP equipment and thus reduce operating costs, where electrical energy accounts for approximately 30–50% of the total operating costs of a WWTP, depending on its size [14]. About 80% of the electricity is driven via electric motors by various devices (pumps, compressors, agitators, etc.) [15]. Energy audits show that virtually any WWTP can reduce electricity consumption by 20–40% [16], which points to the reserves in the efficiency of operated equipment and possibilities to increase their efficiency. The efficiency of devices is commonly expressed as the ratio of performance (output) to the power consumption, i.e., electricity input. The output of the processing unit is defined by its design specification parameters, which should be indicated on the equipment label [17]. Experience shows that the usual assessment only focused on improving these parameters could adversely affect the operation of other technologies, so the resulting impact on total operating costs would be negative.
The efficiency of WWTP equipment must always be evaluated with the consideration of its effect on other parts of WWTP technology. For this, it is necessary to consider also other parameters and design specification parameters. The performed review looked for both design specification parameters and parameters used for optimization for the studied equipment. All considered parameters for each equipment were comprehensively searched in the literature and are listed in the checklist tables. However, the parameters found have different degrees of significance for evaluating efficiency. Therefore, based on the obtained results, a methodology was proposed by which the identified parameters can be scored and compared. The aim of the research is a sophisticated evaluation of the efficiency of WWTP processing units, thanks to which inefficient innovative can be prevented in practice. The proposed methodology will be helpful for advanced design innovations and energy-saving measures in WWTPs.
2. Selection of Equipment for a Review
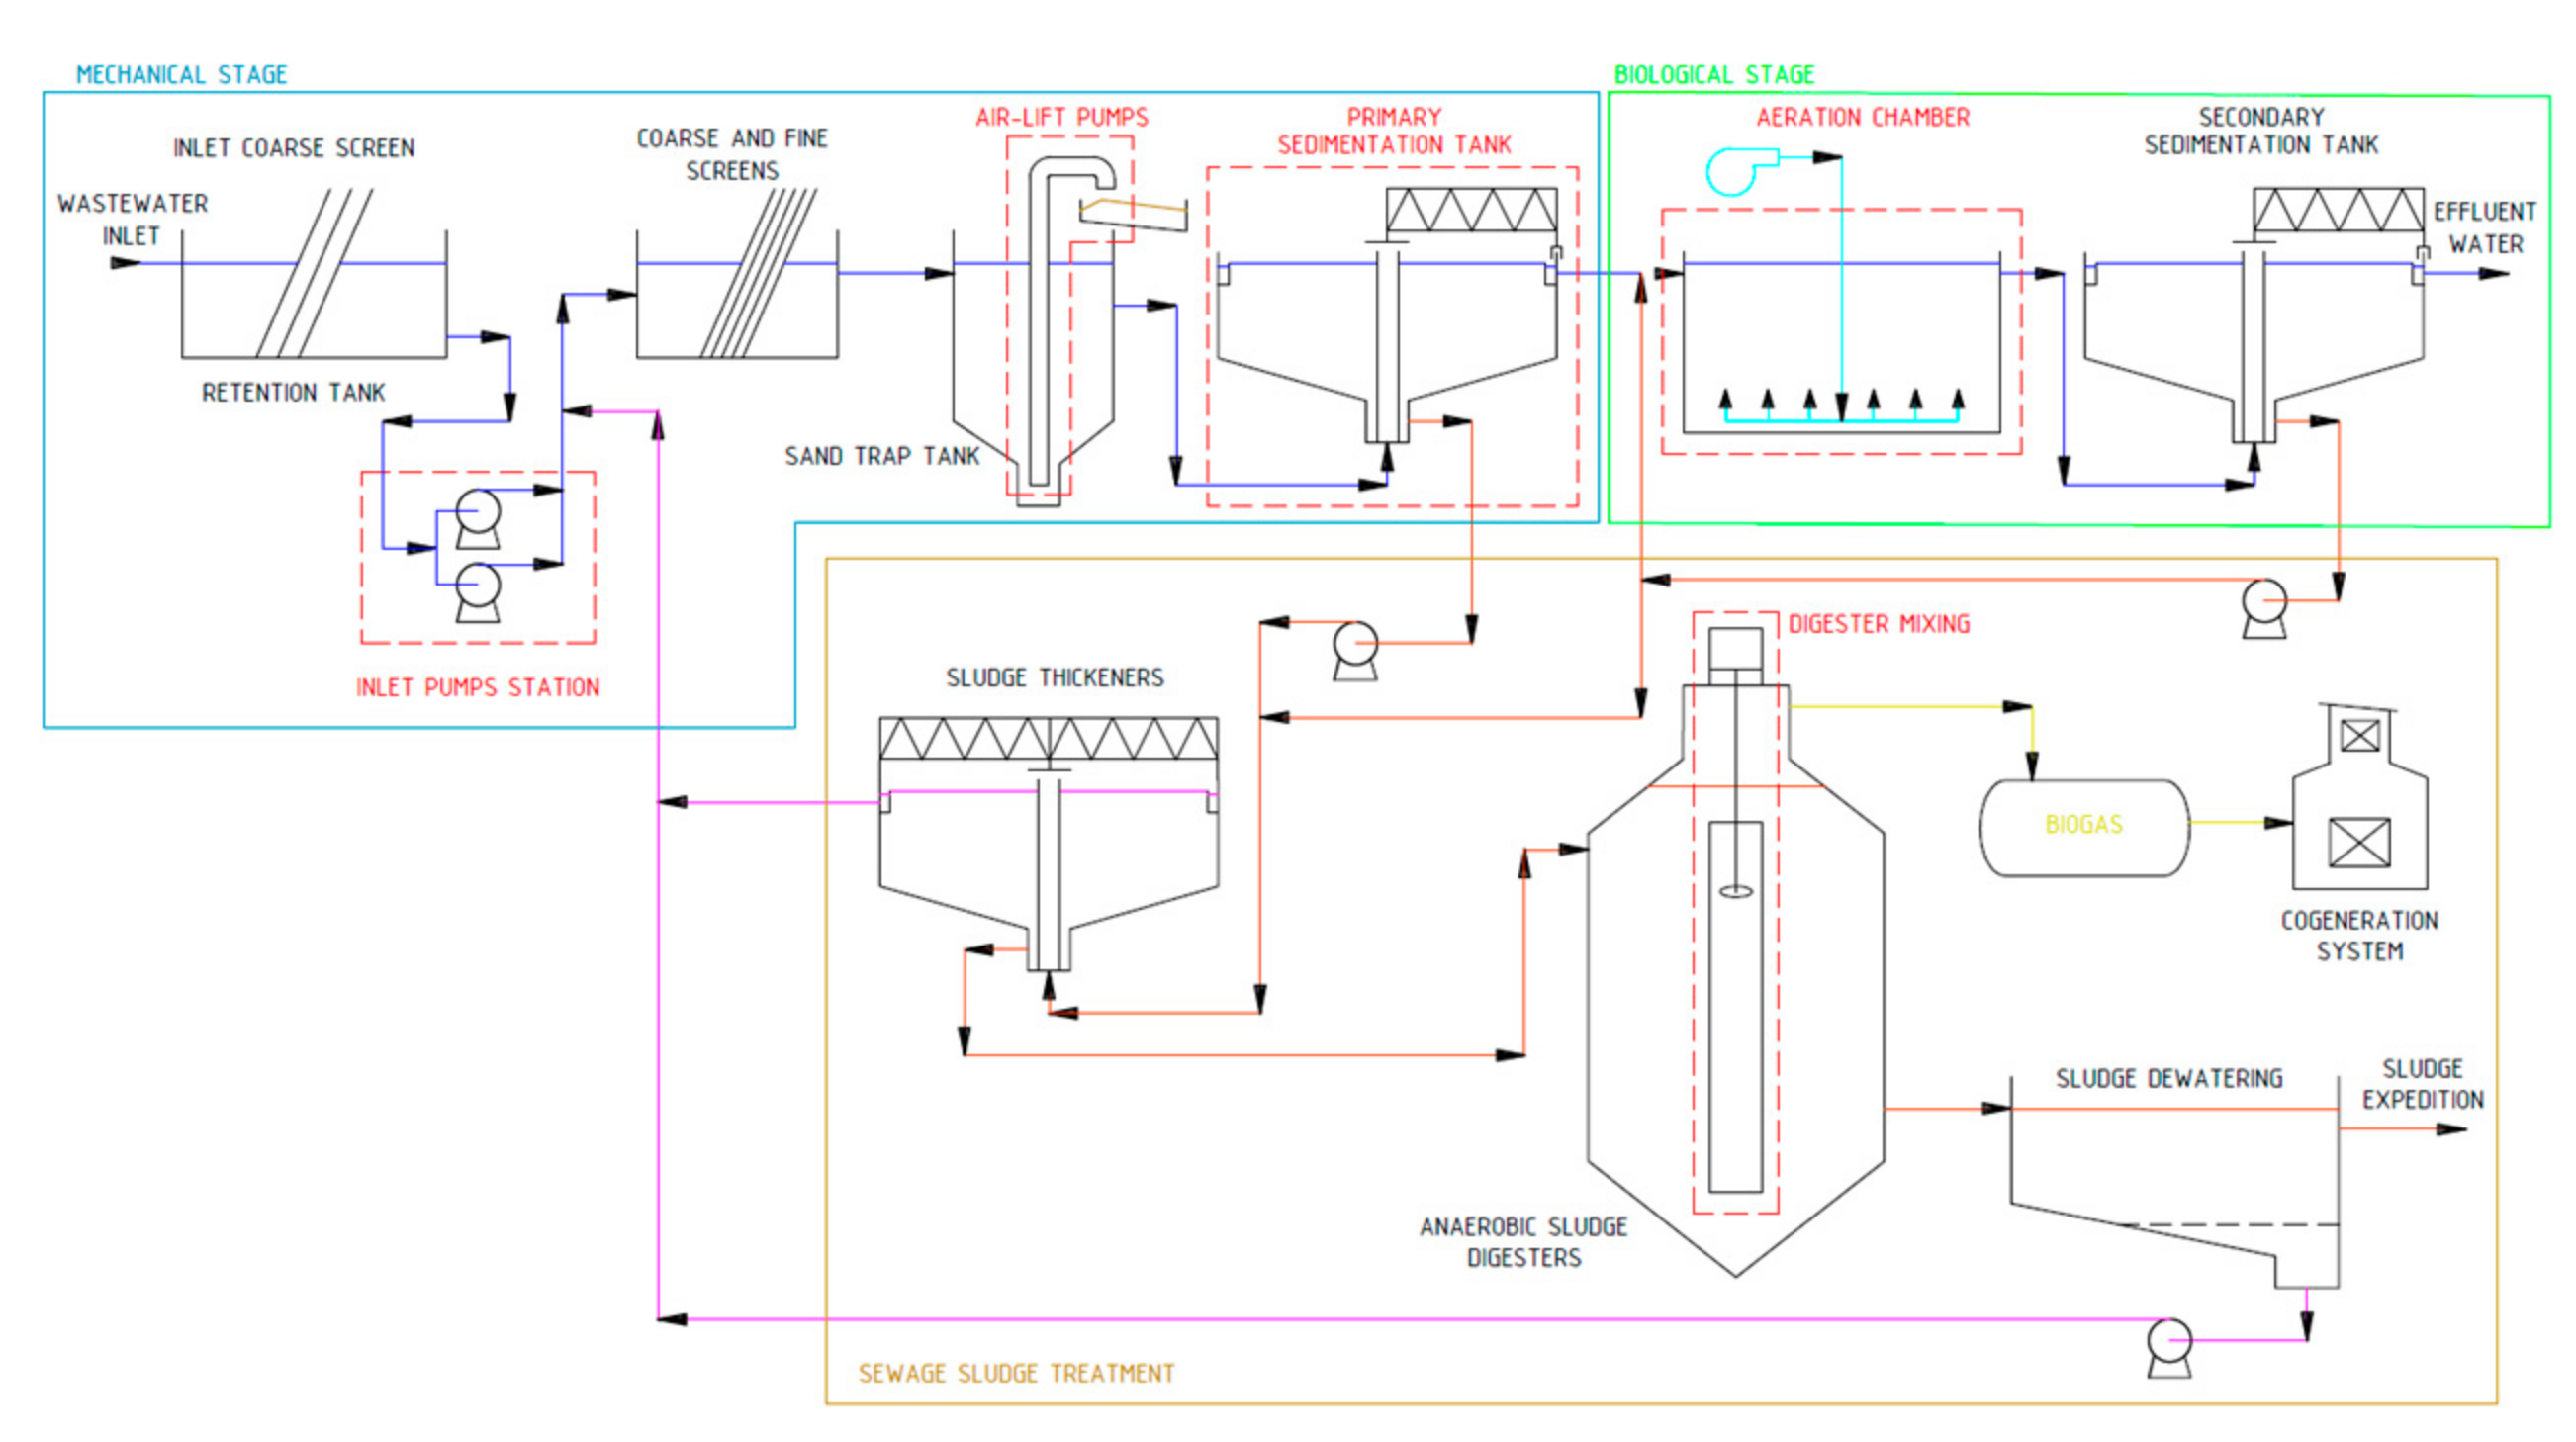
Hydraulic equipment was chosen for the review because hydraulic processes are crucial for WWTP, and, at the same time, they need many design parameters [17]. Thus, the evaluation of their efficiency might not be quite clear. Figure 1 shows a block diagram of a typical municipal WWTP. It uses a technology of mechanical-biological water treatment with sludge management, which is the most common one worldwide [12]. The following equipment was included for the review:
- inlet pump station (mechanical stage);
- air-lift pump in sand chambers (mechanical stage);
- primary sedimentation tank (mechanical stage);
- aeration chamber (biological stage); and
- mixing of anaerobic digesters (sewage sludge treatment).
The position of selected equipment in WWTP technology is marked in red in Figure 1.
Selected equipment are typical for WWTP operations and are often represented. A brief search of their energy consumption is carried out, and it was found that systematic analyses of equipment consumption are rarely reported in the available literature [19]. An exception to this is, for example, Drewnowski et al. [20], who lists the average consumptions of individual processing units in Polish WWTPs, or a study from 1994 evaluating the operating costs of all wastewater treatment plants in the province of Ontario (Canada) [21]. In their work, they found that many factors influenced the energy consumption of individual plants, in particular the overall size of the plant, the size and design of the respective equipment, the condition of the equipment, etc. For this reason, the reported consumption varies from plant to plant.
The electricity consumption of pumping usually ranges from 10 to 25% of the total consumption. At Denmark’s third-largest WWTP (Avedoere), the consumption of effluent pumps and wastewater traps is 11%, to which the inlet pumps have to be added; however, in this study, they are included in the consumption of the entire mechanical treatment stage (18%) [22]. In addition, other sources mention the consumption of pumping but only as total value. In Poland, the pump consumption ratio is 18% [20]; in the U.S., it is 14.8% [23]; in Ontario, Canada, 21.1% [21]; and in China, 17.8% [24].
The contribution of energy consumption of the sedimentation process belongs to the lower ones. The study from Canada states a contribution of 6.8% [21]; in the U.S., it is 3.2% [23]; and the Polish study reports, only 2% [20]. On the contrary, aeration is generally considered to be the most demanding process of the entire WWTP technology. A commonly reported contribution of energy spent on aeration achieves more than half the consumption of the entire plant. In Poland, it is 51% [20] on average, while it is 53% in Portugal [16], 54.1% in the U.S. [23], 51.6% in China [24], and 54.8% in Ontario, Canada [21]. With the size of the plant, this contribution is decreasing, as evidenced by an analysis of the Danish wastewater treatment plant, where the contribution of aeration is 44% [22].
The costs of mixing of digesters at WWTPs are not usually reported. The energy intensity of digesters operation can be found, e.g., in the Polish study (9%) [20] or the U.S. study (14.2%) [23], but they do not specify which installations are included in this sum. However, for information purposes, it can be stated that the ratio of energy consumption for mixing of digesters in biogas plants, which are essentially technologically identical to sludge management, is up to 54% [25].
Considering energy intensity, the aeration chambers are consuming the most energy. On the contrary, sedimentation tanks are the least energy-intensive and the energy-intensity of airlift pumps is not even mentioned at all. The selected equipment thus represent not only all parts of the WWTP technology but also create a representative sample for proving the universal applicability of the methodology.
3. Review of Key Equipment Parameters
During the review of selected equipment, key parameters (according to which could their effectiveness be evaluated) were concisely chosen. For clarity, the parameters found are classified based on three criteria: “Design”, “Optimization”, and “Operation”. The first criterion “Design” defines whether the given parameter is basic, i.e., whether it is used for the design and standard efficiency calculation. Usually, such a parameter is given in the specification of the device. The second criterion “Optimization” distinguishes the parameters according to the usefulness for the optimization of the equipment (which is assessed based on available literature). These two criteria, therefore, reflect the operational importance of the selected parameters. For example, if a parameter satisfies all criteria, it is then critical in assessing the overall efficiency of the equipment. The last criterion, “Operation”, distinguishes whether the parameter is variable in operation. If changing a parameter requires shutting down the operation, then such a parameter is considered to be fixed; otherwise, it is variable. It is assumed that a fixed parameter cannot affect the efficiency of other machinery. Identified parameters of each equipment are presented in the form of a checklist table, in which the satisfaction of the given criteria for a processing unit is marked with the symbol “✓” while the opposite case is indicated by the symbol “✗”. The partial conclusions reached are briefly commented upon in this paper.
3.1. Inlet Pump Stations
Pumping is the most common process in WWTP technology. Pumping of treated water varies considerably according to the geographic profile of a particular WWTP. As far as the height profile of the plant permits, the pumps shall be placed after the mechanical stage of the treatment plant, where the water is already free of all unsuspended solids [26]. At this location, the risks of damage and excessive wear of the pumps are minimal, allowing the use of conventional centrifugal pumps that have the highest efficiency. If the raw water energy at the inflow to the WWTP is not sufficient, it is necessary to increase this energy by pumps immediately after the retention tank. Usually, Archimedean screw pumps are used, which are not sensitive to floating impurities and can transport even large pieces [8]. The inlet pump station as the first installation of the whole WWTP technology cannot be influenced by any preceding installation; therefore, the impact assessment is unnecessary, but it was included in this study to verify the methodology.
Rotary pumps, which are driven by electric motors, are most commonly used for pumping of water in WWTPs. For the basic design of rotary pump output, these parameters are needed:
- density of the pumped liquid,
- required flow rate, and
- required discharge head.
The required discharge head is the sum of the geometrical height, the difference in the kinetic energy of the liquid flow, and the pressure losses in the piping, which are variable factors that differ from plant to plant. Based on these parameters, gravity acceleration can be used to calculate the required pump output power. The input power of the electric motor to drive the pump must be higher due to the different energy losses of the pump. The ratio of these power values represents the overall efficiency of the pump. See the following formula:
where ηP is the efficiency of pump (-), ρ is a water density (kg∙m−3), QW is a volume flow (m3∙s−1), Y is a specific energy of pumped water (J∙kg−1), and PR is a power consumption (W).
This efficiency includes the efficiency of the conversion of electrical energy to mechanical (electric motor efficiency), the efficiency of mechanical energy transfers from the electric motor to the pump, and the hydraulic efficiency of the pump [27].
The actual efficiency of the pump is affected by current operating parameters, such as the actual flow rate and actual pressure losses. They reflect the clogging of the pipes and the mechanical wear of the active surfaces of the pump. The usual total efficiency of pumps in WWTP technology is 32%. At an efficiency of 80%, a pump is considered highly efficient [8].
The actual flow rate also differs from the designed flow rate, either overloading the pump or only partially loading the pump. Both of these conditions have negative impacts on hydraulic efficiency and thus on electrical energy consumption [28]. Fluctuations in the flow rate are caused by the irregular inflow of wastewater into WWTP, both during the day, with morning and evening peaks, and also during the year. In the case of a unified sewerage system, where the rainwater is drained together with the sewage water, the effect of weather is significantly reflected in the flow rate. In smaller plants, this can be largely eliminated by a retention tank with sufficient capacity; however, in large WWTPs, with a large sewerage network, such a solution is not sufficient. This has been the subject of several studies. Van Heeringen (2016) solved the optimization of pump stations of the sewerage system of an urban agglomeration in the Netherlands to ensure a steady inflow to the WWTP in real-time [29]. The mathematical tool for controlling the inflow of water into the WWTP developed by Stefan Kroll’s team (2016) included precipitation sensors located in the sewerage network plan, which can better respond to weather conditions. Ensuring an even water inflow to the WWTP also affects other technological equipment [30].
Several studies have addressed the issues of pump control in WWTPs. Kusiak et al. (2013) solved a suitable tool for pump station optimization and a suitable method of data collection [31]. They monitored the following parameters for optimization:
- outlet water flow rate,
- speed of pumps,
- water level in the tank, and
- increase in energy consumption.
Data were collected at 5-min intervals and averaged after 15 min to construct the simulation model. The tool for the most efficient control of WWTP pump stations, developed by Zhang et al. (2012), is also based on the same data [32]. The actual pump energy consumption and real flow rates are also monitored by the STOAT simulation tool, which then evaluates the actual pump efficiency and compares it with the reference values. This allows the operator to detect possible pump defects in advance [28]. The authors simulated 27 scenarios for the given case and, using 5 different mathematical models, then evaluated the most advantageous variant and the most advantageous operation settings on the current flow rate and energy consumption [31]. A study of Berge et al. (2014) describes monitoring a sewage pump station and creating a tool for early detection of defects also monitors current water flow rates and energy consumption [33].
The parameters related to the pump operation are shown in Table 1. The output power of rotary pumps can be controlled just by changing the speed and, in the case of a pump station, also by the number of working pumps. The optimal value of the output can be controlled according to the actual flow rate and pressure losses. Online monitoring of these parameters is thus essential to ensure the most efficient operation. For the needs of WWTPs, more advanced control systems have been developed which, based on the measurement of appropriate parameters (amount of water in the buffer tank, wastewater flow rate in the sewerage network, and amount of rainwater), can predict the amount of inflowing water. Accordingly, the pumps at the inflow to the WWTP are controlled thus preventing fluctuations in the hydraulic load of the WWTP operation, which has a positive impact on other technological equipment. By measuring the temperature and fluctuations in the electrical energy consumption of specific pumps, potential defects can be detected in time, which makes it possible to minimize maintenance costs.
3.2. Airlift Pump
From the bottom of sand traps, settled sand and fine gravel are usually pumped by airlift pumps [8]. These pumps differ from the previous ones because they are jet pumps, which are characterized mainly by the absence of moving parts. The energy carrier here is compressed air, which forms a 3-phase mixture (air, water, and solids-sand) with a lower density than that of the surrounding mixture of water and sand and thus causes the actual movement of the pumped mixture. The main advantage of airlift pumps is a simple construction and maintenance-free operation, which is redeemed by low efficiency (approximately 35–55%) [34]. The analysis of airlift pumps should verify the applicability of the proposed methodology to this specific equipment.
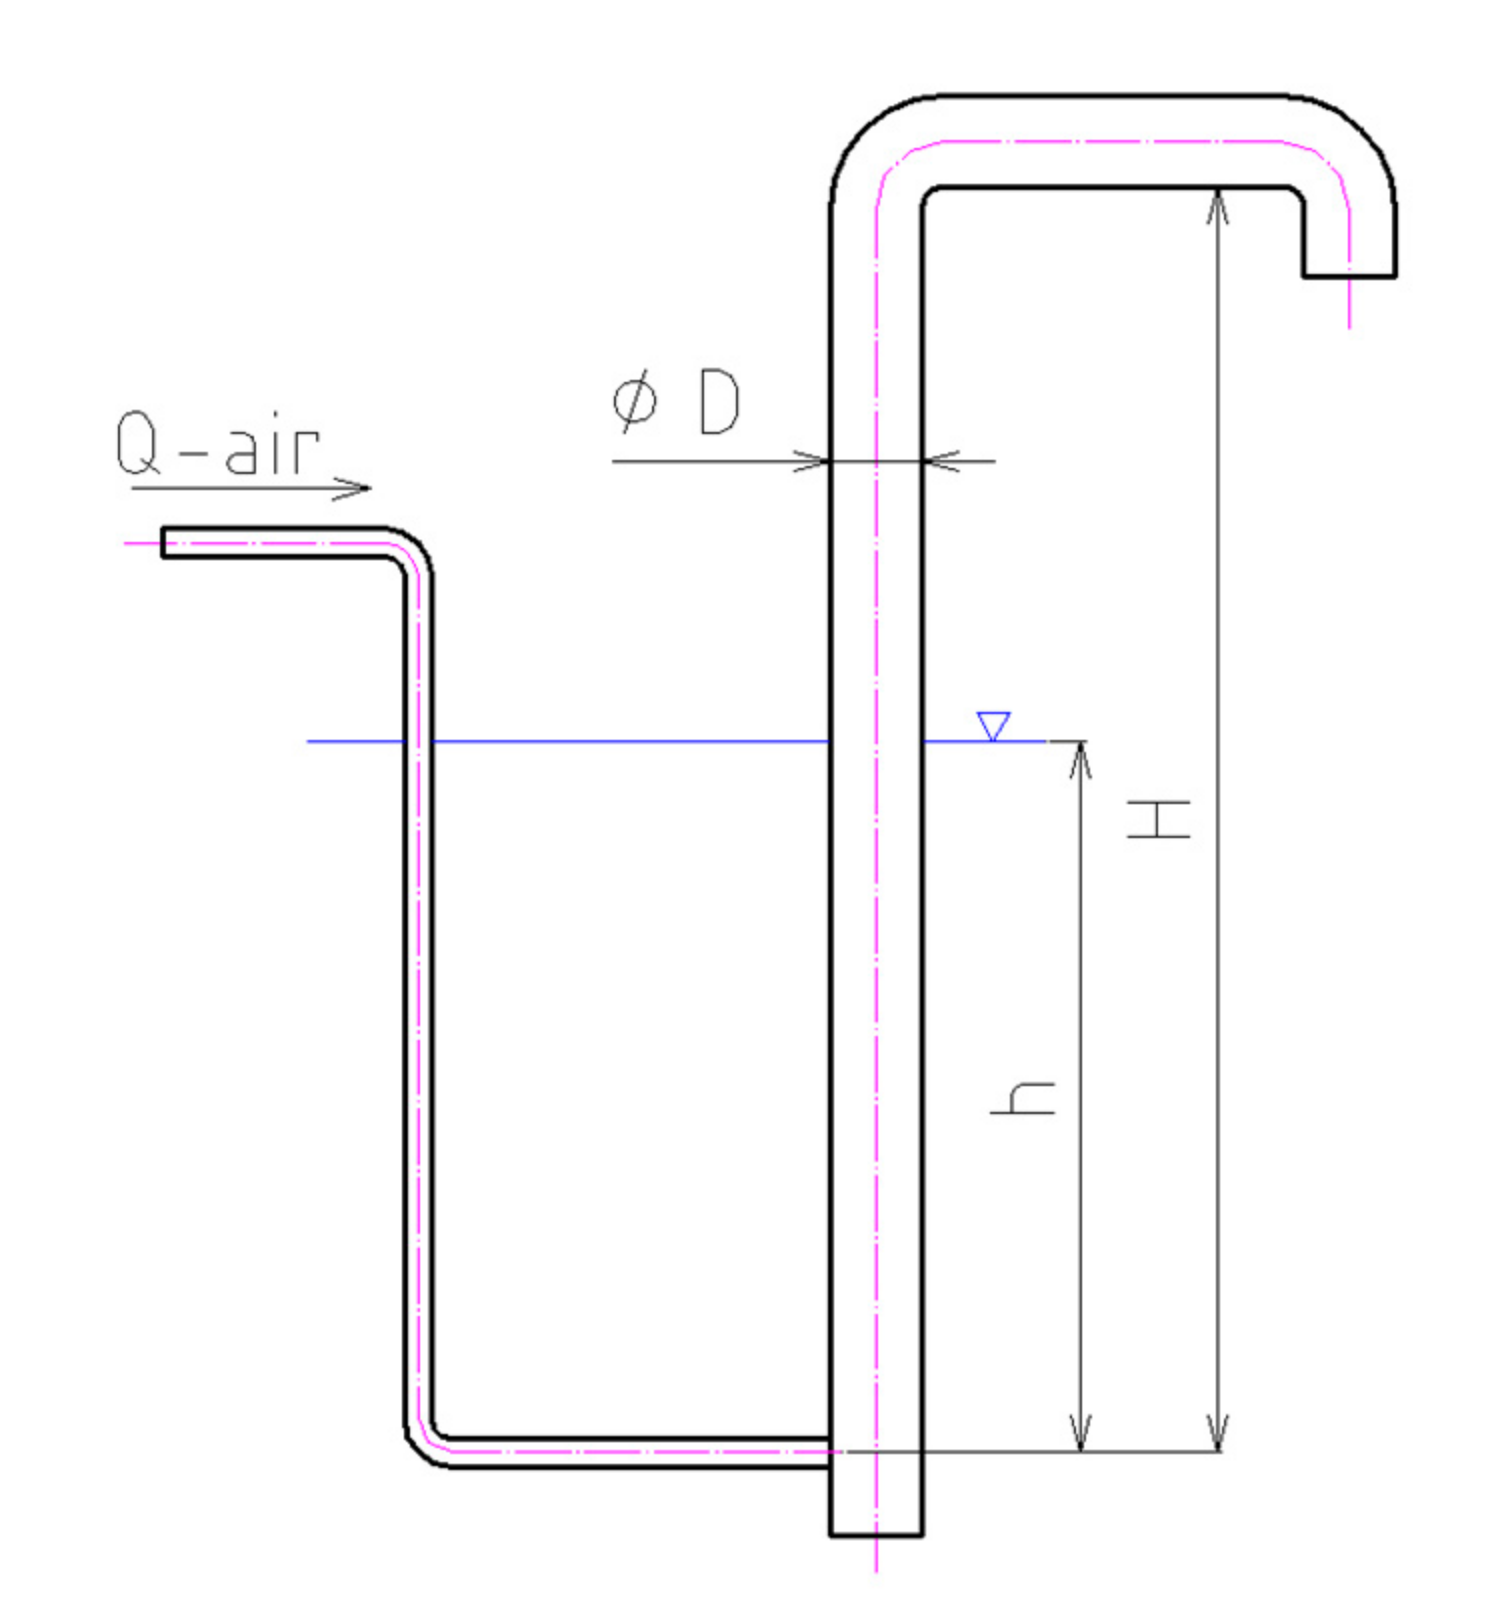
Below are the basic parameters provided for airlift pumps. For better clarity, they are indicated in the schematic diagram (Figure 2):
- airflow rate (Qair),
- submergence depth (h),
- height of discharge (H), and
- diameter of the riser (D).
The ratio of the submergence depth to the lift height is called the submergence ratio, which is an important parameter influencing the output of the pump.
The description of the influence of selected parameters (pipe diameter, nozzle diameter, supplied-air pressure, etc.) on the pump output and efficiency is given in the article by Awari (2004) [35]. Hamid Tighzert et al., in their 2013 study, experimentally investigated the actual impact of relative submergence and airflow rate on the airlift pump output. Using a transparent pipeline, the authors were able to describe the course of two-phase flow and define its form for the highest output [36]. Zhineng Wang et al. (2018), who used the LDV (Laser Doppler Velocimetry) method to measure the flow rate and a high-speed imaging camera to describe the effect of the submergence to airflow rate ratio, also used a transparent pipeline for the study of the maximum output of two-phase flow [37].
The technical design of the air supply also has an influence on the subsequent formation of the flow and thus on the achieved pumping output [38]. The research was also conducted on the effect of directing the supplied air into the discharge pipe. The best results were achieved by a combination of axial and radial air supply. This research also examined the effect of pulsed air supply, and experimental tests showed that the pumping output of the airlift pump increased by up to 60% with pulsed air supply compared to continuous supply [39]. The effect of temperature on the pump output was also investigated, where the experimental study [40] proved that, at operating temperatures higher than 45 °C, this factor cannot be neglected.
All studies state that the basic parameters (see Figure 2) affect the form of two-phase flow, which has a direct effect on the pumping output. The studies agree that the highest output is achieved just before the change flow mode, which was also studied in detail [41]. To model the two-phase flow, many studies have been conducted, the analysis of which is presented by Morgado (2016) [42].
As the airlift pumps are used for pumping of sand a three-phase flow mode must be taken into account. Various investigations have also been carried out in this area. Kassab et al. (2007) created a mathematical model for the prediction of three-phase flow pump outputs, which was experimentally verified. The authors examined the pumping capacity of airlift pumps for solid particles of different sizes and confirmed that the increasing particle size negatively impacts the pumping output [43]. Deendarlianto et al. (2019) went even further in his study and experimentally investigated the effect of the angle of the air supply nozzles on the pumping of solid particles of different diameters. He found that the agitation of the settled solid particles has a very positive effect on the pumping efficiency. On the contrary, larger particle size negatively impacts the pumping characteristics [44].
Experimental research has also provided calculations of the efficiency of airlift pumps, for the calculation of which a simple relationship is most often used; this is based on the assumptions of an isometric process [45]. It is widely used despite a 1986 study that considers this relationship imperfect for the design of airlift pumps due to neglect of pressure losses and presents its own, much more sophisticated, equation that already includes these losses and can be used to determine the optimal pipe diameter, air flow rate or submergence ratio [34]. In addition to the basic coefficients for two-phase flow and the above parameters, it also takes into account the air pressures at the nozzle and the discharge of the airlift pump. This equation was experimentally verified both on operational data and in the laboratory.
To compare the suitability of airlift pumps for given applications, Hanafizadech et al. (2014) suggest introducing dimensionless criteria based on known basic parameters. These criteria (capacity coefficient and superficial slip ratio) correspond in their waveforms to the output criteria and their efficiency to the criteria of centrifugal pumps and can thus be compared [46].
Table 2 shows the identified parameters based on the review. The review reveals that the control ability of an airlift pump is considerably limited by fixed design parameters.
3.3. Primary Sedimentation Tank
Sedimentation tanks use gravitational sedimentation of solid particles to separate undissolved organic impurities. Coarse impurities, gravel, and sand, are captured in preceding WWT installations. With their 100% efficiency, no inorganic solids should enter the sedimentation tank. The captured organic impurities are discharged to the sludge management for further processing. The same principle is used in the biological stage of WWTP, where biological sludge sediment is separated from the water [8].
The design of sedimentation tanks is based on the sedimentation rate of the required solids in the given environment. This can be determined mathematically if other particle parameters are known, such as characteristic size and density, which is quite problematic in the case of wastewater pollution. In such cases, it is recommended to determine the sedimentation rate experimentally [17]. To dimension the sedimentation tanks, the following values are crucial [47]:
- flow rate of liquid and sludge mixture
- volume ratio of sludge in the liquid
- sedimentation rate
- surface overflow rate (m3∙m−2∙day−1),
- weir loading rate (m3∙m−1∙day−1), and
- retention time
The dimensions of sedimentation tanks are usually the result of economic considerations. The determination of a suitable surface overflow rate is based on various criteria (e.g., Freud’s density criterion), which depends on other properties of the separated sludge [48].
The efficiency of the sedimentation tanks can be expressed as the ratio of the weight of sediment solids to the total weight of solids in the inflow. The actual efficiency is affected by the correct distribution of the inflow to the tank, local changes of the flow in the tank (e.g., in the corners), water temperature, etc. [49].
The study shows that the efficiency of sedimentation tanks in the mechanical stage can significantly affect the economy of the whole subsequent process. At maximum sedimentation efficiency, all the carbon contained in the organic sludge is separated, thus maximizing the biogas yield during anaerobic sludge treatment. However, carbon is also needed for the rapid removal of nitrogen in the sludge activated chamber. If the efficiency of primary sludge sedimentation is high, there will also be high energy costs of denitrification. To select the most appropriate efficiency of sedimentation tanks, it is, therefore, necessary to implement the amount of nitrogenous and organic substances in the wastewater [12]. This makes them different from sedimentation tanks in the biological stage, where it is important to ensure their maximum efficiency to meet the limits of solids content at the effluent [8].
B. Narayanan et al. report (2000) that standard performance criteria, such as surface overflow rate and weir loading rate, do not sufficiently reflect the actual efficiency of real tanks. They prove this by comparing geometrically different tanks, which have the same parameters, but their efficiency differs. They thus propose to monitor the effluent upflow velocity, which has a direct impact on the sedimentation of solid particles towards the effluent and thus is more indicative of the actual efficiency of the respective tank [50].
The identified parameters are given in Table 3. The literature review provided information that water pollution is not important for the efficiency of the equipment but has a major impact on the operation of other technologies (reflected by the high value of the interaction of most output parameters). Therefore, the setting of required efficiency should take these two parameters into account.
3.4. Aeration Chamber
Dissolved impurities are removed from the water by the activity of microorganisms in biological tanks. These must be aerated to have a sufficient oxygen supply [8]. As already mentioned, this operation is the most energy-intensive in the whole WWT process. For this reason, many studies are aimed at reducing the energy intensity of aeration.
Rosso et al., in their review (2008), thoroughly described the key parameters for aeration. The most important parameter is the amount and composition of inlet water pollution (from which the actual demands on the amount of oxygen supplied are based). Furthermore, the ideal oxygen transfer rate is also an important factor. This parameter differs from the actual transfer rate because it exhibits behaviors, such as the immersion depth of the diffuser, the oxygen transfer time, etc. Moreover, it affects the size of the bubbles, which are given by the geometry of the diffuser. The smaller the bubbles, the greater the ratio of surface area to air volume, and the higher the rate of oxygen transfer to the water. However, fine-bubble aerators are more prone to clogging, which results in greater pressure drop and thus higher energy consumption. The degree of clogging also depends on the type of water pollution and other factors. A suitable diffuser should be chosen to give an excellent actual oxygen transfer rate [51].
The solubility of oxygen in water can also be experimentally investigated with respect to the type of diffuser and the properties of the active sludge. The arrangement of the sludge activated chamber and the alternation of the nitrification and denitrification zones also have a great influence on the actual oxygen transfer. In this aspect, the properties and age of activated sludge are limiting factors for possible energy savings [52]. An equally important limitation is the need to maintain adequate water quality at the outlet of the sludge activated chamber. According to these criteria, various mathematical models were compared to predict the required amount of air. For these models, the input parameters are conventionally the amount and composition of inlet water pollution (especially the carbonaceous biological oxygen demand and total suspended solids) [53].
The results of the study from Drewnowski et al. (2019) support the discussion above. Authors point out the possibilities of great savings by optimizing of aeration but emphasizes that, before the optimization, the plant should be equipped with appropriate measuring equipment for continuous monitoring of dissolved oxygen and inlet and outlet water pollution (sensors for nitrogen and phosphorus compounds). It is stated that the installation of proper diffusers is, in itself, inefficient without an advanced control system. It also points out the suitability of control the retention time in individual nitrification and denitrification zones, which could lead to significant savings on aeration, however, this control strategy is not feasible in current WWTPs [20]. Other practical research, aimed at optimizing of aeration, also leads to significant energy savings by implementing a suitable control system that responds to current water parameters. Energy savings range in the tens of percent [54,55,56]. Significant savings can also be achieved by installing up-to-date efficient turbo-blowers [57,58].
The identified parameters are listed in Table 4. Due to the wide interest in this process, many detailed studies are available. With a good efficiency of blowers and well-set parameters of preceding installations, significant energy savings can be achieved.
3.5. Mixing of Anaerobic Digester
Mixing is a key process in WWTP technology. In the biological treatment unit, the cleaned water is mixed in biological tanks while sludge mixing occurs in the digestion tanks. In both cases, the wastewater treatment is carried out by biological organisms. In this work, mixing in digestion tanks was chosen for the analysis to represent the hydraulic process in sludge management, so all phases of the WWTP process are covered (see Figure 1). The collected sewage sludge is fundamentally dangerous for the environment and needs to be further processed [8]. Anaerobic digestion is an energy-efficient process of sludge treatment [59]. It is a biological process where microorganisms convert organic matter into energy necessary for their life and a mixture of gases, which is called biogas. This is then converted in the cogeneration units into heat and electricity. During this process, the sewage sludge loses most of its hazardous properties and after a certain time, it can be treated as ordinary waste (if it meets the required limits). Mixing in digestion tanks increases the productivity of microorganisms to achieve a higher volume of biogas and shorter sludge stabilization time [8]. Mixing of digesters fulfills the following goals:
- to ensure the physical, chemical, and biological homogeneity of the substrate by distributing fresh substrate into the entire volume of the tank and by preventing local overloads, which is reflected in the stability of the process,
- to enable a continuous release of biogas from the suspension and eliminate the formation of gas pockets, and
- to prevent the sedimentation of solid particles and the formation of a sludge ceiling, avoiding reduction of the usable volume of the tank and the need for frequent cleaning of the tank.
By fulfilling these points, the maximum yield of biogas, as well as the energy potential of the processed substrate, can be achieved [60]. However, determining the quality of this biological process is considerably difficult. Efficient mixing equipment is one that can ensure the necessary conditions at the lowest energy cost.
Mixing is a very complex process affected by many parameters. There is no universal way to choose an ideal mixing technology. The design is largely based on empirical formulas and practical experience [17]. In general, the design of mixing should be focused on:
- shape of streamlines,
- determination of energy contribution, and
- geometric arrangement of the tank.
Technically, mixing in digestion tanks can be mechanical, hydraulic, pneumatic (gas mixing by biogas), or any combination of these approaches. Data from the survey of 90 WWTPs in the US between 2005 and 2006 show that the pump mixing technology contributes for 45%, pneumatic mixing for 38% and mechanical mixing for 15% of the total mixing technology used. Some of these plants (2%) operated digestion tanks without mixing [61].
The focus of research on the mixing of digesters is related to the increase in many biogas stations that use the same anaerobic fermentation process to generate energy from organic waste raw materials in the food and agricultural industry. The acquired knowledge can also be applied to the sludge management in WWTPs. Experimentally, it has been shown that gas mixing is not very suitable from the foaming point of view and, in comparison with mechanical mixing, it also shows a lower biogas production [62]. The negative effect of gas mixing on biogas production was confirmed by another study [63]. Contrary to this statement are the conclusions of a recent study comparing the course of fermentation in an unmixed, mechanically mixed, and pneumatically mixed laboratory fermenter. From the biogas point of view production and energy intensity, gas mixing is recommended [64]. From the above findings, to achieve high energy efficiency, mixing is not required. In our analysis, the parameters were chosen to be generally applicable to all types of tanks and mixing methods.
To reduce energy consumption, studies show that, by a suitable mode of intermittent mixing, it is possible to achieve significant energy savings without affecting the overall biogas production [25]. These conclusions are confirmed by a recent study comparing different mixing modes with a non-mixed reactor [65]. The overall effect of the energy inserted into the fermenter by mixing was also tested using hydraulic mixing pumps with various output power. Experiments have shown negative effects of insufficient, as well as excessive, mixing on the fermentation [66]. This same recommendation was given by a comprehensive review [67], which compares the results of optimal mixing modes. Although this surprisingly contradicts the experience from practice, this usually happens in industrial stirrers where shutdowns are common (for various operational reasons) and the digestion tanks are mixed only occasionally. The rheological properties of sludge are also important for determining the required energy of mechanical agitators [68].
The results of these studies (and many others) are comprehensively summarized in a recent review focused on comparing various parameters affecting the overall mixing efficiency. The review compares the results of both laboratory and field research in terms of the used mechanisms of agitators and their installed output power, mixing intervals and speeds, electricity consumption, the size of the stagnant zones, and the degree of foaming.
A summary of all parameters that were used to evaluate the efficiency of the agitators in this study is provided in Table 5. The study proves that the issue of evaluating the mixing efficiency of fermenters is very complicated, and there is no clear criterion [69]. Due to large variability of fixed and operational parameters that affect mixing, Computational Fluid Dynamics (CFD) modeling is massively used, but it is very difficult to fully validate the results [70,71].
4. Proposal of a Novel Methodology for Parameters Evaluation
The previous section provided a clear list of all the important parameters that need to be taken into account for designing innovations and energy savings in WWTP. It confirmed the assumption that the design specification parameters of individual equipment alone are not sufficient to evaluate their effect on other (downstream) technology. However, the identified parameters have a different degree of significance for the (i) efficiency of the equipment itself and (ii) effect on the efficiency of other downstream equipment in the WWTP technology. Additionally, for possible optimization, it is necessary to choose key parameters according to which the optimization will be performed and assessed. For these reasons, the authors propose a methodology in the subsequent section by which the identified parameters can be analytically evaluated.
4.1. Methodology for Parameters Evaluation
This proposed methodology is based on the literature reviews that assessed the real operation of WWTP. Therefore, some expertise in the field of WWTP design and operation is also compiled. For example, the knowledge gained during field research at WWTP operations and consultations with professionals were also considered to increase its applicability. In short, the literature review is used to collect all the possible parameters for WWTP evaluation (see Section 3), and expert evaluation was used to subsequently filter and remove nonsensical parameters from the consideration.
The analysis of the equipment according to the proposed methodology consists of the following procedure:
- selection of affected parameters for the key WWTP equipment;
- assessment of the usability of parameters for analysis and narrowing the selection;
- distinguish between input and output parameters;
- scoring of individual parameters from the measurability/controllability, time variability, and interactions point of view, i.e., determination of so-called Applicability factor; and
- overall assessment of the complexity of increasing the equipment efficiency by Intensification potential and Bind factor.
The first two steps were already provided during the review in Section 3. To remind the reader of these steps again: The first step is the selection of all possible parameters related to the evaluated equipment. These are obtained based on a literature search and supplemented with case study parameters of the specific WWTP. The guideline for the selection of the parameters is their importance for the design calculation and their use for optimization of the respective equipment in WWTPs.
In the next step, the identified parameters are sorted by whether they are useful for “Design”, “Optimization”, or “Operation” (see Table 2, for example). The first criterion, “Design”, defines whether the given parameter is basic, i.e., whether it is used for the design and standard efficiency calculation. Usually, such a parameter is given in the specification of the devices. The second criterion, “Optimization”, distinguishes the parameters according to the usefulness for the optimization of the equipment (which is assessed based on available literature). These two criteria, therefore, reflect the operational importance of the selected parameters. The more parameters meet both criteria, the easier is to assess the overall efficiency of the equipment. The last criterion, “Operation”, distinguishes whether the parameter is variable in operation. If changing a parameter requires shutting down the operation, then such a parameter is considered to be fixed; otherwise, it is variable. Parameters evaluated according to the third criterion as fixed are excluded from further analysis. It is assumed that a fixed parameter cannot affect the efficiency of other machinery.
In the third step of the methodology, all the parameters are divided into input and output. Input parameters are all factors that directly affect the process. These are based both on the internal limits bounded by fixed parameters of the equipment (e.g., pump geometry, tank volume, etc.), as well as on the external parameters of the equipment (e.g., water flow, amount of impurities, etc), where the influences independent of the examined equipment may occur. The output parameters represent the resulting process effect. They can be directly affected by the process or arise as a consequence. Their impact can be either local within the examined equipment or it can also have links to other technologies.
The fourth step of the methodology assesses the value of parameters for evaluating the efficiency of the equipment with regard to the overall efficiency of the WWTP. For this purpose, partial factors were introduced, according to which individual parameters are scored according to their nature-see Table 6. The input parameters are evaluated for the possibility of their monitoring during WWTP operation (factor 1), which is important for the evaluation of the adequate response. The following assessment is directed at how they change over time (factor 2) and how these parameters are influenced by the operation of other WWTP processing units (factor 3). It is essential for the output parameters whether they can be affected by the process control, how quickly they respond to a change, and whether the output parameter can affect the operating parameters of other processing units. Each parameter is then scored based on the criteria. When assessing and scoring the criteria, it is necessary to start from the knowledge of local conditions for the examined WWTP. The Applicability factor represents a measure of the suitability for using a parameter as a state variable when optimizing equipment. It is the sum of the obtained points of factor 1 and factor 2. A low value of the factor indicates the suitability of the parameter for increasing the efficiency of the equipment, taking into account the efficiency of the WWTP process as a whole.
The last step of the analysis is the overall assessment of the complexity of the equipment in terms of ways to improve its efficiency. The arithmetic mean of the Applicability factor of all parameters represents the so-called Intensification potential. The high value indicates the high complexity of applying innovations for the equipment intensification. Other factors—Bind factor—determines the degree of interconnection of the equipment with other technologies of the WWTP. It is determined using the arithmetic mean of the interaction factor, separately for the input and output parameters. By comparing these two values, the equipment can affect the efficiency of other technology, or, conversely, its efficiency may be dependent on other technology.
The analysis identifies all important parameters, determines their complexity and enables to evaluate the interactions of the analyzed equipment. These results will allow the WWTP operator to better assess/improve the efficiency of the equipment and get an idea of the complexity of any intensification. Concerning the identified parameters with a high potential for possible intensification, it is possible to adjust the process monitoring accordingly.
4.2. Application of Methodology and Disucussion of Results
The proposed methodology was applied to the parameters identified in the review (in which the first two steps of the methodology have already been performed). The execution of the third and fourth step for each equipment is elaborated in separate tables (see Table 7, Table 8, Table 9, Table 10 and Table 11). The values in the tables are presented with consideration of experts in the field of WWTP design and operation. The last (fifth) step of the methodology is summarized for all equipment (see Table 12).
Table 7 shows the score of the analyzed parameters for the inlet pump station and their Applicability factor. Based on this factor, the most important parameter for energy-efficient of the WWTP is the outlet flowrate. This also means that this parameter has the greatest impact on other technologies. Furthermore, adjusting the power of the inlet pump station by only considering energy consumptions could have a negative impact on the overall efficiency of the technology.
Individual factors of analyzed parameters for airlift pump are scored in Table 8. Of the variable parameters, as evidenced by the Applicability factor, only the rate of air consumption can be affected. The limited number of assessed parameters insert significant uncertainties into the analysis of this equipment, which is due to the lack of suitable literature sources. The literature search showed that there is no comprehensive research into the operation of airlift pumps at WWTPs.
The identified parameters for primary sedimentation tank and their evaluation are given in Table 9. As already mentioned, the primary sedimentation tank has a great impact on the operation of related technology. The high values of the Applicability factor for practically all parameters demonstrate that all parameters should be significantly considered for operational improvement.
Evaluation of parameters for aeration chamber can be seen in Table 10. The real oxygen transfer efficiency (which is correlated to many sub-parameters) is the most demanding input parameter. The high value of the Applicability factor is due to the considerable dependence on other technologies (which is also reflected in the value of the interaction), as well as insufficient measurement. However, most parameters can be relatively easily quantified and controlled in WWTPs.
The conclusions of the analysis of mixing in digesters are given in Table 11. The analysis shows that the potential intensification of the mixing process is difficult due to the challenges in quantifying input parameters and limited possibilities of control of output parameters. Nevertheless, biogas production is a key parameter for mixing intensification. When optimizing, it is necessary to take into account possible foaming, which can interrupt the whole process. In the authors’ opinion, the information on the changes in the rheological properties of sludge is very important. The low values of the Applicability factor of the parameters power consumption and retention time show that they are suitable for mixing intensification, but this is again limited by sufficient knowledge of the input parameters.
For the final energy efficiency analysis of the equipment, an overall assessment of the complexity of the WWTP equipment was carried out (in terms of the possibility of improving their efficiency). The implementation of this step for all the selected equipment is shown in Table 12.
The Intensification potential points to the complexity of applying innovations and increasing efficiency of the equipment. Based on the analysis, it can be stated that the most available is to improve the efficiency of the inlet pump station; to improve the primary sedimentation tank and mixing anaerobic digester, on the other hand, is the most complicated.
The Bind factor of input and output parameters indicates the interactions within the WWTP technology. The analysis shows that the primary sedimentation tank and inlet pump station have the greatest impact on WWTP technology. The implementation of possible intensification must, therefore, take it into account and check all the consequences for the process. Aeration and mixing anaerobic digester can be considered as affected equipment. This equipment should be upgraded only after previous mapping and modifications of other parts of the technology.
4.3. Overall Summary of the Results of the Analysis
Based on the performed analysis, the following main conclusions were formulated:
- The output of the inlet pump station should be adjusted concerning the needs of the WWTP technology according to the current and expected inflow. The energy efficiency of pumps should be subject to this requirement.
- Sufficient attention is provided to the airlift pumps at WWTPs. More detailed research is needed to better map the interaction of airlift pumps with WWTP technology.
- Although sedimentation tanks are less energy-intensive, the analysis performed has shown a significant effect on the efficiency of other equipment. Achieving the maximum efficiency of the primary sedimentation tank could harm the overall efficiency of the WWTP technology.
- The efficiency of fermenter mixing depends on many state variables, which, however, are not currently monitored at WWTPs (especially sludge parameters). The actual measuring possibilities are also considerably limited.
- Many aeration parameters can be easily measured and controlled, allowing for the significant savings to be made by optimization. This issue is also most extensively covered in the literature.
The obtained conclusions confirm the hypothesis that intensification of the equipment focused only to increasing efficiency the basic parameters are incorrect. From among the analyzed equipment, this assumption was confirmed at the inflow pumping station, sedimentation tanks, and mixing of anaerobic tanks. Several parameters were identified for these equipment, which, although not design, showed a high value of interaction. The design specification parameters of the equipment have only a partial effect on the required output, which confirms the assumption that the evaluation of efficiency only according to the basic parameters of the equipment is insufficient. The analysis also made it possible to identify parameters desirable to perform a complex optimization.
The obtained bind factors make it possible to assess the interconnection of individual equipment to the overall technology. Innovations aimed only at improving the equipment’s efficiency have a high risk of adversely affecting the overall efficiency of the technology. From this point of view, the analysis identified as the riskiest primary sedimentation tank and inlet pump station (high value of the outlet bind factor). On the contrary, the least risky is the airlift pump, where the risk of the impact of the performed intensification on the overall efficiency of the technology is minimal. Intensification of equipment with a high inlet bind factor (from the analysis of aeration and mixing digester) should take into account the possible change of input parameters and be able to respond to it adequately. The suitability of the intensification strategy must be assessed individually plant to plant but should always be based on a thorough analysis of all facilities contained in the WWTP technology.
5. Conclusions
This work demonstrates that well-considered selection of critical parameters for operational improvement in WWTP is an important process. A detailed literature search was carried out for five generic pieces of equipment that have universal functionality in WWTP. This work showed that other parameters than the design specification parameters (which are used for the design and evaluation of the equipment themselves) have an impact on the WWTP technology. At the same time, knowledge of all key parameters is essential not only for the evaluation of the current state of the processing unit but also for the correct setting of possible optimizations.
The proposed methodology aimed to identify all parameters that affect the evaluation of the equipment efficiency. For these parameters, their applicability for equipment intensification and their interaction with other WWTP technology was further evaluated. The Applicability factor was introduced, which evaluates the suitability of using a parameter as a state variable for optimization. For the overall evaluation of the equipment, the Intensification potential and the Binding factor were introduced, which assess the complexity of the implementation of innovations and the interconnection of the equipment with other technologies. Five key pieces of WWTP equipment were selected for the application of the proposed methodology. All equipment was thoroughly analyzed and evaluated. This was also done for such specific equipment, such as air pumps, which are very exceptionally considered during WWTP operation. The performed analysis allows the operator to decide on the ideal strategy of efficiency improvement.
The proposed analysis proved to be promising and applicable for the initial evaluation of the equipment at WWTPs. It allows the WWTP operators to get a proper idea of the possibilities of optimizing the specific equipment and its impact on the rest of the technology. The selected parameters make it possible to assess the sufficiency of monitoring for the intended intensification and to focus on covering the missing data. This makes it possible to better choose an optimization strategy and minimize the risk of negative impacts. The results confirmed the danger of poor evaluation of the equipment efficiency if the links to the WWTP technology and the resulting parameters are not taken into account. The proposed analysis will be applied to other WWTPs, and its results will be further verified and specified.
Author Contributions
Conceptualization, V.Z. and Š.V.; methodology, V.M.; validation, V.Z., P.S. and V.M.; investigation, V.M. and Š.V.; data curation, V.Z.; writing—original draft preparation, V.Z.; writing—review and editing, V.M. and V.Z.; supervision, V.M.; funding acquisition, V.M. and P.S. All authors have read and agreed to the published version of the manuscript.
Funding
This research was funded by Ministry of Education, Youth and Sports of the Czech Republic under OP RDE grant number CZ.02.1.01/0.0/0.0/16_026/0008413 “Strategic Partnership for Environmental Technologies and Energy Production”.
Conflicts of Interest
The authors declare no conflict of interest.
References
- Łój-Pich, M.; Zakrzewska, A. Analysis of risk assessment in a municipal wastewater treatment plant located in upper Silesia. Water 2020, 12, 23. [Google Scholar] [CrossRef] [Green Version]
- Rojas, J.; Zhelev, T. Energy efficiency optimisation of wastewater treatment: Study of ATAD. Comput. Chem. Eng. 2012, 38, 52–63. [Google Scholar] [CrossRef]
- Gadipelly, C.; Pérez-González, A.; Yadav, G.D.; Ortiz, I.; Ibáñez, R.; Rathod, V.K.; Marathe, K.V. Pharmaceutical industry wastewater: Review of the technologies for water treatment and reuse. Ind. Eng. Chem. Res. 2014, 53, 11571–11592. [Google Scholar] [CrossRef]
- Sfez, S.; De Meester, S.; Vlaeminck, S.E.; Dewulf, J. Improving the resource footprint evaluation of products recovered from wastewater: A discussion on appropriate allocation in the context of circular economy. Resour. Conserv. Recycl. 2019, 148, 132–144. [Google Scholar] [CrossRef]
- Mannina, G.; Rebouças, T.F.; Cosenza, A.; Chandran, K. A plant-wide wastewater treatment plant model for carbon and energy footprint: Model application and scenario analysis. J. Clean. Prod. 2019, 217, 244–256. [Google Scholar] [CrossRef]
- Belloir, C.; Stanford, C.; Soares, A. Energy benchmarking in wastewater treatment plants: The importance of site operation and layout. Environ. Technol. 2015, 36, 260–269. [Google Scholar] [CrossRef]
- Krampe, J. Energy benchmarking of South Australian WWTPs. Water Sci. Technol. 2013, 67, 2059–2066. [Google Scholar] [CrossRef]
- Spellman, F.R. Handbook of Water and Wastewater Treatment Plant Operations, 2nd ed.; Taylor & Francis Inc.: London, UK, 2008. [Google Scholar]
- Coelho, M.; Russo, C.; Araújo, O.D.Q.F. Optimization of a sequencing batch reactor for biological nitrogen removal. Water Res. 2000, 34, 2809–2817. [Google Scholar] [CrossRef]
- Egea, J.A.; Gràcia, I. Dynamic multiobjective global optimization of a waste water treatment plant for nitrogen removal. IFAC Proc. Vol. 2012, 45, 374–379. [Google Scholar] [CrossRef] [Green Version]
- Hreiz, R.; Roche, N.; Benyahia, B.; Latifi, M. Multi-objective optimal control of small-size wastewater treatment plants. Chem. Eng. Res. Des. 2015, 102, 345–353. [Google Scholar] [CrossRef] [Green Version]
- Descoins, N.; Déléris, S.; Lestienne, R.; Trouve, E.; Maréchal, F. Energy efficiency in waste water treatments plants: Optimization of activated sludge process coupled with anaerobic digestion. Energy 2012, 41, 153–164. [Google Scholar] [CrossRef]
- Hreiz, R.; Latifi, M.; Roche, N. Optimal design and operation of activated sludge processes: State-of-the-art. Chem. Eng. J. 2015, 281, 900–920. [Google Scholar] [CrossRef] [Green Version]
- Singh, P.; Carliell-Marquet, C.M.; Kansal, A. Energy pattern analysis of a wastewater treatment plant. Appl. Water Sci. 2012, 2, 221–226. [Google Scholar] [CrossRef] [Green Version]
- Goldstein, R.; Smith, W. Water and Sustainability: U.S. Electricity Consumption for Water Supply & Treatment—The Next Half Century; EPRI: Palo Alto, CA, USA, 2002. [Google Scholar]
- Henriques, J.; Catarino, J. Sustainable value—An energy efficiency indicator in wastewater treatment plants. J. Clean. Prod. 2017, 142, 323–330. [Google Scholar] [CrossRef]
- Soares, C. Process Engineering Equipment Handbook; McGraw-Hill: New York, NY, USA, 2002. [Google Scholar]
- KonyaKoski. Konya Wastewater Treatment Plant Flow Diagram 1/3. Available online: https://www.youtube.com/watch?v=iLAWIXqktJ0&t=2s (accessed on 15 May 2020).
- Li, Z.; Zou, Z.; Wang, L. Analysis and forecasting of the energy consumption in wastewater treatment plant. Math. Probl. Eng. 2019, 2019, 1–8. [Google Scholar] [CrossRef] [Green Version]
- Drewnowski, J.; Remiszewska-Skwarek, A.; Duda, S.; Łagód, G. Aeration process in bioreactors as the main energy consumer in a wastewater treatment plant. Review of solutions and methods of process optimization. Processes 2019, 7, 311. [Google Scholar] [CrossRef] [Green Version]
- Evans, B.; Laughton, P. Emerging trends in electrical energy usage at Canadian (Ontario) municipal wastewater treatment facilities and strategies for improving energy efficiency. Water Sci. Technol. 1994, 30, 17–23. [Google Scholar] [CrossRef]
- Sharma, A.K.; Guildal, T.; Thomsen, H.R.; Jacobsen, B.N. Energy savings by reduced mixing in aeration tanks: Results from a full scale investigation and long term implementation at Avedoere wastewater treatment plant. Water Sci. Technol. 2011, 64, 1089–1095. [Google Scholar] [CrossRef]
- Gude, V.G. Energy and water autarky of wastewater treatment and power generation systems. Renew. Sustain. Energy Rev. 2015, 45, 52–68. [Google Scholar] [CrossRef]
- Tao, X.; Chengwen, W. Energy consumption in wastewater treatment plants in China. In World Congress on Water, Climate and Energy; International Water Association (IWA): London, UK, 2012; Volume 2012, p. 6. Available online: https://doi.org/10.13140/2.1.1228.9285 (accessed on 22 April 2020).
- Kowalczyk, A.; Harnisch, E.; Schwede, S.; Gerber, M.; Span, R. Different mixing modes for biogas plants using energy crops. Appl. Energy 2013, 112, 465–472. [Google Scholar] [CrossRef]
- Karia, G.L.; Christian, R.A. Wastewater Treatment: Concepts and Design Approach; Prentice-Hall of India Private Limited: Delhi, India, 2013. [Google Scholar]
- Gülich, J.F. Pump hydraulics and physical concepts. In Centrifugal Pumps; Gülich, J.F., Ed.; Springer: Berlin/Heidelberg, Germany, 2010. [Google Scholar] [CrossRef]
- Torregrossa, D.; Leopold, U.; Hernández-Sancho, F.; Hansen, J.; Cornelissen, A.; Schutz, G. A tool for energy management and cost assessment of pumps in waste water treatment plants. In Decision Support Systems VII. Data, Information and Knowledge Visualization in Decision Support Systems; Lecture Notes in Business Information Processing; Linden, I., Liu, S., Colot, C., Eds.; Springer International Publishing: Cham, Switzerland, 2017; pp. 148–161. [Google Scholar] [CrossRef]
- Van Heeringen, K.J.; van Nooijen, R.; Kooij, K.; Postma, B. Real-time control of sewer pumps by using ControINEXT to smooth inflow at waste water treatment plant Garmerwolde. In EGU General Assembly Conference; EGU General Assembly: Vienna, Austria, 2016; Volume 18, EPSC2016-1412. [Google Scholar]
- Kroll, S.; Dirckx, G.; Donckels, B.M.R.; Van Dorpe, M.; Weemaes, M.; Willems, P. Modelling real-time control of WWTP influent flow under data scarcity. Water Sci. Technol. 2016, 73, 1637–1643. [Google Scholar] [CrossRef] [PubMed] [Green Version]
- Kusiak, A.; Zeng, Y.; Zhang, Z. Modeling and analysis of pumps in a wastewater treatment plant: A data-mining approach. Eng. Appl. Artif. Intell. 2013, 26, 1643–1651. [Google Scholar] [CrossRef]
- Zhang, Z.; Zeng, Y.; Kusiak, A. Minimizing pump energy in a wastewater processing plant. Energy 2012, 47, 505–514. [Google Scholar] [CrossRef]
- Berge, S.; Lund, B.; Ugarelli, R. Condition monitoring for early failure detection. Frognerparken pumping station as case study. Procedia Eng. 2014, 70, 162–171. [Google Scholar] [CrossRef] [Green Version]
- Clark, N.N.; Dabolt, R.J. A general design equation for air lift pumps operating in slug flow. AIChE J. 1986, 32, 56–64. [Google Scholar] [CrossRef]
- Awari, G.K.; Ardhapurkar, P.M.; Wakde, D.G.; Bhuyar, L.B. Performance analysis of air-lift pump design. Proc. Inst. Mech. Eng. Part. C J. Mech. Eng. Sci. 2004, 218, 1155–1161. [Google Scholar] [CrossRef]
- Tighzert, H.; Brahimi, M.; Kechroud, N.; Benabbas, F. Effect of submergence ratio on the liquid phase velocity, efficiency and void fraction in an air-lift pump. J. Pet. Sci. Eng. 2013, 110, 155–161. [Google Scholar] [CrossRef]
- Wang, Z.; Kang, Y.; Wang, X.; Li, D.; Hu, N. Investigating the flow characteristics of air-lift pumps operating in gas–liquid two-phase flow. Chin. J. Chem. Eng. 2018, 26, 219–227. [Google Scholar] [CrossRef]
- Parker, G. The effect of footpiece design on the performance of a small air lift pump. Int. J. Heat Fluid Flow 1980, 2, 245–252. [Google Scholar] [CrossRef]
- Ahmed, W.H.; Aman, A.; Badr, H.; Al-Qutub, A. Air injection methods: The key to a better performance of airlift pumps. Exp. Therm. Fluid Sci. 2016, 70, 354–365. [Google Scholar] [CrossRef]
- Oueslati, A.; Megriche, A. The effect of liquid temperature on the performance of an airlift pump. Energy Procedia 2017, 119, 693–701. [Google Scholar] [CrossRef]
- Hanafizadeh, P.; Ghanbarzadeh, S.; Saidi, M.H. Visual technique for detection of gas–liquid two-phase flow regime in the airlift pump. J. Pet. Sci. Eng. 2011, 75, 327–335. [Google Scholar] [CrossRef]
- Morgado, A.; Miranda, J.M.; Araújo, J.; Campos, J. Review on vertical gas–liquid slug flow. Int. J. Multiph. Flow 2016, 85, 348–368. [Google Scholar] [CrossRef]
- Kassab, S.; Kandil, H.A.; Warda, H.; Ahmed, W. Experimental and analytical investigations of airlift pumps operating in three-phase flow. Chem. Eng. J. 2007, 131, 273–281. [Google Scholar] [CrossRef]
- Deendarlianto Supraba, I.; Majid, A.I.; Pradecta, M.R.; Indarto Widyaparaga, A. Experimental investigation on the flow behavior during the solid particles lifting in a micro-bubble generator type airlift pump system. Case Stud. Therm. Eng. 2019, 13, 100386. [Google Scholar] [CrossRef]
- Nicklin, D.J. The air-lift pump theory and optimization. Chem. Eng. Trans. 1963, 41, 29–39. [Google Scholar]
- Hanafizadeh, P.; Raffiee, A.H.; Saidi, M.H. Experimental investigation of characteristic curve for gas-lift pump. J. Pet. Sci. Eng. 2014, 116, 19–27. [Google Scholar] [CrossRef]
- Brandt, M.J.; Johnson, K.M.; Elphinston, A.J.; Ratnayaka, D.D. Chapter 8—Storage, clarification and chemical treatment. In Twort’s Water Supply, 7th ed.; Brandt, M.J., Johnson, K.M., Elphinston, A.J., Ratnayaka, D.D., Eds.; Butterworth-Heinemann: Boston, MA, USA, 2017; pp. 323–366. [Google Scholar] [CrossRef]
- McCorquodale, J.A.; Zhou, S. Effects of hydraulic and solids loading on clarifier performance. J. Hydraul. Res. 1993, 31, 461–478. [Google Scholar] [CrossRef]
- Scholz, M. Chapter 6—Primary treatment. In Wetlands for Water Pollution Control, 2nd ed.; Scholz, M., Ed.; Elsevier: Amsterdam, The Netherlands, 2016; pp. 27–35. Available online: https://doi.org/10.1016/B978-0-444-63607-2.00006-X (accessed on 12 May 2020).
- Narayanan, B.; Hough, S.; Ooten, R. New hypothesis for secondary clarifier performance under hydraulically limited conditions. Water Environ. Res. 2000, 72, 116–126. [Google Scholar] [CrossRef]
- Rosso, D.; Larson, L.E.; Stenstrom, M.K. Aeration of large-scale municipal wastewater treatment plants: State of the art. Water Sci. Technol. 2008, 57, 973–978. [Google Scholar] [CrossRef]
- Fan, H.; Qi, L.; Liu, G.; Zhang, Y.; Fan, Q.; Wang, H. Aeration optimization through operation at low dissolved oxygen concentrations: Evaluation of oxygen mass transfer dynamics in different activated sludge systems. J. Environ. Sci. 2017, 55, 224–235. [Google Scholar] [CrossRef] [PubMed]
- Asadi, A.; Verma, A.; Yang, K.; Mejabi, B. Wastewater treatment aeration process optimization: A data mining approach. J. Environ. Manag. 2017, 203, 630–639. [Google Scholar] [CrossRef] [PubMed]
- Panepinto, D.; Fiore, S.; Zappone, M.; Genon, G.; Meucci, L. Evaluation of the energy efficiency of a large wastewater treatment plant in Italy. Appl. Energy 2016, 161, 404–411. [Google Scholar] [CrossRef]
- Bertanza, G.; Menoni, L.; Baroni, P. Energy saving for air supply in a real WWTP: Application of a fuzzy logic controller. Water Sci. Technol. 2020. [Google Scholar] [CrossRef] [PubMed]
- Khatri, N.; Khatri, K.K.; Sharma, A. Enhanced energy saving in wastewater treatment plant using dissolved oxygen control and hydrocyclone. Environ. Technol. Innov. 2020, 18, 100678. [Google Scholar] [CrossRef]
- Bell, K.Y.; Abel, S. Optimization of WWTP aeration process upgrades for energy efficiency. Water Pr. Technol. 2011, 6, 1–2. [Google Scholar] [CrossRef]
- MacIntosh, C.; Astals, S.; Sembera, C.; Ertl, A.; Drewes, J.; Jensen, P.; Koch, K. Successful strategies for increasing energy self-sufficiency at Grüneck wastewater treatment plant in Germany by food waste co-digestion and improved aeration. Appl. Energy 2019, 242, 797–808. [Google Scholar] [CrossRef]
- Bianco, M. Circular economy and WWTPs: Water reuse and biogas production. In The Italian Water Industry: Cases of Excellence; Gilardoni, A., Ed.; Springer International Publishing: Cham, Switzerland, 2018; pp. 237–257. [Google Scholar] [CrossRef]
- Liu, Y.; Tay, J.H. The essential role of hydrodynamic shear force in the formation of biofilm and granular sludge. Water Res. 2002, 36, 1653–1665. [Google Scholar] [CrossRef]
- Daugherty, B.; Hemphill, B. Current trends in digester mixing technologies. In Proceedings of the Pacific Northwest Pollution Control Association Conference, Portland, OR, USA, 25 October 2006; p. 60. [Google Scholar]
- Singh, B.; Szamosi, Z.; Siménfalvi, Z. State of the art on mixing in an anaerobic digester: A review. Renew. Energy 2019, 141, 922–936. [Google Scholar] [CrossRef]
- Pagilla, K.R.; Craney, K.C.; Kido, W.H. Causes and effects of foaming in anaerobic sludge digesters. Water Sci. Technol. 1997, 36, 463–470. [Google Scholar] [CrossRef]
- Karim, K.; Klasson, K.T.; Hoffmann, R.; Drescher, S.R.; DePaoli, D.W.; Al-Dahhan, M.H. Anaerobic digestion of animal waste: Effect of mixing. Bioresour. Technol. 2005, 96, 1607–1612. [Google Scholar] [CrossRef]
- Wang, H.; Larson, R.A.; Borchardt, M.; Spencer, S. Effect of mixing duration on biogas production and methanogen distribution in an anaerobic digester. Environ. Technol. 2019, 1–7. Available online: https://doi.org/10.1080/09593330.2019.1621951 (accessed on 6 March 2020).
- McLeod, J.; Othman, M.Z.; Parthasarathy, R. Quantitative investigation of hydraulic mixing energy input during batch mode anaerobic digestion and its impact on performance. Bioresour. Technol. 2018, 263, 583–590. [Google Scholar] [CrossRef] [PubMed]
- Kariyama, I.D.; Zhai, X.; Wu, B. Influence of mixing on anaerobic digestion efficiency in stirred tank digesters: A review. Water Res. 2018, 143, 503–517. [Google Scholar] [CrossRef] [PubMed]
- Low, S.C.; Parthasarathy, R.; Slatter, P.; Eshtiaghi, N. Hydrodynamics study of sludge in anaerobic digesters. Chem. Eng. Trans. 2012, 29, 1321–1326. [Google Scholar] [CrossRef]
- Latha, K.; Velraj, R.; Palaniyandi, S.; Sivanesan, S. Mixing strategies of high solids anaerobic co-digestion using food waste with sewage sludge for enhanced biogas production. J. Clean. Prod. 2019, 210, 388–400. [Google Scholar] [CrossRef]
- Yu, L.; Ma, J.; Frear, C.; Zhao, Q.; Dillon, R.; Li, X.; Chen, S. Multiphase modeling of settling and suspension in anaerobic digester. Appl. Energy 2013, 111, 28–39. [Google Scholar] [CrossRef]
- Zhang, Y.; Yu, G.; Yu, L.; Siddhu, M.A.H.; Gao, M.; Abdeltawab, A.A.; Al-Deyab, S.S.; Chen, X. Computational fluid dynamics study on mixing mode and power consumption in anaerobic mono- and co-digestion. Bioresour. Technol. 2016, 203, 166–172. [Google Scholar] [CrossRef] [PubMed]
Figure 1.
Block diagram of wastewater treatment plants with the analyzed technologies highlighted. Modified from Reference [18].
Figure 1.
Block diagram of wastewater treatment plants with the analyzed technologies highlighted. Modified from Reference [18].

Figure 2.
Sketch of an airlift pump with main parameters.


Table 1.
Parameters of the inlet pump station.
| Equipment | Parameter | Design | Optimization | Operation |
|---|---|---|---|---|
| Inlet pump station | Liquid density | ✓ | ✗ | ✗ |
| Hydraulic head | ✓ | ✗ | ✗ | |
| Water level in retention tank | ✗ | ✓ | ✓ | |
| Increase of energy consumption | ✗ | ✓ | ✓ | |
| Amount of inlet water | ✗ | ✓ | ✓ | |
| Temperature of pump | ✗ | ✓ | ✓ | |
| Hydraulic losses | ✗ | ✓ | ✗ | |
| Outlet flow rate | ✓ | ✓ | ✓ | |
| Speed of pump | ✓ | ✓ | ✓ | |
| Energy consumption | ✗ | ✓ | ✓ | |
| Number of working pumps | ✓ | ✓ | ✓ |
Table 2.
Parameters of the airlift pump.
| Equipment | Parameter | Design | Useful for Optimization | Operation |
|---|---|---|---|---|
| Airlift pump | Submergence depth | ✓ | ✓ | ✗ |
| Height of discharge | ✓ | ✓ | ✗ | |
| Diameter of riser | ✓ | ✓ | ✗ | |
| Geometry of air inlet | ✓ | ✓ | ✗ | |
| Size of solid parts | ✓ | ✓ | ✓ | |
| Liquid temperature | ✗ | ✗ | ✓ | |
| Water flow rate | ✓ | ✓ | ✓ | |
| Air pressure | ✓ | ✓ | ✓ | |
| Mass flow of solid parts | ✓ | ✓ | ✓ | |
| Air flow rate | ✓ | ✓ | ✓ |
Table 3.
Parameters of the primary sedimentation tank.
| Equipment | Parameter | Design | Useful for Optimization | Operation |
|---|---|---|---|---|
| Primary sedimentation tank | Surface overflow rate | ✓ | ✗ | ✗ |
| Weir loading rate | ✓ | ✗ | ✗ | |
| Inlet flow rate of water and solids | ✓ | ✓ | ✓ | |
| Ratio of solids parts | ✓ | ✓ | ✓ | |
| Sedimentation rate | ✓ | ✓ | ✗ | |
| Effluent upflow velocity | ✗ | ✓ | ✓ | |
| Quantity of disabled organic substances | ✗ | ✓ | ✓ | |
| Quantity of disabled nitrogen substances | ✗ | ✓ | ✓ | |
| Retention time | ✓ | ✓ | ✓ | |
| Outlet flow rate of solids | ✓ | ✓ | ✓ | |
| Outlet flow rate of water | ✓ | ✓ | ✓ |
Table 4.
Parameters of the aeration chamber.
| Equipment | Parameter | Design | Useful for Optimization | Operation |
|---|---|---|---|---|
| Aeration chamber | Geometry of diffusers | ✓ | ✓ | ✗ |
| Diffusers cover surface | ✓ | ✓ | ✗ | |
| Depth of diffusers | ✓ | ✓ | ✗ | |
| Real oxygen transfer efficiency | ✗ | ✓ | ✓ | |
| Air pressure | ✓ | ✓ | ✓ | |
| Inlet water flow rate | ✓ | ✓ | ✓ | |
| Amount and composition of inlet water pollution | ✓ | ✓ | ✓ | |
| Retention time | ✓ | ✓ | ✓ | |
| Quantity of disabled oxygen | ✓ | ✓ | ✓ | |
| Diffusers founding | ✗ | ✓ | ✓ | |
| Air consumption | ✓ | ✓ | ✓ | |
| Amount of outlet water pollution | ✓ | ✓ | ✓ |
Table 5.
Parameters of the anaerobic digester mixing.
| Equipment | Parameter | Design | Useful for Optimization | Operation |
|---|---|---|---|---|
| Mixing of anaerobic digester | Geometry of fermenter | ✓ | ✗ | ✗ |
| Geometry of mixing system | ✓ | ✓ | ✗ | |
| Volume-specific energy consumption | ✗ | ✓ | ✓ | |
| Sludge density | ✓ | ✓ | ✓ | |
| Sludge rheology during process | ✗ | ✓ | ✓ | |
| Shear stress | ✗ | ✓ | ✓ | |
| Quantity of organic substances | ✓ | ✓ | ✓ | |
| Ratio of inorganic solids parts | ✗ | ✓ | ✓ | |
| Flow rate of sludge | ✓ | ✓ | ✓ | |
| Flow rate in digester | ✓ | ✓ | ✓ | |
| Foaming | ✓ | ✓ | ✓ | |
| Biogas production | ✓ | ✓ | ✓ | |
| Power consumption | ✓ | ✓ | ✓ | |
| Retention time | ✓ | ✓ | ✓ |
Table 6.
Assessment criteria.
| Parameter | Factor | 1 | 2 | 3 | 4 |
|---|---|---|---|---|---|
| Input | Quantification options on WWTP | Commonly measured | Can be measured directly but not measured | Detectable by indirect measurement | Undetectable |
| Time—Value change | Random changes only | Smooth changes | Dynamic within a known range | Dynamic within an unlimited range | |
| Interaction—Preceding units | Independent | Partial dependence | Significant dependence | Fully dependent | |
| Output | Control options | Direct, dependence-free | Direct, with respect to other parameters | Direct, in combination with other parameters | Indirect by other parameters |
| Time—Response to control action | Immediate | Gradual | Gradual with delay | Long-term | |
| Interaction—Other units | No impact | Insignificant impact | Significant impact | Direct link to other technologies |
Table 7.
Evaluation parameters of the inlet pump station.
| Equipment | Parameter | Type of Parameter | Quant./Contr. Options | Time | Interaction | Applicability Factor |
|---|---|---|---|---|---|---|
| Inlet Pump Station | Water level in retention tank | Input | 2 | 3 | 1 | 5 |
| Increase of energy consumption | 2 | 2 | 1 | 4 | ||
| Amount of inlet water | 1 | 3 | 1 | 4 | ||
| Temperature of pump | 2 | 2 | 1 | 4 | ||
| Flow rate | Output | 2 | 1 | 4 | 3 | |
| Speed of pump | 2 | 1 | 3 | 3 | ||
| Energy consumption | 4 | 1 | 1 | 5 | ||
| Number of working pumps | 2 | 1 | 3 | 3 |
Table 8.
Evaluation parameters of the airlift pump.
| Equipment | Parameter | Type of Parameter | Quant./Contr. Options | Time | Interaction | Applicability Factor |
|---|---|---|---|---|---|---|
| Airlift Pump | Air pressure | Input | 2 | 1 | 1 | 3 |
| Size of solid parts | 4 | 1 | 2 | 5 | ||
| Water flow rate | Output | 4 | 1 | 1 | 5 | |
| Mass flow of solid parts | 4 | 1 | 2 | 5 | ||
| Air flow rate | 1 | 1 | 1 | 2 |
Table 9.
Evaluation parameters of the primary sedimentation tank.
| Equipment | Parameter | Type of Parameter | Quant./Contr. Options | Time | Interaction | Applicability Factor |
|---|---|---|---|---|---|---|
| Primary sedimentation tank | Inlet flow rate of water and solids | Input | 1 | 3 | 2 | 4 |
| Ratio of solids parts | 3 | 3 | 2 | 6 | ||
| Quantity of disabled organic substances | 2 | 3 | 1 | 5 | ||
| Quantity of disabled nitrogen substances | 2 | 3 | 1 | 5 | ||
| Effluent upflow velocity | Output | 4 | 2 | 1 | 6 | |
| retention time | 3 | 2 | 4 | 5 | ||
| Outlet flow rate of solids | 3 | 2 | 4 | 5 | ||
| Outlet flow rate of water | 3 | 2 | 4 | 5 |
Table 10.
Evaluation parameters of the aeration chamber.
| Equipment | Parameter | Type of Parameter | Quant./Contr. Options | Time | Interaction | Applicability Factor |
|---|---|---|---|---|---|---|
| Aeration chamber | Real oxygen transfer efficiency | Input | 3 | 3 | 3 | 6 |
| Air flow rate | 2 | 2 | 1 | 4 | ||
| Inlet water flow rate | 1 | 2 | 2 | 3 | ||
| Amount and composition of inlet water pollution | 2 | 3 | 2 | 5 | ||
| Retention time | Output | 2 | 2 | 2 | 4 | |
| Quantity of disabled oxygen | 1 | 2 | 1 | 3 | ||
| Diffusers founding | 4 | 2 | 1 | 6 | ||
| Air consumption | 2 | 1 | 1 | 3 | ||
| Amount of outlet water pollution | 3 | 3 | 2 | 6 |
Table 11.
Evaluation of parameters of the mixing of anaerobic digester.
| Equipment | Parameter | Type of Parameter | Quant./Contr. Options | Time | Interaction | Applicability Factor |
|---|---|---|---|---|---|---|
| Mixing anaerobic digester | Volume-specific energy consumption | Input | 3 | 3 | 1 | 6 |
| Sludge density | 3 | 2 | 3 | 5 | ||
| Sludge rheology | 4 | 2 | 2 | 6 | ||
| Sheath stress | 4 | 1 | 1 | 5 | ||
| Quantity of organic substances | 3 | 2 | 2 | 5 | ||
| Ratio of inorganic solids parts | 3 | 1 | 3 | 4 | ||
| Flow rate of sludge | 1 | 3 | 2 | 4 | ||
| Flow velocity in digester | Output | 3 | 2 | 1 | 5 | |
| Foaming | 4 | 3 | 1 | 7 | ||
| Biogas production | 4 | 4 | 1 | 8 | ||
| Power consumption | 2 | 1 | 1 | 3 | ||
| Retention time | 2 | 1 | 2 | 3 |
Table 12.
Overall assessment of the complexity of the analyzed equipment.
| Equipment | Intensification Potential | Bind Factor | |
|---|---|---|---|
| Input | Output | ||
| Inlet pump station | 3.88 | 1.00 | 2.75 |
| Airlift pump | 4.00 | 1.50 | 1.33 |
| Primary sedimentation tank | 5.13 | 1.50 | 3.25 |
| Aeration chamber | 4.44 | 2.00 | 1.40 |
| Mixing anaerobic digester | 5.08 | 2.00 | 1.20 |
© 2020 by the authors. Licensee MDPI, Basel, Switzerland. This article is an open access article distributed under the terms and conditions of the Creative Commons Attribution (CC BY) license (http://creativecommons.org/licenses/by/4.0/).
Share and Cite
MDPI and ACS Style
Zejda, V.; Máša, V.; Václavková, Š.; Skryja, P. A Novel Check-List Strategy to Evaluate the Potential of Operational Improvements in Wastewater Treatment Plants. Energies 2020, 13, 5005. https://doi.org/10.3390/en13195005
AMA Style
Zejda V, Máša V, Václavková Š, Skryja P. A Novel Check-List Strategy to Evaluate the Potential of Operational Improvements in Wastewater Treatment Plants. Energies. 2020; 13(19):5005. https://doi.org/10.3390/en13195005
Chicago/Turabian StyleZejda, Vojtěch, Vítězslav Máša, Šárka Václavková, and Pavel Skryja. 2020. "A Novel Check-List Strategy to Evaluate the Potential of Operational Improvements in Wastewater Treatment Plants" Energies 13, no. 19: 5005. https://doi.org/10.3390/en13195005
Note that from the first issue of 2016, this journal uses article numbers instead of page numbers. See further details here.