Detailed Analysis of Sewage Sludge Pyrolysis Gas: Effect of Pyrolysis Temperature
by
 , , , and
Jaroslav Moško
1,2,3 ,
,
Michael Pohořelý
1,2,*,
Siarhei Skoblia
1,
Zdeněk Beňo
1 and
Michal Jeremiáš
1,4 1
Faculty of Environmental Technology, University of Chemistry and Technology Prague, Technická 5, 166 28 Prague, Czech Republic
2
Institute of Chemical Process Fundamentals of the Czech Academy of Sciences, v. v. i., Rozvojová 135, 16502 Prague, Czech Republic
3
Department of Green Chemistry and Technology, Faculty of Bioscience Engineering, Ghent University, Coupure Links 653, 9000 Gent, Belgium
4
Institute of Plasma Physics of the Czech Academy of Sciences, v. v. i., Za Slovankou 1782/3, 182 00 Prague, Czech Republic
*
Author to whom correspondence should be addressed.
Energies 2020, 13(16), 4087; https://doi.org/10.3390/en13164087
Submission received: 30 June 2020
/
Revised: 28 July 2020
/
Accepted: 4 August 2020
/
Published: 6 August 2020
(This article belongs to the Section B: Energy and Environment)
Abstract
:Conventional methods of sewage sludge disposal are often limited by their environmental impact and economic demands. Pyrolysis has been studied as a viable method for sewage sludge disposal and transformation into usable products. Pyrolytic products may have various uses, and their complex characteristics shall be described to assess their potential for safe utilization. Here, we studied slow pyrolysis of stabilized sewage sludge in a fixed bed reactor at 400–800 °C to describe the composition of the pyrolysis gas and the condensate fraction. We found that condensate elemental composition was practically independent of pyrolysis temperature. On the other hand, the composition of the pyrolysis gas was strongly temperature-dependent regarding both the share of major components (H2, CO, CO2, CH4) and C2–C6 hydrocarbons speciation (which as a sum attributed to 7–9 vol. % of the gas). The increase in pyrolysis temperature also resulted in increasing the N2 content of the gas, whereas the sulfur containing gas compounds were substantially diluted in the increasing gas volume.

1. Introduction
Population growth and increasing urban life rate [1] demand extended implementation of wastewater treatment, inevitably resulting in increasing production of waste–sewage sludge. Most of the impurities from wastewater are concentrated in the sludge, which makes it a potentially hazardous material; therefore, safe and reasonable disposal must be applied. Sewage sludge is typically disposed of using incineration [2], agriculture application (as soil fertilizer or part of the compost) and landfilling [3]; however, economic and rigorous environmental requirements limit these methods considerably. Alternatively, pyrolysis of sewage sludge has been proposed to be able to overcome the burdens of conventional sludge disposal management [4,5,6,7].
Pyrolysis of sewage sludge results in three different products (solid, liquid and gas fractions) which may be utilized variably. Solid residue—sludge-char—can be simply burnt or disposed of, on the other hand, its utilization as an adsorbent [8] or soil improver/fertilizer [3,9] seems to be a better option according to the circular economy principle. Pyrolytic oil (condensate liquid product) and pyrolytic gas can be utilized as fuels or raw materials for (petro-)chemical production [10]. However, since pyrolysis is an endothermic process requiring a considerable amount of energy, the use of oil and gas as fuels for the pyrolysis process is the most practical method because they usually contain over 50% of energy from the feed sludge [4,11].
The majority of the gas from sewage sludge pyrolysis comprises of CO2, H2, CO and CH4 and the effect of pyrolysis temperature on these gases is often reported in the literature [4,7,12,13,14]. H2 and CO (most abundant flammable species in the gas) content usually increases with the increase in pyrolysis temperature. CO2 content usually decreases and the CH4 content tends to first increase and then decrease with the rise in temperature. However, specific behaviors of these compounds are strongly dependent on the reactor arrangement and other operational parameters [5,7,12]. On the other hand, the content of nitrogen and sulfur containing species in the pyrolytic gas and condensate is only marginally described in the literature [4,15]. Moreover, light hydrocarbons are usually reported summarily as C2—Cx or CxHy group [7,14,16] and more detailed analysis of their compound species is scarce.
This paper aims to describe the influence of pyrolysis temperature in the range 400–800 °C on the complex composition of the sewage sludge pyrolysis gas and the elemental composition of the condensate. The main focus was to describe the release and potential transformation of light hydrocarbons species (C2—C6), the release of nitrogen from the sludge and sulfur speciation in the gas. The study was complemented by the condensate analysis to describe the mass and energy balance of the sewage sludge pyrolysis process.
2. Materials and Methods
2.1. Sewage Sludge
Stabilized sewage sludge was obtained from a municipal wastewater treatment plant (capacity ca. 500,000 population equivalent). The sludge was stabilized by mesophilic anaerobic digestion (residence time ca. 22 days at constant 35 °C) followed by centrifuge dewatering and drying at ≈ 100 °C for over 3 h. The size fraction between 0.5 and 2 mm was used for the experiments. During the summer time, the samples of the sludge (ca. 10 L) were collected on daily basis for a period of one month. Consequently, the mixed sample was quartered and representative samples were prepared for the analyses. The analysis of the sludge properties was done in four repetitions. The fundamental properties of the sludge are displayed in Table 1. The physical and chemical properties indicate that the sludge is the typical representative of anaerobically stabilized sewage sludge, preferably the ash to volatiles ratio ca. 1:1.
2.2. Pyrolysis Experiments
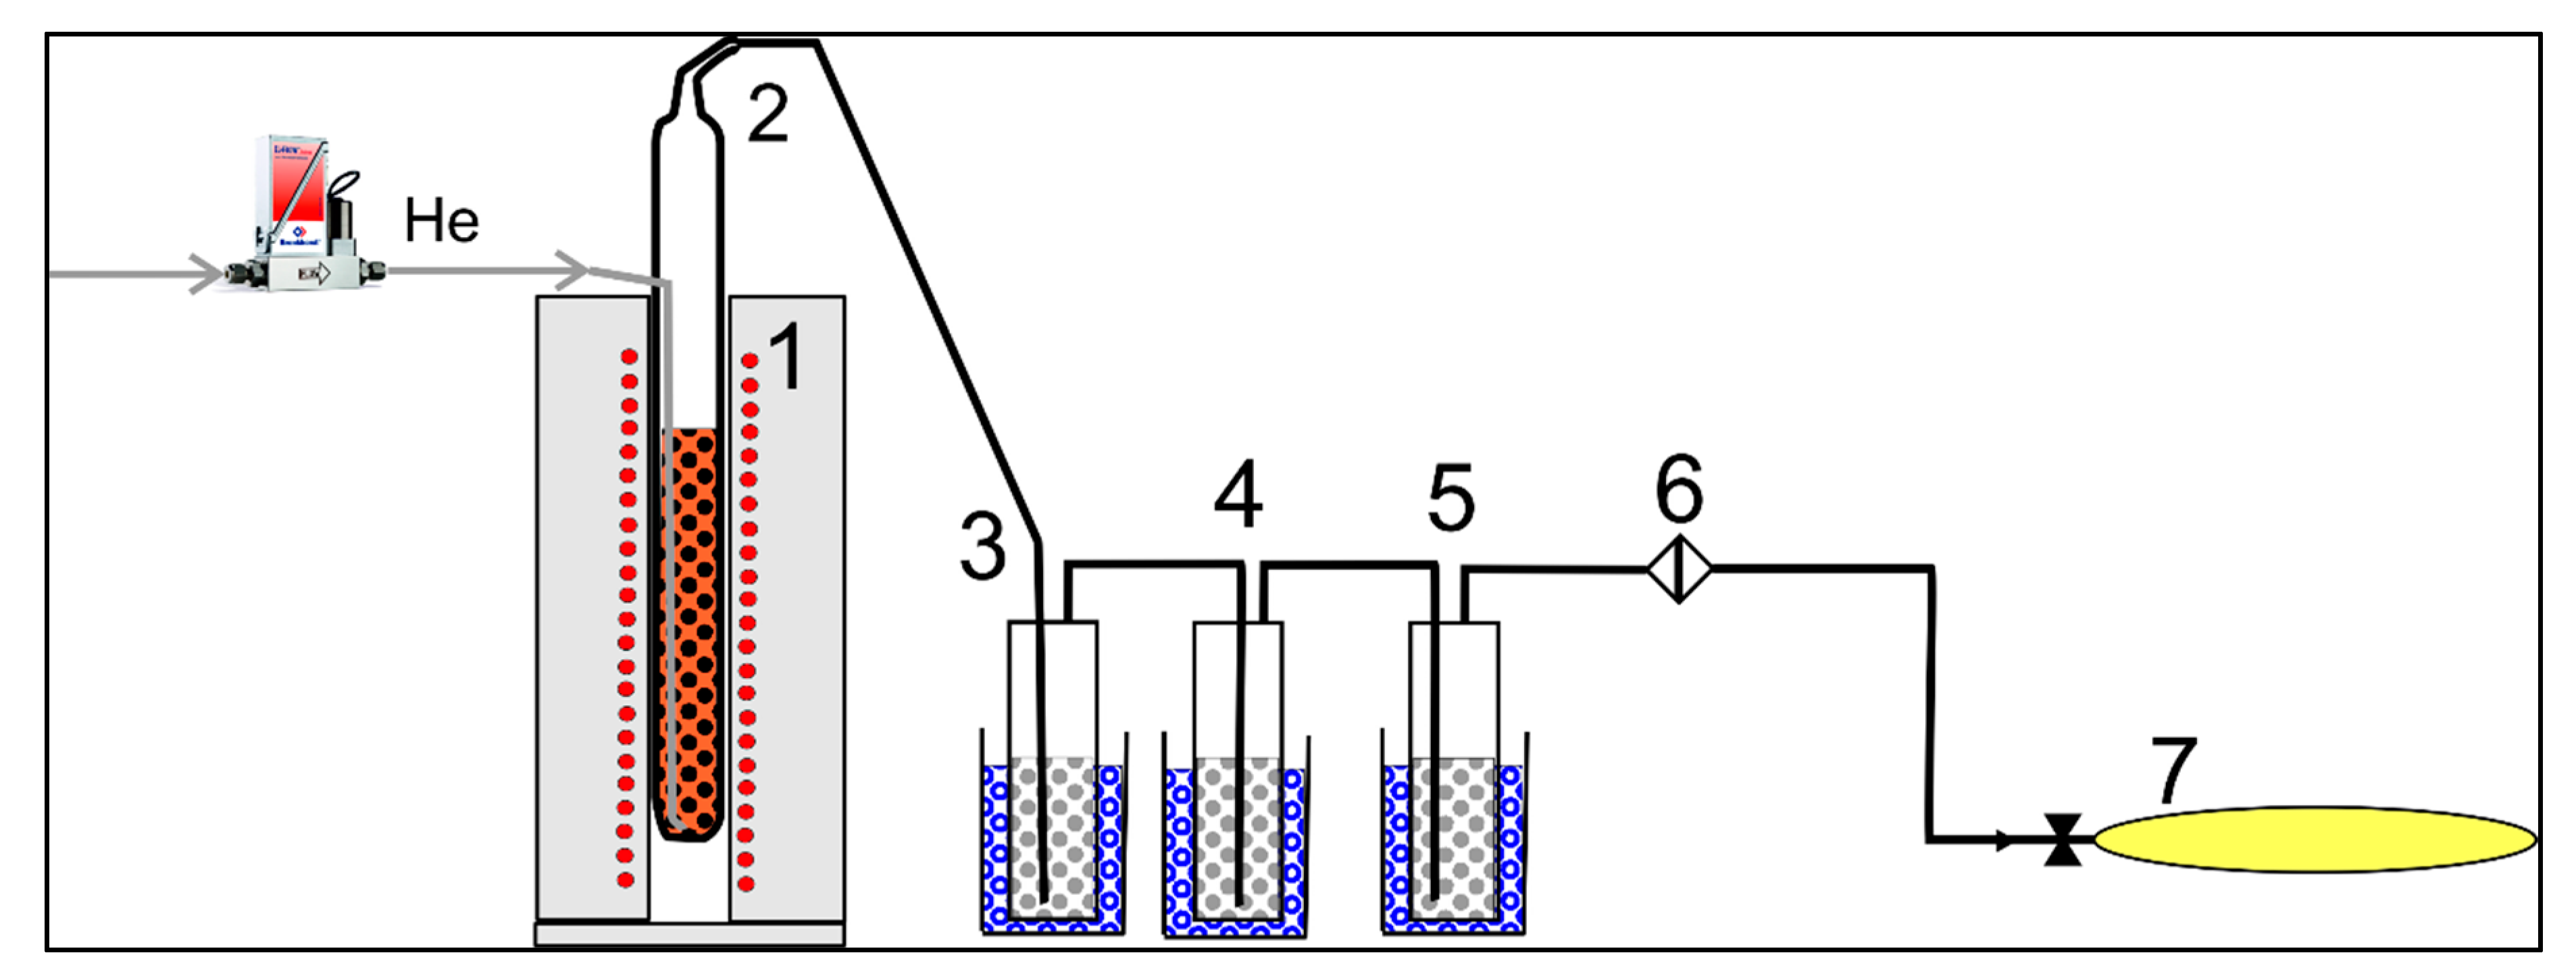
Approximately 100 g of the sludge was pyrolyzed in a quartz fixed-bed reactor (outer diameter 35 mm, length of the reactor 450 mm) at 400, 500, 600, 700, and 800 °C. The pyrolysis experiment began by placing the reactor (no. 2 in Figure 1) into a hot furnace (1) preheated to the intended temperature of pyrolysis. A thermocouple (type K) was placed on the inner wall of the oven. The temperature was automatically regulated, and the initial drop (caused by inserting the cold reactor) was compensated within 15 min, after which the desired temperature was constant until the end of the experiment (2 h).
Primary pyrolytic products (condensable vapors and permanent gases diluted by the carrier gas—helium) flowed through insulated tubing into three ice-bath-cooled impingers (3–5) to collect condensable vapors, then through a porous filter (6). Finally, permanent gases were collected into Tedlar bags (7). The line for sampling vapors and gases was connected by Teflon tubes.
Helium was supplied continuously to the bottom of the reactor at a constant flow rate of 150 mL/min thirty minutes before the placement of the reactor to the oven, within the experiment, and during the cooling of the reactor after the experiment. Helium was used to extract the primary pyrolysis products (gas and condensates) from the reactor without any (chemical) interactions with the products of the pyrolysis and to make balances more accurate, as we observed less accuracy using the nitrogen in prior experiments, which may be a result of sewage sludge being rich in nitrogen and mainly influencing the gas composition and gas mass.
2.3. Yields of Products
Mass (weight) yields of pyrolytic products were calculated according to the following equation
where Yi is the yield of the product in wt. %, mi is the weight of the product in grams, and ms is the weight of the feedstock sludge (including moisture) in grams. The weight of the feedstock sludge was obtained by measuring the weight of the reactor filled with the sludge before the experiment and subtracting the weight of the reactor itself.
The weight of the sludge-char was obtained by measuring the weight of the reactor after the experiment and cooling down the reactor to room temperature, and by subtracting the weight of the reactor itself measured before filling the reactor with the sludge before the experiment. The weight of the condensable vapors was obtained by measuring the weights of the impingers and connecting tubes after the experiment and subtracting the weight of these parts themselves measured before the experiment. The condensate in the first impinger was left still for 24 h, then the water phase was separated by syringe and weighed to obtain the weight of the water liquid fraction. The difference between the weight of condensable vapors and the weight of water liquid fraction is considered to be the weight of the organic condensate fraction. The inaccuracy in measuring the weights of the separate liquid fractions is considered to be insignificant.
The weight and heating value of pyrolysis gas was calculated based on the gas composition and volume in Tedlar bags referenced to 0 °C, 101 kPa, and subtracting the helium volume.
2.3.1. Gas Composition
The gas for analysis of major components was ejected from Tedlar bags by gas-tight syringe and it was injected to gas chromatograph HP 6890 equipped with two analytical channels. The first channel (capillary column, Supelco Al2O3/KCl 50 m × 530 µm × 4 µm; flame-ionization detector) was used for the analysis of hydrocarbons C1—C7. The second channel (packed pre-column, HayeSep Q 0.9 m × 3.2 mm, 80/100 mesh; capillary column 1, HP PLOT Q 30 m × 530 µm × 40 µm; capillary column 2, HP Plot Molsieves 5 A 30 m × 530 µm × 50 µm; thermal conductivity detector) was used for permanent gases analysis. Carrier gas (He) flows, oven temperature program (70 °C (hold 7 min) → 90 °C (rate 10 °C/min) → 200 °C (rate 20 °C/min, hold 7 min)) and valve switching times were experimentally set to optimal values which perform a complete gas analysis in less than 20 minutes. The system is capable of analysis of hydrogen, oxygen (it was not possible to separate oxygen from argon at the given conditions, therefore their sum is expressed as oxygen), nitrogen, carbon dioxide, carbon monoxide, methane, ethane, ethene, acetylene, propane, propene, propyne, butanes, pentanes, hexanes, C4 cyclic and/or unsaturated forms, 1,3-butadiene, 1-buten-3-yne, cyclopentadiene, benzene, toluene.
Gas chromatograph Agilent 7890 A with selective chemiluminescence detector Agilent 355 SCD was used to analyze the concentration of sulfur containing compounds in the gas. The detector employs dual plasma burner, chemiluminescence reaction cell and photomultiplier tube, and ozone generator. The capillary column DB-1 by J&W (30 m × 320 µm × 1 µm) was connected to injector heated to 200 °C. Carrier gas (nitrogen) flow was constant at 1.4 mL/min and the pressures of air and hydrogen in the burner were set to 320 kPa (56 mL/min) and 190 kPa (36 mL/min), respectively. Thermostat temperature program was 35 °C (hold 2 min) → 120 °C (rate 20 °C/min, hold 2 min).
Contents of components were determined by the method of external standard according to Equation (2) and normalization to reference conditions (0 °C, 101 kPa) according to Equation (3). Content of helium in Tedlar bag was subsequently calculated according to Equation (4). Most of the oxygen was measured due to sampling complications and the leaking of air in, therefore the gas composition was corrected to zero oxygen concentration according to Equations (5) and (6)
where:
| Component content in the gas sample; | (%) | |
| Component content in the standard gas; | (%) | |
| Area of the component in the gas sample; | ||
| Area of the component in the standard gas; | ||
| Component content in normalized gas sample; | (%) | |
| Helium content in normalized gas; | (%) | |
| Component content in normalized gas free of He after correction; | (%) | |
| Component content in normalized gas free of He before correction; | (%) | |
| Oxygen content in normalized gas; | (%) | |
| Nitrogen content in normalized gas free of He after correction; | (%) | |
| Nitrogen content in normalized gas free of He before correction. | (%) |
2.3.2. Gas Volume
A defined amount of gas collected to Tedlar bags was used for off-line analysis of gas composition prior to the measurement of gas volume. That amount was added to the total amount of remaining gas in the bag. The volume of gas in Tedlar bag was measured by a simple apparatus consisting of a sampling hose connected to a diaphragm pump. The hose connected the outgas of the pump to the entry of laboratory wet-type drum meter. After connecting all the parts of the apparatus, the gas was pumped from the bag to the drum meter and the volume was normalized to reference 0 °C, 101 kPa and subtracting the helium (carrier gas) according to Equations (7) and (8)
where:
| Normalized gas volume in Tedlar bag; | (dm3) | |
| Reference temperature; | (273.15 K) | |
| Barometric pressure in the environment of measurement; | (kPa) | |
| Correction factor for the drum meter – 1 (experimentally estimated); | (-) | |
| Water vapor pressure at the gas meter temperature; | (kPa) | |
| Gas volume at the conditions of measurement (T, p); | (dm3) | |
| Gas temperature during measurement; | (K) | |
| Reference pressure; | (101 kPa) | |
| Normalized volume (TN, pN) of gas free of helium; | (dm3) | |
| Helium content in normalized gas. | (%) |
2.4. Proximate and Ultimate Analyses, Heating Values
The moisture content (W) of the sludge was determined according to the Czech/European standard ČSN EN 15,414–3, the ash content (A) of the sludge was determined according to the standard ČSN EN 15,403 and the volatile content (V) was determined according to ČSN EN 15,402.
The ultimate analysis of the sludge and condensates (both water and organic fraction) was performed in a Flash EA 1112 device in the CHNS/O configuration, where the content of C, H, N, S was measured by an analysis of the gaseous products from combustion by oxygen (CO2, H2O, N2 and SO2) using a thermal conductivity detector. Besides, the total sulfur content was determined according to the Czech/International standard ČSN ISO 351.
Higher heating value (HHV) of the sludge and condensates were determined according to ČSN EN 15,400 utilizing the calorimeter IKA C 200 (IKA-Werke GmbH & Co).
3. Results and Discussion
3.1. Mass and Energy Balance
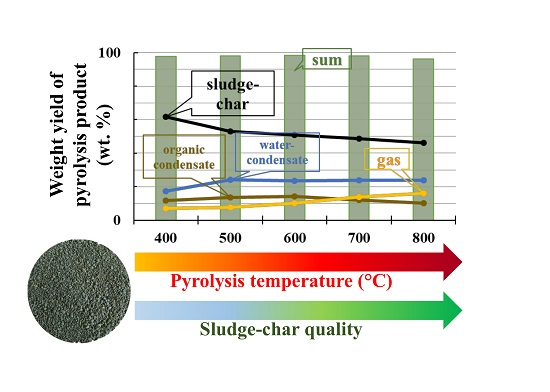
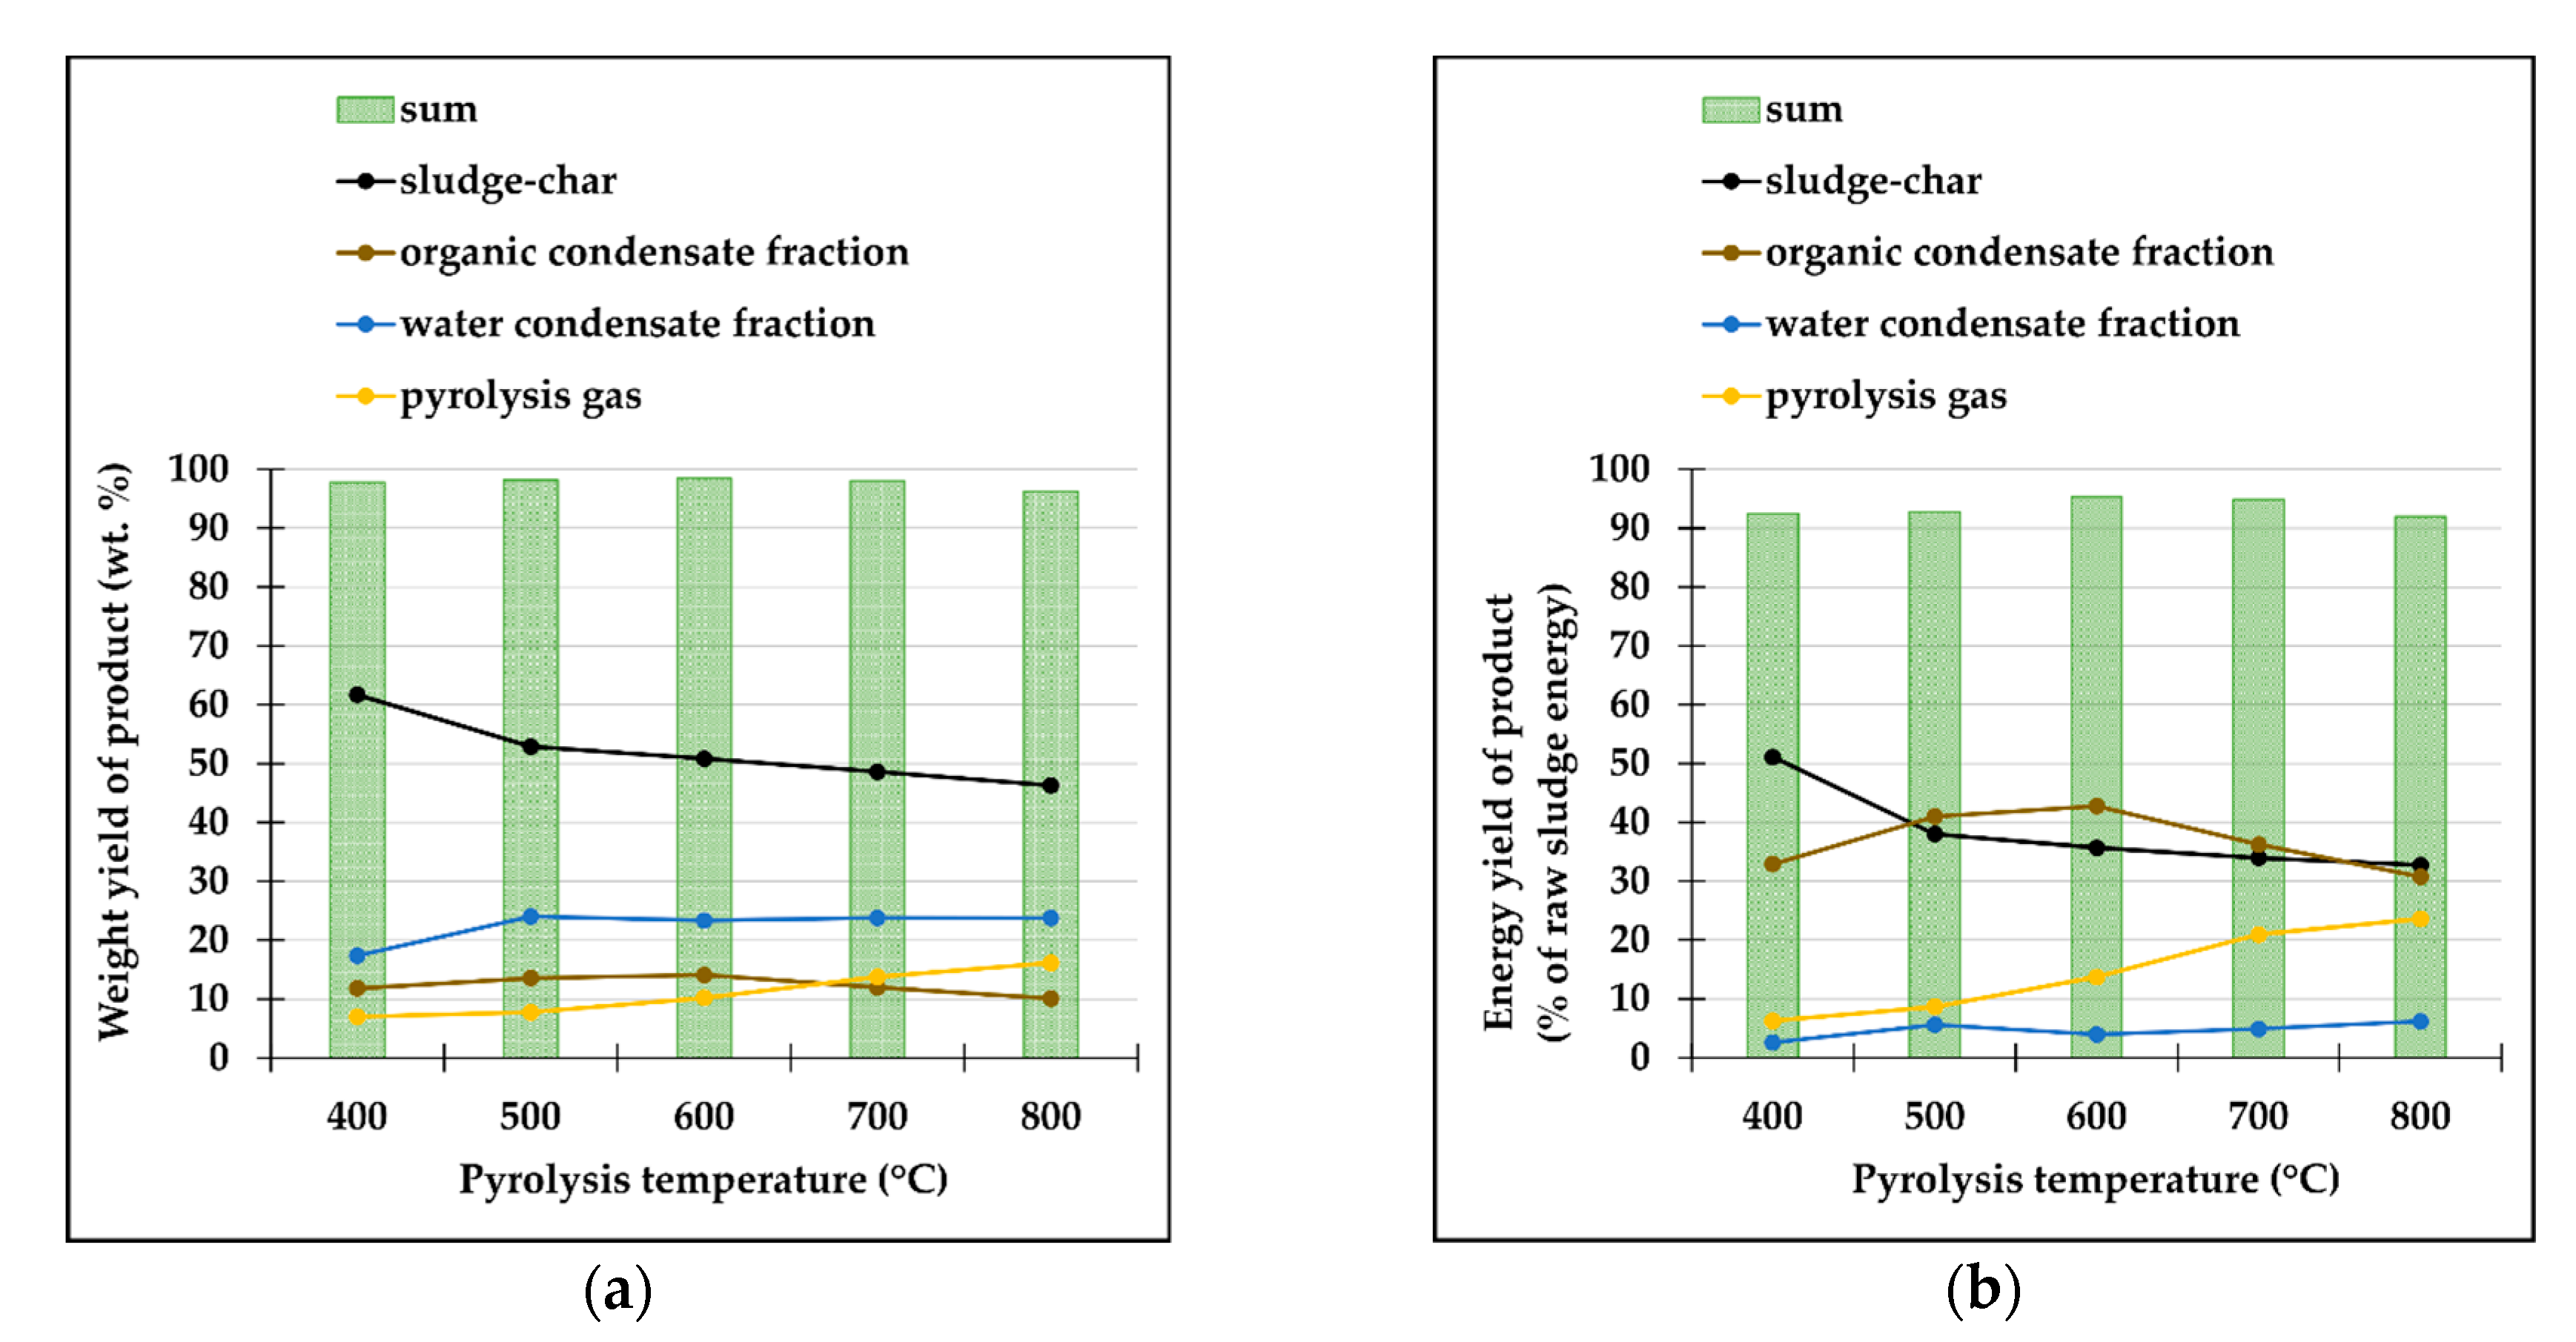
Mass and energy balances are principal characteristics that provide an overview of the process quality and process products distribution. As expected, the increase in pyrolysis temperature resulted in a decrease in the sludge-char yield (Figure 2a) due to the release of more thermally stable matter. Consequently, the release of volatile matter resulted in an increase in the mass (Figure 2a) and energy (Figure 2b) yield of the pyrolysis gas. The yield of organic condensate fraction increased up to 600 °C, then it decreased. The water condensate fraction yield was relatively constant. As a result, when pyrolysis was performed at ≥ 500 °C, ≥ 50 % of the energy of the sludge was recovered in the condensate and gas, which may be used to cover a substantial part of the pyrolysis energy demand. The increase in the pyrolysis temperature up to 500 °C most notably influences the sludge-char yield as the relatively great portion of labile organic fraction is released. Compared to other biomass materials, the sludge-char yield is greater due to high ash content of the sludge which forms most of the sludge-char; 68–81 wt. % after pyrolysis at 400–800 °C. A further increase over 600 °C most notably influences the pyrolysis gas energy yield (Figure 2b), which is computed from its composition and mass yield. Similar results and trends were also found in the literature for the fixed bed [17] and continuous [4,5] sewage sludge pyrolysis processes.
3.2. Gas Composition
The complex composition of pyrolysis gases, their production volumes and heating values are displayed in Table 2. The main sludge pyrolysis gas components are CO2, CO, H2, and CH4 with their sum being almost 90 vol. %. The rest of the pyrolysis gases are composed of hydrocarbons, nitrogen, and other minor compounds.
The carbon dioxide content decreased sharply when the pyrolysis temperature rose from 400 to 800 °C. On the other hand, the contents of carbon monoxide and hydrogen increased significantly with the increase in temperature within this range. Methane increased first and decreased slightly at temperatures over 600 °C. These findings are, to a large extent, in agreement with the other literature results [4,5,7,13,18].
Tomasi Morgano et al. [4] consider CO2 in the gas as a primary pyrolytic product [19] and CO as a product of cracking reactions of oxygenated compounds, whereas Fan et al. [13] attribute the formation of both CO and CO2 to the decomposition of oxygenated groups, such as decarboxylation and decarbonylation reactions. Both pathways are probably responsible for the presence of CO2. Moreover, the presence of CO2 results in a steeper increase in the CO content at temperatures above 600 °C due to the Boudouard reaction [16,20] which may as well be partially catalyzed by the ash components of sludge-chars formed during pyrolysis.
The hydrogen content of the gas increased sharply when the process temperature increased from 400 to 600 °C and then the increase continued slightly up to 800 °C. Sun et al. [18] found that the hydrogen content even decreased when pyrolysis temperature exceeded 600 °C, which is mainly attributed to the inhibitory effect of the reverse water–gas shift reaction when hydrogen reacts with carbon dioxide, and carbon monoxide and steam are formed.
Apart from the major gas components, other hydrocarbons are present in pyrolysis gases with their sum being up to 9 vol. % of the pyrolysis gas. It is clear (see Table 2) that the content of the saturated hydrocarbons such as ethane, propane, butanes, pentanes and hexanes decreased with increasing pyrolysis temperature. On the other hand, we may observe the increase in the content of unsaturated hydrocarbons, preferably having double covalent bonds between adjacent carbon atoms, such as ethylene, propene, buta-1,3-diene. That suggests ongoing elimination reactions where hydrogen atoms are released to form hydrogen or water molecules. Nevertheless, their direct release from the sludge organic matter, which is very complex compared to conventional biomass sources, at higher temperatures, cannot be ruled out. It must as well be noted that there was a significant decline in the content of hydrocarbons (methane—C6) when pyrolysis temperature increased from 700 to 800 °C, which is responsible for the decline in the heating value of the pyrolysis gas.
In addition to the above-mentioned gas compounds, a remarkable amount of nitrogen was analyzed in the pyrolysis gases when the process temperature exceeded 500 °C, and its content increased with further increases in the temperature. The primary gaseous nitrogen species present in the devolatilized pyrolysis gas are NH3 (ammonia) and HCN (hydrogen cyanide) [21,22], however, some small amount of molecular nitrogen (N2) is present in the gas as well [23]. The increasing content of N2 is most likely the result of the enhanced decomposition of NH3 (and HCN) at higher temperatures catalyzed by metal oxides [24] present in the ash of the sludge, and of the enhanced conversion of NH3 and HCN by oxygen-mediated pathways at high temperatures [23].
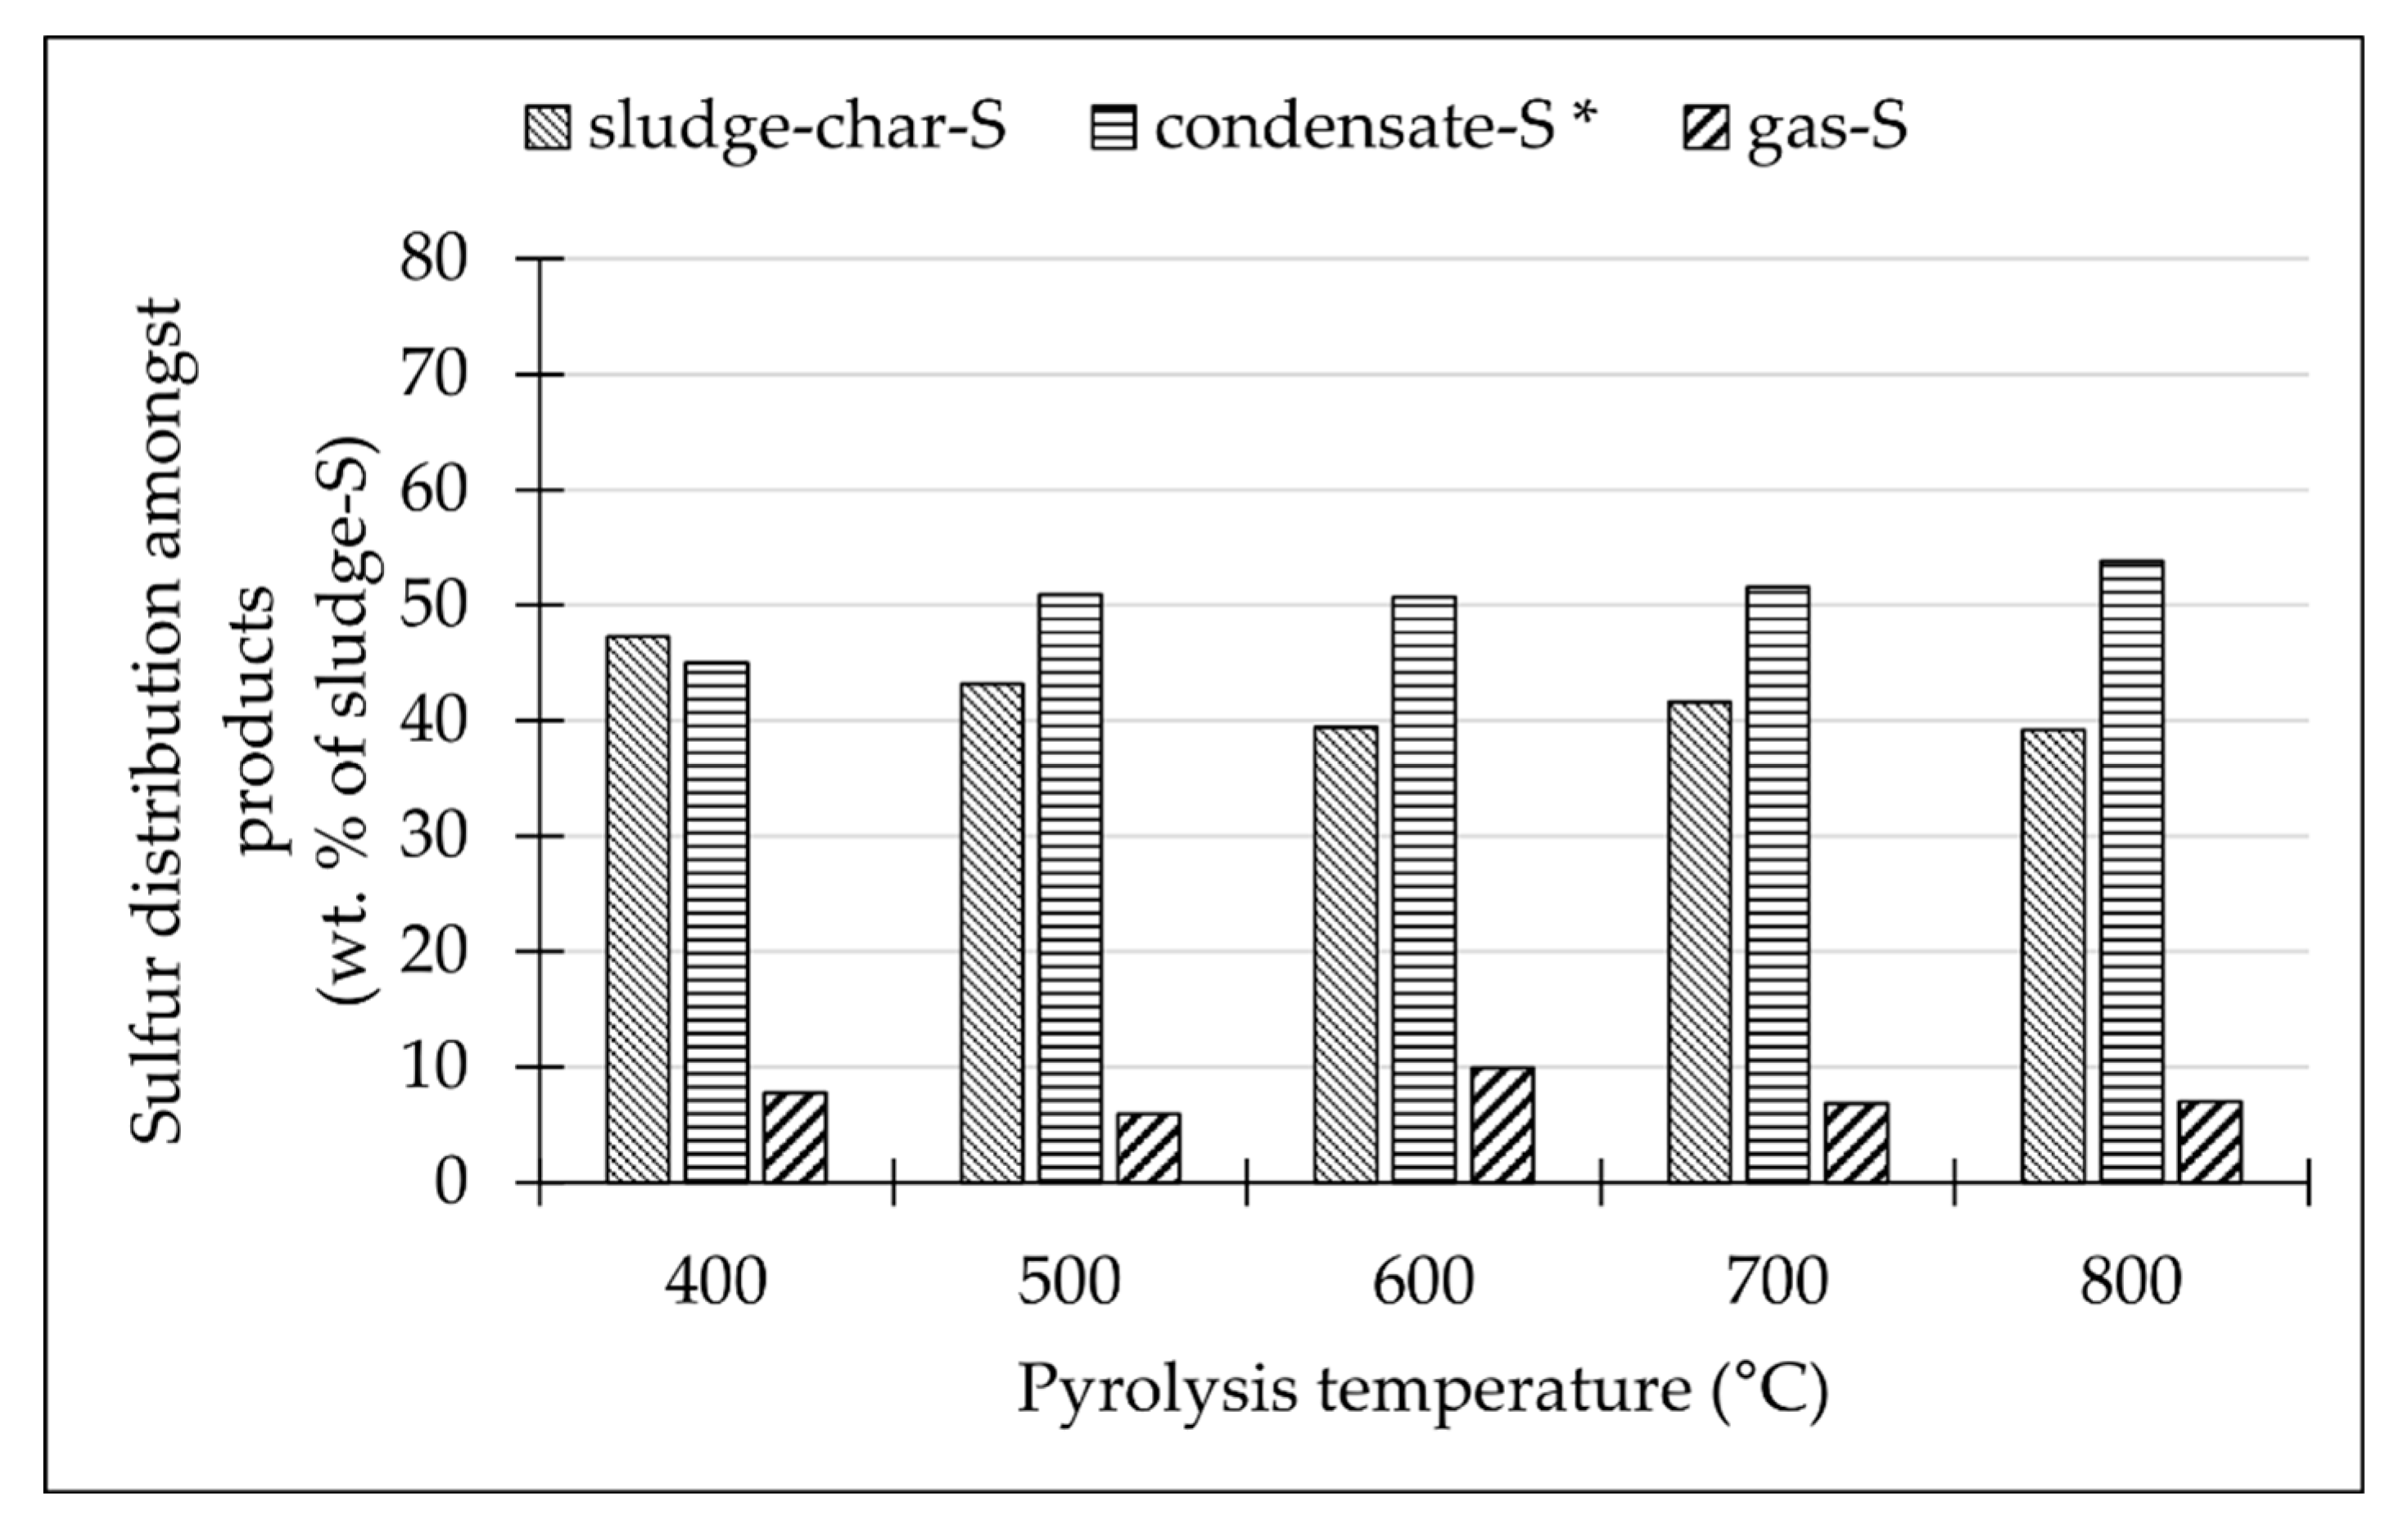
Sulfur is the other element of concern in the gas, mainly due to its oxidation to SO2 during the combustion process. The main sulfur species analyzed in the gas were H2S (hydrogen sulfide), COS (carbonyl sulfide) and CH3SH (methanethiol) (Table 3). Despite a slight increase in their content at a pyrolysis temperature of 600 °C, we may conclude that their content in the gas generally decreases when the pyrolysis temperature increases. Combined with the sulfur content in other pyrolysis products, we observed that the sulfur balance and distribution among pyrolysis products (Figure 3) is relatively independent of any pyrolysis temperature above 500 °C [25]. Therefore, the decreasing sulfur content is the result of its dilution in the increased gas volume as the S-species are mostly released from the sludge to the gas phase up to pyrolysis temperatures of 400–500 °C [26,27]. Zhang et al. [26] observed an increase in S conversion to the gas phase during conventional demineralized sludge pyrolysis. However, when using CaO as the conditioner, the increase was only minimal. Therefore, the nature of the sludge (high ash and alkali metals content) must be considered, since the presence of alkali metals may help to preserve S in the sludge-char, preventing S release into gaseous phase and its oxidation into SO2 when burning the gas and condensate [28,29].
3.3. Condensate Composition
The vast majority of condensate (liquid pyrolysis product) was collected in the first impinger, and only that part was used for further analysis. The condensate was divided into two immiscible parts: the organic fraction (oil) and an inorganic fraction (water fraction containing some hydrosoluble compounds responsible for its partial HHV (Figure 2b)) which were analyzed individually after their separation.
Bio-oils from the sludge pyrolysis have been widely analyzed to obtain their overall composition and other properties [5,12,13,18,30,31]. Monoaromatics, steroids and aliphatic, oxygenated and nitrogenated compounds [13] contained in bio-oil can be divided into three groups according to their molecular weight: light, medium, and high [12]. The increase in pyrolysis temperature and heating rate then results in a higher content of light compounds due to more intense cracking of compounds with higher molecular weight. We studied the elemental composition and heating value of both fractions of condensate (Table 4 and Table 5) which is relevant in case of the combustion to obtain energy for pyrolysis is the primary end-point of the condensate. There was an initial change in the composition of condensate when the pyrolysis temperature increased from 400 to 500 °C, resulting from the decomposition of sludge organic matter, followed by steeper sludge-char yield decrease. In contrast, a further increase in the temperature had an insignificant effect on the elemental composition of the condensate and its heating value, as the sludge organic matter was converted to gas rather than condensate, followed by decrease in condensate yield as the higher temperature promotes decomposition of primary pyrolysis products resulting in the “non-changing” composition, as neither diluting nor concentrating occur.
4. Conclusions
Pyrolysis is a promising way to treat sewage sludge with the advantages of a significant reduction of the mass and volume of the sludge and producing solid residue (sludge-char) that may be used in agriculture to promote soil properties or for water and air cleaning processes. Gas and condensate (oil and water) are also produced, which may be energetically used to provide the heat for the sludge drying and/or pyrolysis process itself. We studied the effect of the pyrolysis temperature on the composition of pyrolytic gas and the composition of condensate, which is important with regards to the design of the burner and the flue gas cleaning system. Increasing the pyrolysis temperature resulted in an increase in CO, H2 and N2 content of the gas and in a decrease in the CO2 and sulfur containing compounds content of the gas. The hydrocarbons (excluding methane) content of the gas was in the range of 7.6–9.0 vol. %. Regarding the energy bound in the sludge, it was observed that pyrolysis at ≥500 °C resulted in the transformation of 50 and more % of the energy into pyrolytic gas and condensate, which may offer an advantage in providing sufficient heat for the sludge drying and/or pyrolysis. With regards to the energy utilization of the sludge pyrolysis system with the aim of producing safe sludge-char, operating the pyrolysis of sewage sludge at 600–700 °C is proposed.
Author Contributions
Conceptualization, M.P.; methodology, S.S. and Z.B.; validation, J.M., M.P., S.S. and Z.B.; formal analysis, J.M., S.S. and Z.B.; investigation, J.M., S.S. and Z.B.; resources, M.P., S.S. and Z.B.; writing—original draft preparation, J.M.; writing—review and editing, M.P. and M.J.; visualization, J.M. and M.J.; supervision, M.P.; project administration, M.P.; funding acquisition, M.P. All authors have read and agreed to the published version of the manuscript.
Funding
Financial support from the Ministry of Agriculture of the Czech Republic—project QK1820175, AV 21—Efficient energy transformation and storage, and from the grant of Specific university research—grant No A1_FTOP_2020_001.
Conflicts of Interest
The authors declare no conflict of interest.
References
- Population and Rates of Growth in Urban Areas and Capital Cities. Available online: https://data.un.org/_Docs/SYB/PDFs/SYB61_253_Population%20Growth%20Rates%20in%20Urban%20areas%20and%20Capital%20cities.pdf (accessed on 16 June 2020).
- Moško, J.; Pohořelý, M.; Zach, B.; Svoboda, K.; Durda, T.; Jeremiáš, M.; Šyc, M.; Václavková, Š.; Skoblia, S.; Beňo, Z.; et al. Fluidized Bed Incineration of Sewage Sludge in O2/N2 and O2/CO2 Atmospheres. Energy Fuels 2018, 32, 2355–2365. [Google Scholar] [CrossRef]
- Faria, W.M.; Figueiredo, C.C.D.; Coser, T.R.; Vale, A.T.; Schneider, B.G. Is Sewage Sludge Biochar Capable of Replacing Inorganic Fertilizers for Corn Production? Evidence from a Two-Year Field Experiment. Arch. Agron. Soil Sci. 2017, 64, 505–519. [Google Scholar] [CrossRef]
- Tomasi Morgano, M.; Leibold, H.; Richter, F.; Stapf, D.; Seifert, H. Screw Pyrolysis Technology for Sewage Sludge Treatment. Waste Manag. 2018, 73, 487–495. [Google Scholar] [CrossRef] [PubMed]
- Jaramillo-Arango, A.; Fonts, I.; Chejne, F.; Arauzo, J. Product Compositions from Sewage Sludge Pyrolysis in a Fluidized Bed and Correlations with Temperature. J. Anal. Appl. Pyrolysis 2016, 121, 287–296. [Google Scholar] [CrossRef]
- Hossain, M.K.; Strezov, V.; Chan, K.Y.; Ziolkowski, A.; Nelson, P.F. Influence of Pyrolysis Temperature on Production and Nutrient Properties of Wastewater Sludge Biochar. J. Environ. Manag. 2011, 92, 223–228. [Google Scholar] [CrossRef]
- Gao, N.B.; Quan, C.; Liu, B.L.; Li, Z.Y.; Wu, C.F.; Li, A.M. Continuous Pyrolysis of Sewage Sludge in a Screw-Feeding Reactor: Products Characterization and Ecological Risk Assessment of Heavy Metals. Energy Fuels 2017, 31, 5063–5072. [Google Scholar] [CrossRef]
- Smith, K.M.; Fowler, G.D.; Pullket, S.; Graham, N.J. Sewage Sludge-Based Adsorbents: A Review of Their Production, Properties and Use in Water Treatment Applications. Water Res. 2009, 43, 2569–2594. [Google Scholar]
- Sousa, A.A.T.C.; Figueiredo, C.C. Sewage Sludge Biochar: Effects on Soil Fertility and Growth of Radish. Biol. Agric. Hortic. 2015, 32, 127–138. [Google Scholar] [CrossRef]
- Domínguez, A.; Menendez, J.A.; Inguanzo, M.; Pis, J.J. Production of Bio-Fuels by High Temperature Pyrolysis of Sewage Sludge Using Conventional and Microwave Heating. Bioresour. Technol. 2006, 97, 1185–1193. [Google Scholar] [CrossRef]
- Karaca, C.; Sözen, S.; Orhon, D.; Okutan, H. High Temperature Pyrolysis of Sewage Sludge as a Sustainable Process for Energy Recovery. Waste Manag. 2018, 78, 217–226. [Google Scholar] [CrossRef]
- Inguanzo, M.; Dominguez, A.; Menendez, J.A.; Blanco, C.G.; Pis, J.J. On the Pyrolysis of Sewage Sludge: The Influence of Pyrolysis Conditions on Solid, Liquid and Gas Fractions. J. Anal. Appl. Pyrolysis 2002, 63, 209–222. [Google Scholar] [CrossRef]
- Fan, H.J.; Zhou, H.; Wang, J. Pyrolysis of Municipal Sewage Sludges in a Slowly Heating and Gas Sweeping Fixed-Bed Reactor. Energy Convers. Manag. 2014, 88, 1151–1158. [Google Scholar] [CrossRef]
- Gao, N.; Kamran, K.; Quan, C.; Williams, P.T. Thermochemical Conversion of Sewage Sludge: A Critical Review. Prog. Energy Combust. Sci. 2020, 79, 100843. [Google Scholar] [CrossRef]
- Liu, S.; Wei, M.M.; Qiao, Y.; Yang, Z.L.; Gui, B.; Yu, Y.; Xu, M.H. Release of Organic Sulfur as Sulfur-Containing Gases During Low Temperature Pyrolysis of Sewage Sludge. Proc. Combust. Inst. 2015, 35, 2767–2775. [Google Scholar] [CrossRef]
- Ledakowicz, S.; Stolarek, P.; Malinowski, A.; Lepez, O. Thermochemical Treatment of Sewage Sludge by Integration of Drying and Pyrolysis/Autogasification. Renew. Sustain. Energy Rev. 2019, 104, 319–327. [Google Scholar] [CrossRef]
- Yuan, H.R.; Lu, T.; Huang, H.Y.; Zhao, D.D.; Kobayashi, N.; Chen, Y. Influence of Pyrolysis Temperature on Physical and Chemical Properties of Biochar Made from Sewage Sludge. J. Anal. Appl. Pyrolysis 2015, 112, 284–289. [Google Scholar] [CrossRef]
- Sun, Y.; Jin, B.S.; Huang, Y.J.; Zuo, W.; Jia, J.Q.; Wang, Y.Y. Distribution and Characteristics of Products from Pyrolysis of Sewage Sludge. Adv. Mater. Res. 2013, 726–731, 2885–2893. [Google Scholar] [CrossRef]
- Anca-Couce, A.; Mehrabian, R.; Scharler, R.; Obernberger, I. Kinetic Scheme of Biomass Pyrolysis Considering Secondary Charring Reactions. Energy Convers. Manag. 2014, 87, 687–696. [Google Scholar] [CrossRef]
- Nowicki, L.; Ledakowicz, S. Comprehensive Characterization of Thermal Decomposition of Sewage Sludge by TG–MS. J. Anal. Appl. Pyrolysis 2014, 110, 220–228. [Google Scholar] [CrossRef]
- Werther, J.; Ogada, T. Sewage Sludge Combustion. Prog. Energy Combust. Sci. 1999, 25, 55–116. [Google Scholar] [CrossRef]
- Zheng, A.; Li, L.; Tippayawong, N.; Huang, Z.; Zhao, K.; Wei, G.; Zhao, Z.; Li, H. Reducing Emission of NOx and SOx Precursors while Enhancing Char Production from Pyrolysis of Sewage Sludge by Torrefaction Pretreatment. Energy 2020, 192, 116620. [Google Scholar] [CrossRef]
- Broer, K.M.; Brown, R.C. Effect of Equivalence Ratio on Partitioning of Nitrogen during Biomass Gasification. Energy Fuels 2015, 30, 407–413. [Google Scholar] [CrossRef]
- Abelha, P.; Gulyurtlu, I.; Cabrita, I. Release of Nitrogen Precursors from Coal and Biomass Residues in a Bubbling Fluidized Bed. Energy Fuels 2008, 22, 363–371. [Google Scholar] [CrossRef]
- Moško, J.; Pohořelý, M.; Skoblia, S.; Beňo, Z.; Bičáková, O.; Václavková, Š.; Šyc, M.; Svoboda, K. Batch Reactor Pyrolysis of Stabilized Sewage Sludge: Product Analysis and Sulphur Balance. WIT Trans. Ecol. Environ. 2019, 231, 357–365. [Google Scholar]
- Zhang, J.; Zuo, W.; Tian, Y.; Chen, L.; Yin, L.; Zhang, J. Sulfur Transformation during Microwave and Conventional Pyrolysis of Sewage Sludge. Environ. Sci. Technol. 2017, 51, 709–717. [Google Scholar] [CrossRef]
- Saleh, S.B.; Flensborg, J.P.; Shoulaifar, T.K.; Sarossy, Z.; Hansen, B.B.; Egsgaard, H.; DeMartini, N.; Jensen, P.A.; Glarborg, P.; Dam-Johansen, K. Release of Chlorine and Sulfur during Biomass Torrefaction and Pyrolysis. Energy Fuels 2014, 28, 3738–3746. [Google Scholar] [CrossRef]
- Cheng, S.; Qiao, Y.; Huang, J.C.; Cao, L.W.; Yang, H.Z.; Liu, H.; Yu, Y.; Xu, M.H. Effect of Alkali Addition on Sulfur Transformation during Low Temperature Pyrolysis of Sewage Sludge. Proc. Combust. Inst. 2017, 36, 2253–2261. [Google Scholar] [CrossRef]
- Liu, H.; Zhang, Q.; Hu, H.Y.; Xiao, R.X.; Li, A.J.; Qiao, Y.; Yao, H.; Naruse, I. Dual Role of Conditioner CaO in Product Distributions and Sulfur Transformation during Sewage Sludge Pyrolysis. Fuel 2014, 134, 514–520. [Google Scholar] [CrossRef]
- Chen, H.; Zhai, Y.; Xu, B.; Xiang, B.; Zhu, L.; Qiu, L.; Liu, X.; Li, C.; Zeng, G. Characterization of Bio-Oil and Biochar from High-Temperature Pyrolysis of Sewage Sludge. Environ. Technol. 2015, 36, 470–478. [Google Scholar] [CrossRef]
- Trinh, T.N.; Jensen, P.A.; Dam-Johansen, K.; Knudsen, N.O.; Sorensen, H.R. Influence of the Pyrolysis Temperature on Sewage Sludge Product Distribution, Bio-Oil, and Char Properties. Energy Fuels 2013, 27, 1419–1427. [Google Scholar] [CrossRef]
Figure 1.
Scheme of the pyrolysis apparatus: 1—oven, 2—quartz reactor, 3—5 ice-water-cooled impingers, 6—porous filter, 7—Tedlar bag.
Figure 1.
Scheme of the pyrolysis apparatus: 1—oven, 2—quartz reactor, 3—5 ice-water-cooled impingers, 6—porous filter, 7—Tedlar bag.

Figure 2.
(a) Mass balance of the sludge pyrolysis at temperatures from 400 to 800 °C (b) Energy balance of the sludge pyrolysis at temperatures from 400 to 800 °C.
Figure 2.
(a) Mass balance of the sludge pyrolysis at temperatures from 400 to 800 °C (b) Energy balance of the sludge pyrolysis at temperatures from 400 to 800 °C.

Figure 3.
Sulfur distribution amongst sludge pyrolysis products (*—determined by difference), Adapted from Moško et al. [25].
Figure 3.
Sulfur distribution amongst sludge pyrolysis products (*—determined by difference), Adapted from Moško et al. [25].


Table 1.
Physical and chemical properties of sewage sludge.
| W 1 | A 2 | V 2 | C 2 | H 2 | N 2 | S 2 | HHV 2 |
|---|---|---|---|---|---|---|---|
| wt. % | wt. % | MJ/kg | |||||
| 9.77 ± 0.15 | 43.3 ± 0.22 | 49.2 ± 1.03 | 28.8 ± 0.14 | 4.20 ± 0.04 | 4.22 ± 0.03 | 1.10 ± 0.03 | 12.7 ± 0.21 |
1—average value from all experiments 2—in dry matter; W—water (moisture) content, A—Ash content, V—Volatiles content, HHV—Higher Heating Value.
Table 2.
Production, composition, and heating values of pyrolysis gases from sewage sludge pyrolysis. Main gaseous compounds were measured with 1% relative error, while trace components were measured with 4% relative error.
Table 2.
Production, composition, and heating values of pyrolysis gases from sewage sludge pyrolysis. Main gaseous compounds were measured with 1% relative error, while trace components were measured with 4% relative error.
| Pyrolysis Temperature | °C | 400 | 500 | 600 | 700 | 800 |
|---|---|---|---|---|---|---|
| Gas Production | m3/tsludge | 42.3 | 55.7 | 82.3 | 119 | 149 |
| Gas Composition (vol. %) | ||||||
| CO2 | 62.3 | 49.5 | 38.1 | 29.1 | 23.6 | |
| H2 | 10.0 | 20.6 | 25.3 | 26.5 | 27.9 | |
| CO | 8.24 | 8.59 | 12.6 | 18.4 | 24.5 | |
| CH4 | 7.81 | 11.2 | 12.7 | 12.2 | 10.7 | |
| N2 | 0.0930 | 0.0424 | 1.62 | 3.61 | 5.00 | |
| ethane | 2.14 | 2.33 | 2.09 | 1.87 | 1.46 | |
| ethylene | 1.13 | 1.34 | 1.52 | 2.53 | 2.59 | |
| acetylene | <0.01 | <0.01 | <0.01 | 0.0328 | 0.0535 | |
| propane | 1.38 | 1.15 | 0.953 | 0.682 | 0.490 | |
| propene | 1.18 | 1.23 | 1.31 | 1.80 | 1.57 | |
| propyne | 0.147 | 0.108 | 0.111 | 0.096 | 0.067 | |
| butanes | 0.574 | 0.411 | 0.194 | 0.204 | 0.147 | |
| pentanes | 0.180 | 0.171 | 0.131 | 0.0742 | 0.0506 | |
| hexanes | 0.0722 | 0.0502 | 0.0417 | 0.0246 | 0.0155 | |
| C4 (=) | 1.20 | 0.975 | 0.922 | 0.900 | 0.697 | |
| buta-1,3-diene | 0.0406 | 0.0597 | 0.111 | 0.267 | 0.262 | |
| but-1-ene-3-yne | 0.0469 | 0.0484 | 0.0674 | 0.0320 | 0.0232 | |
| cyklopentadiene | 0.0936 | 0.0643 | 0.114 | 0.174 | 0.136 | |
| benzene | 0.221 | 0.118 | 0.0854 | 0.142 | 0.0391 | |
| toluene | 0.528 | 0.236 | 0.237 | 0.185 | 0.0223 | |
| others (FID) | 2.70 | 1.81 | 1.86 | 1.21 | 0.73 | |
| HHV (MJ/m3) | 17.0 | 17.8 | 19.1 | 20.1 | 18.2 | |
Table 3.
Sulfur-containing compounds of pyrolysis gas depending on pyrolysis temperature, Adapted from Moško et al. [25].
Table 3.
Sulfur-containing compounds of pyrolysis gas depending on pyrolysis temperature, Adapted from Moško et al. [25].
| Pyrolysis Temperature (°C) | |||||
|---|---|---|---|---|---|
| 400 | 500 | 600 | 700 | 800 | |
| S Containing Gases (gS/m3) | |||||
| H2S | 6.85 | 4.32 | 5.30 | 2.49 | 2.11 |
| COS | 1.89 | 1.14 | 1.24 | 0.761 | 0.654 |
| MeSH | 6.65 | 3.68 | 4.19 | 1.79 | 1.56 |
| CS2 | 0.277 | 0.190 | 0.146 | 0.0919 | 0.0717 |
| others | 2.57 | 1.20 | 1.03 | 0.570 | 0.289 |
| sum | 18.2 | 10.5 | 11.9 | 5.70 | 4.69 |
Table 4.
Ultimate analysis and heating value of the organic condensate fractions.
| Pyrolysis Temperature | C | H | N | S | O * | HHV |
|---|---|---|---|---|---|---|
| °C | wt. % | MJ/kg | ||||
| 400 | 66.9 | 10.3 | 6.48 | 1.23 | 15.1 | 32.0 |
| 500 | 71.2 | 9.86 | 7.23 | 0.694 | 11.0 | 34.7 |
| 600 | 71.4 | 9.85 | 7.08 | 0.629 | 11.1 | 34.8 |
| 700 | 71.9 | 9.35 | 7.74 | 0.804 | 10.2 | 34.7 |
| 800 | 71.7 | 9.21 | 7.48 | 1.10 | 10.5 | 34.9 |
* by difference O = 100-C-H-N-S.
Table 5.
Ultimate analysis and heating value of water condensate fractions.
| Pyrolysis Temperature | C | H | N | S | O * | HHV |
|---|---|---|---|---|---|---|
| °C | wt. % | MJ/kg | ||||
| 400 | 8.27 | 9.70 | 4.44 | 0.161 | 77.4 | 1.7 |
| 500 | 9.9 | 9.68 | 5.16 | 0.239 | 75.0 | 2.7 |
| 600 | 10.0 | 9.30 | 5.48 | 0.227 | 75.0 | 1.9 |
| 700 | 9.3 | 9.48 | 5.43 | 0.293 | 75.5 | 2.3 |
| 800 | 9.7 | 9.44 | 5.71 | 0.283 | 74.9 | 3.0 |
* by difference O = 100-C-H-N-S.
© 2020 by the authors. Licensee MDPI, Basel, Switzerland. This article is an open access article distributed under the terms and conditions of the Creative Commons Attribution (CC BY) license (http://creativecommons.org/licenses/by/4.0/).
Share and Cite
MDPI and ACS Style
Moško, J.; Pohořelý, M.; Skoblia, S.; Beňo, Z.; Jeremiáš, M. Detailed Analysis of Sewage Sludge Pyrolysis Gas: Effect of Pyrolysis Temperature. Energies 2020, 13, 4087. https://doi.org/10.3390/en13164087
AMA Style
Moško J, Pohořelý M, Skoblia S, Beňo Z, Jeremiáš M. Detailed Analysis of Sewage Sludge Pyrolysis Gas: Effect of Pyrolysis Temperature. Energies. 2020; 13(16):4087. https://doi.org/10.3390/en13164087
Chicago/Turabian StyleMoško, Jaroslav, Michael Pohořelý, Siarhei Skoblia, Zdeněk Beňo, and Michal Jeremiáš. 2020. "Detailed Analysis of Sewage Sludge Pyrolysis Gas: Effect of Pyrolysis Temperature" Energies 13, no. 16: 4087. https://doi.org/10.3390/en13164087
Note that from the first issue of 2016, this journal uses article numbers instead of page numbers. See further details here.