Article

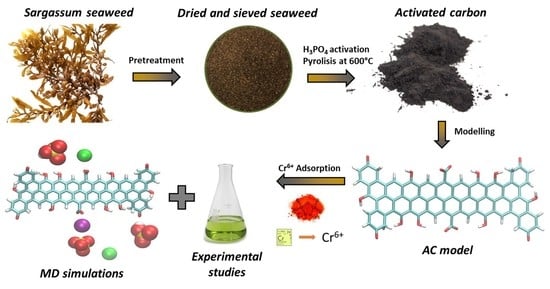
Adsorption of Hexavalent Chromium Using Activated Carbon Produced from Sargassum ssp.: Comparison between Lab Experiments and Molecular Dynamics Simulations

1
Laboratoire COVACHIM-M2E, EA 3592, Campus de Fouillole, Université des Antilles, 97157 Pointe à Pitre, France
2
NBC SARL Company, 8, Rue Saint Cyr, Résidence Océane—Apt no. 5, 97300 Cayenne, France
3
Laboratory of Structural Biology and Bioinformatics, Institute of Microbiology of the Czech Academy of Sciences, Zamek 136, 37333 Nové Hrady, Czech Republic
4
Faculty of Science, University of South Bohemia České Budějovice, Branišovská 1760/31a, 37005 České Budějovice, Czech Republic
5
Instituto Tecnológico de Santo Domingo (INTEC), Santo Domingo 10602, Dominican Republic
*
Authors to whom correspondence should be addressed.
Molecules 2022, 27(18), 6040; https://doi.org/10.3390/molecules27186040
Submission received: 16 August 2022 / Revised: 6 September 2022 / Accepted: 10 September 2022 / Published: 16 September 2022
(This article belongs to the Special Issue Activated Carbons—Production and Applications)

Abstract

:
Adsorption is one of the most successful physicochemical approaches for removing heavy metal contaminants from polluted water. The use of residual biomass for the production of adsorbents has attracted a lot of attention due to its cheap price and environmentally friendly approach. The transformation of Sargassum—an invasive brown macroalga—into activated carbon (AC) via phosphoric acid thermochemical activation was explored in an effort to increase the value of Sargassum seaweed biomass. Several techniques (nitrogen adsorption, pHPZC, Boehm titration, FTIR and XPS) were used to characterize the physicochemical properties of the activated carbons. The SAC600 3/1 was predominantly microporous and mesoporous (39.6% and 60.4%, respectively) and revealed a high specific surface area (1695 m2·g−1). To serve as a comparison element, a commercial reference activated carbon with a large specific surface area (1900 m2·g−1) was also investigated. The influence of several parameters on the adsorption capacity of AC was studied: solution pH, solution temperature, contact time and Cr(VI) concentration. The best adsorption capacities were found at very acid (pH 2) solution pH and at lower temperatures. The adsorption kinetics of SAC600 3/1 fitted well a pseudo-second-order type 1 model and the adsorption isotherm was better described by a Jovanovic-Freundlich isotherm model. Molecular dynamics (MD) simulations confirmed the experimental results and determined that hydroxyl and carboxylate groups are the most influential functional groups in the adsorption process of chromium anions. MD simulations also showed that the addition of MgCl2 to the activated carbon surface before adsorption experiments, slightly increases the adsorption of HCrO4 and CrO42− anions. Finally, this theoretical study was experimentally validated obtaining an increase of 5.6% in chromium uptake.

Graphical Abstract

1. Introduction

The invasion of the coastal areas of the Caribbean and West African countries by Sargassum seaweed during the last decade has generated major issues in the tourism industry and the health and environment sectors [1]. Sargassum natans and Sargassum fluitans are the most prevalent species in this area, and their massive arrivals encourage researchers to find new ways of valorization.
Among many other potential applications [2,3], Sargassum algae have been employed as a natural biosorbent for the removal of heavy metals [4,5], but also, as a precursor for the production of activated carbon (AC) for water treatment applications [6,7,8].
In developing countries such as the Dominican Republic, along with the discharge of wastewater into aquifers, one of the primary causes of water contamination is the discharge of excessive quantities of hazardous heavy metals from different industrial activities and subsequently, the contamination of groundwater [9]. The hexavalent Cr(VI) and trivalent Cr(III) chromium are toxic heavy metals often found in the environment. Cr(III) is a micronutrient, but Cr(VI) is a proven carcinogen that should be removed from the environment [10]. In the case of Cr(VI) ions, many studies were dedicated to the removal of stable oxyanions, such as hydrogen dihydrate, hydrochloric acid and chromate, from the environment. Toxic effects on living organisms, including renal failure, gastrointestinal and central nervous system problems, dermatitis and lung cancer, have been reported [11]. Per the United States Environmental Protection Agency (USEPA), the maximum permitted concentration of Cr(VI) in drinking water is less than 0.1 mg/L, although the World Health Organization (WHO) recommends 0.05 mg/L [12]. USEPA classifies Cr(VI) as one of the 129 most critical pollutants [13].
The removal of hazardous chromium from residential and industrial water may be accomplished using a variety of physical and chemical processes, including coagulation, adsorption, ion exchange, chemical precipitation, electrochemical, and membrane techniques [14].
Finding adsorbents capable of removing Cr(VI) from aqueous environments is the focus of many extensive studies. Adsorbents for Cr(VI) removal have been produced and effectively utilized from a variety of carbonaceous materials, including biomass, graphene oxide, nanoparticles, and composite materials [10,15]. Biomass-derived carbonaceous compounds have lately been given more attention due to the exhibited high specific surface area, porosity, and rich surface functional groups [16]. The adsorption of Cr(VI) has been studied using activated carbon derived from seaweed [6,7], Bermuda grass [17], carbon-encapsulated hematite nanocubes [18], banana biochar [19], corn stalks [20], coffee waste [21,22], apple peels [23], Modified Spruce Sawdust [24], carbon nano-onions [25], magnetic nano-adsorbent impregnated with activated carbon [26], polymer-magnetic-algae nanocomposite [27], date palm empty fruit bunch wastes [28] and fox nutshells [29].
The adsorption for ionic contaminants in wastewater is limited by the number of hydrophobic surface functional groups on AC [30]. Hence, heteroatom dopant insertion has lately attracted more attention in water treatment applications because dopant atoms (such as N, F, S, P, and B) on the surface of activated carbon enhance the adsorption capacity of heavy metal ions [31,32,33]. There are many P-related surface groups and complexes on the AC surface that are thermally stable, making it suitable for use in water purification for Cr(VI) [34]. It is worth mentioning, from a chemical standpoint, that the introduction of an electronegative element (such as N, P, or O) into the carbon framework results in an increase in the positive charge density on adjacent carbon atoms, which promotes the adsorption of Cr(VI) ions. The use of H3PO4 as a chemical activator for (CO)3PO and (CO)2PO2, is known to increase thermal and textural stabilities [35].
On the other hand, the solute-solvent interactions at the molecular level can be studied using molecular dynamics (MD). This technique enables the examination of molecular areas with a finer size resolution than experimental methods [36]. According to earlier research, parameters such as solution pH and the presence of inorganic salts in the medium have an impact on the surface characteristics (zeta potential) of the activated carbon. By combining MD with surface potential data, it is possible to characterize the parameters that influence the adsorption of inorganic pollutants such as Cr(VI) on AC.
Despite the increasing number of studies dedicated to the development of adsorbent materials derived from biomass, only a few of them have been focused on Sargassum seaweed.
In this paper, a low-cost adsorbent derived from widely available pelagic Sargassum seaweeds was synthesized and studied to remove Cr(VI) chromium from polluted water. The structure and surface of the Sargassum seaweed were modified by a thermochemical activation process, converting the algae into activated carbon.
In order to comprehend the adsorption mechanism, the adsorption kinetics, isotherms, and thermodynamics were studied. Finally, MD simulations have been employed to understand the experimental findings and the solute-solvent interactions at the molecular level.

2. Materials and Methods

2.1. Materials

Phosphoric acid (H3PO4, 85%), potassium dichromate (K2Cr2O7, 98%), 1,5-diphenylcarbazide, sulfuric acid (H2SO4, 95–98%), hydrochloric acid (HCl, 37%) and caustic soda (NaOH, 98%), were purchased from Sigma Aldrich (France). Analytical grade magnesium chloride hexahydrate (MgCl2·6H2O) was purchased from VMR (France).
The seaweed biomass, Sargassum spp. (Sargassum natans and Sargassum fluitans) was harvested on Guadeloupe’s La Datcha beach.
Two AC were used in the adsorption investigations. A commercial AC from VEOLIA (Supercap BP10, SBP10) was used as a reference because of its large specific surface area and remarkable adsorption capacity, and a Sargassum AC named SAC600 3/1 was synthesized in the laboratory by phosphoric acid activation as described below.

2.2. Preparation of Sargassum AC

Tap water was used to rinse the Sargassum samples in order to eliminate any further algae, sand, or pollutants. After being cleaned with water, the Sargassum was dried in the sun for 7 days. Thereafter, it was placed in a standard oven set to 110 °C for 24 h to remove any remaining moisture. The dry sample was coarsely ground in an electric mixer-grinder and then sieved to acquire a size distribution ranging from 0.5 to 1.5 mm.
The sieved dried Sargassum was then impregnated in phosphoric acid using a mass ratio of 3/1 for 15 h before being pyrolyzed for 2 h at 600 °C using a Carbolite CTF 12/75/700 horizontal tubular furnace with a constant flow of N2 (80 mL/min) to minimize oxidation of the sample. The temperature was risen at 5 °C/min from room temperature up to the desired pyrolysis temperature.
Following pyrolysis, the cooled solid leftovers, unwashed AC, were crushed in a mortar to facilitate access to the pores. The Sargassum AC was then washed with deionized water (<5 µS  cm−1) in a beaker with stirring until a pH of 6.5–7 was achieved. To improve the washing of the AC and obtain a greater specific surface area, the samples were washed again with deionized water for 8 h, but this time in a stirred beaker at a higher temperature (80 °C), in a turbulent regime. This washing was repeated twice to ensure that the pores of the AC were completely free of phosphoric acid and other potential contaminants. Finally, the Sargassum AC was dried in an oven at 110 °C for 24 h to remove residual moisture. The yield of synthesized activated carbon was 14.5% (w/w%). This yield corresponds to values previously published where Sargassum algae were used as raw material for the production of activated carbon [7].

2.3. Adsorbents Characterisation

The specific surface area (SBET) and porous properties of each sample were determined using N2 adsorption studies. A Sorptomatic 1990 series analyzer was utilized to assess the N2 sorption capacity at 77 K. The samples were degassed at 250 °C for 17 h to eliminate residual moisture, prior to N2 adsorption studies. In the P/P0 range of 0.10321–0.225, the specific surface area was estimated using a linear fit of the Brunauer-Emmett-Teller (BET) equation. The volume of adsorbed N2 was defined as the total pore volume (VTot) at a relative pressure (P/P0) of 0.9982. The Horvath-Kawazoe method was used to compute the micropore volume (Vmicro), and the mesopore volume (Vmeso) was calculated as Vmeso = VTot − Vmicro [7]. The ratio 4VTot/SBET was used to calculate the mean pore diameter (Dp) [37].
The point of zero charge (pHPZC) or isoelectric point (pHIEP) is an essential feature that defines the linear range of pH sensitivity. It subsequently reveals the surface polarity that gives information on its adsorption capacity for ionic species [38]. The following procedure was used to estimate the AC samples point of zero charge (pHpzc). 0.1 g of carbon was added to 20 mL of 0.1 M NaCl solution at initial pH values ranging from 2 to 13 and adjusted with NaOH or HCl (0.5 M). The samples were agitated at a speed of 150 rpm for 24 h at a temperature of 25 °C. The initial (pHi) and final (pHf) pH values were determined and used to calculate the pHpzc.
Using the Boehm titration method, acidic and basic groups were determined. 500 mg of AC were added to 50 mL of NaOH 0.05M or HCl 0.05 M solution to determine the concentration of basic and acidic groups, respectively. On a shaker, the glass bottles were sealed and shaken for 48 h. The sample was then filtered with a 0.45 µm filter syringe to eliminate the AC. 10 mL of filtrate sample was titrated with HCl or NaOH (0.05 M). Every titration was performed in triplicate, and the average values are provided.
Attenuated Total Reflectance Fourier Transform Infrared Spectroscopy (ATR-FTIR) was used to identify the surface functional groups of both AC. The FTIR spectra were acquired at ambient temperature using the Spectrum Two instrument from PerkinElmer in the wavenumber range of 4000 to 650 cm−1 with a resolution of 2 cm−1.
A Kratos AXIS Ultra HSA X-ray Photoelectron Spectrometer coupled with a hemispherical electron analyzer was employed to conduct the X-Ray Photoelectron Spectroscopy (XPS) analysis that was required to determine the elements and oxidation states of the activated carbon surface. This analysis was carried out using a monochromatized Al K (1486.6 eV) X-ray excitation source. To deconvolute each spectrum, a Lorentzian function was applied.

2.4. Batch Adsorption Studies

The measurement of the concentration of chromium in solution was performed according to the standard colorimetric method of Greenberg [39]. A 1 mL chromium solution is sampled and mixed in an acid medium until reaching a pH of 2 ± 0.5 (3.3 mL of H2SO4 0.1 M were used). Next, 1 mL of a complexing agent, 1,5-diphenylcarbazide (0.25 g/100 mL of absolute ethanol) was added to the mixture forming a purplish-pink complex. After 5 min, its concentration was measured at 540 nm using a SECOMAN Uviline 9400 spectrophotometer.
Dichromate concentrations varying from 0.5 to 7.5 mg/L (0.5, 1, 2, 3, 4 and 7.5) were used for the calibration curve. A stock chromium solution was prepared by dissolving a determined quantity of K2Cr2O7 in deionized water in order to obtain a concentration equal to 1000 mg/L. The other concentrations were obtained by successive dilutions.
The adsorption experiments (kinetic and isotherm studies) were conducted by contacting 0.1 g of AC with 100 mL of 60 mg/L of chromium solution. The experiments were conducted in a thermostatically controlled water bath at 30 °C and 150 oscillations per minute.
To determine the equilibrium, the sampling of the aqueous phase was performed at predetermined time intervals. Each sample was filtered with a Nylon syringe filter of 0.2 µm, and then, analyzed by UV-visible spectrophotometry according to the previously described conditions. The initial pH of the chromium dissolution was measured (pH = 5.0 for the dissolution of 60 mg/L of K2CrO7, for example).
The duration of the experiment and the time required to reach the plateau of the adsorption kinetics are directly related to the characteristics of the precursor. Normally, 24 h is enough time to reach the plateau for the AC sample, but it is advisable to continue the measurements until at least 48 h.
To assess the effect of contact time, sampling was conducted every 15 min for the first 2.5 h, and subsequently at larger intervals until 48 h. The standard colorimetric method of Greenberg was used to calculate the Cr(VI) equilibrium concentration, Ct (mg/g). Equation (1) computes the amount of Cr(VI) adsorbed under equilibrium at each time, qt.
Equation (1) Adsorption capacity at the time “t”.
q t = C 0 C t m × V
Several kinetic models were studied to investigate the adsorption mechanism.
To obtain adsorption isotherms, several conditions at initial concentrations of 10; 15; 20; 25; 30; 35; 40; 45; 55; 60; 75; 100 mg/L of chromium solution were prepared. The pH was measured for each of the prepared solutions. As for adsorption kinetics, the tests were carried out in a thermostatic water bath at 30 °C and stirred at 150 oscillations per minute.
A series of experiments were conducted to investigate the adsorption of Cr(VI) ions onto activated carbons and the influence of various parameters. Equations (2) and (3) were used to acquire the equilibrium adsorption capacity, qe (mg/g), and the hexavalent chromium removal percentage [40].
Equation (2) Adsorption capacity at equilibrium.
q e = C 0 C e m × V
Equation (3) Cr6+ removal percentage.
R e m o v a l   % = C 0 C e C 0 × 100
C0 and Ce (mg/L) are the initial and final concentrations of Cr6+ ions. V is the volume of the solution (L) and m is the mass of the adsorbent (g).
To study and fit the experimental data, six non-linear regression models were used. Langmuir and Jovanovic models normally show a good fitting a homogeneous surface without lateral interactions is studied (Equations (4) and (5)). Fowler model is used for homogeneous surfaces with lateral interactions (Equation (6)). The Freundlich and Jovanovic-Freundlich models fit well when the surface is heterogeneous and there are not lateral interactions (Equations (7) and (8)). Finally, heterogeneous surfaces with lateral interactions can be described by the Fowler–Guggenheim/Jovanovic–Freundlich model (Equation (9)) [41].
Equation (4) Langmuir adsorption capacity at equilibrium.
q e = q s ·   K ·   C e 1 + K · C e
Equation (5) Jovanovic adsorption capacity at equilibrium.
q e = q s · 1 e K ·   C e
Equation (6) Fowler adsorption capacity at equilibrium.
q e = q s ·   K ·   C e e χ ·   q e q s + K ·   C e
Equation (7) Freundlich adsorption capacity at equilibrium.
q e = K ·   C e ( ν )
Equation (8) Jovanovic–Freundlich adsorption capacity at equilibrium
q e = q s · 1 e K ·   C e
Equation (9) Fowler–Guggenheim/Jovanovic–Freundlich adsorption capacity at equilibrium.
q e = q s · 1 e K ·   C e · e χ ·   q e q s
Adsorption capacity and solution concentration at equilibrium are represented by qe (mg/g) and Ce (mg/L), respectively. qs is the monolayer capacity, χ is the adsorbate–adsorbate interaction parameter, ν is the heterogeneity parameter and K are the affinity parameters of each model.
Using a modified Newton algorithm, regressions of the experimental data to the adsorption iso-therm models were conducted. By minimizing the residual sum of squares (RSS), this technique de-termines the values of the isotherm parameters.
Equation (10) Residual sum of squares (RSS).
R S S = i = 1 n q e x p ,   i q t ,   i 2
The applicability of the kinetic and isotherm models was assessed by evaluating the coefficient of determination, R2.
Several investigations were also conducted to find the optimal conditions for the adsorption of hexavalent chromium with AC derived from Sargassum seaweed.
The impact of pH on chromium adsorption was also examined. HCl and NaOH were used to alter the pH of the chromium solution to a range of 2 to 11.
The effect of the solution temperature was also studied at 25 °C, 30 °C and 35 °C for a 6 mg/L Cr(VI) solution. In these investigations, a solution of 100 mL containing 6 mg/L of K2CrO7 and 10 mg of activated carbon was utilized. Using the Van’t Hoff equation, several thermodynamic parameters were determined based on the outcomes of the thermal interaction. Using Equations (11)–(13), the standard Gibbs free energy change (ΔG), standard enthalpy change (ΔH), and standard entropy change (ΔS) were calculated [42].
Equation (11) Equilibrium constant.
K e q = C a d C e = C 0 C e C e
Equation (12) Standard Gibbs free energy.
Δ G = Δ H T · Δ S
Equation (13) Van’t Hoff equation.
l n K e q = Δ S R Δ H R · 1 T
where Keq is the equilibrium constant, Cad is the concentration (mg/L) of adsorbed Cr6+ onto the AC, Ce is the concentration (mg/L) in solution at equilibrium, C0 is the initial concentration (mg/L) of the solution, R is the universal gas constant (8.314 J/(mol·K)), Keq is the equilibrium constant.
Finally, the effect of ionic strength and counter ions on the adsorption of hexavalent chromium adsorption was investigated. The purpose of this experiment was to confirm the results obtained during molecular dynamics simulations. In this experiment, 4.3 mg of MgCl2 were diluted in 10 mL of deionized water. For 2 h, the magnesium solution was mixed with 10 mg of activated carbon. Following that, 20 mL of 30 mg/L chromium solution were added. The final mixture was shaken at 150 oscillations per minute for 24 h before the absorbance of the resulting solution was measured.
All the experiments were carried out at least 3 times per sample evaluating experimental reproducibility.

2.5. Molecular Dynamics Simulations

To understand the adsorption of ions and investigate the interactions between inorganic micro-pollutants and the AC surface at the molecular level, and interpret the experimental data of hexavalent chromium adsorption at the surface of porous carbons, classical MD simulations were used. For the design of the activated carbon, the ratios oxygen/carbon from the XPS analyses of SAC600 3/1 were used to estimate the proportion of functional groups. O-C=O groups revealed the lowest proportion (4.24%). To limit the size of the molecule and ease the simulations, it was considered that the 4.24% of O-C=O represented 2 carboxylic groups. Subsequently, for C=O groups, the measured 7.43% was considered as 4 carbonyl groups. Finally, the 21.04%, derived from the C-O functional groups, was interpreted as 8 hydroxyl groups. Therefore, SAC600 3/1 model was developed having 23 rings, 2 carboxyl, 4 ketone, and 8 hydroxyl groups.
Figure 1 shows the design of the SAC600 3/1 and a snapshot of the simulation.
This model (Figure 1a) can be used in a pH interval from 4 to 8. The model was designed to work under real water conditions of drinking water and wastewater (pH around 7). For this reason, carboxyl groups are deprotonated (-COO, pKa = 3 to 6) and phenol groups are protonated (-OH, pKa = 8 to 11) [43,44]. As carboxyl groups are deprotonated therefore for the negatively charged model of activated carbon, a partial repulsion of chromium anions is expected. Density functional theory (DFT) was used for deriving the Cr(VI) ion parameters which were then employed in the molecular dynamics simulations. In DFT calculations, an implicit solvation model was applied. However, explicit solvation was used in the productive classical MD simulations. Density functional theory calculations have been presented in Supplementary Materials. The force field parameters for CrVI ions and the activated carbon molecule were described by the potential function based on General Amber Force Field (GAFF) parameters [45,46]. On the other hand, for Na+, Cl and Mg2+ ions the ff99SB [47] amber force field, which is compatible with GAFF, has been applied.
To prepare the simulation boxes, one molecule of AC model and a different ratio of HCrO4/CrO42− depending on the pH of the solutions, were added to the simulation boxes. Moreover, to increase the number of positive binding sites and to study the effect of ionic strength and counter ions on the adsorption of hexavalent chromium, magnesium chloride has been added to the simulation boxes to assess the impact of magnesium ions on the adsorption of Cr6+ on AC. As the AC model surface was negatively charged, K+ ions were added to the system as counterions to compensate the charge, but also to simulate the experimental conditions as chromium solutions were prepared from K2CrO7.
Figure 1b shows a snapshot from the MD simulation where the Mg2+ ions are added to the solution. For performing the simulations, first of all, systems were minimized by steepest descent minimization then equilibrated by 500 ps NVT (Canonical ensemble) followed by 500 ps NPT (isothermal–isobaric ensemble). The linear constraint solver (LINCS) algorithm [48] was used for equilibration and short-range non-bonded interactions were cut-off by 1.2 nm. The particle mesh Ewald method [49] was used for long-range electrostatic interactions. All simulations were run at 300 K with a V-rescale coupling algorithm [50] with a coupling constant of 0.1 ps. Production runs were performed at NPT ensemble for 100 ns with 2 fs time steps. Gromacs 4.6.5 program package was used for performing MD simulations [51]. For visualizations, Visual Molecular Dynamics (VMD) was applied [52].
Atom types, atomic point charges and indicated inter-atomic bonding in CrO42, HCrO4 and Cr2O72 anions can be found in the Supplementary Materials.

3. Results and Discussion

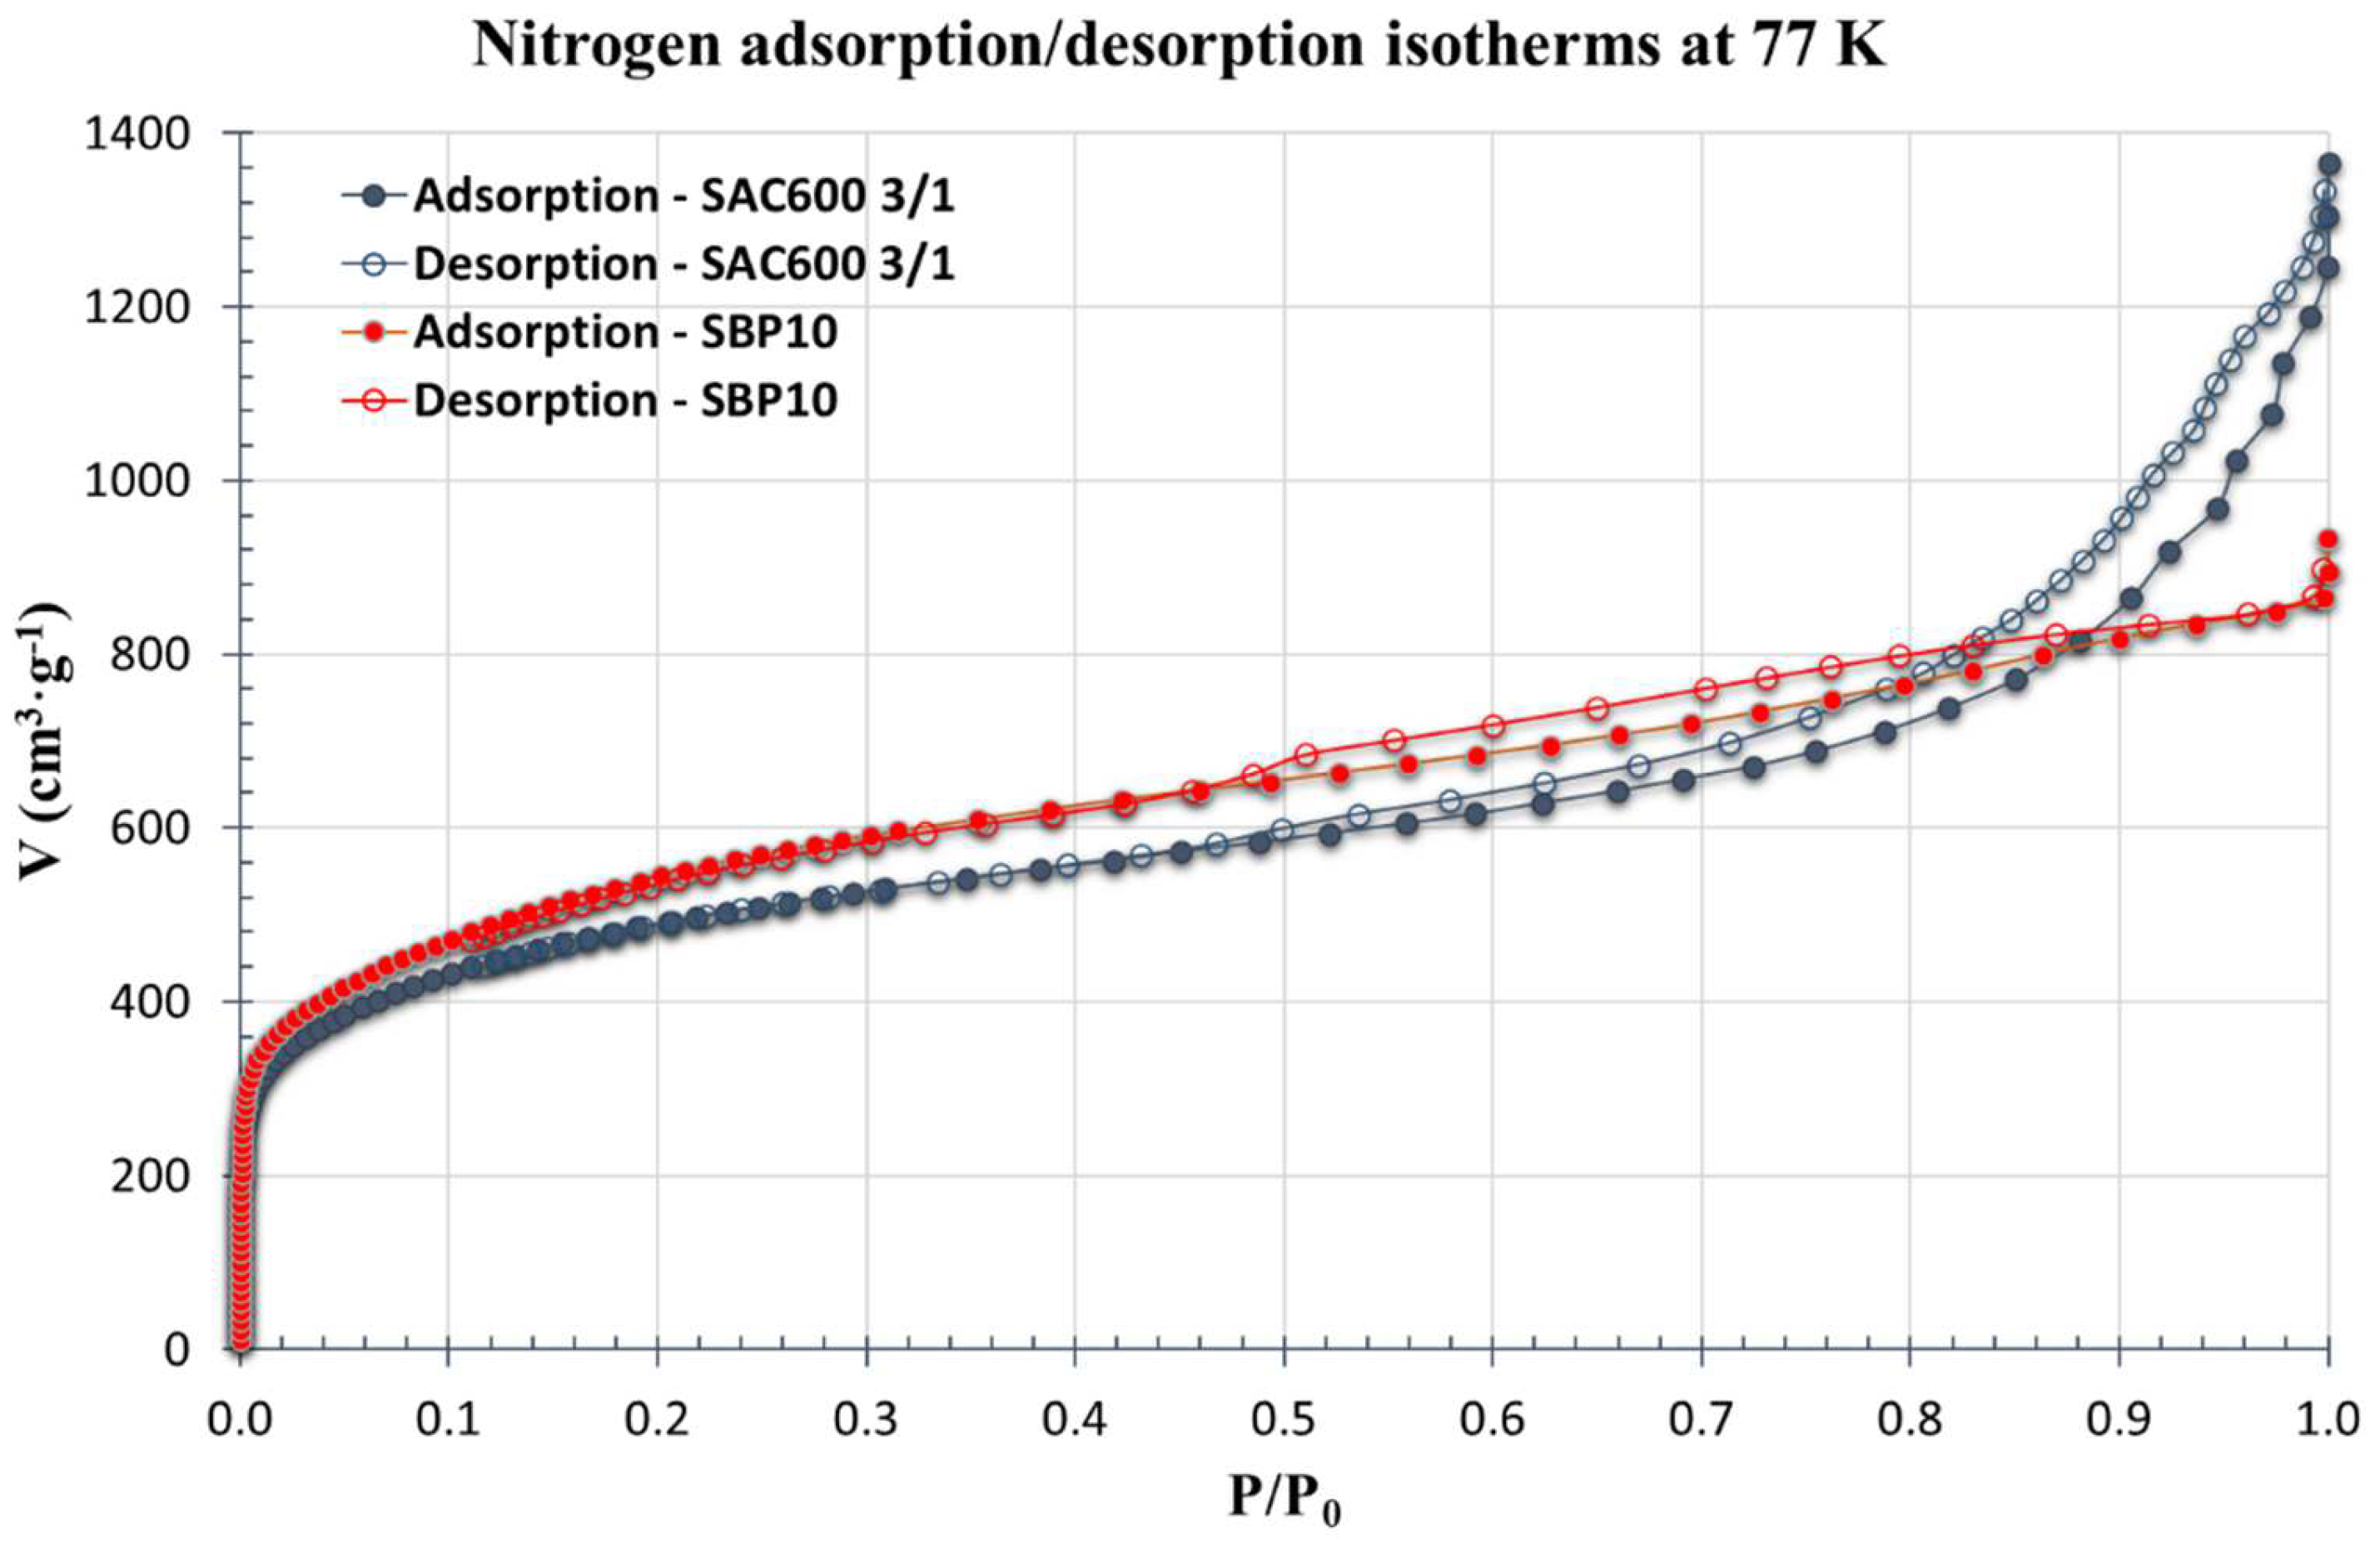
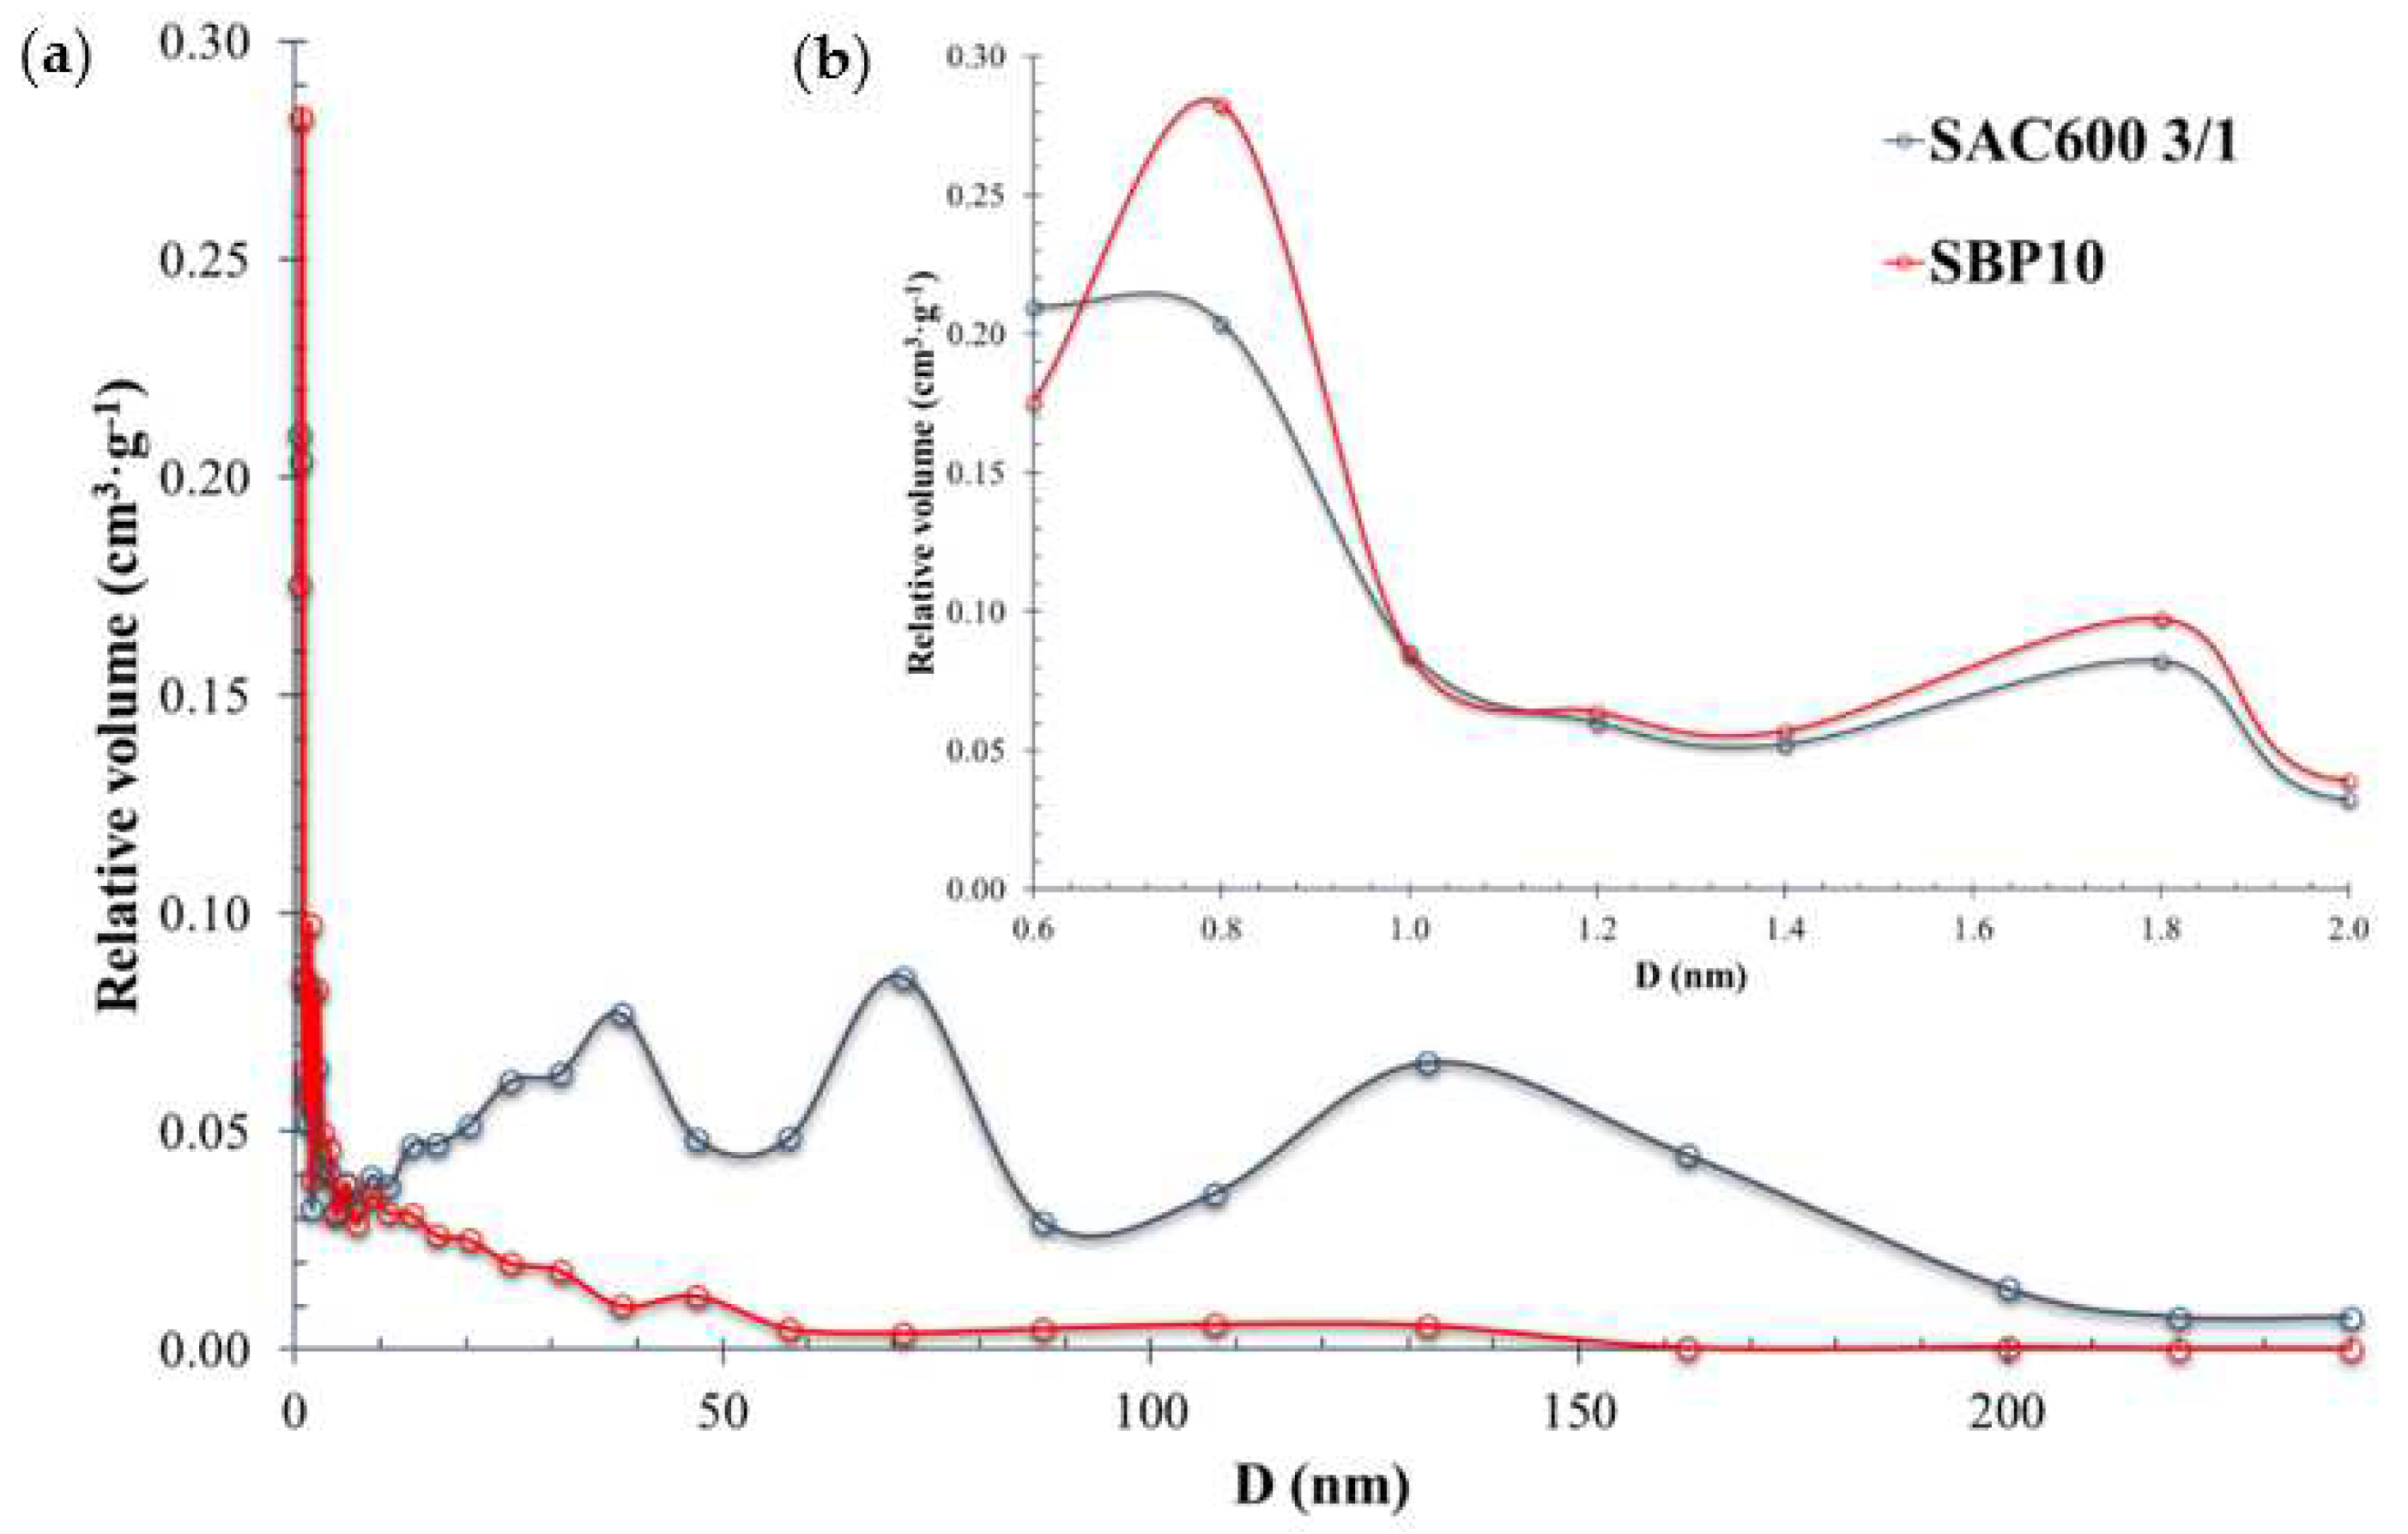
3.1. Textural Characterization

Surface Area and Pore Size Distribution

The robust nature and porous structure of AC produced from Sargassum seaweed satisfied the requirements for gas sorption experiments. Studies on gas adsorption were conducted on the SAC600 3/1 and SBP10 up to a relative pressure (P/P0) of 0.9982. As demonstrated in Figure 2, the sorption of nitrogen at 77 K exhibited gradual adsorption.
The SBP10 structure resembles a type I isotherm, indicating a greater presence of micropores. SAC600 3/1 displayed a type II isotherm with considerable adsorption below P/P0 = 0.05 and an H4 hysteresis loop at P/P0 0.48. Typically, type II isotherms are observed in hierarchical porous solids with a broad range of pore-size distributions spanning the micro, meso and macropore regimes, and where the corresponding porosity varies substantially in each zone [53]. The H4 hysteresis loop’s adsorption branch is a mix of types I and II, with more prominent adsorption at low P/P0 being linked to micropore filling. H4 loops are generally abundant in micro-mesoporous carbons [54].
SAC600 3/1 and SBP10 revealed BET surface areas of 1695 m2/g and 1900 m2/g, respectively. SAC600 3/1 exhibited a very large specific surface area, making it a highly valuable AC. Its specific surface area surpasses not just activated carbons obtained from Sargassum but also the vast majority of porous carbon compounds derived from seaweed [6,7,8,55,56]. In addition, it is competitive with the most recently published porous carbon compounds derived from biomass [57,58,59,60].
The presence of micropores and mesopores in the material was confirmed by the HK (Horváth-Kawazoe) pore size distribution pattern [61]. Figure 3 shows the corresponding results.
Based on the pore size distribution calculated from the adsorption isotherms using the HK model, the corresponding average pore sizes of SAC600 3/1 and SBP10 were 0.6 nm and 0.8 nm. Table 1 summarizes the textural properties of both activated carbons.
The proportion of micropores to mesopores differed among the studied activated carbons. SAC600 3/1 contained 40% of micropores and 60% of mesopores. In contrast, the results for SBP10 revealed the exact opposite, with 60% micropores and 40% mesopores.

3.2. Chemical Characterization

3.2.1. pHPZC

The pH at the point of zero charge (pHPZC) was determined for SAC600 3/1 and SBP10. It is essential to estimate the pHPZC of the AC since the anion adsorption is favored when pH of the adsorbate solution is lower than the pHPZC value, as the surface of the porous material is charged positively. In contrast, if the pH is greater than the pHPZC value, the surface will be charged negatively, hence increasing the cations’ adsorption attraction. The pHPZC results for SAC600 3/1 and SBP10 were similar, 3.40 to 3.70, respectively.

3.2.2. Boehm Analysis

The surface acidity and basicity of both activated carbons were determined by the Boehm titration technique. This method provides quantitative measurements for oxygen-containing surface functional groups on carbon materials, supposing that carboxyl, phenolic, and lactone groups are reduced by a sodium hydroxide solution and basic groups are neutralized with a hydrochloric acid solution. The results for each activated carbon are presented in Table 2.
The number of acidic functional groups is higher than the number of basic functional groups for both activated carbons. The number of acid groups in SAC600 3/1 is double that in SBP10, which confirms that the acid activation process with phosphoric acid, used to obtain activated carbon from Sargassum, guarantees the presence of more acid groups on the surface of the adsorbent. On the other hand, this result justifies the selection of the activated carbon model for MD simulations, where mainly acid groups were considered.

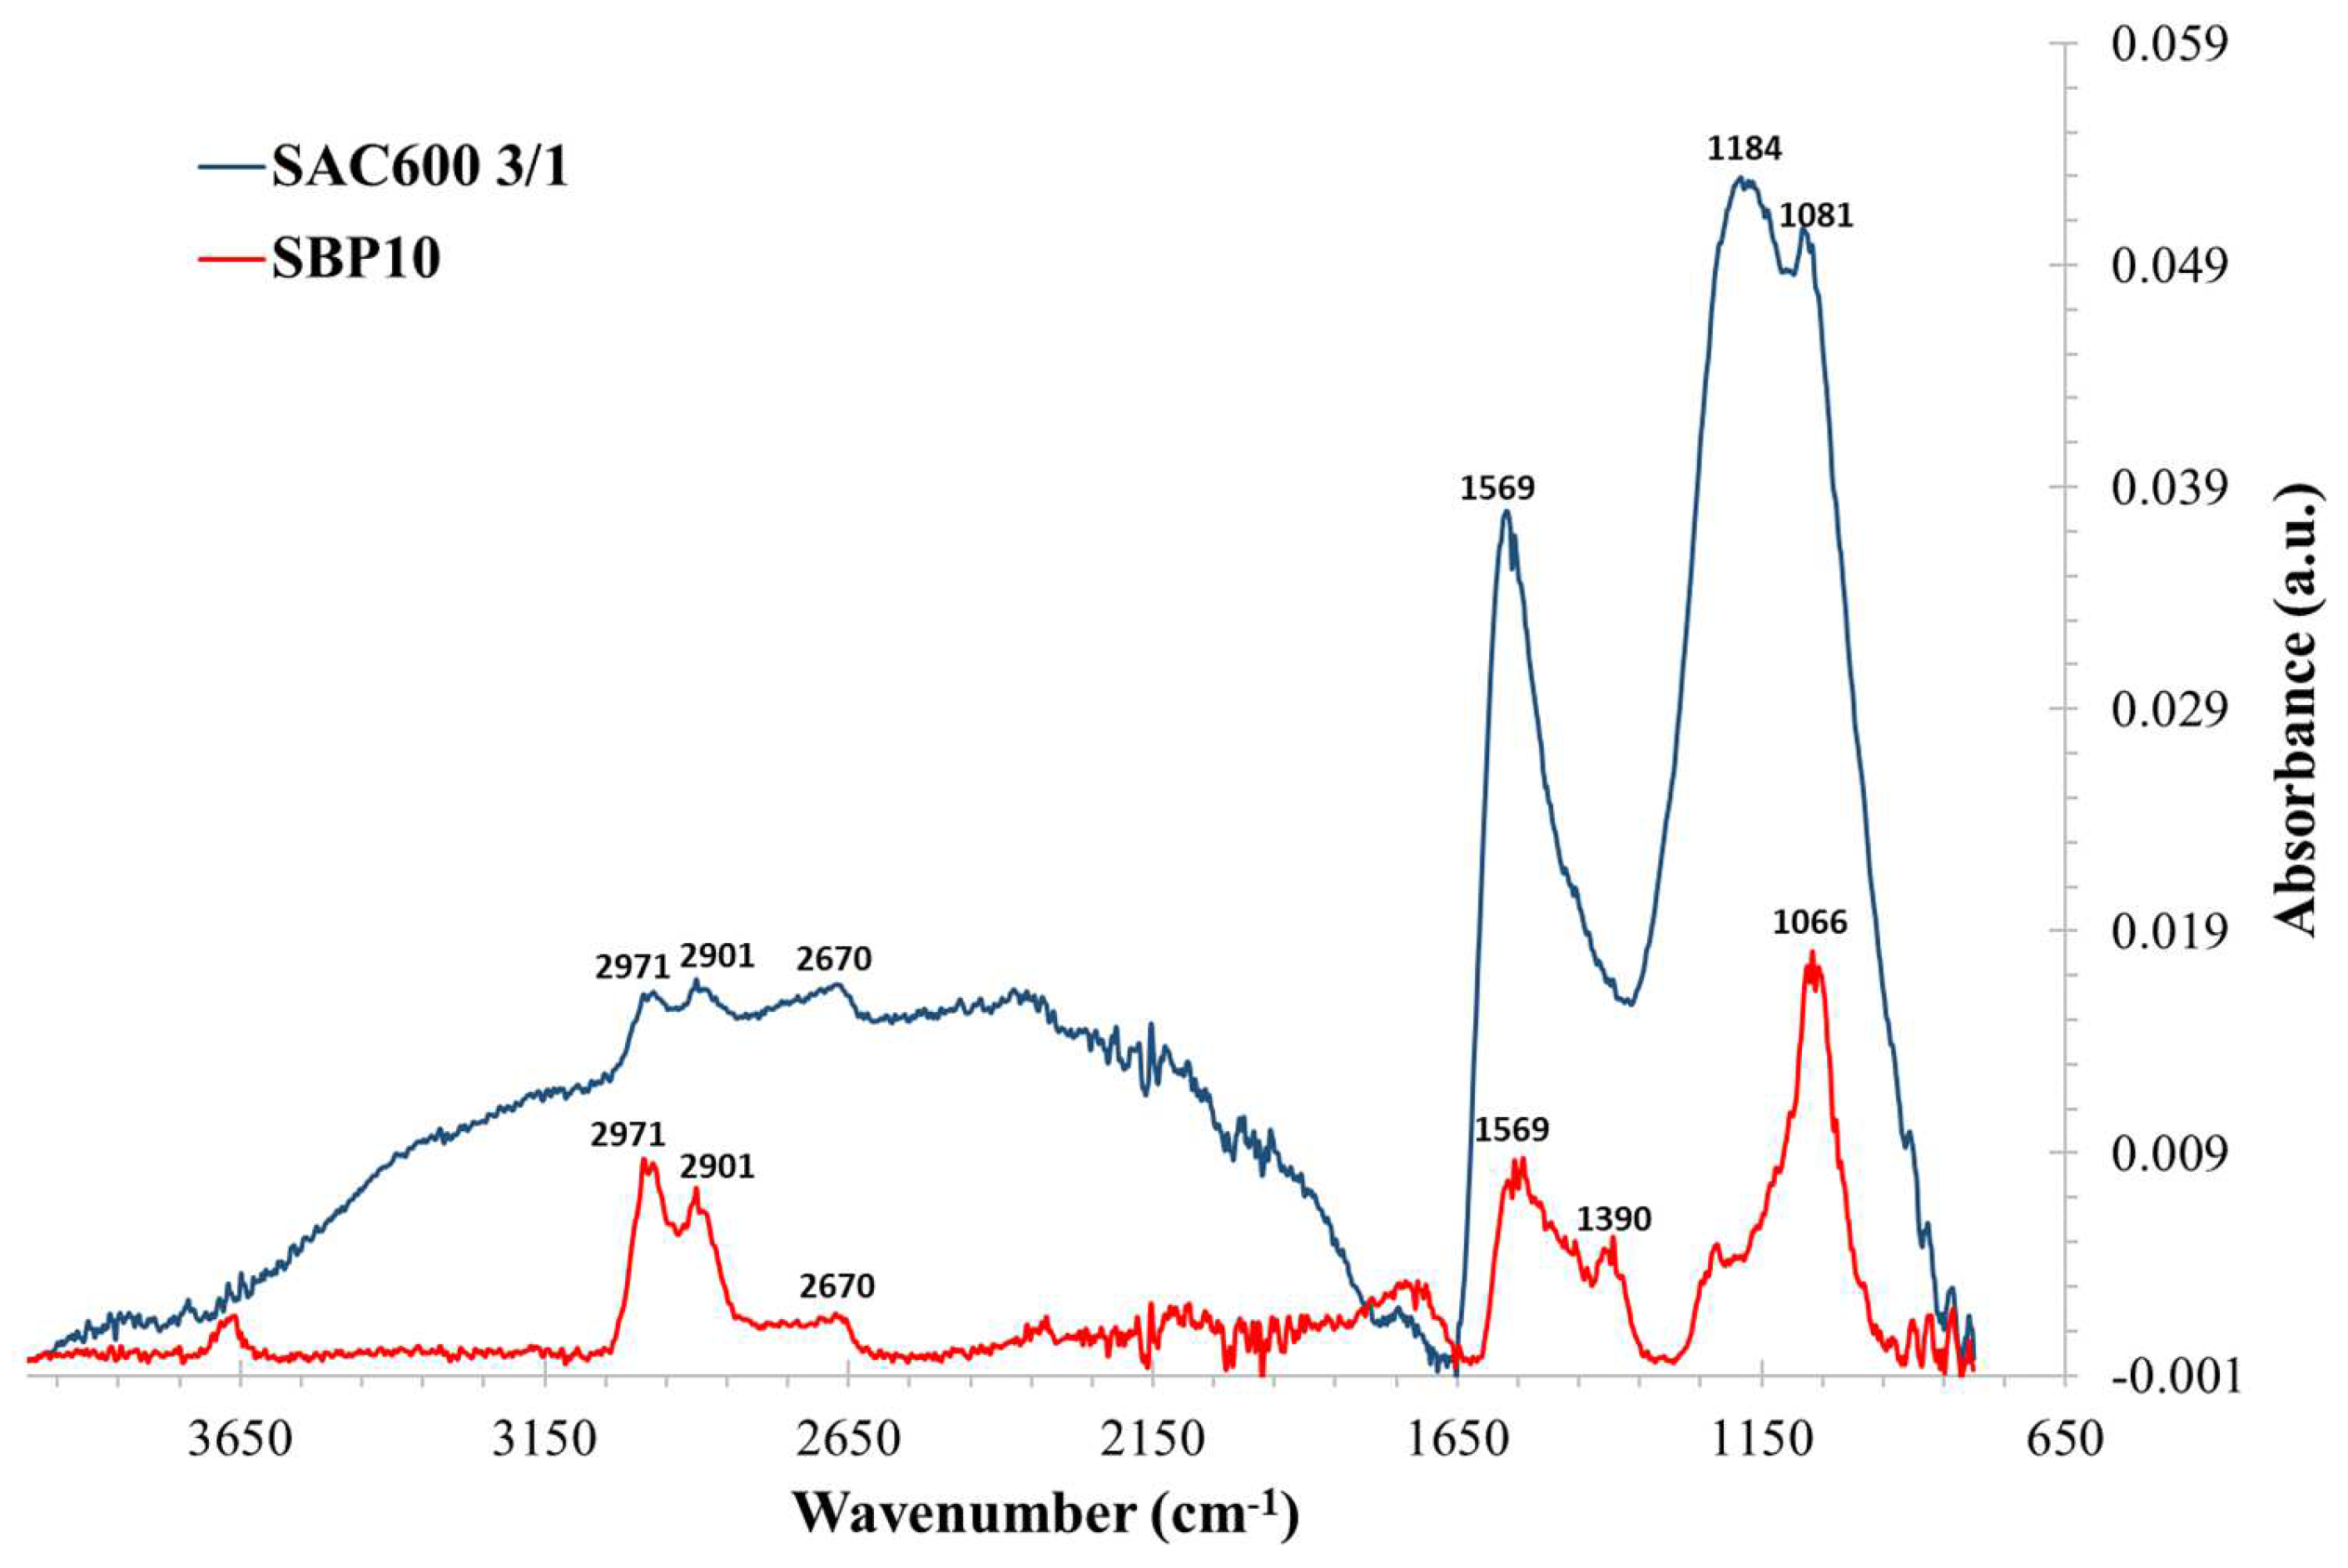
3.2.3. FTIR Analysis

FTIR spectroscopy was used to identify the chemical surface groups of the carbon materials under investigation. Figure 4 depicts the FTIR spectra generated for SAC600 3/1 and SBP10.
Table 3 comprises columns indicating the possible structure of the group, the wavenumber range in which it is most frequently observed, the exact position of the measured peak, and its probable designation.
The principal peaks of the spectra for both activated carbons are comparable (detection at 1569 cm−1 and 1081 cm−1). Commonly, these peaks correspond to the skeletal C=C vibrations of aromatic rings and alcohol functional groups, respectively. Additionally, SAC600 3/1 displays a significant peak at approximately 1184 cm−1 confirming one more time, the efficiency of preparing AC by phosphoric acid activation. Nevertheless, because the detected peaks are so large, it is difficult to confirm the presence of other functional groups. Both activated carbons are likely to contain functional groups including alcohols, carboxylic, ester, and/or phosphorus-based groups. Some nitrogenous compounds may be present as well.
Around 3400 cm−1 to 2800 cm−1, hydroxyl groups can be detected. Depending on the sample, these peaks are easy or hard to identify. The presence of hydroxyl groups is expected taking into account that the material has been activated with H3PO4. Furthermore, on activated carbons derived from seaweed, the modest detection of asymmetric and symmetric CH2 stretching vibrations about 2900 cm−1 (usually with two peaks) has already been reported.

3.2.4. XPS Analysis

XPS spectroscopy was employed to characterize the chemical elements and functional groups present on the surface of SAC600 3/1 and SBP10. Table 4 summarizes the data gathered from the XPS analysis.
The primary elements detected in the SAC600 3/1 were C, O, N, S, and P. The presence of nitrogen and phosphorus seems normal considering that Sargassum seaweeds also have these elements in their composition [6,64]. Furthermore, the AC was chemically activated with H3PO4 which is also a source of phosphorus and oxygen. The absence of Na, Cl, Si and Ca, confirms the good development of the washing procedure where these atoms were successfully removed. The contents of carbon C1s and oxygen O1s were 83.30% and 13.14%, respectively, confirming the formation of a carbonaceous matrix. SBP10 showed a higher content of C 1s (92.99%). It is very possible that the commercial AC was prepared at a higher temperature as the carbon content is higher compared to the other atoms.
Four separate elements with distinct binding energies were discovered in the C1 s spectra. The C 1s deconvolution (C-C, C-H, and C=C interactions) accounted for 67.23% of the atomic concentration that was measured. The highest values were seen in C=C interactions. The observation of a partially graphitic surface supports the FTIR analysis conclusions. Similar to this, the FTIR analysis also registered the presence of C-O compounds (21.09 %), indicating the presence of a large number of phenolic groups or compounds with similar structures. Finally, it was discovered that relative atomic concentrations of carbonyl (C=O) and carboxyl (O-C=O) groups showed lower values (7.43% and 4.24%, respectively). The deconvoluted carbon spectrum of the SBP10 revealed a high concentration of C-C, C-H and C=C bonds (80.88%), where 57.72% corresponded to C=C interactions, indicating the formation of a significant graphitic surface. Additionally, a considerable number of C-C and C-H groups were identified. Compared to the SAC600 3/1 values, the C-O groups of SBP10 are less prevalent (7.45%). This may have been induced by the pyrolysis temperature employed during its production.

3.3. Adsorption Experiments

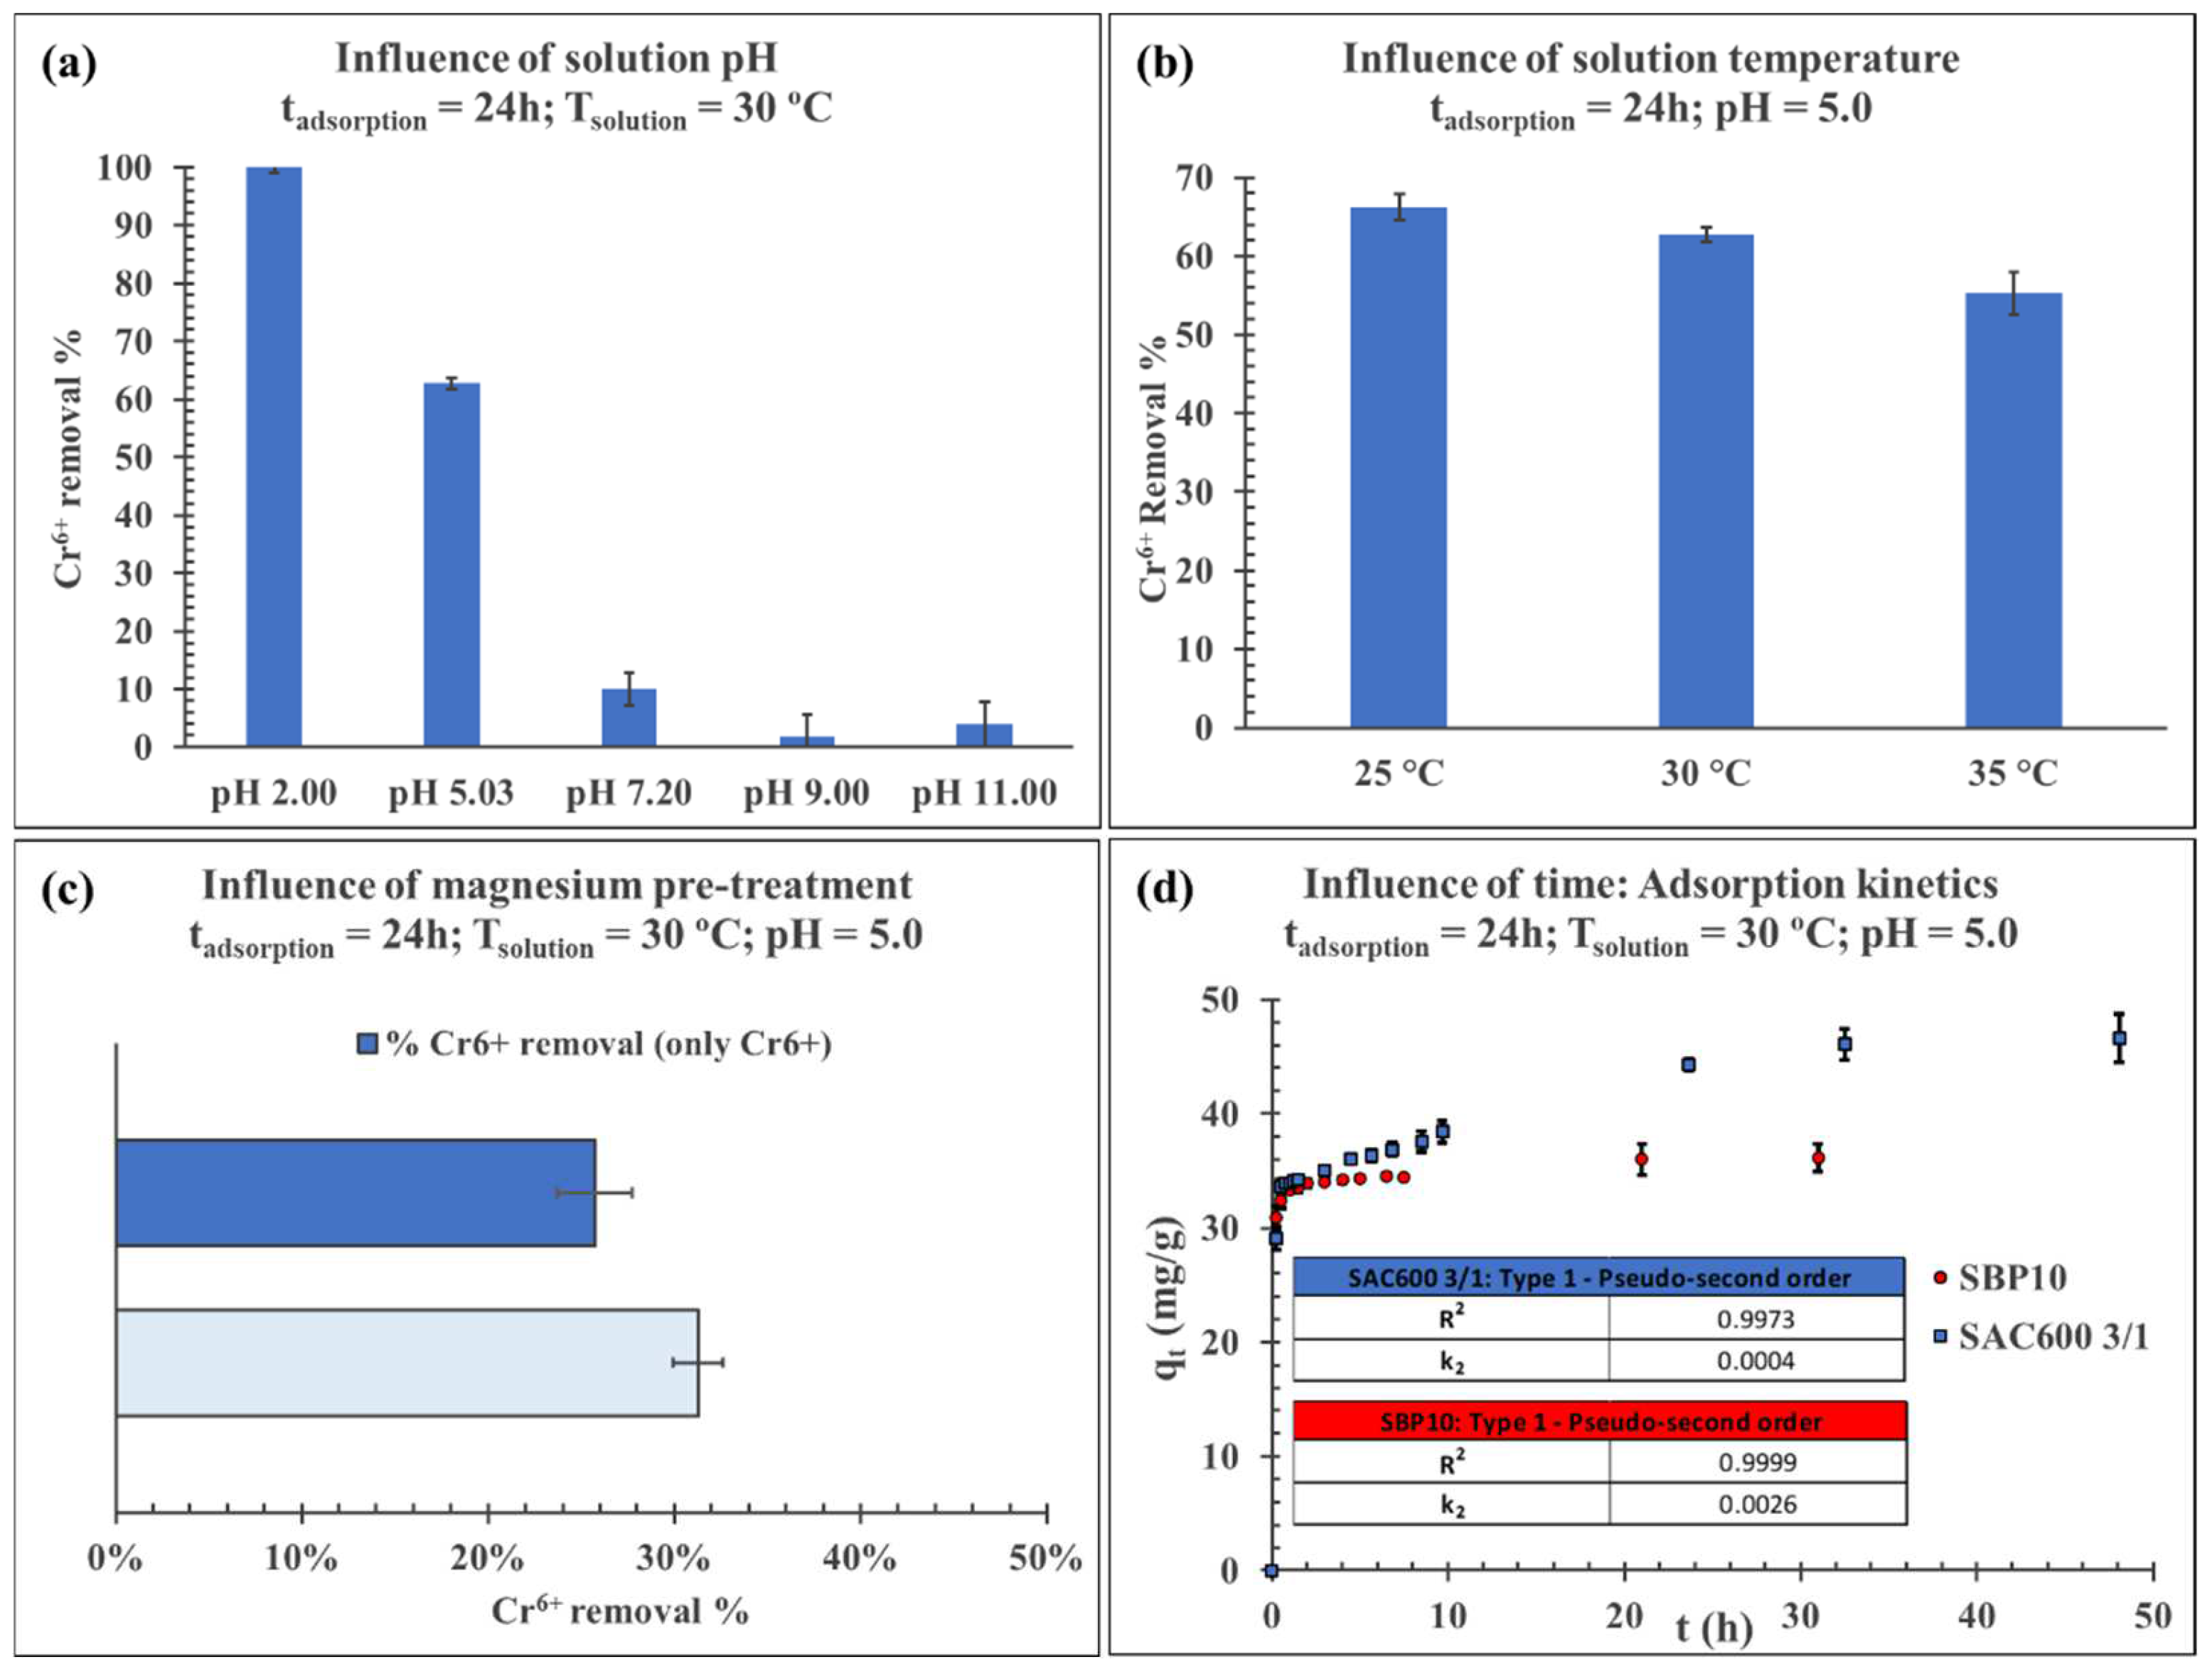
3.3.1. Influence of Different Parameters on Chromium Adsorption

The impact of the following parameters was investigated: solution pH, temperature, solution ionic strength with MgCl2 and contact time (adsorption kinetics). Figure 5 displays the charts obtained from the different studies.

3.3.2. Influence of Solution pH

The effect of pH on the removal of Cr(VI) by adsorption on SAC600 3/1 was investigated by altering the pH values (2–11) and allowing 24 h of contact at 30 °C for each pH value. The outcomes are depicted in Figure 5a. The pH had a considerable effect on the adsorption of Cr(VI), as indicated by the abrupt fluctuations in the adsorption capacity as a function of the pH of the solutions. The pH altered the adsorption behavior by dissociating functional groups on the active sites of the adsorbent’s surface [65] at a high pH value. The optimal pH value for the adsorption of Cr(VI) was estimated to be roughly 2, at which Cr(VI) removal yield was approximately 100%. The adsorption levels of Cr(VI) reduced dramatically as the pH climbed from 2 to 5. Above pH 9, adsorption values are negligible. Numerous investigations [65,66,67] have revealed similar results for Cr(VI) adsorption by various lignocellulose-based materials.
As a function of pH, the Cr(VI) species can exist in many forms such as H2CrO4, HCrO4, CrO2, and Cr2O72− in the solution phase. The form of Cr(VI) is regulated by the pH of the solution according to equilibrium reactions listed below [29]:
H 2 C r O 4 H C r O 4 + H +   p K a = 4.1
H C r O 4 C r O 4 2 + H +   p K a = 5.9
C r O 7 2 + H 2 O 2 H C r O 4   p K a = 2.2
In highly acidic solutions, it is known that HCrO4 and Cr2O72 ions prevail among Cr(VI) species [68]. Hydronium ions that surround the surface of the adsorbent at extremely low pH levels assist Cr(VI) in attaching to the adsorbent’s binding sites due to their increased force of attraction. As the pH increased, the overall charge on the surface of the adsorbent became negative, resulting in a decrease in the adsorption of Cr(VI) oxyanions [69].
For this reason, carboxyl groups are deprotonated (-COO, pKa = 3 to 6) and phenol groups are protonated (-OH, pKa = 8 to 11) [43,44]. As carboxyl groups are deprotonated and therefore, negatively charged, a partial repulsion of chromium anions is expected.
On the other hand, at pH ≈ 5–7, which is most likely the case for drinking water, a rough estimation gives deprotonation of OH surface groups lower than 3% and can be neglected, while only COOH groups are deprotonated to a considerable extent (≈90%) [70].
At pH below 4, the acid groups are protonated, and the AC surface is more positively charged than when the pKa of the carboxyl and hydroxyl groups are reached. From pH 4 to 8, almost all of the carboxyl groups are deprotonated, while only about 3% of the hydroxyls are deprotonated [70]. Above pH 8, almost all hydroxyls are already deprotonated [43,44]. This explains why there is high adsorption at pH 2, medium at 5, and very poor thereafter.
Although the adsorption capacity is higher at pH 2, the remaining studies were conducted at pH 5 since the pH range between 5 and 7 better reflects the pH of drinking water and wastewater.

3.3.3. Influence of Solution Temperature and Thermodynamic Studies

Temperature is a crucial parameter in adsorption processes, as it determines whether the adsorption is exothermic or endothermic. Figure 5b illustrates the results of these experiments. Cr6+ adsorption decreased with temperature and reached its minimum value at 35 °C, indicating that Cr(VI) ion adsorption on SAC600 3/1 is an exothermic process and physisorption is the main adsorption mechanism. Furthermore, this conclusion has also been reported by other researchers [71,72,73,74]. When the temperature of the solution was increased from 25 to 35 degrees Celsius, the Cr6+ adsorption percentage decreased from around 66% to 55% for the studied solution. Temperature plays a crucial role in the chemical interactions between the surface groups of an adsorbent and the ions that it adsorbs. Therefore, the hexavalent chromium adsorption capacity is a variable that depends on temperature.
The thermodynamic characteristics are essential for comprehending adsorption mechanisms since they demonstrate the process’s feasibility, spontaneity, and heat transfer [7].
The thermodynamic studies were conducted at 25 °C, 35 °C and 40 °C. The Vant Hoff equation has been utilized to compute Gibbs free energy, standard enthalpy change, and standard entropy change.
ΔH and ΔS were determined from the plot of ln Keq as a function of 1/T (Figure S2). The thermodynamic characteristics of adsorption are listed in Table 5. The negative value of ΔG reflects that chromium interactions with SAC600 3/1 are spontaneous at lower temperatures and less spontaneous at higher temperatures. The negative value of ΔH indicates the exothermic nature of the adsorption process in the studied temperature range [33]. The negative ΔS value denotes the affinity of SAC600 3/1 for Cr(VI) ions with less randomness at the adsorbent solid-solution interface during the adsorption of Cr(VI) [75].

3.3.4. Influence of AC Pre-Treatment with Magnesium Chloride

The effect of magnesium ions on the surface and pores of SAC600 3/1 was investigated for its prospective application as a promoter of hexavalent chromium adsorption. In the present study, Sargassum AC impregnated with an aqueous magnesium chloride solution was utilized and compared to non-modified SAC600 3/1 for the sorption of Cr6+.
Figure 5c demonstrates that impregnating SAC600 3/1 with Mg2+ ions before adsorption, increased the adsorption capacity of the adsorbent by 5.6%. The efficient loading of magnesium ions on the adsorbent surface might give more sorption sites. Mg2+ ions have a very small radius of 79 pm, which enables them to penetrate all the cavities of the activated carbon, embedding themselves in the walls of the micropores and mesopores. This allows the AC surface to be more positively charged, resulting in a higher affinity for anions pollutants in aqueous solution [76,77], and so, promoting the attraction of chromium anions such as HCrO4 and Cr2O72.

3.3.5. Adsorption Kinetics

The uptake of chromium from solution by SAC600 3/1 increased with contact time and attained equilibrium after 24 h at 30 °C. However, 64% of the Cr6+ adsorption occurred in the first 15 min of contact in a very fast adsorption process. After 30 min, the removal percentage was 73%. This high adsorption speed is justified by the large specific surface area of both activated carbons and the presence of hydrophilic functional groups. The results of these experiments are shown in Figure 5d.
After one hour of contact, both activated carbons had comparable outcomes. However, after the first hour, SAC600 3/1 showed a greater adsorption capability. The FTIR and XPS analyses revealed that SAC600 3/1 contained more oxygenated groups, which could improve the electrostatic attraction, hence promoting the adsorption of dichromate, presumably, by electrostatic interactions of the Van der Waals type.
Four kinetic models, pseudo-first-order, pseudo-second-order type 1, pseudo-second-order type 2, and intraparticle diffusion model, were employed to analyze the adsorption mechanism [78]. The following equations represent the different models [79]:
Equation (14) Pseudo-first order.
log q e q t = l o g ( q e ) K 1 2.303   ·   t
Equation (15) Pseudo-second order Type 1.
1 q t = 1 K 2   ·   q e 2 + t q e
Equation (16) Pseudo-second order Type 2.
1 q t = 1 K 2   ·   q e 2   ·   1 t + t q e
Equation (17) Intraparticle diffusion model.
q t = k i p   ·   t 0.5 + C i
where qt is the amount of adsorbate adsorbed at time t (mg·g−1), qe is the amount of adsorbate adsorbed at equilibrium (mg·g−1), t is the time (min), k1 is the rate constant of the pseudo-first-order kinetics (min–1), k2 is the rate constant of the pseudo-second-order kinetics (g·mg−1·min−1), kip the rate constant for intraparticle diffusion (mg·g−1·min−0.5) and Ci (mg·g−1) is constant and gives information about the thickness of the boundary layer: A larger value of Ci suggests high boundary layer effect.
Table 6 summarizes the results obtained from the different models.
The best-fit model for SAC600 3/1 and SBP10 was the pseudo-second-order model, which had a correlation coefficient of 0.9973 and 0.9999, respectively. The pseudo-second-order equation describes the solid-liquid reaction and their adsorption kinetics mechanism, demonstrating that available active sites play a more important role in the adsorption process rather than Cr(VI) concentration [78,80]. Furthermore, the rate of a chemical reaction influences the availability of active sites on the surface of porous carbon materials [81,82,83,84]. Therefore, this model also indicated that chemisorption can partially influence the rate-controlling step in the adsorption processes. Several researchers have observed comparable results when utilizing biosorbents, biochars and activated carbons for the removal of Cr6+ [85,86,87].
The inapplicability of the intra-particle diffusion model further suggested that the rate of Cr(VI) ion adsorption was not driven by pore or intraparticle diffusion [88,89,90].
In conclusion, it is quite likely that total sorption is a combination of physisorption and chemisorption, where physisorption is the main process.

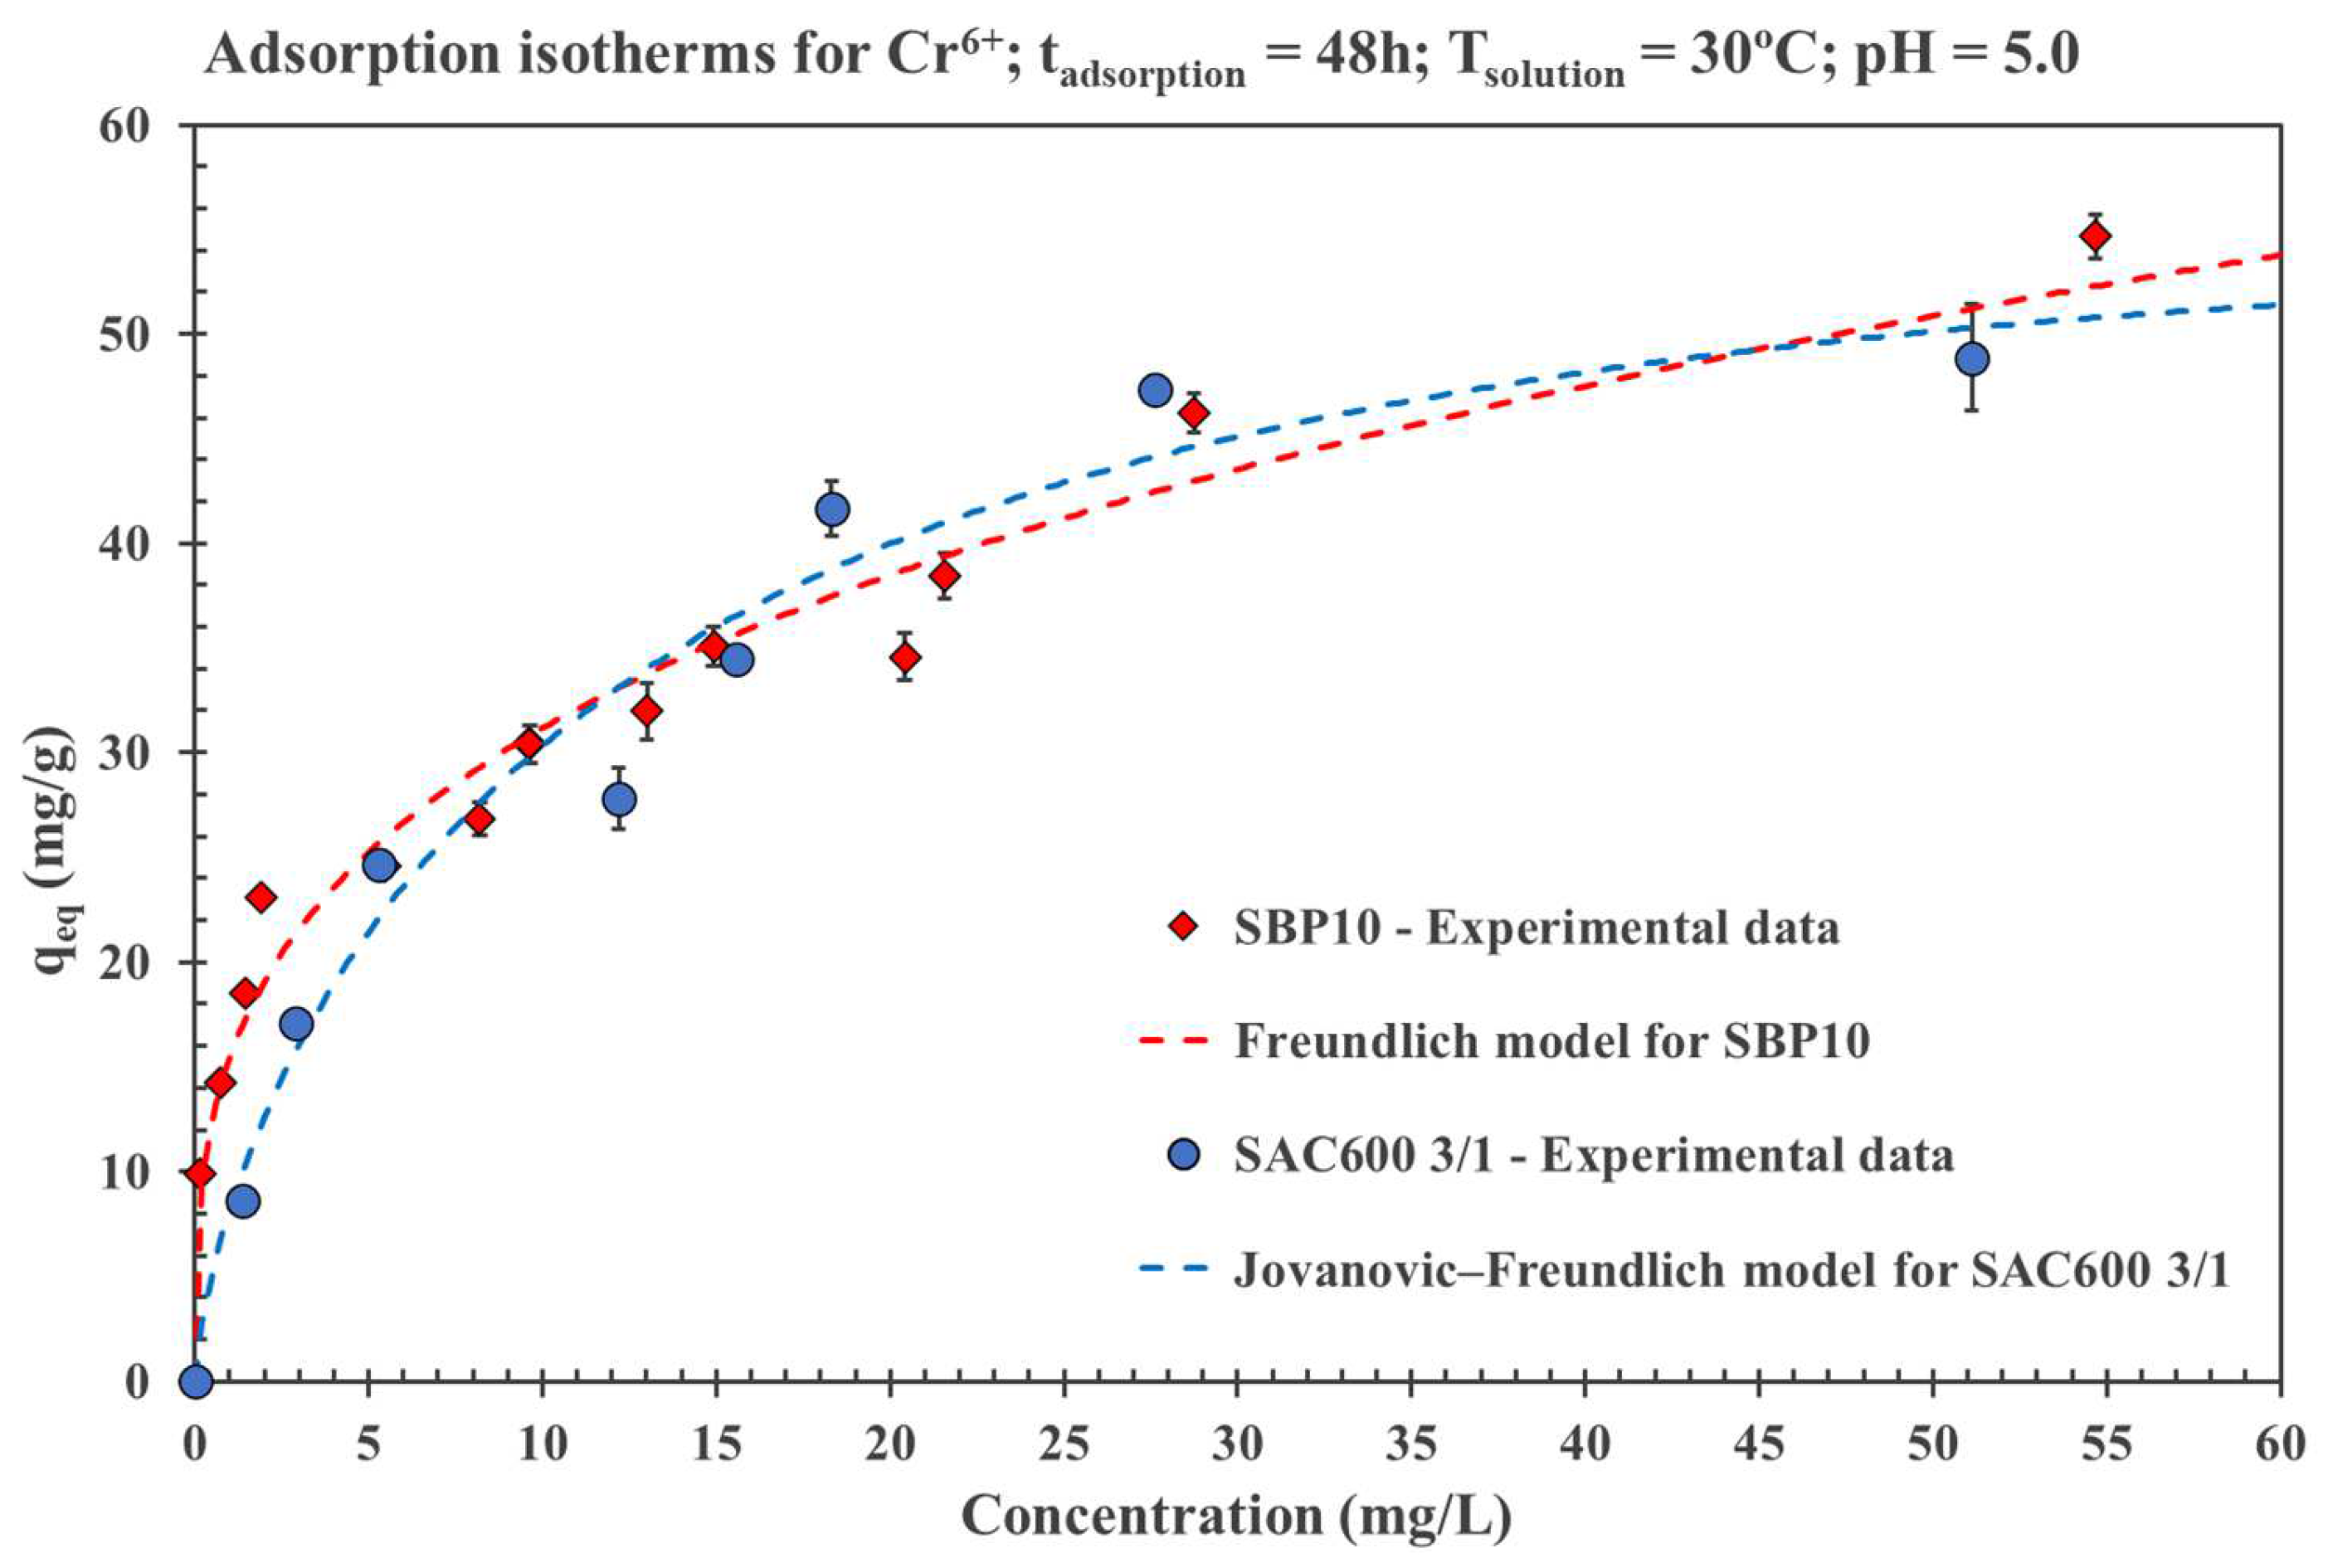
3.3.6. Adsorption Isotherms

Langmuir, Jovanovic, Fowler, Freundlich, Jovanovic-Freundlich and Fowler-Guggenheim/Langmuir-Freundlich nonlinear models were used to match the experimental adsorption isotherms. The calculations were performed for both activated carbons, SAC600 3/1 and SBP10. The experiments were conducted at 30 °C with an initial pH of 5.0.
Table 7 summarizes the calculated parameters of the six models.
The Jovanovic-Freundlich isotherm was found to be the best fit for Cr(VI) adsorption onto SAC600 3/1, describing the heterogeneous adsorption with no lateral interactions [41].The Langmuir model estimated a maximum adsorption capacity of 54.54 mg/g with a correlation coefficient (R2) value of 0.9728 providing a more accurate description of the experimental data. SAC600 3/1, which was synthesized from Sargassum seaweed, demonstrated competitive results with similar published studies [63,75].
On the other hand, the commercial AC (SBP10) revealed that the Freundlich model fitted well with the experimental parameters, having a R2 of 0.9749, which explains the non-linear monolayer and heterogeneous chemisorption [91]. This suggests that Cr(VI) adsorption is enhanced on heterogeneous surfaces, resulting in multilayer adsorption at the binding sites between the surface functional groups of SBP10 and Cr(VI) ions [92]. A maximum adsorption capacity of 45.88 mg/g was obtained for SBP10.
The surfaces of the examined activated carbons are highly heterogeneous. This is mainly due to their pore size distribution and the presence of functional groups on the AC surface. Despite that the Langmuir equation is still frequently employed to evaluate adsorption isotherms on ACs, it is unsurprising that frequently used models similar to Langmuir and Jovanovic do not fit the data well for the examined ACs as these models are more representative of homogeneous surfaces.
The best models for each AC and the experimental are shown Figure 6.
Both AC, SAC600 3/1 and SBP10, have comparable adsorption capacities. Although the adsorption of SBP10 is faster initially, the maximum adsorption capacities of both AC are similar. Despite the higher specific surface area of SBP10, the maximum adsorption capacity of SAC600 3/1 is slightly greater. This is potentially due to the higher pore volume of SAC600 3/1.

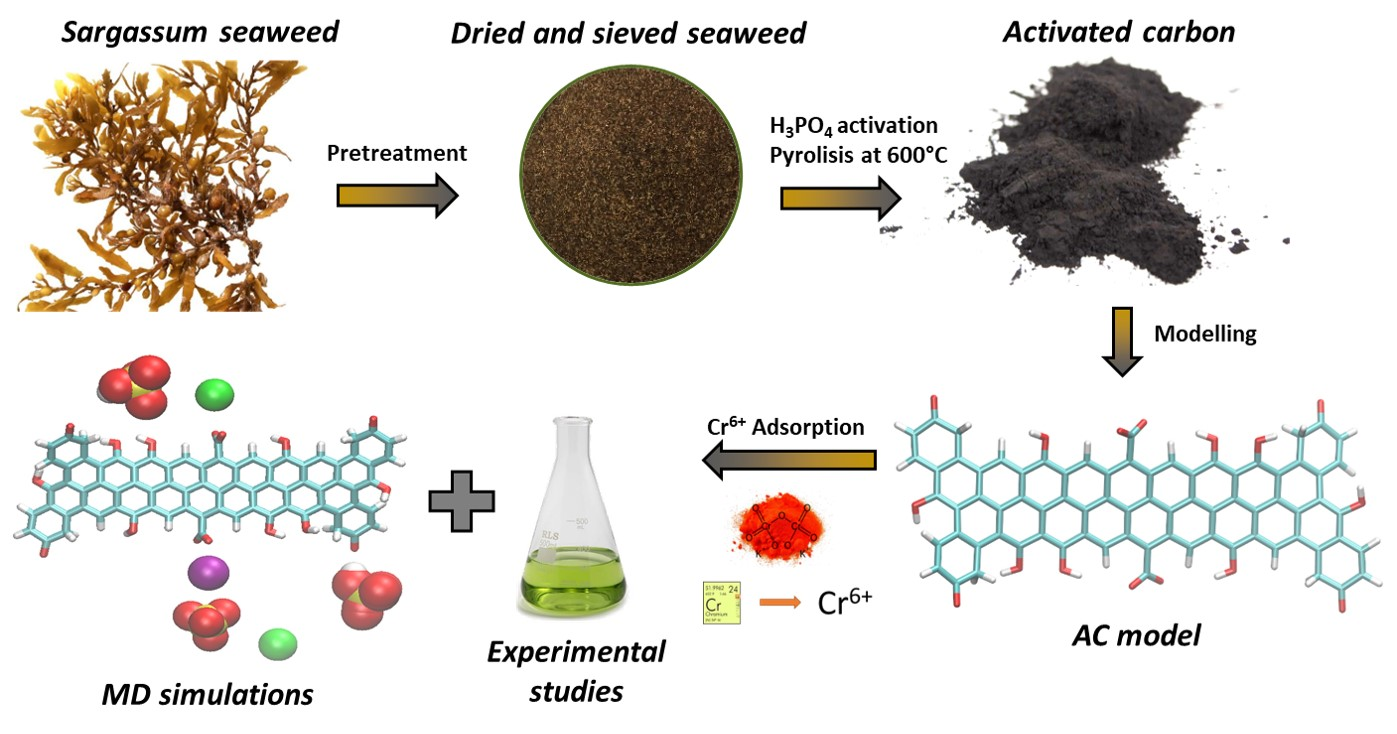
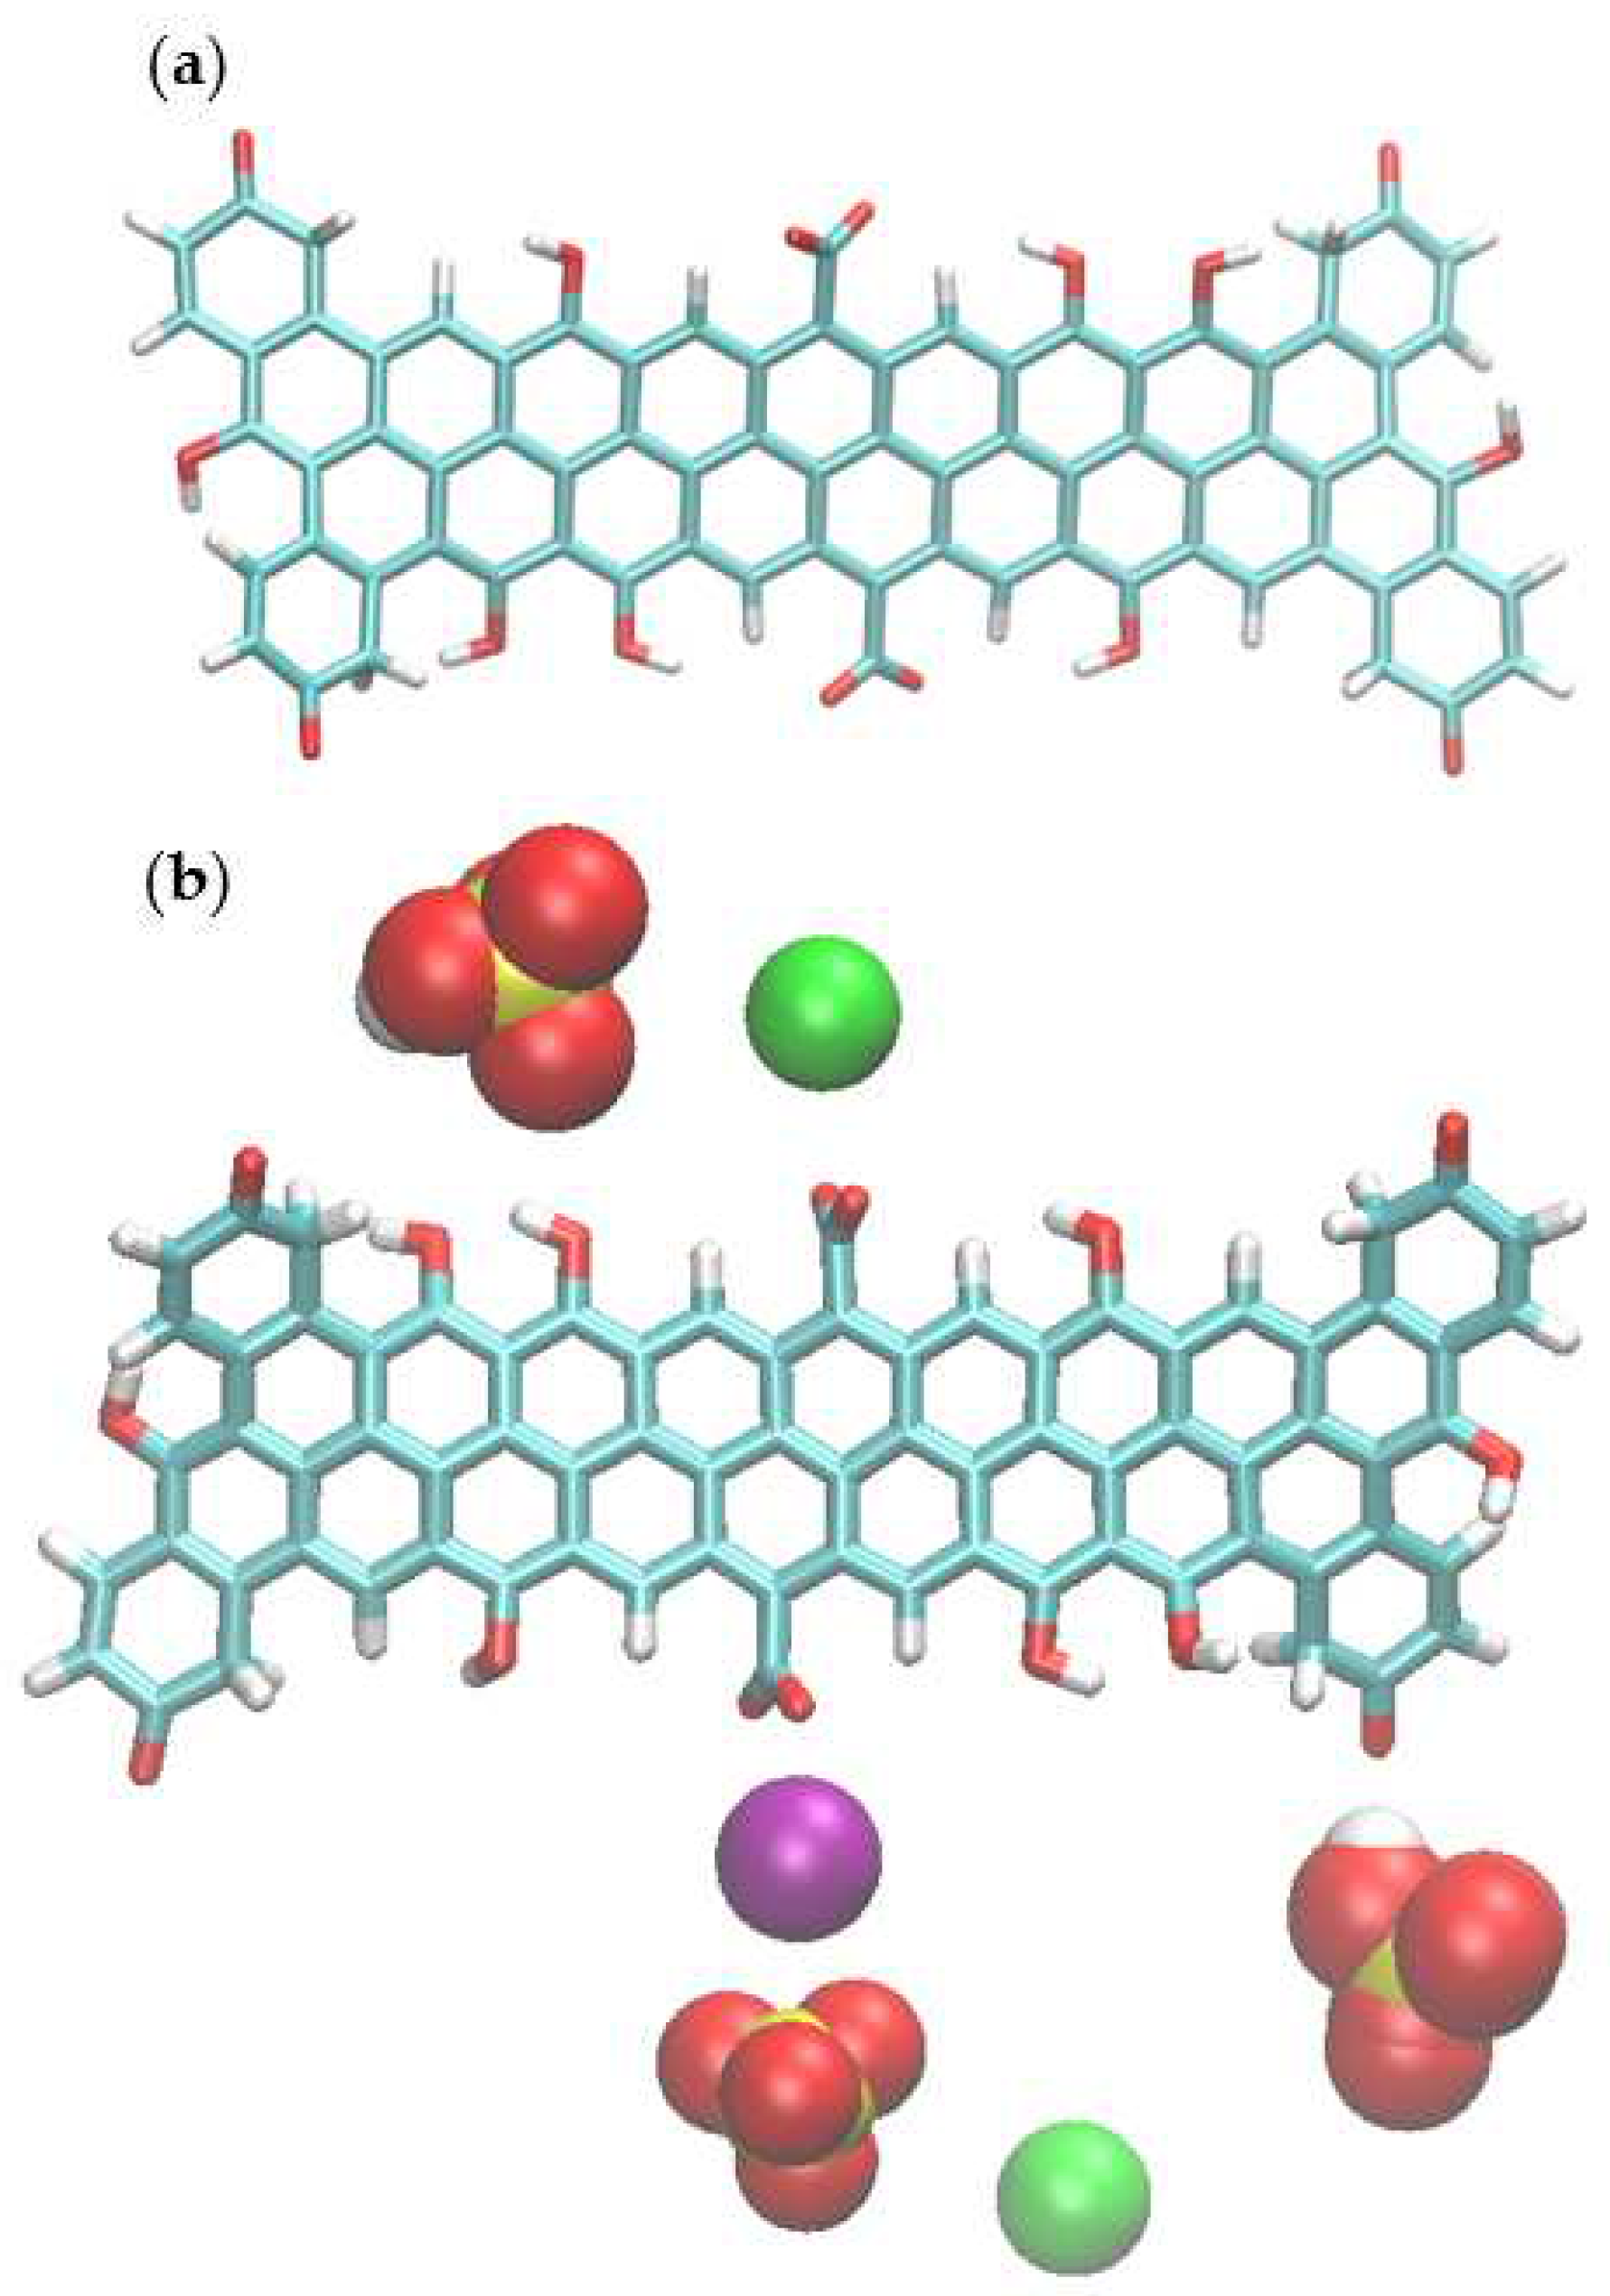
3.4. Molecular Dynamics Simulations

To support the experimental results of Cr6+ adsorption on activated carbon at the molecular level, classical MD simulations were performed, and trajectories were analyzed. In order to quantify the adsorption of different species of hexavalent chromium ions in the simulations, radial distribution function (RDF), denoted as g(r), is used. The radial distribution function describes the probability distribution of finding a particle in the distance of r from another particle. This property can be calculated from the atomic positions of MD simulation by the analysis of trajectory. The radial distribution function of K+, HCrO4 and CrO42 ions around activated carbon molecule is depicted in Figure 7.
The radial distribution functions show sharp peaks at the distance (r) of around 0.2 nm for K+ ions from the surface of activated carbon which proves that the K+ ions are adsorbed by carboxylate groups of activated carbon. By closer investigation of RDF, it can be observed that the peak intensity of K+ ions decreased when the pH of the solution increased from 5 to 7 which supports the idea that the K+ ions in the solution have less attraction to the surface of AC as the number of doubly charged CrO42− is increased in the solutions, therefore, K+ ions tend to make contact ion pair with CrO42− ions. The same trend for a peak intensity of K+ at the distance of about 1 nm also is visible which shows that a similar phenomenon is happening on the adsorption of K+ to the surface of activated carbon. Moreover, RDF plots show that the hexavalent chromium ions namely HCrO4 and CrO42− adsorption decreased when the pH of the solution is increased from 5 to 7 which is in agreement with experimental results. The reason why the increase in pH decreases the adsorption of hexavalent chromium ions at the surface of activated carbon is due to the fact that the ratio of HCrO4/CrO42− decreases therefore the hydrogen bonds of HCrO4 with carboxylate groups (-COO) is disrupted and only CrO42− ions can interact with -OH groups of the surface.
In addition, the experimental results showed that the impregnation of activated carbon with Mg2+ ions prior to the adsorption experiment, improves the adsorption of hexavalent chromium at the surface of AC. Therefore, MD simulations have been performed for the same system to understand the mechanism of the adsorption process. Radial distribution functions of the systems containing MgCl2 are shown in Figure 8 where the peak intensities for both HCrO4 and CrO42− anions slightly increased which is in agreement with experimental results.
The atomic type, bond type, valence-angle type and dihedral-angle type parameters of the previous DM simulations can be found in the Supplementary Materials (Tables S1–S4). A comparison of vibrational frequencies (cm−1) of vacuum Cr6+ anions as calculated in DFT (PBE0/Aug-CC-pVDZ) and in force field (FF) using the fitted parameters can be found in Table S5.

4. Conclusions

The valorization of invasive Sargassum seaweed as a source material for the production of AC was assessed in this paper. A Sargassum AC was synthesized at 600 °C using a chemical impregnation mass ratio of 3/1 (H3PO4 85%/dried Sargassum seaweed). A high specific surface area of 1695 m2/g and a highly fictionalized surface were found for SAC600 3/1 indicating the potential use of Sargassum sp. as an interesting precursor for multiple applications. The pH of the solution was identified as the most important parameter for the adsorption performance. In a very acidic medium (pH around 2 or below), the Cr(VI) removal percentage was around 100%. On the other hand, the increase of solution pH dramatically reduces the adsorption capacity of the studied AC. Indeed, the removal percentage of Cr6+ at pH 9 was almost negligible. In the same way, the increase in the solution temperature, from 25 °C to 35 °C, slightly reduced the chromium uptake indicating the existence of an exothermic process. To improve the chromium adsorption capacity, magnesium chloride was employed as an activated carbon surface modifier resulting in a 5% increase compared to the AC without magnesium chloride. The adsorption behavior of Cr6+ on SAC600 3/1 and SBP10 may be described using a type 1 pseudo-second-order kinetic model. Moreover, the Jovanovic-Freundlich and the Freundlich adsorption isotherm were more appropriate to represent the Cr6+ adsorption mechanism onto both adsorbents, SAC600 3/1 and SBP10, respectively. The molecular dynamics simulations confirmed the experimental findings. Thus, the increase of solution pH causes a decrease in adsorption of hexavalent chromium anions on the surface of the AC. MD simulations and in particular, radial distribution functions (RDFs) analysis indicated that the hydroxyl and carboxylate groups of the activated carbon are the most influential functional groups for the interplay of solute-solvent interaction in the adsorption process of chromium anions. Moreover, MD simulations confirmed experimental results showing that the addition of MgCl2 to the surface of SAC600 3/1 increases the adsorption of anions. In conclusion, SAC600 3/1 can be potentially used as an effective and environmentally acceptable adsorbent to enhance the removal of Cr6+ from aqueous solution, and it could also provide a theoretical foundation for the removal of toxic heavy metals from water.

Supplementary Materials

The following supporting information can be downloaded at: https://www.mdpi.com/article/10.3390/molecules27186040/s1. Table S1. Atomic type parameters: atomic masses [AMU] and Lennard-Jones-potential parameters R [Å] and ε [kcal/mol]. Table S2. Bond type parameters: harmonic-potential force constant kB [kcal/mol/Å2] and equilibrium distance r0 [Å]. Table S3. Valence-angle type parameters: harmonic-potential force constant kA [kcal/mol/deg2] and equilibrium angle value φ0 [deg]. Table S4. Dihedral-angle type parameters: force constant kD [kcal/mol], equilibrium angle value φ0 [deg] and periodicity n (negative value denotes multi-term potential form. Table S5. Comparison of vibrational frequencies (cm−1) of vacuum Cr(VI) anions as calculated in DFT (PBE0/Aug-CC-pVDZ) and in force field (FF) using the fitted parameters. The frequencies were calculated by the harmonic-approximation approach from the second derivatives of the total energy with respect to atomic coordinates. Figure S1. Atom types (red symbols), atomic point charges (black numbers, atomic units) and indicated inter-atomic bonding (black lines) in (a) CrO42−, (b) HCrO4, and (c) Cr2O72− anions. Figure S2. Plot of ln(Keq) vs. 1/K.

Author Contributions

Y.A.-G.: conceptualization, data curation, formal analysis, investigation, methodology, validation, visualization, writing—original draft. Z.F.: conceptualization, data curation, formal analysis, methodology, software, validation, writing—review and editing. B.M.: conceptualization, data curation, formal analysis, methodology, software, validation, writing—review and editing. M.F.: data curation, formal analysis, investigation, methodology, validation. C.J.-M.: resources. N.B.: funding acquisition, resources. C.Y.: writing—review and editing. U.J.J.-H.: supervision, validation, writing—review and editing. S.G.: project administration, supervision, validation, writing—review and editing. All authors have read and agreed to the published version of the manuscript.

Funding

The authors acknowledge the French Ministry of Higher Education, Research and Innovation (MESRI, Ministère de l’Enseignement Supérieur, de la Recherche et de l’Innovation), the National Association for Research and Technology (ANRT, Association Nationale de la Recherche et la Technologie) and their system of industrial agreements on training through research, (CIFRE) Conventions Industrielles de Formation par la Recherche) for providing financial support to the private company NBC SARL to recruit a young doctoral student in order to develop a research project in collaboration with the COVACHIM-M2E laboratory (Connaissance et Valorisation: Chimie des matériaux Environnement, Energie) of the University of the West Indies (Université des Antilles, Guadeloupe, France).

Institutional Review Board Statement

Not applicable.

Informed Consent Statement

Not applicable.

Data Availability Statement

The data presented in this study are available in the manuscript and Supplementary Materials.

Acknowledgments

We are grateful for the computational resources supplied by the project “e-Infrastruktura CZ” (e-INFRA CZ LM2018140) supported by the Ministry of Education, Youth, and Sports of the Czech Republic. The authors also want to thank the Laboratory of Structural Biology and Bioinformatics of the Institute of Microbiology of the Czech Academy of Sciences for their support during the development of molecular dynamics simulations of this study.

Conflicts of Interest

The authors declare no conflict of interest.

References

  1. Wang, M.; Hu, C.; Barnes, B.B.; Mitchum, G.; Lapointe, B.; Montoya, J.P. The great Atlantic Sargassum belt. Science 2019, 365, 83–87. [Google Scholar] [CrossRef] [PubMed]
  2. Desrochers, A. Sargassum Uses Guide: A Resource for Caribbean Researchers, Entrepreneurs and Policy Makers; CERMES Technical Report; Cave Hill: Barbados, Caribbean, 2020. [Google Scholar]
  3. Liranzo-Gómez, R.E.; García-Cortés, D.; Jáuregui-Haza, U. Adaptation and Sustainable Management of Massive Influx of Sargassum in the Caribbean. Procedia Environ. Sci. Eng. Manag. 2021, 8, 543–553. [Google Scholar]
  4. Barquilha, C.; Cossich, E.; Tavares, C.; Silva, E. Biosorption of nickel(II) and copper(II) ions by Sargassum sp. in nature and alginate extraction products. Bioresour. Technol. Rep. 2018, 5, 43–50. [Google Scholar] [CrossRef]
  5. He, J.; Chen, J.P. A comprehensive review on biosorption of heavy metals by algal biomass: Materials, performances, chemistry, and modeling simulation tools. Bioresour. Technol. 2014, 160, 67–78. [Google Scholar] [CrossRef]
  6. Ranguin, R.; Delannoy, M.; Yacou, C.; Jean-Marius, C.; Feidt, C.; Rychen, G.; Gaspard, S. Biochar and activated carbons preparation from invasive algae Sargassum spp. for Chlordecone availability reduction in contaminated soils. J. Environ. Chem. Eng. 2021, 9, 105280. [Google Scholar] [CrossRef]
  7. Francoeur, M.; Ferino-Pérez, A.; Yacou, C.; Jean-Marius, C.; Emmanuel, E.; Chérémond, Y.; Jauregui-Haza, U.; Gaspard, S. Activated carbon synthetized from Sargassum (sp) for adsorption of caffeine: Understanding the adsorption mechanism using molecular modeling. J. Environ. Chem. Eng. 2020, 9, 104795. [Google Scholar] [CrossRef]
  8. Esmaeili, A.; Ghasemi, S.; Zamani, F. Investigation of Cr(VI) Adsorption by Dried Brown Algae Sargassum Sp. and Its Activated Carbon. Iran. J. Chem. Chem. Eng. (IJCCE) 2012, 31, 11–19. [Google Scholar] [CrossRef]
  9. Song, X.; Zhang, Y.; Cao, N.; Sun, D.; Zhang, Z.; Wang, Y.; Wen, Y.; Yang, Y.; Lyu, T. Sustainable Chromium (VI) Removal from Contaminated Groundwater Using Nano-Magnetite-Modified Biochar via Rapid Microwave Synthesis. Molecules 2020, 26, 103. [Google Scholar] [CrossRef]
  10. Tripathi, S.M.; Chaurasia, S. Detection of Chromium in surface and groundwater and its bio-absorption using bio-wastes and vermiculite. Eng. Sci. Technol. Int. J. 2020, 23, 1153–1161. [Google Scholar] [CrossRef]
  11. Wang, F.; Zhang, Y.; Fang, Q.; Li, Z.; Lai, Y.; Yang, H. Prepared PANI@nano hollow carbon sphere adsorbents with lappaceum shell like structure for high efficiency removal of hexavalent chromium. Chemosphere 2020, 263, 128109. [Google Scholar] [CrossRef]
  12. Singh, S.; Anil, A.G.; Khasnabis, S.; Kumar, V.; Nath, B.; Adiga, V.; Naik, T.S.K.; Subramanian, S.; Kumar, V.; Singh, J.; et al. Sustainable removal of Cr(VI) using graphene oxide-zinc oxide nanohybrid: Adsorption kinetics, isotherms and thermodynamics. Environ. Res. 2021, 203, 111891. [Google Scholar] [CrossRef]
  13. Gómez-Aguilar, D.L.; Esteban-Muñoz, J.A.; Rodríguez-Miranda, J.P.; Baracaldo-Guzmán, D.; Salcedo-Parra, O.J. Desorption of Coffee Pulp Used as an Adsorbent Material for Cr(III and VI) Ions in Synthetic Wastewater: A Preliminary Study. Molecules 2022, 27, 2170. [Google Scholar] [CrossRef]
  14. Peng, H.; Guo, J. Removal of chromium from wastewater by membrane filtration, chemical precipitation, ion exchange, adsorption electrocoagulation, electrochemical reduction, electrodialysis, electrodeionization, photocatalysis and nanotechnology: A review. Environ. Chem. Lett. 2020, 18, 2055–2068. [Google Scholar] [CrossRef]
  15. Hoang, A.T.; Nižetić, S.; Cheng, C.K.; Luque, R.; Thomas, S.; Banh, T.L.; Pham, V.V.; Nguyen, X.P. Heavy metal removal by biomass-derived carbon nanotubes as a greener environmental remediation: A comprehensive review. Chemosphere 2021, 287, 131959. [Google Scholar] [CrossRef]
  16. Fang, Y.; Yang, K.; Zhang, Y.; Peng, C.; Robledo-Cabrera, A.; López-Valdivieso, A. Highly surface activated carbon to remove Cr(VI) from aqueous solution with adsorbent recycling. Environ. Res. 2021, 197, 111151. [Google Scholar] [CrossRef]
  17. Tu, B.; Wen, R.; Wang, K.; Cheng, Y.; Deng, Y.; Cao, W.; Zhang, K.; Tao, H. Efficient removal of aqueous hexavalent chromium by activated carbon derived from Bermuda grass. J. Colloid Interface Sci. 2019, 560, 649–658. [Google Scholar] [CrossRef]
  18. Tran, Q.H.; Tam, L.T.; Van Quy, N.; Phan, V.N.; Van Tuan, H.; Huy, T.Q.; Dinh, N.X.; Le, A.-T. Enhanced adsorption efficiency of inorganic chromium (VI) ions by using carbon-encapsulated hematite nanocubes. J. Sci. Adv. Mater. Devices 2020, 5, 392–399. [Google Scholar] [CrossRef]
  19. Xu, S.; Yu, W.; Liu, S.; Xu, C.; Li, J.; Zhang, Y. Adsorption of Hexavalent Chromium Using Banana Pseudostem Biochar and Its Mechanism. Sustainability 2018, 10, 4250. [Google Scholar] [CrossRef]
  20. Guo, X.; Liu, A.; Lu, J.; Niu, X.; Jiang, M.; Ma, Y.; Liu, X.; Li, M. Adsorption Mechanism of Hexavalent Chromium on Biochar: Kinetic, Thermodynamic, and Characterization Studies. ACS Omega 2020, 5, 27323–27331. [Google Scholar] [CrossRef]
  21. Asimakopoulos, G.; Baikousi, M.; Kostas, V.; Papantoniou, M.; Bourlinos, A.B.; Zbořil, R.; Karakassides, M.A.; Salmas, C.E. Nanoporous Activated Carbon Derived via Pyrolysis Process of Spent Coffee: Structural Characterization. Investigation of Its Use for Hexavalent Chromium Removal. Appl. Sci. 2020, 10, 8812. [Google Scholar] [CrossRef]
  22. Valdivia, A.E.O.; Osorio, C.M.; Rodríguez, Y.M.V. Preparation of Activated Carbon from Coffee Waste as an Adsorbent for the Removal of Chromium (III) from Water. Optimization for an Experimental Box-Behnken Design. Chemistry 2020, 2, 2. [Google Scholar] [CrossRef] [Green Version]
  23. Enniya, I.; Rghioui, L.; Jourani, A. Adsorption of hexavalent chromium in aqueous solution on activated carbon prepared from apple peels. Sustain. Chem. Pharm. 2018, 7, 9–16. [Google Scholar] [CrossRef]
  24. Politi, D.; Sidiras, D. Modified Spruce Sawdust for Sorption of Hexavalent Chromium in Batch Systems and Fixed-Bed Columns. Molecules 2020, 25, 5156. [Google Scholar] [CrossRef] [PubMed]
  25. Ntuli, T.; Mongwe, T.; Sikeyi, L.; Mkhari, O.; Coville, N.; Nxumalo, E.; Maubane-Nkadimeng, M. Removal of hexavalent chromium via an adsorption coupled reduction mechanism using olive oil derived carbon nano-onions. Environ. Nanotechnol. Monit. Manag. 2021, 16, 100477. [Google Scholar] [CrossRef]
  26. Prabu, D.; Kumar, P.S.; Rathi, B.S.; Sathish, S.; Anand, K.V.; Kumar, J.A.; Mohammed, O.B.; Silambarasan, P. Feasibility of magnetic nano adsorbent impregnated with activated carbon from animal bone waste: Application for the chromium (VI) removal. Environ. Res. 2021, 203, 111813. [Google Scholar] [CrossRef]
  27. Sarojini, G.; Babu, S.V.; Rajamohan, N.; Kumar, P.S.; Rajasimman, M. Surface modified polymer-magnetic-algae nanocomposite for the removal of chromium- equilibrium and mechanism studies. Environ. Res. 2021, 201, 111626. [Google Scholar] [CrossRef]
  28. Rambabu, K.; Bharath, G.; Banat, F.; Show, P.L. Biosorption performance of date palm empty fruit bunch wastes for toxic hexavalent chromium removal. Environ. Res. 2020, 187, 109694. [Google Scholar] [CrossRef]
  29. Kumar, A.; Jena, H.M. Adsorption of Cr(VI) from aqueous solution by prepared high surface area activated carbon from Fox nutshell by chemical activation with H3PO4. J. Environ. Chem. Eng. 2017, 5, 2032–2041. [Google Scholar] [CrossRef]
  30. Li, Y.; Zhu, S.; Liu, Q.; Chen, Z.; Gu, J.; Zhu, C.; Lu, T.; Zhang, D.; Ma, J. N-doped porous carbon with magnetic particles formed in situ for enhanced Cr(VI) removal. Water Res. 2013, 47, 4188–4197. [Google Scholar] [CrossRef]
  31. Chen, S.; Wang, J.; Wu, Z.; Deng, Q.; Tu, W.; Dai, G.; Zeng, Z.; Deng, S. Enhanced Cr(VI) removal by polyethylenimine- and phosphorus-codoped hierarchical porous carbons. J. Colloid Interface Sci. 2018, 523, 110–120. [Google Scholar] [CrossRef]
  32. Chen, F.; Zhang, M.; Ma, L.; Ren, J.; Ma, P.; Li, B.; Wu, N.; Song, Z.; Huang, L. Nitrogen and sulfur codoped micro-mesoporous carbon sheets derived from natural biomass for synergistic removal of chromium(VI): Adsorption behavior and computing mechanism. Sci. Total Environ. 2020, 730, 138930. [Google Scholar] [CrossRef]
  33. Emamy, F.; Bumajdad, A.; Lukaszewicz, J. Adsorption of Hexavalent Chromium and Divalent Lead Ions on the Nitrogen-Enriched Chitosan-Based Activated Carbon. Nanomaterials 2021, 11, 1907. [Google Scholar] [CrossRef]
  34. Zhang, H.; Yue, X.; Li, F.; Xiao, R.; Zhang, Y.; Gu, D. Preparation of rice straw-derived biochar for efficient cadmium removal by modification of oxygen-containing functional groups. Sci. Total Environ. 2018, 631-632, 795–802. [Google Scholar] [CrossRef]
  35. Ma, W.; Xie, L.; Dai, L.; Sun, G.; Chen, J.; Su, F.; Cao, Y.; Lei, H.; Kong, Q.; Chen, C.-M. Influence of phosphorus doping on surface chemistry and capacitive behaviors of porous carbon electrode. Electrochim. Acta 2018, 266, 420–430. [Google Scholar] [CrossRef]
  36. Borthakur, P.; Aryafard, M.; Zara, Z.; David, Ř.; Minofar, B.; Das, M.R.; Vithanage, M. Computational and experimental assessment of pH and specific ions on the solute solvent interactions of clay-biochar composites towards tetracycline adsorption: Implications on wastewater treatment. J. Environ. Manag. 2021, 283, 111989. [Google Scholar] [CrossRef]
  37. Wei, F.; Zhang, H.-F.; He, X.-J.; Ma, H.; Dong, S.-A.; Xie, X.-Y. Synthesis of porous carbons from coal tar pitch for high-performance supercapacitors. New Carbon Mater. 2019, 34, 132–139. [Google Scholar] [CrossRef]
  38. Poghossian, A. Determination of the pHpzc of insulators surface from capacitance–voltage characteristics of MIS and EIS structures. Sens. Actuators B Chem. 1997, 44, 551–553. [Google Scholar] [CrossRef]
  39. Şahin, Y.; Öztürk, A. Biosorption of chromium(VI) ions from aqueous solution by the bacterium Bacillus thuringiensis. Process Biochem. 2005, 40, 1895–1901. [Google Scholar] [CrossRef]
  40. Park, J.E.; Shin, J.-H.; Oh, W.; Choi, S.-J.; Kim, J.; Kim, C.; Jeon, J. Removal of Hexavalent Chromium(VI) from Wastewater Using Chitosan-Coated Iron Oxide Nanocomposite Membranes. Toxics 2022, 10, 98. [Google Scholar] [CrossRef]
  41. Durimel, A.; Altenor, S.; Miranda-Quintana, R.; Du Mesnil, P.C.; Jauregui-Haza, U.; Gadiou, R.; Gaspard, S. pH dependence of chlordecone adsorption on activated carbons and role of adsorbent physico-chemical properties. Chem. Eng. J. 2013, 229, 239–249. [Google Scholar] [CrossRef]
  42. Khan, T.; Manan, T.S.B.A.; Isa, M.H.; Ghanim, A.A.J.; Beddu, S.; Jusoh, H.; Iqbal, M.S.; Ayele, G.T.; Jami, M.S. Modeling of Cu(II) Adsorption from an Aqueous Solution Using an Artificial Neural Network (ANN). Molecules 2020, 25, 3263. [Google Scholar] [CrossRef]
  43. Sych, N.; Trofymenko, S.; Poddubnaya, O.; Tsyba, M.; Sapsay, V.; Klymchuk, D.; Puziy, A. Porous structure and surface chemistry of phosphoric acid activated carbon from corncob. Appl. Surf. Sci. 2012, 261, 75–82. [Google Scholar] [CrossRef]
  44. Zhang, Z.; Flaherty, D.W. Modified potentiometric titration method to distinguish and quantify oxygenated functional groups on carbon materials by pKa and chemical reactivity. Carbon 2020, 166, 436–445. [Google Scholar] [CrossRef]
  45. Wang, J.; Wang, W.; Kollman, P.A.; Case, D.A. Automatic atom type and bond type perception in molecular mechanical calculations. J. Mol. Graph. Model. 2006, 25, 247–260. [Google Scholar] [CrossRef] [PubMed]
  46. Wang, J.; Wolf, R.M.; Caldwell, J.W.; Kollman, P.A.; Case, D.A. Development and testing of a general amber force field. J. Comput. Chem. 2004, 25, 1157–1174. [Google Scholar] [CrossRef] [PubMed]
  47. Maier, J.A.; Martinez, C.; Kasavajhala, K.; Wickstrom, L.; Hauser, K.E.; Simmerling, C. ff14SB: Improving the accuracy of protein side chain and backbone parameters from ff99SB. J. Chem. Theory Comput. 2015, 11, 3696–3713. [Google Scholar] [CrossRef] [PubMed]
  48. Hess, B.; Bekker, H.; Berendsen, H.J.C.; Fraaije, J.G.E.M. LINCS: A Linear Constraint Solver for Molecular Simulations. J. Comput. Chem. 1997, 18, 1463–1472. [Google Scholar] [CrossRef]
  49. Darden, T.; York, D.; Pedersen, L. Particle mesh Ewald: An N⋅log(N) method for Ewald sums in large systems. J. Chem. Phys. 1993, 98, 10089–10092. [Google Scholar] [CrossRef]
  50. Bussi, G.; Donadio, D.; Parrinello, M. Canonical sampling through velocity rescaling. J. Chem. Phys. 2007, 126, 014101. [Google Scholar] [CrossRef]
  51. Lindahl, E.; Hess, B.; Van Der Spoel, D. GROMACS 3.0: A package for molecular simulation and trajectory analysis. J. Mol. Model. 2001, 7, 306–317. [Google Scholar] [CrossRef]
  52. Humphrey, W.; Dalke, A.; Schulten, K. VMD: Visual molecular dynamics. J. Mol. Graph. 1996, 14, 33–38. [Google Scholar] [CrossRef]
  53. Kumar, K.V.; Gadipelli, S.; Wood, B.; Ramisetty, K.A.; Stewart, A.A.; Howard, C.A.; Brett, D.J.L.; Rodriguez-Reinoso, F. Characterization of the adsorption site energies and heterogeneous surfaces of porous materials. J. Mater. Chem. A 2019, 7, 10104–10137. [Google Scholar] [CrossRef]
  54. Thommes, M.; Kaneko, K.; Neimark, A.V.; Olivier, J.P.; Rodriguez-Reinoso, F.; Rouquerol, J.; Sing, K.S.W. Physisorption of gases, with special reference to the evaluation of surface area and pore size distribution (IUPAC Technical Report). Pure Appl. Chem. 2015, 87, 1051–1069. [Google Scholar] [CrossRef]
  55. Liu, Z.; Adewuyi, Y.G.; Shi, S.; Chen, H.; Li, Y.; Liu, D.; Liu, Y. Removal of gaseous Hg0 using novel seaweed biomass-based activated carbon. Chem. Eng. J. 2019, 366, 41–49. [Google Scholar] [CrossRef]
  56. Ding, S.; Liu, Y. Adsorption of CO2 from flue gas by novel seaweed-based KOH-activated porous biochars. Fuel 2019, 260, 116382. [Google Scholar] [CrossRef]
  57. Khalil, K.M.; Elhamdy, W.A.; Elsamahy, A.A. Biomass derived P−doped activated carbon as nanostructured mesoporous adsorbent for chromium(VI) pollutants with pronounced functional efficiency and recyclability. Colloids Surf. A Physicochem. Eng. Asp. 2022, 641, 128553. [Google Scholar] [CrossRef]
  58. Yang, Y.; Cannon, F.S. Biomass activated carbon derived from pine sawdust with steam bursting pretreatment; perfluorooctanoic acid and methylene blue adsorption. Bioresour. Technol. 2021, 344, 126161. [Google Scholar] [CrossRef]
  59. Serafin, J.; Ouzzine, M.; Cruz, O.F.; Sreńscek-Nazzal, J.; Gómez, I.C.; Azar, F.-Z.; Mafull, C.A.R.; Hotza, D.; Rambo, C.R. Conversion of fruit waste-derived biomass to highly microporous activated carbon for enhanced CO2 capture. Waste Manag. 2021, 136, 273–282. [Google Scholar] [CrossRef]
  60. Ma, X.; Wu, Y.; Fang, M.; Liu, B.; Chen, R.; Shi, R.; Wu, Q.; Zeng, Z.; Li, L. In-situ activated ultramicroporous carbon materials derived from waste biomass for CO2 capture and benzene adsorption. Biomass Bioenergy 2022, 158, 106353. [Google Scholar] [CrossRef]
  61. Dombrowski, R.J.; Lastoskie, C.M.; Hyduke, D.R. The Horvath–Kawazoe method revisited. Colloids Surf. A Physicochem. Eng. Asp. 2001, 187–188, 23–39. [Google Scholar] [CrossRef]
  62. Puziy, A.; Poddubnaya, O.; Martinez-Alonso, A.; Suarez-Garcia, F.; Tascon, J. Synthetic carbons activated with phosphoric acid: I. Surface chemistry and ion binding properties. Carbon 2002, 40, 1493–1505. [Google Scholar] [CrossRef]
  63. Yacou, C.; Altenor, S.; Carene, B.; Gaspard, S. Chemical structure investigation of tropical Turbinaria turbinata seaweeds and its derived carbon sorbents applied for the removal of hexavalent chromium in water. Algal Res. 2018, 34, 25–36. [Google Scholar] [CrossRef]
  64. Oliveira, R.C.; Hammer, P.; Guibal, E.; Taulemesse, J.-M.; Garcia, O. Characterization of metal–biomass interactions in the lanthanum(III) biosorption on Sargassum sp. using SEM/EDX, FTIR, and XPS: Preliminary studies. Chem. Eng. J. 2014, 239, 381–391. [Google Scholar] [CrossRef]
  65. Wu, Y.; Li, B.; Feng, S.; Mi, X.; Jiang, J. Adsorption of Cr(VI) and As(III) on coaly activated carbon in single and binary systems. Desalination 2009, 249, 1067–1073. [Google Scholar] [CrossRef]
  66. Ozer, A.; Ozer, D. The Adsorption of Cr(VI) on Sulphuric Acid-Treated Wheat Bran. Environ. Technol. 2004, 25, 689–697. [Google Scholar] [CrossRef]
  67. Baral, S.; Das, S.; Chaudhury, G.R.; Swamy, Y.; Rath, P. Adsorption of Cr(VI) using thermally activated weed Salvinia cucullata. Chem. Eng. J. 2008, 139, 245–255. [Google Scholar] [CrossRef]
  68. A Dean, S.; Tobin, J.M. Uptake of chromium cations and anions by milled peat. Resour. Conserv. Recycl. 1999, 27, 151–156. [Google Scholar] [CrossRef]
  69. Selen, V.; Özer, D.; Özer, A. A Study on the Removal of Cr(VI) Ions by Sesame (Sesamum indicum) Stems Dehydrated with Sulfuric Acid. Arab. J. Sci. Eng. 2014, 39, 5895–5904. [Google Scholar] [CrossRef]
  70. Gamboa-Carballo, J.J.; Melchor-Rodríguez, K.; Hernández-Valdés, D.; Enriquez-Victorero, C.; Montero-Alejo, A.L.; Gaspard, S.; Jáuregui-Haza, U.J. Theoretical study of chlordecone and surface groups interaction in an activated carbon model under acidic and neutral conditions. J. Mol. Graph. Model. 2016, 65, 83–93. [Google Scholar] [CrossRef]
  71. Kekes, T.; Kolliopoulos, G.; Tzia, C. Hexavalent chromium adsorption onto crosslinked chitosan and chitosan/β-cyclodextrin beads: Novel materials for water decontamination. J. Environ. Chem. Eng. 2021, 9, 105581. [Google Scholar] [CrossRef]
  72. Aydın, Y.A.; Aksoy, N.D. Adsorption of chromium on chitosan: Optimization, kinetics and thermodynamics. Chem. Eng. J. 2009, 151, 188–194. [Google Scholar] [CrossRef]
  73. Shu, Y.; Ji, B.; Cui, B.; Shi, Y.; Wang, J.; Hu, M.; Luo, S.; Guo, D. Almond Shell-Derived, Biochar-Supported, Nano-Zero-Valent Iron Composite for Aqueous Hexavalent Chromium Removal: Performance and Mechanisms. Nanomaterials 2020, 10, 198. [Google Scholar] [CrossRef]
  74. Angerasa, F.T.; Kalifa, M.A.; Jembere, A.L.; Genet, M.B. Spent kaolin filter cake as an effective adsorbent for the removal of Hexavalent Chromium [Cr (VI)] from aqueous solution: Comparative study of wastewater treatment methods. South Afr. J. Chem. Eng. 2021, 38, 90–103. [Google Scholar] [CrossRef]
  75. da Costa, T.B.; da Silva, T.L.; Costa, C.S.D.; da Silva, M.G.C.; Vieira, M.G.A. Chromium adsorption using Sargassum filipendula algae waste from alginate extraction: Batch and fixed-bed column studies. Chem. Eng. J. Adv. 2022, 11, 100341. [Google Scholar] [CrossRef]
  76. Cheng, N.; Wang, B.; Wu, P.; Lee, X.; Xing, Y.; Chen, M.; Gao, B. Adsorption of emerging contaminants from water and wastewater by modified biochar: A review. Environ. Pollut. 2021, 273, 116448. [Google Scholar] [CrossRef]
  77. Zhu, D.; Yang, H.; Chen, X.; Chen, W.; Cai, N.; Chen, Y.; Zhang, S.; Chen, H. Temperature-dependent magnesium citrate modified formation of MgO nanoparticles biochar composites with efficient phosphate removal. Chemosphere 2021, 274, 129904. [Google Scholar] [CrossRef]
  78. Ma, F.; Philippe, B.; Zhao, B.; Diao, J.; Li, J. Simultaneous adsorption and reduction of hexavalent chromium on biochar-supported nanoscale zero-valent iron (nZVI) in aqueous solution. Water Sci. Technol. 2020, 82, 1339–1349. [Google Scholar] [CrossRef]
  79. Shukla, S.; Kisku, G. Linear and Non-Linear Kinetic Modeling for Adsorption of Disperse Dye in Batch Process. Res. J. Environ. Toxicol. 2015, 9, 320–331. [Google Scholar] [CrossRef]
  80. Ahmed, M.B.; Zhou, J.L.; Ngo, H.H.; Guo, W.; Chen, M. Progress in the preparation and application of modified biochar for improved contaminant removal from water and wastewater. Bioresour. Technol. 2016, 214, 836–851. [Google Scholar] [CrossRef]
  81. Zhu, S.; Huang, X.; Wang, D.; Wang, L.; Ma, F. Enhanced hexavalent chromium removal performance and stabilization by magnetic iron nanoparticles assisted biochar in aqueous solution: Mechanisms and application potential. Chemosphere 2018, 207, 50–59. [Google Scholar] [CrossRef]
  82. Fan, Z.; Zhang, Q.; Gao, B.; Li, M.; Liu, C.; Qiu, Y. Removal of hexavalent chromium by biochar supported nZVI composite: Batch and fixed-bed column evaluations, mechanisms, and secondary contamination prevention. Chemosphere 2018, 217, 85–94. [Google Scholar] [CrossRef]
  83. Qiao, K.; Tian, W.; Bai, J.; Zhao, J.; Du, Z.; Song, T.; Chu, M.; Wang, L.; Xie, W. Synthesis of floatable magnetic iron/biochar beads for the removal of chromium from aqueous solutions. Environ. Technol. Innov. 2020, 19, 100907. [Google Scholar] [CrossRef]
  84. Liu, N.; Zhang, Y.; Xu, C.; Liu, P.; Lv, J.; Liu, Y.; Wang, Q. Removal mechanisms of aqueous Cr(VI) using apple wood biochar: A spectroscopic study. J. Hazard. Mater. 2020, 384, 121371. [Google Scholar] [CrossRef]
  85. Salleh, M.A.M.; Mahmoud, D.K.; Karim, W.A.W.A.; Idris, A. Cationic and anionic dye adsorption by agricultural solid wastes: A comprehensive review. Desalination 2011, 280, 1–13. [Google Scholar] [CrossRef]
  86. Prabhu, S.G.; Srinikethan, G.; Hegde, S. Pelletization of pristine Pteris vittata L. pinnae powder and its application as a biosorbent of Cd(II) and Cr(VI). SN Appl. Sci. 2019, 2, 132. [Google Scholar] [CrossRef]
  87. Pant, B.D.; Neupane, D.; Paudel, D.R.; Lohani, P.C.; Gautam, S.K.; Pokhrel, M.R.; Poudel, B.R. Efficient biosorption of hexavalent chromium from water by modified arecanut leaf sheath. Heliyon 2022, 8, e09283. [Google Scholar] [CrossRef]
  88. Masinga, T.; Moyo, M.; Pakade, V.E. Removal of hexavalent chromium by polyethyleneimine impregnated activated carbon: Intra-particle diffusion, kinetics and isotherms. J. Mater. Res. Technol. 2022, 18, 1333–1344. [Google Scholar] [CrossRef]
  89. Lin, H.; Han, S.; Dong, Y.; He, Y. The surface characteristics of hyperbranched polyamide modified corncob and its adsorption property for Cr(VI). Appl. Surf. Sci. 2017, 412, 152–159. [Google Scholar] [CrossRef]
  90. Wu, F.-C.; Tseng, R.-L.; Juang, R.-S. Initial behavior of intraparticle diffusion model used in the description of adsorption kinetics. Chem. Eng. J. 2009, 153, 1–8. [Google Scholar] [CrossRef]
  91. Song, J.; He, Q.; Hu, X.; Zhang, W.; Wang, C.; Chen, R.; Wang, H.; Mosa, A. Highly efficient removal of Cr(VI) and Cu(II) by biochar derived from Artemisia argyi stem. Environ. Sci. Pollut. Res. 2019, 26, 13221–13234. [Google Scholar] [CrossRef]
  92. Zhang, X.; Zhang, L.; Li, A. Eucalyptus sawdust derived biochar generated by combining the hydrothermal carbonization and low concentration KOH modification for hexavalent chromium removal. J. Environ. Manag. 2017, 206, 989–998. [Google Scholar] [CrossRef] [PubMed]
Figure 1. Proposed simplified surface model of (a) SAC600 3/1 (b) and ions around model activated carbon in the solution of activated carbon HCrO4-, CrO42- and MgCl2. Colour coding: carbon cyan, oxygen red, potassium ions (K+) green, magnesium ion (Mg2+) purple, hydrogen white and chromium yellow.
Molecules 27 06040 g001
Figure 2. Nitrogen adsorption/desorption isotherms at 77 K on SAC600 3/1 and SBP10.
Molecules 27 06040 g002
Figure 3. (a) Pore size distribution using HK method for both AC. D values between 0 and 240 nm. (b) Micropore analysis: D values between 0.6 and 2.0 nm.
Molecules 27 06040 g003
Figure 4. FTIR spectra of Sargassum based activated carbons at lab and pilot conditions.
Molecules 27 06040 g004
Figure 5. Adsorption experiments: (a) Influence of solution pH; (b) influence of solution temperature; (c) influence of solution ionic strength with magnesium chloride; (d) influence of contact time (adsorption kinetics).
Molecules 27 06040 g005
Figure 6. Adsorption isotherms for SAC600 3/1 and SBP10.
Molecules 27 06040 g006
Figure 7. The radial distribution function of K+, HCrO4 and CrO42− ions around activated carbon molecule.
Molecules 27 06040 g007
Figure 8. The radial distribution function of K+, HCrO4 and CrO42− ions around activated carbon surface in the solution of MgCl2.
Molecules 27 06040 g008
Table 1. Textural properties for SAC600 3/1 and SBP10.
Activated
Carbons
SBET (m2/g) Vmicro (cm3/g) Vmeso (cm3/g) Vmacro (cm3/g)VTot (cm3/g) Dp (nm)
SAC600 3/116950.7270.7730.3391.8384.34
SBP1019000.8230.5020.0131.3382.82
Table 2. Total acidity and total basicity for lab-scale and pilot-scale Sargassum activated carbons.
Boehm Titration: Total Acidity and Total Basicity
Sample NameAcidic Groups (mgeq H+/g)Basic Groups (mgeq OH/g)
SAC600 3/1103.6220.40
SBP1053.7314.40
Table 3. Identification of absorption peaks of FTIR spectra for both AC samples.
StructureRange
(cm−1)
Peak
(cm−1)
ProbabilityAssignmentReferences
RCH2CH3 (aliphatic sym.)3000–28502980Very possibleC-H stretching[43,62]
RCH2CH3 (aliphatic asym.)3000–28502903Very possibleC-H stretching[43,62]
Aromatic ring1571–15611569Very possibleC=C stretching[43,62]
RCO-OH (carboxylic acids)1320–10001184; 1081; 1066Very possibleC-O stretching[43,63]
RCOOR’ (esters)1320–10001184; 1081; 1066PossibleC-O stretching[43,63]
Ar-OH (phenol)1205–11951184Very possibleC-O stretching[43,62,63]
P=O (phosphine oxide)1200–11001184PossibleP=O vibration[43,62,63]
P=O (phosphate)1200–11001184Very possibleP=O vibration[43,62,63]
C-O stretching10811081Very possibleC-O stretching[55]
Table 4. Atomic concentration (%) and position BE (eV) of the chemical elements and functional groups present on the surface of the SAC600 3/1 and SBP10.
SAC600 3/1SBP10
Elementary Composition of the Surface% Atomic ConcentrationPosition BE (eV)% Atomic
Concentration
Position BE (eV)
C 1s83.3284.65592.99284.03
O 1s13.14533.1056.52531.98
N 1s3.23400.1550.49133.18
S 2p0.18163.855
P 2p0.15133.655
Functional Groups from C 1s% Atomic ConcentrationPosition BE (eV)% Atomic
Concentration
Position BE (eV)
C=C, C-C, C-H67.23284.59680.88284.400
C-O21.09285.7397.45286.250
C=O7.43286.9046.19287.950
O-C=O4.24288.3815.48289.990
Table 5. Thermodynamic parameters.
Activated CarbonT (K)ln(Keq)ΔG° (KJ·mol−1)ΔH°
(KJ·mol−1)
ΔS° (J·mol−1·K−1)
SAC600 3/1298.150.6878−1.70−21.85−67.3
308.150.5379−1.38
313.150.2292−0.60
Table 6. Adsorption kinetics parameters for SAC600 3/1 and SBP10.
ModelParameterActivated Carbon
SAC600 3/1SBP10
Pseudo First-order Kinetics qe (mg·g−1)17.915.23
K1 (min–1)0.00170.0030
R20.89110.7209
Type 1—Pseudo Second-order Kineticsqe (mg·g−1)46.9736.26
K2 (g/mg·min)0.00040.0026
R20.99730.9999
Type 2—Pseudo Second-order Kineticsqe (mg·g−1)39.1034.84
K2 (g·mg−1·min−1)0.00440.0138
R20.60140.8307
Intraparticle DiffusionCi (mg·g−1)25.9225.36
Kip (mg·g−1·min−0.5)0.48300.3844
R20.50070.2463
Table 7. Adsorption isotherm parameters for SAC600 3/1 and SBP10.
ModelParameterActivated Carbon
SAC600 3/1SBP10
Langmuir qs (mg·g−1)57.1745.87
K (L·g−1)0.12070.3015
R20.96760.8384
RSS 75.49435.66
Jovanovicqs (mg·g−1)48.0542.92
K (L·g−1)0.10200.1547
R20.95160.7451
RSS 112.73687.09
Fowler qs (mg·g−1)57.1745.87
K (L·g−1)0.12070.3015
χ0.000.00
R20.96760.8384
RSS 75.49435.66
FreundlichK (L·g−1)12.024815.4435
ν 0.38090.3048
R20.95040.9749
RSS 115.5167.56
Jovanovic-Freundlichqs (mg·g−1)54.5458.94
K (L·g−1)0.07440.0601
ν 0.70140.4363
R20.97280.9459
RSS 63.28145.94
Fowler-Guggenheim/
Langmuir-Freundlich
qs (mg·g−1)64.2737.80
K (L·g−1)0.15521.6365
χ0.35090.5405
ν 1.001.00
R20.97190.9627
RSS 65.53100.61
Publisher’s Note: MDPI stays neutral with regard to jurisdictional claims in published maps and institutional affiliations.

