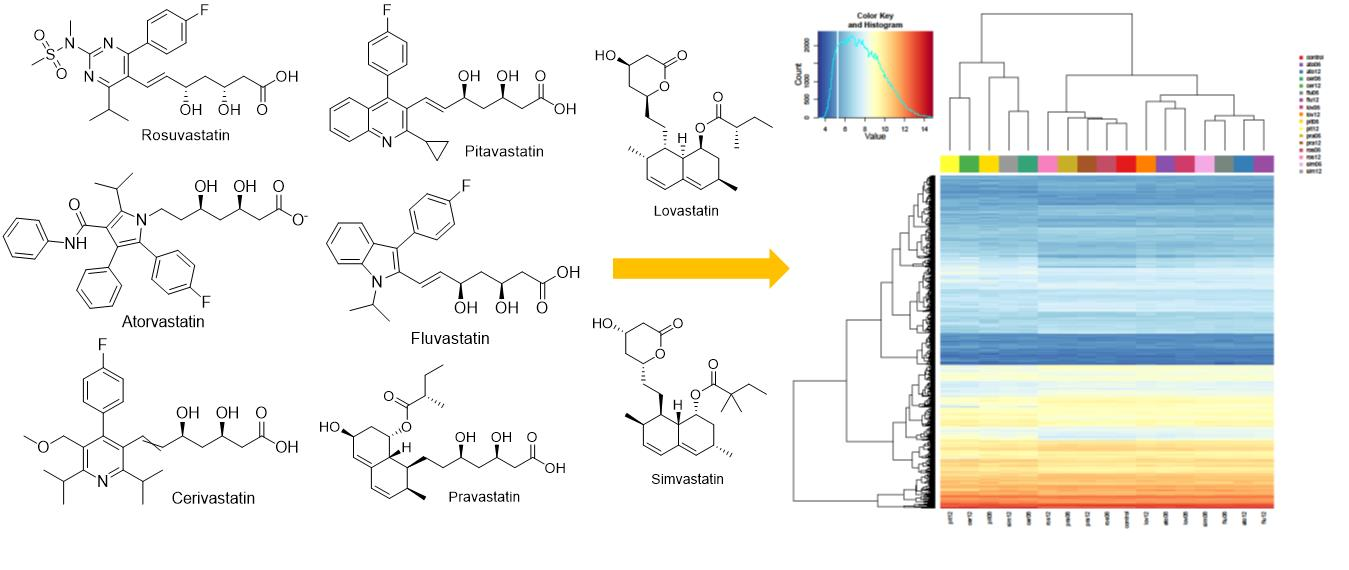
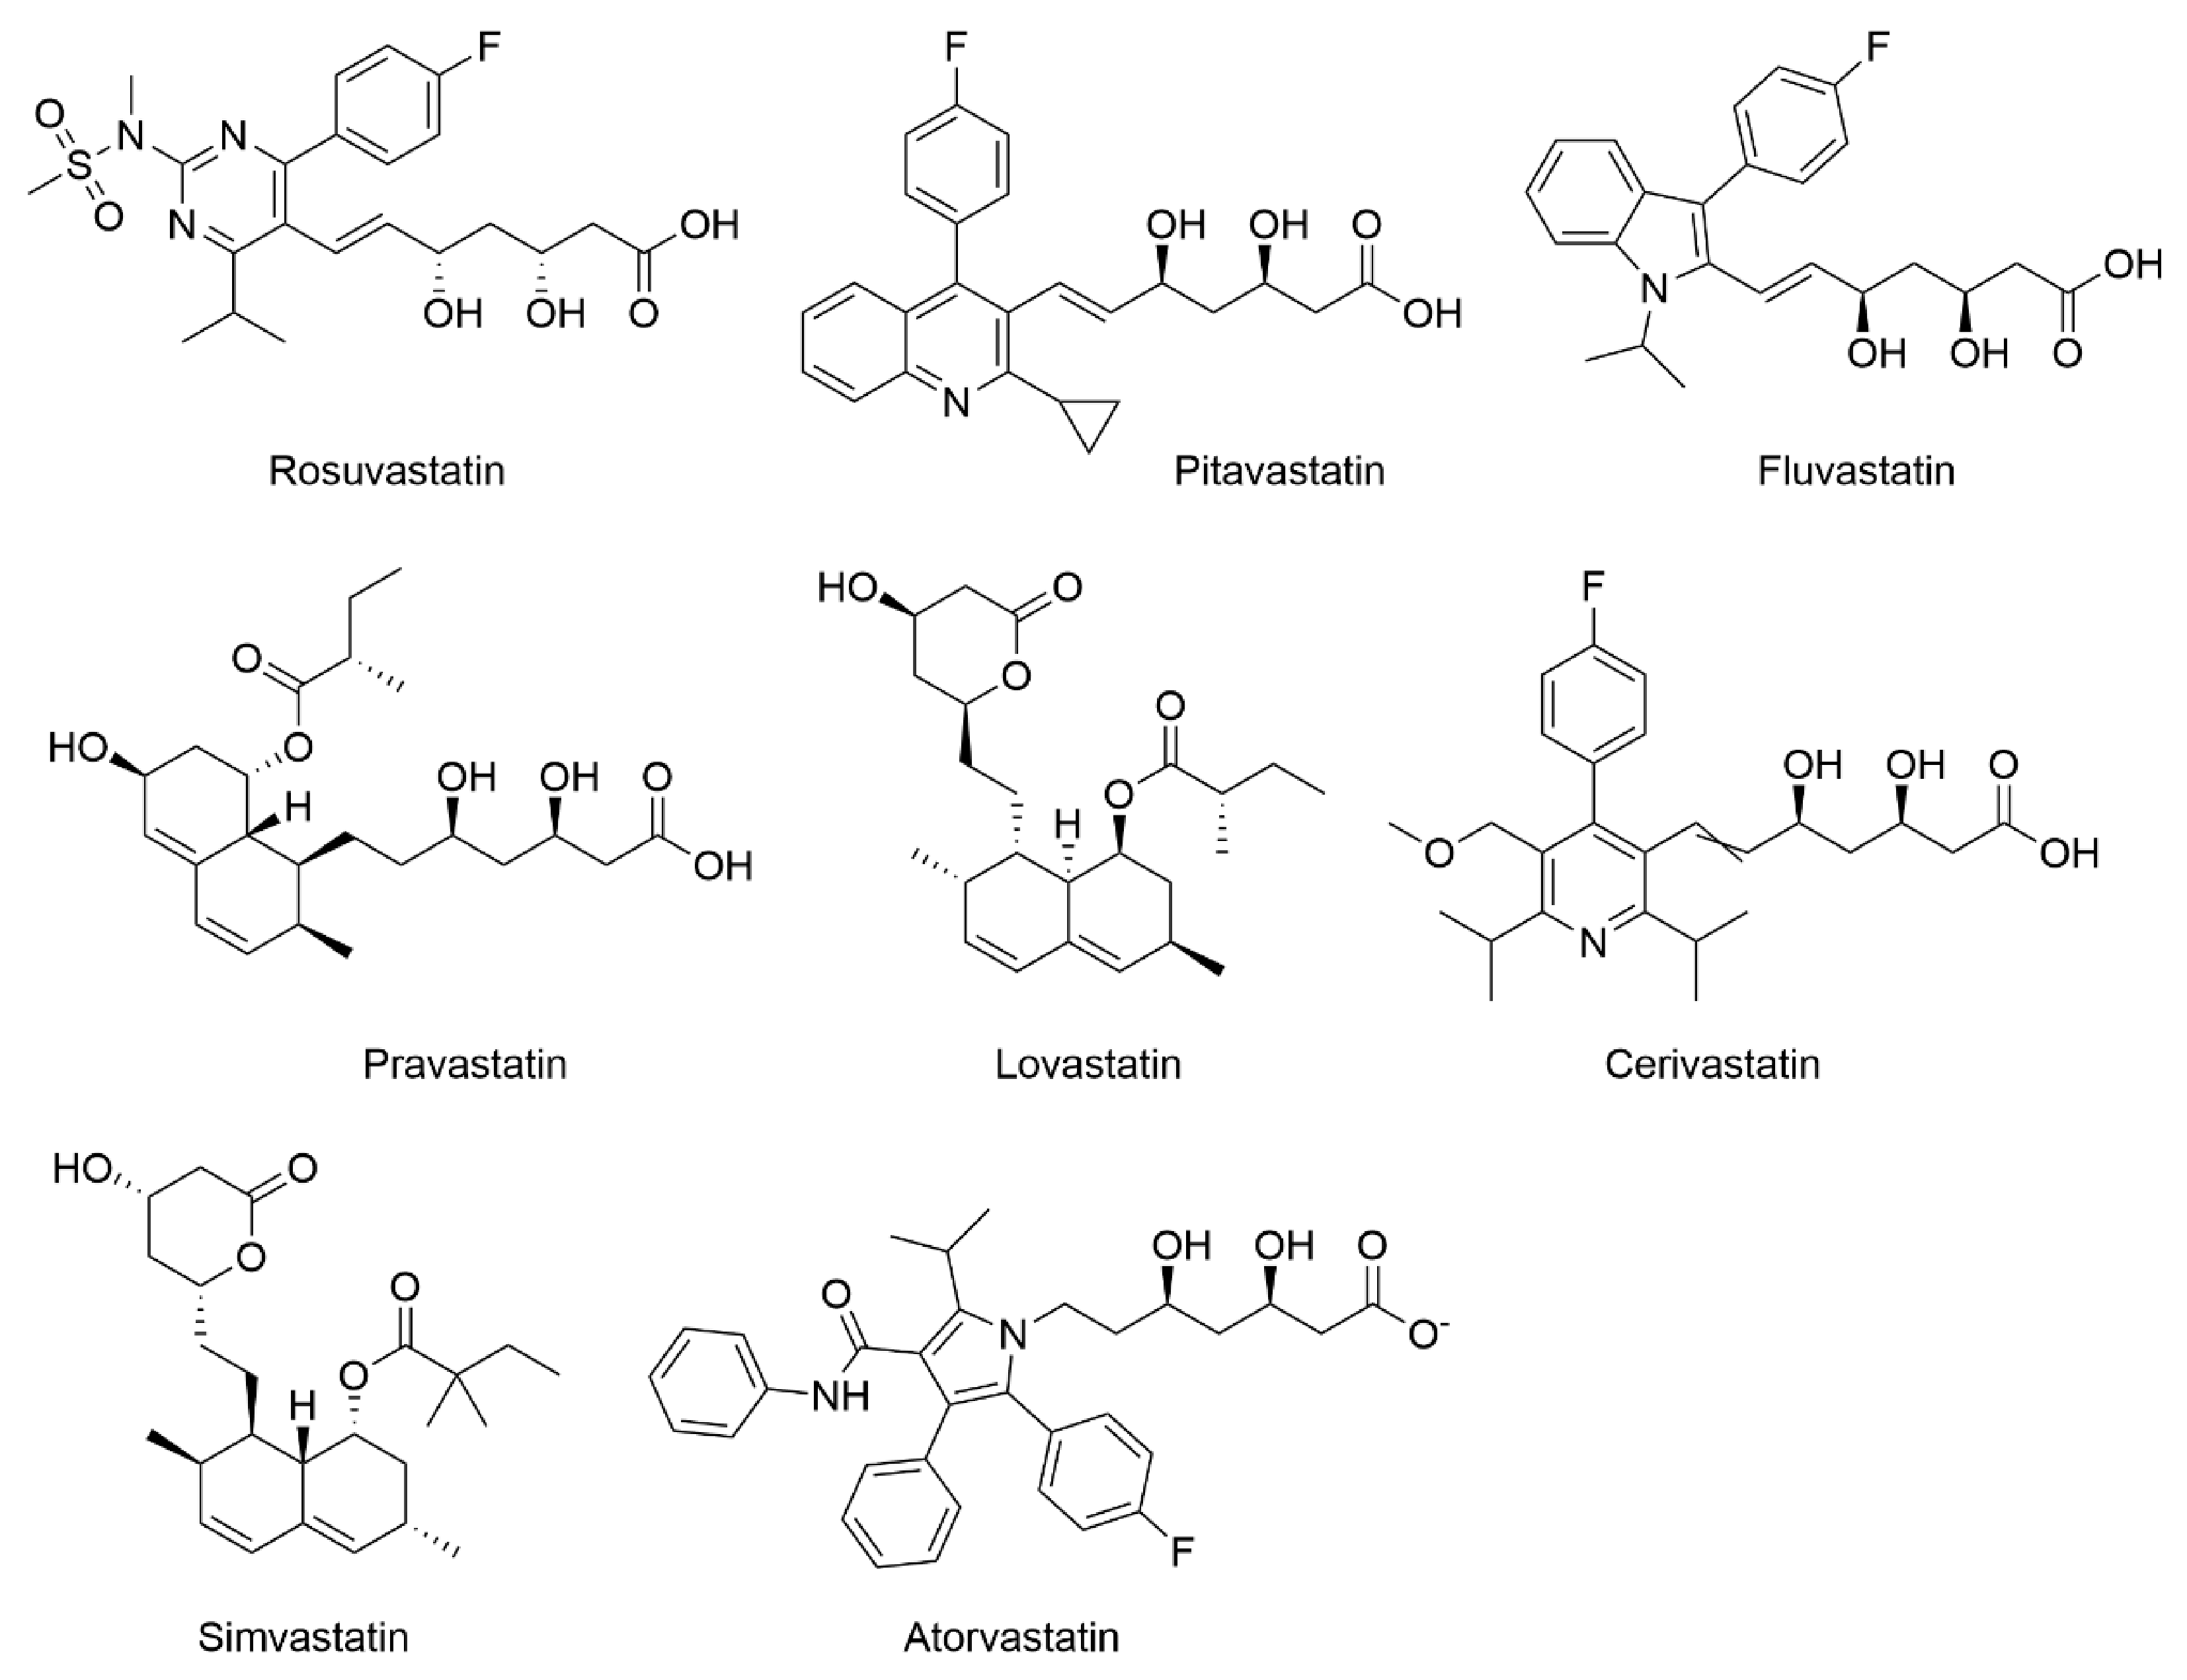
Article

Comparison of Transcriptomic Profiles of MiaPaCa-2 Pancreatic Cancer Cells Treated with Different Statins

1
Department of Biochemistry and Microbiology, University of Chemistry and Technology Prague, Technická 3, 166 28 Prague, Czech Republic
2
Laboratory of Genomics and Bioinformatics, Institute of Molecular Genetics, Czech Academy of Sciences, Vídeňská 1083, 142 20 Prague, Czech Republic
3
Institute of Medical Biochemistry and Laboratory Diagnostics, and 4th Department of Internal Medicine, 1st Faculty of Medicine, Charles University, 128 08 Prague, Czech Republic
4
Institute of Medical Biology, Genetics and Clinical Genetics, Faculty of Medicine, Comenius University, Špitálska 24, 813 72 Bratislava, Slovakia
*
Authors to whom correspondence should be addressed.
Molecules 2021, 26(12), 3528; https://doi.org/10.3390/molecules26123528
Submission received: 16 March 2021 / Revised: 21 May 2021 / Accepted: 26 May 2021 / Published: 9 June 2021
(This article belongs to the Special Issue Anticancer Inhibitors)

Abstract

:
Statins have been widely used for the treatment of hypercholesterolemia due to their ability to inhibit HMG-CoA reductase, the rate-limiting enzyme of de novo cholesterol synthesis, via the so-called mevalonate pathway. However, their inhibitory action also causes depletion of downstream intermediates of the pathway, resulting in the pleiotropic effects of statins, including the beneficial impact in the treatment of cancer. In our study, we compared the effect of all eight existing statins on the expression of genes, the products of which are implicated in cancer inhibition and suggested the molecular mechanisms of their action in epigenetic and posttranslational regulation, and in cell-cycle arrest, death, migration, or invasion of the cancer cells.

Graphical Abstract

1. Introduction

Statins (Figure 1) are the inhibitors of de novo cholesterol synthesis in the cell due to their ability to competitively inhibit the β-hydroxy-β-methylglutaryl coenzyme A (HMG-CoA) reductase. They represent the most prescribed drugs in the treatment of cardiovascular diseases [1]. Currently, there are eight existing statins, namely atorvastatin, cerivastatin, fluvastatin, lovastatin, pitavastatin, pravastatin, rosuvastatin, and simvastatin [2]. Although all statins have the same mechanism of hypolipidemic action, they differ in their chemical structure, physico-chemical properties, pharmacokinetic effects, and effects on lipid profile [
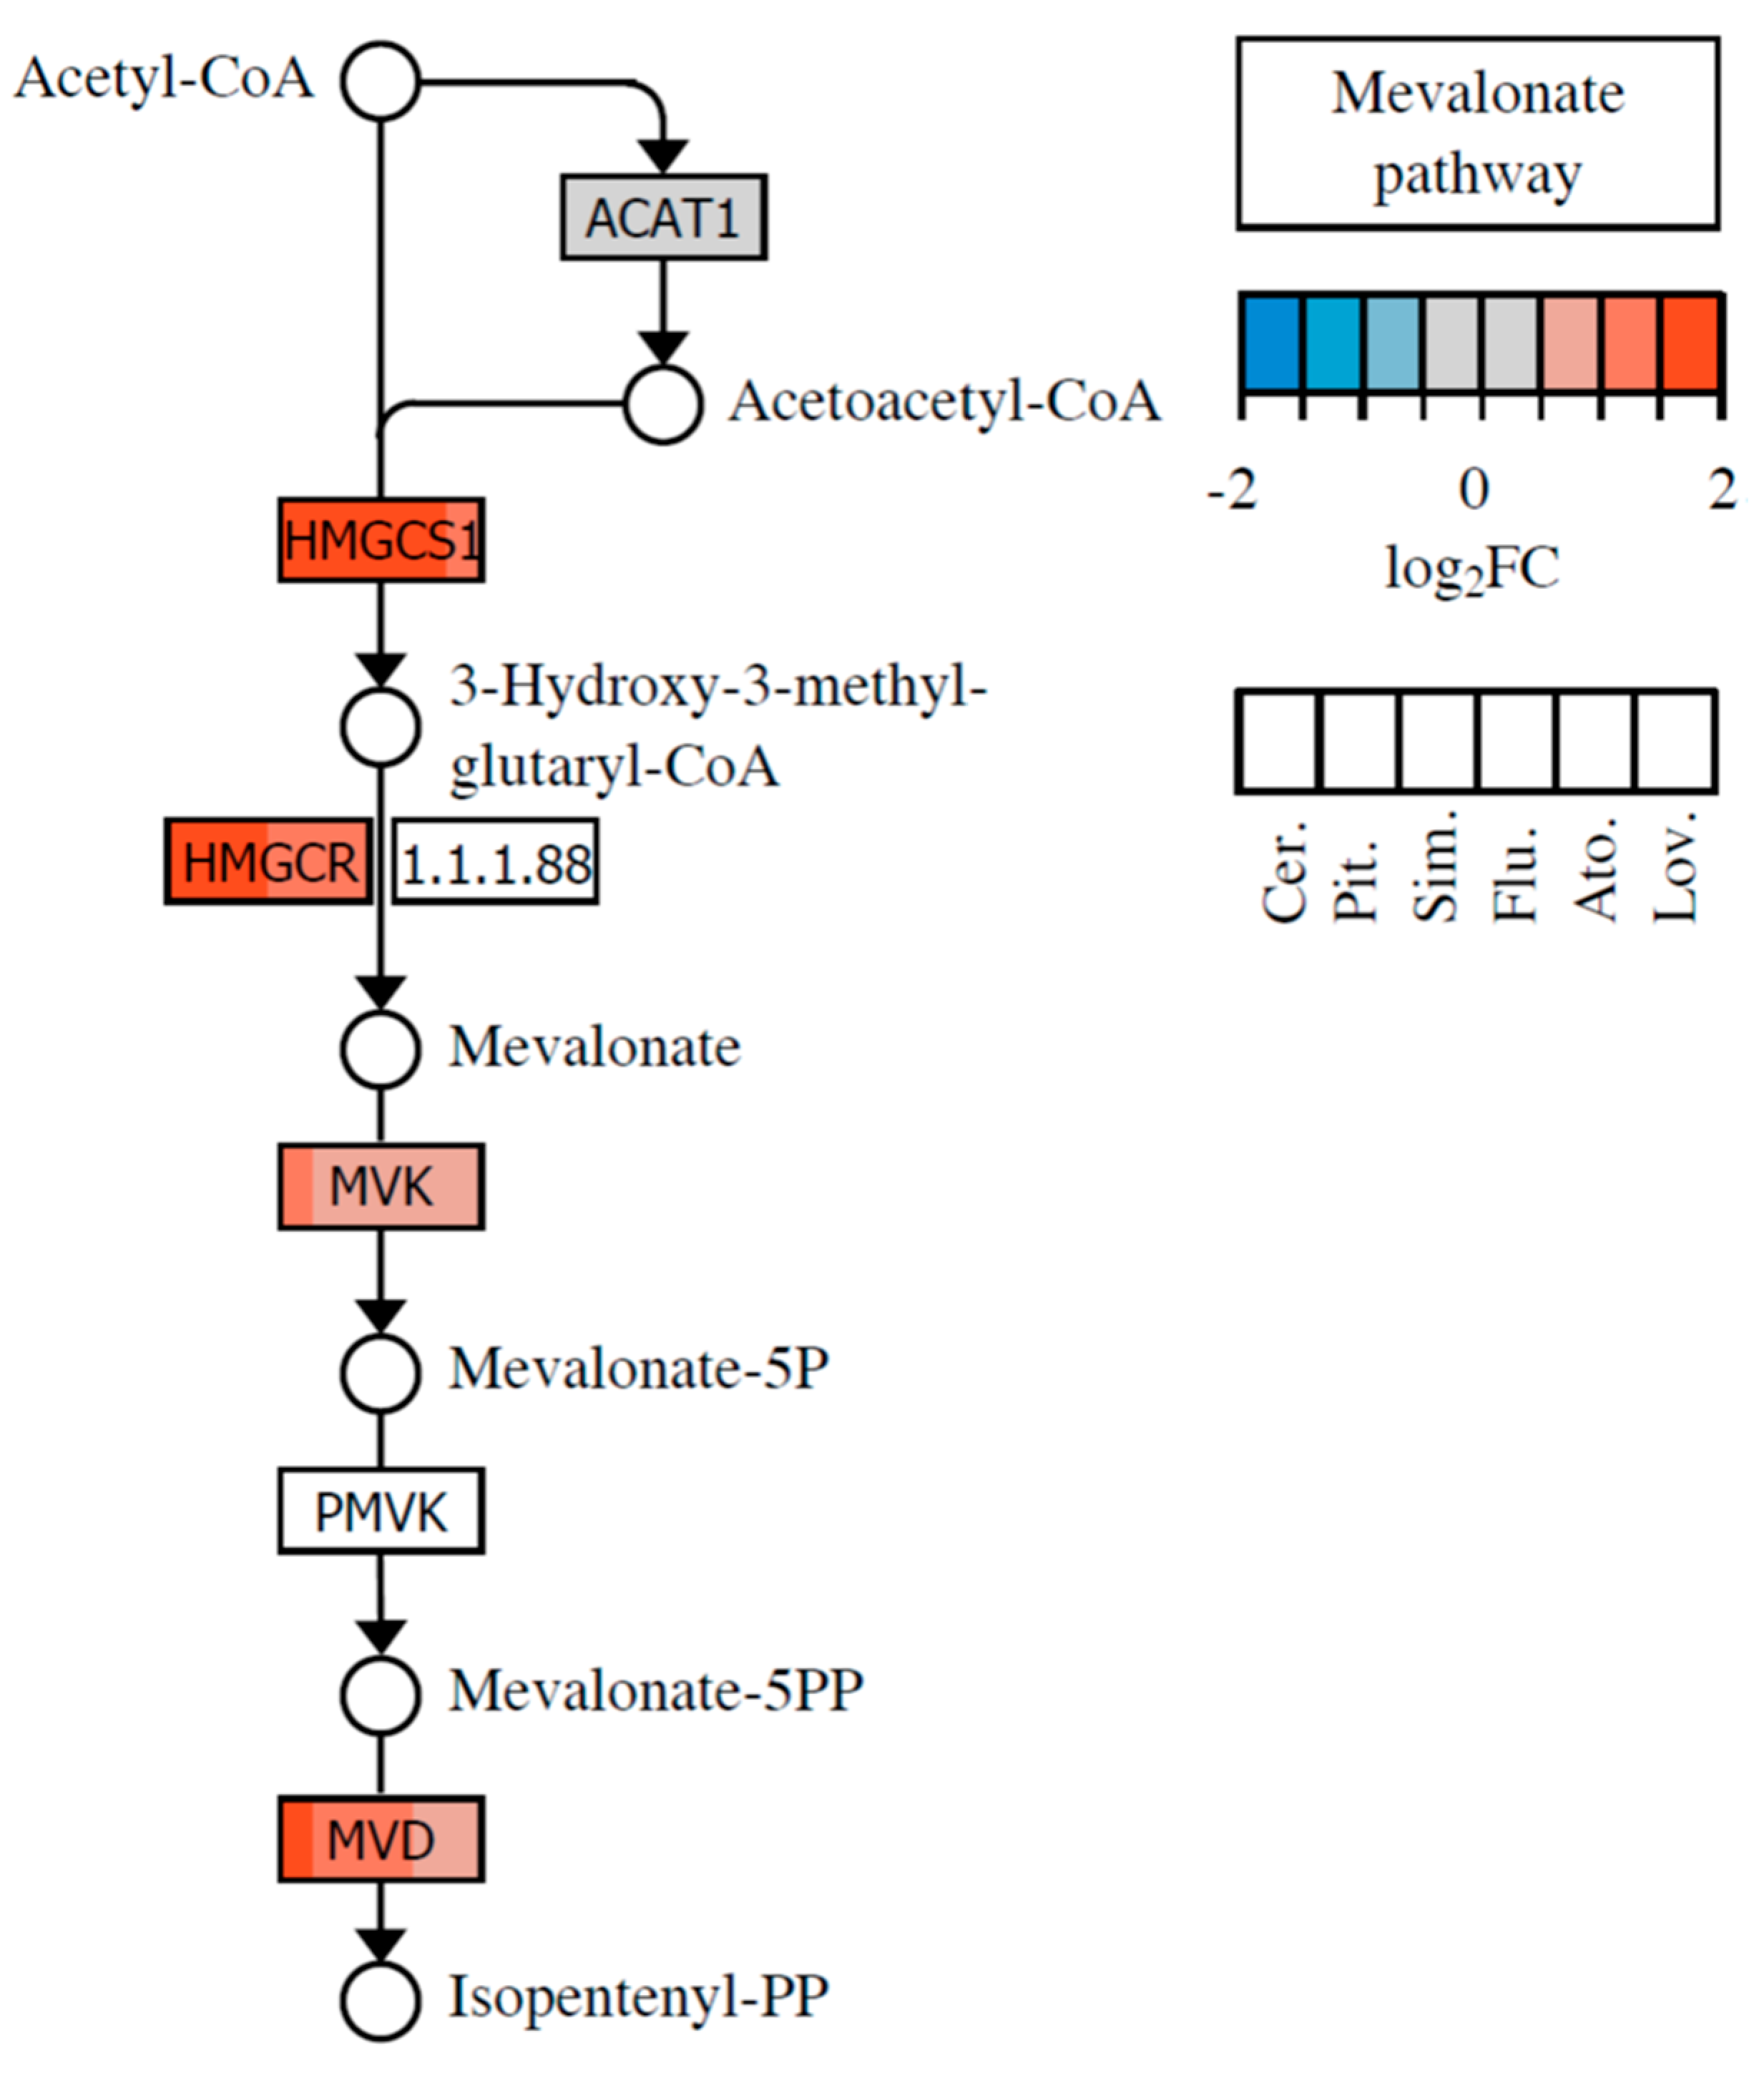
3]. The inhibition of HMG-CoA conversion to mevalonate caused by HMG-CoA reductase inhibition results in the depletion of downstream intermediates of the mevalonate pathway.
Mevalonate is the precursor of, i.e., farnesyl pyrophosphate (FPP), geranylgeranyl pyrophosphate (GGPP), isopentenyl adenine, dolichol, and the polyisoprenoid side chains of heme A and ubiquinone, which are essential molecules that play a vital role in almost any cell process [3]. From these, FPP and GGPP play an important role in the posttranslational modification of cellular proteins involved in cell division and differentiation, gene expression, cytoskeleton formation, intracellular protein and lipid transport, and defense against pathogens [4]. Another intermediate in the mevalonate pathway, isopentenyl adenine, is essential for proper tRNA function and protein synthesis. Dolichol acts as an important scavenger of free radicals in cell membranes, and ubiquinone is involved in mitochondrial respiration and inhibition of lipid peroxidation. A decrease in the intracellular level of ubiquinone leads to mitochondrial damage, oxidative stress, and cell damage. The involvement of the aforementioned mevalonate pathway intermediates in various cell processes explains the pleiotropic activity exhibited by statins, in addition to their hypolipidemic effect.
Based on this, it is clear that statins significantly affect basic physiological processes of cells and organs that also are connected with oncogenesis [5]. The results of lipid-lowering therapy in animals initially indicated an increased risk of carcinogenesis [6]. However, the dose of statins administered in that study was very high and not applicable for humans [7]. The results of studies on tissue-specific cancer development in individuals on statins therapy (as hypolipidemic drugs) have been controversial. An increased incidence of breast cancer after statin administration was observed in one study [8], but another study did not confirm these findings [9]. Contrary to that, a reduced incidence of melanomas has been reported after statin administration [9]. A similar beneficial effect of statins was observed in connection with reduced incidence of colon carcinomas [10]. However, most of these studies were not originally designed to investigate the relationship between statin intake and cancer development, but rather between statins and cardiovascular diseases. Indeed, some reports have shown a statistically significantly lower incidence of cancer in patients receiving statin therapy, despite relatively short follow-up times and inappropriate patient selection [11,12,13,14,15,16]. Moreover, extensive studies conducted on 500,000 U.S. war veterans have shown that statin use is associated with a two- to fivefold lower incidence of lung [17], breast [18], and prostate cancers [19]. Based on other meta-analyses, statins appear to be particularly effective in the chemoprevention of colorectal cancer [10,20]. While there have been several in vitro and in vivo studies directly targeting and confirming the marked effect of statins on the growth of a wide variety of tumor types, such as hepatocellular [21], lung [22], and colorectal carcinoma [23], clinical trials targeting statin efficacy in cancer treatment have been very rare, so far. One of them showed that patients suffering from hepatocellular carcinoma exhibited statistically significantly longer survival rates for pravastatin therapy [24] than untreated. On the other hand, beneficial effects of lovastatin therapy on the survival rate of patients suffering from glioblastoma multiforme or advanced gastric adenocarcinoma have not been observed [25,26]. The findings of the meta-analyses suggested an association between pravastatin treatment and cancer in elderly patients [27] but did not support the potential role of statins in the prevention of hematological malignancies [28] or the hypothesis that statins reduce the risk of pancreatic cancer development [29].
The setting of the experimental conditions of the present study was based on the results of our previous published studies [30,31], in which we reported on the differences in the individual anticancer potential of individual statins in cells derived from pancreatic carcinoma. Moreover, we were inspired by the aforementioned findings, as well as recent reviews shedding light on statins as cancer inhibitors with several possible mechanisms of action [32,33,34,35]. Therefore, using DNA microarray analysis, we sought after statin-induced changes in the expression of genes, the products of which are connected with tumorigenesis, inhibition of tumor growth, or metastasis. We focused on the pancreatic cancer cells because, in the very recent meta-analysis of 26 studies containing more than 3 million participants and 170,000 pancreatic cancer patients, statin therapy was shown to significantly reduce the risk of pancreatic cancer [36].

2. Results

From eight existing statins, only six (cerivastatin, pitavastatin, simvastatin, lovastatin, fluvastatin, and atorvastatin) significantly affected the gene expression in the MiaPaCa-2 pancreatic cancer cell line after 24 h of treatment with 12 µM statin concentration. The concentration was selected based on our previous studies [30,31], in which we determined the IC50 of individual statins in cells from pancreatic carcinoma after 24, 48, and 72 h. The value 12 µM corresponds to the IC50 of simvastatin in MiaPaCa-2 cells after 24 h of treatment. Other statins were compared at the same concentration since simvastatin was at the time of analysis one of the most potent clinically used statins (cerivastatin had been withdrawn from the market at the time of analysis).

2.1. Effect of Statins on Lipid Metabolism and Synthesis of Steroids

Lipids, particularly cholesterol, and their derivatives play several roles in tumorigenesis and cancer cell metabolism [37,38]. In contrast to noncancerous cells, malignant cells exhibit enhanced de novo synthesis of fatty acids, which serve as substrates for β-oxidation, or conversion to triglycerides for storage of phospholipids for membrane formation.
DNA microarray analysis showed that out of the eight statins evaluated, six effective ones significantly affected steroid biosynthesis in MiaPaCa-2 cells. They upregulated the gene encoding HMG-CoA reductase, representing the key target of statins. In addition, they even more markedly triggered upregulation of the gene encoding HMG-CoA synthase, catalyzing the synthesis of HMG-CoA, the substrate for the aforementioned enzyme covalently inhibited by statins. The inhibition of the mevalonate pathway resulted in a switch from cholesterol synthesis to the triacylglyceroles and phospholipid synthesis via the Kennedy pathway. Genes encoding enzymes of the Kennedy pathway were directly upregulated by the action of only the most effective statins; i.e., cerivastatin, pitavastatin, and simvastatin (Table 1). However, in terms of knowledge of the lipid metabolism of tumors, this observation indicated a procarcinogenic effect rather than an antitumor effect of statins. The changes in the expression of the genes involved in the mevalonate pathway are shown in Figure 2.
On the other hand, statins are responsible for a decrease in the cholesterol content in lipid rafts by inhibiting the mevalonate pathway and, thus, induce apoptosis via inhibition of the Akt signaling pathway [39]. Interestingly, in our study, the Akt signaling pathway was not affected by the evaluated statins at 12 µM after 24 h treatment of MiaPaCa-2 cells.
In tumors with deregulated Hedgehog signaling, the depletion of cholesterol results in impairment of Hedgehog signal transduction and inhibition of cancer cell growth [40]. Cholesterol itself serves as a substrate for the post-translational modification of Hedgehog ligands, which is required for their proper trafficking [41]. This means that all statins should indirectly inhibit the Hedgehog signaling by inhibiting the cholesterol synthesis. Moreover, we found that pitavastatin and cerivastatin significantly upregulated the GAS1 (growth arrest-specific gene 1) (data not shown), the product of which positively regulates the Hedgehog signaling [42,43]. The possible explanation for GAS1 gene upregulation after statin treatment was the effort of affected cells to reactivate the statins-suppressed Hedgehog signaling.
Finally, to maintain cancer cell proliferation, the increased activation of SREBPs (sterol regulatory element-binding proteins) is required [44]; therefore, SREBP inhibitors are used in molecular-targeted cancer therapies [45,46]. SREBPs are transcription factors that regulate the expression of genes required for the synthesis of fatty acids, triglycerides, and cholesterol. Intracellular cholesterol level is controlled by SREBP-1 and SREBP-2. These transcription factors upregulate the synthesis of enzymes involved in the sterol biosynthesis upon binding to specific sterol regulatory element DNA sequences. Sterols in turn inhibit the cleavage of SREBPs, and therefore, synthesis of additional sterols is reduced via a negative feedback loop. Statin-mediated inhibition of sterol synthesis was reported to activate the SREBPs in many tumor types [45]. In our experiment, statins at a concentration (12 µM) sufficient to induce a more or less intensive antiproliferative effect on MiaPaCa-2 pancreatic cancer cells (IC50: cerivastatin 10 µM, simvastatin 12 µM, lovastatin 13 µM, pitavastatin 20 µM, fluvastatin 26 µM, atorvastatin 27 µM, pravastatin 29 µM, rosuvastatin 36 µM) did not significantly affect the expression of genes encoding SREBPs (data not shown).

2.2. Statins in the Role of Epigenetic Regulators

Recently, it was described that acetyl-CoA metabolism supports multistep pancreatic tumorigenesis. In pancreatic adenocarcinoma, both upregulated gene expression of the mevalonate pathway and histone acetylation was detected [47]. Dysregulation between activities of histone acetyltransferases (HATs) and histone deacetylases (HDACs) is frequent in human tumors [48]. The expression of genes encoding HATs or HDACs was not altered by statins in our experiments (data not shown); however, genes encoding histone H4 were downregulated, in contrast to genes for histone H2B that were upregulated by cerivastatin, pitavastatin, and simvastatin (Table 2). STRING enrichment analysis of epigenetic regulators significantly affected by statin treatment is shown in Figure 3.

2.3. Statins and Their Potential Role as Posttranslational Regulators

Statins deplete the cellular pool of isoprene precursors, thereby having an impact on protein prenylation; i.e., farnesylation and geranylgeranylation. Among prenylated proteins, the low-molecular-weight guanosine triphosphate-binding proteins Ras and Ras-related growth modulators were monitored (Table 3). The overall effect on the RAS signaling pathway is shown in Figure 4.
RHOB, the most dramatically upregulated gene by statins (Table 3), belongs to the Rho protein family of proteins regulating diverse cellular processes, including cytoskeletal organization, gene transcription, cell cycle progression, and cytokinesis [49,50]. While most Rho proteins have been shown to have positive roles in proliferation and malignant transformation, RhoB rather appears to act as a negative regulator of these processes [51,52]. R-Ras promotes the formation of focal adhesions, cell spreading, and activation of integrins [53]. Cerivastatin, pitavastatin, simvastatin, and fluvastatin also increased the expression of the KRAS gene, the most frequently mutated gene in pancreatic cancer, and frequently mutated in cancer in general. As the K-Ras is the protein related to many functional pathways, such as the mitogen-activated protein kinase (MAPK) signaling pathway, the receptor tyrosine-protein kinase (ErbB) signaling pathway, dorso-ventral axis formation, axon guidance, the vascular endothelial growth factor (VEGF) signaling pathway, tight junctions, gap junctions, natural killer cell-mediated cytotoxicity, the T-cell receptor signaling pathway, the B-cell receptor signaling pathway, the Fc epsilon RI signaling pathway, long-term potentiation, long-term depression, regulation of actin cytoskeleton, the insulin signaling pathway, and the gonadotropin-releasing hormone (GnRH) signaling pathway, the pleiotropic effect of statins is comprehensible. Moreover, the KRAS gene upregulation after statin treatment adverts to the unavailability of K-Ras protein for the cell signaling without its correct posttranslational modification due to the mevalonate pathway inhibition. Similarly, this mechanism could also explain the upregulation of other Ras and Ras-related proteins induced by treatment with simvastatin. Genes encoding guanine nucleotide exchange factor (GEF), GTPase-activating proteins (GAP), or guanosine nucleotide dissociation inhibitor (GDI) of Ras and Ras-related proteins were not significantly up- or downregulated by statins.

2.4. Statins’ Effect on Cell Cycle and Cell Death

The effect of statins on the expression of genes related to the cell cycle and cell death is of special interest concerning their cancerostatic capability. The expression levels of genes associated with DNA replication were significantly affected only by pitavastatin, cerivastatin, and simvastatin, and they were mostly downregulated (Table 4). The changes in the cell-cycle circuit are shown in Figure 5.
The origin recognition complex (ORC) is a highly conserved six-subunit protein complex essential for the initiation of DNA replication in eukaryotic cells. The ORC binds specifically to origins of replication and serves as a platform for the assembly of additional initiation factors such as minichromosome maintenance (MCM) proteins. ORC1L is the largest subunit of the ORC complex. While the levels of other ORC subunits are stable throughout the whole cell cycle, the level of ORC1L changes in various phases of the cell cycle. These changes are controlled by ubiquitin-mediated proteolysis after the initiation of DNA replication [54]. From this, it seems that statins blocked the progression of the cell cycle through the S phase. From the quantum of genes encoding proteins involved in the cell-cycle regulation, such as cyclins, cyclin-dependent kinases (CDK), and cell-cycle negative regulators, only the expression of those denoted in Table 4 were affected by statins. CDC2 (CDK1) is the catalytic subunit of a highly conserved protein kinase complex known as the M-phase promoting factor (MPF), which is essential for the G1/S and G2/M phase transitions in the cell cycle of eukaryotic cells. Mitotic cyclins stably associate with this protein and function as regulatory subunits. The kinase activity of this protein is controlled by cyclin accumulation and degradation through the cell cycle [55].
M-phase inducer phosphatase 2 (CDC25B), a member of the cell division control protein 25 (CDC25) family of phosphatases, activates the cyclin-dependent kinase (CDC2) and is required for entry into the mitosis [56]. Whereas the CDC2 gene was downregulated by simvastatin treatment of MiaPaCa-2 cells, the CDC25B gene was upregulated (Table 4). Some other genes encoding proteins related to the S phase (SKP2, E2F2) were downregulated by cerivastatin and pitavastatin. The SKP2 (S-phase kinase-associated protein 2) is an essential element of the cyclin A/CDK2 S-phase kinase [57]. E2F2 is a member of the E2F family of transcription factors and plays a crucial role in the control of the cell cycle. Expression of the S-phase genes is not activated when E2F is repressed [58].
In our experimental setup, one of the genes most affected by statin treatment was TNFRSF10D (Table 5). Its product, the tumor necrosis factor receptor superfamily member 10D precursor (known also as TNF-related apoptosis-inducing ligand receptor 4, or TRAIL receptor 4) is a member of the TNF-receptor superfamily, which is closely connected with apoptosis. TNFRSF10D has been shown to play an inhibitory role in TRAIL-induced cell apoptosis [59]. Upregulation of another gene, GABARAPL (also known as early estrogen-regulated protein; Table 5) suggests that statin treatment may induce cell death by autophagy [53]. STRING enrichment analysis of products of genes involved in cell death significantly affected by statin treatment is shown in Figure 6.

2.5. Statins’ Effect on Migration and Invasion of Cancer Cells

Since statins are known to affect migration and invasion of various cancer cells [60,61,62,63,64], which is also in accordance with our preliminary unpublished data, we also concentrated on the analyses of changes in the transcription of genes involved in cell migration and cytoskeleton architecture. The pancreatic cancer cells used in our study were firmly attached to the cultivation surface. However, the statin treatment induced a change in the cell shape and facilitated their detachment (data not shown). This is consistent with the effect of statins on the expression of the genes encoding the cytoskeletal proteins (Table 6). STRING enrichment analysis of products of genes involved in cytoskeleton maintenance significantly affected by statin treatment is shown in Figure 7.
Intermediate filaments (IF) of the cytoplasmic cytoskeleton are composed of keratins that are the major structural proteins of epithelial cells. They interact with desmosomes and hemidesmosomes, by which they assist in cell–cell adhesion [65].
TNNT1 is a subunit of troponin, which is a regulatory complex located on the thin filament of the sarcomere. This complex regulates striated muscle contraction in response to fluctuations in intracellular calcium concentration [66]. Gelsolin is an actin-binding protein that is a key regulator of actin filament assembly and disassembly. Among the lipid-binding actin regulatory proteins, gelsolin is one of the few that exhibit preferential binding toward polyphosphoinositide. The activity of gelsolin is stimulated by calcium ions (Ca2+) [67]. Kinesins belong to a class of motor proteins found in eukaryotic cells. Kinesins move along microtubule cables powered by the dephosphorylation of adenosine triphosphate (ATP). The active movement of kinesins supports several cellular functions, including mitosis, meiosis, and transport of cargo [68]. Catenins are proteins found in complexes with cadherin cell adhesion molecules of animal cells. Junction plakoglobin (catenin gamma) was originally identified as a component of desmosomes (a cell structure specialized for cell-to-cell adhesion) [69]. Ezrin is the cytoplasmic peripheral membrane protein that serves as an intermediate between the plasma membrane and the actin cytoskeleton. This protein plays a key role in cell-surface structure adhesion, migration, and organization, and it has been implicated in various human cancers [70]. CDH10 is an integral membrane protein that mediates calcium-dependent cell–cell adhesion [71].

3. Materials and Methods

3.1. DNA Microarray Analysis

Description of an experimental method for the studying of the effects of individual statins on the gene-expression profile of MiaPaCa-2 cells was reported by Gbelcová et al. [30]. We compared the effect of statins to simvastatin because it was chosen as the most effective clinically used statin tested in vitro in our previous study. Briefly, pure forms (≥98 %) of all commercially available statins were used: atorvastatin, lovastatin, simvastatin, fluvastatin, cerivastatin, pravastatin, rosuvastatin, and pitavastatin (LKT Laboratories, USA). Statins were dissolved in methanol and tested in 12 μM concentrations, representing the IC50 value for simvastatin after 24 h of treatment of MiaPaCa-2 cancer cells. Human pancreatic cancer cells MiaPaCa-2 (ATCC, Manassas, VA) were cultured in DMEM medium (Sigma Aldrich, Germany) supplemented with 10 % fetal bovine serum. Illumina HumanWG-6_V3 chips (Illumina, USA) were used for the microarray analysis following the standard protocol. Annotation of differentially expressed transcripts was done with R/BioConductor packages [72] against the Ensembl database (version 47) [73]. The transcripts with a false discovery rate smaller than 0.05 and fold change smaller than 0.5 or greater than 2 were reported and used in the downstream analysis. Changes in the gene expression were visualized using the Pathview package [74] on the pathways provided by the KEGG database [75].

3.2. RT-qPCR Analysis

Validation of the selected gene expression changes was performed using quantitative RT-PCR. The amount of 1 × 10⁸ cells was washed with phosphate-buffered saline and lysed using the RLT buffer (Qiagen, Hilden, Germany) supplemented with β-mercaptoethanol. The total RNA was extracted by the RNeasy Micro kit (Qiagen) according to the manufacturer’s protocol. All extracts were treated with DNase I (Qiagen) to remove contaminating genomic DNA. The quality and quantity of the RNA were evaluated with an Agilent 2100 Bioanalyzer instrument using the RNA 6000 Nano kit (both Agilent Technologies, Santa Clara, CA, USA). Expression levels of the mRNA were determined using a two-step RT-qPCR method. First, cDNA was reverse-transcribed from 1 μg of total RNA in a final reaction volume of 20 μL using a QuantiTect reverse transcription kit (Qiagen) according to the manufacturer’s instructions. Then, the cDNA concentration was quantified using a LightCycler 480 instrument in LightCycler 480 SYBR Green I master mix (both Roche Applied Sciences, Penzberg, Germany) with a custom primer mix (see Supplementary Table S1 for primer sequences). For each condition, two biological replicates were analyzed (three for the control group).
Data analysis was performed using the delta–delta Cq method [76] within the R statistical environment [77]. Cq values were truncated at the value of 40. Three housekeeping genes (RPS9, TBP, and GAPDH) were used as reference genes for RNA quantity normalization using the geNorm algorithm [78]. Relative expression levels were computed assuming the perfect efficiency of the PCR.

3.3. STRING Analysis

A functional association network of known and predicted functional partners or selected genes identified as significantly changed in the microarray analysis in MiaPaCa-2 cells treated with 12 µM concentration of statins for 24 h was created using STRING database 11.0 [79]. STRING is an interaction network database for functional enrichment analysis of protein–protein interaction networks. Input nodes were chosen based on the most important hits identified by the microarray analysis and depicted in Figure 3, Figure 6, and Figure 7. The evidence view diagrams were generated by STRING to illustrate the known protein–protein interactions of all connected nodes. The view of the association network was done for Homo sapiens according to the known and predicted from curated databases, experimentally determined, gene neighborhood, gene fusions, gene co-occurrence, text-mining, co-expression, and protein homology. The confidence score was set to high, equal to 0.700, with a maximum of 30 interactions. Disconnected nodes in the networks were hidden.

4. Discussion and Conclusions

Statins have been intensively studied drugs based on their deep impact on the human organism caused, in particular by their cholesterol-lowering activity. However, their effects also include remarkable and potentially clinically relevant antitumor effects.
Although lipids are not genetically encoded, the genome changes can reflect cholesterol homeostasis indirectly. The changes in gene expression following statin treatment studied by microarray technology have been reported since the year 2000. The interpretation of our microarray analysis indicates a significant correlation between our and previously reported results. On the other hand, many differences are resulting from distinct experimental conditions due to the type of statin used, its concentration and duration of its activity, the experimental model (the type of a cell line or organism), etc.
Previously, we have demonstrated substantial differences in cancer cell antiproliferative effects of all commercially available statins in an experimental model of human pancreatic cancer [31]. Various statins exhibited significantly different inhibitory efficacy, and we have also observed notable differences in statin sensitivity between pancreatic cancer cell lines, concerning the level of differentiation and harboring of G12C-activating mutation in the KRAS gene. Cerivastatin, pitavastatin, and simvastatin were the most effective, whereas rosuvastatin and pravastatin were the least effective, and their effectiveness correlated with the properties of the cell lines tested (the level of differentiation, and presence of G12C KRAS mutation) [
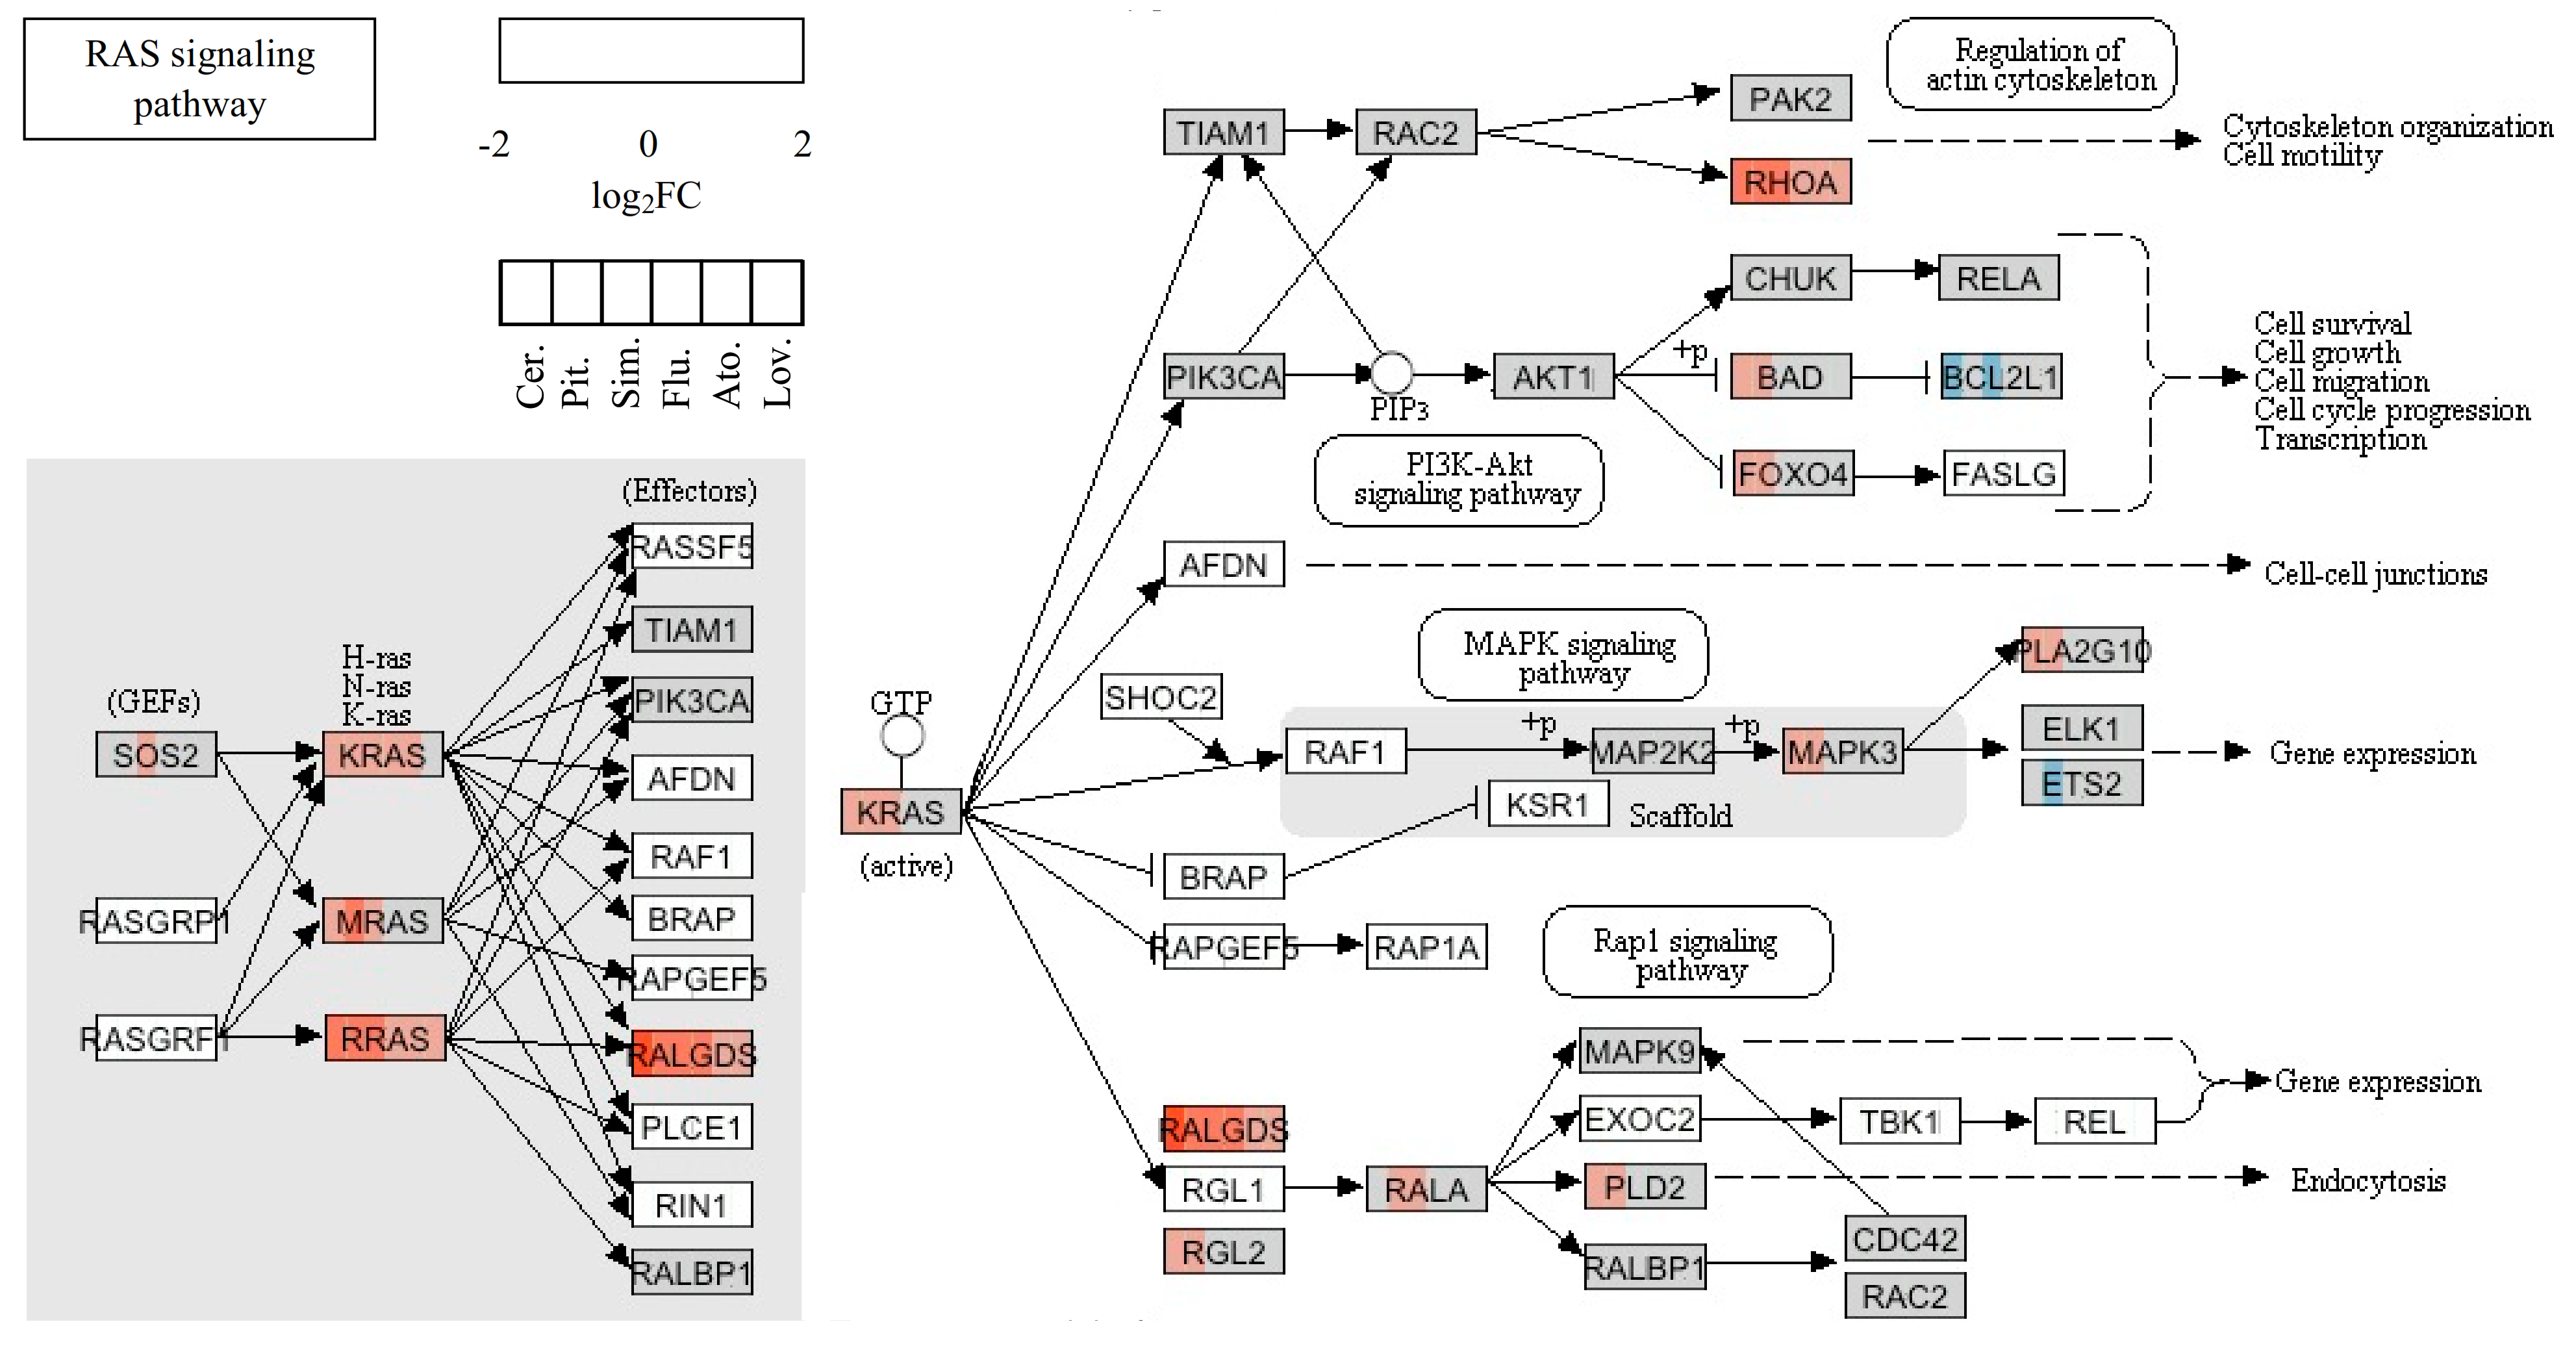
31]. In the present study, we observed that depletion of farnesylated K-Ras protein caused by the three most effective statins led to significant upregulation of gene-encoding K-Ras.
The pleiotropic effect of statins is comprehensible, since K-Ras is related to many functional pathways, such as the MAPK signaling pathway, the ErbB signaling pathway, dorso-ventral axis formation, axon guidance, the VEGF signaling pathway, tight junction, gap junction, natural killer cell-mediated cytotoxicity, the T-cell receptor signaling pathway, the B-cell receptor signaling pathway, the Fc epsilon RI signaling pathway, long-term potentiation, long-term depression, regulation of actin cytoskeleton, the insulin signaling pathway, and the GnRH signaling pathway. Moreover, the upregulation of KRAS after the statin treatment seemed to be a result of the unavailability of farnesylated K-Ras protein for cell signaling due to the mevalonate pathway inhibition. Similarly, this mechanism could also explain the upregulation of other Ras and Ras-related proteins induced by statin treatment (Table 3). However, the products of the mevalonate pathway are required not only for post-translational modifications of many proteins, but also for regulation of the transcription of many proteins, including proteins of the cytoskeleton. For example, expression of keratin 13 is known to be regulated by nuclear receptor ligands such as retinoids, 1α, 25-dihydroxy vitamin D3, or estrogen [65]. Except for the metabolism of lipids (biosynthesis of steroids and sphingolipid metabolism), the inhibition of the mevalonate pathway by statins directly affected the energy metabolism due to ubiquinone depletion, as ubiquinone is involved in mitochondrial respiration [80].
Genetic heterogeneity is an important factor that affects the sensitivity of particular cancer cells to the antiproliferative/proapoptotic effects of statins. Despite the level of cancer cell differentiation, pancreatic cancer cell lines harboring activating K-Ras mutation were more sensitive to the antiproliferative effect of statins than cells harboring wild-type K-Ras [31]. Similarly, Wong et al. demonstrated that only 8 of 17 multiple myeloma cell lines evaluated were sensitive to lovastatin-induced apoptosis, while resistant cell lines had different genetic profiles [81].
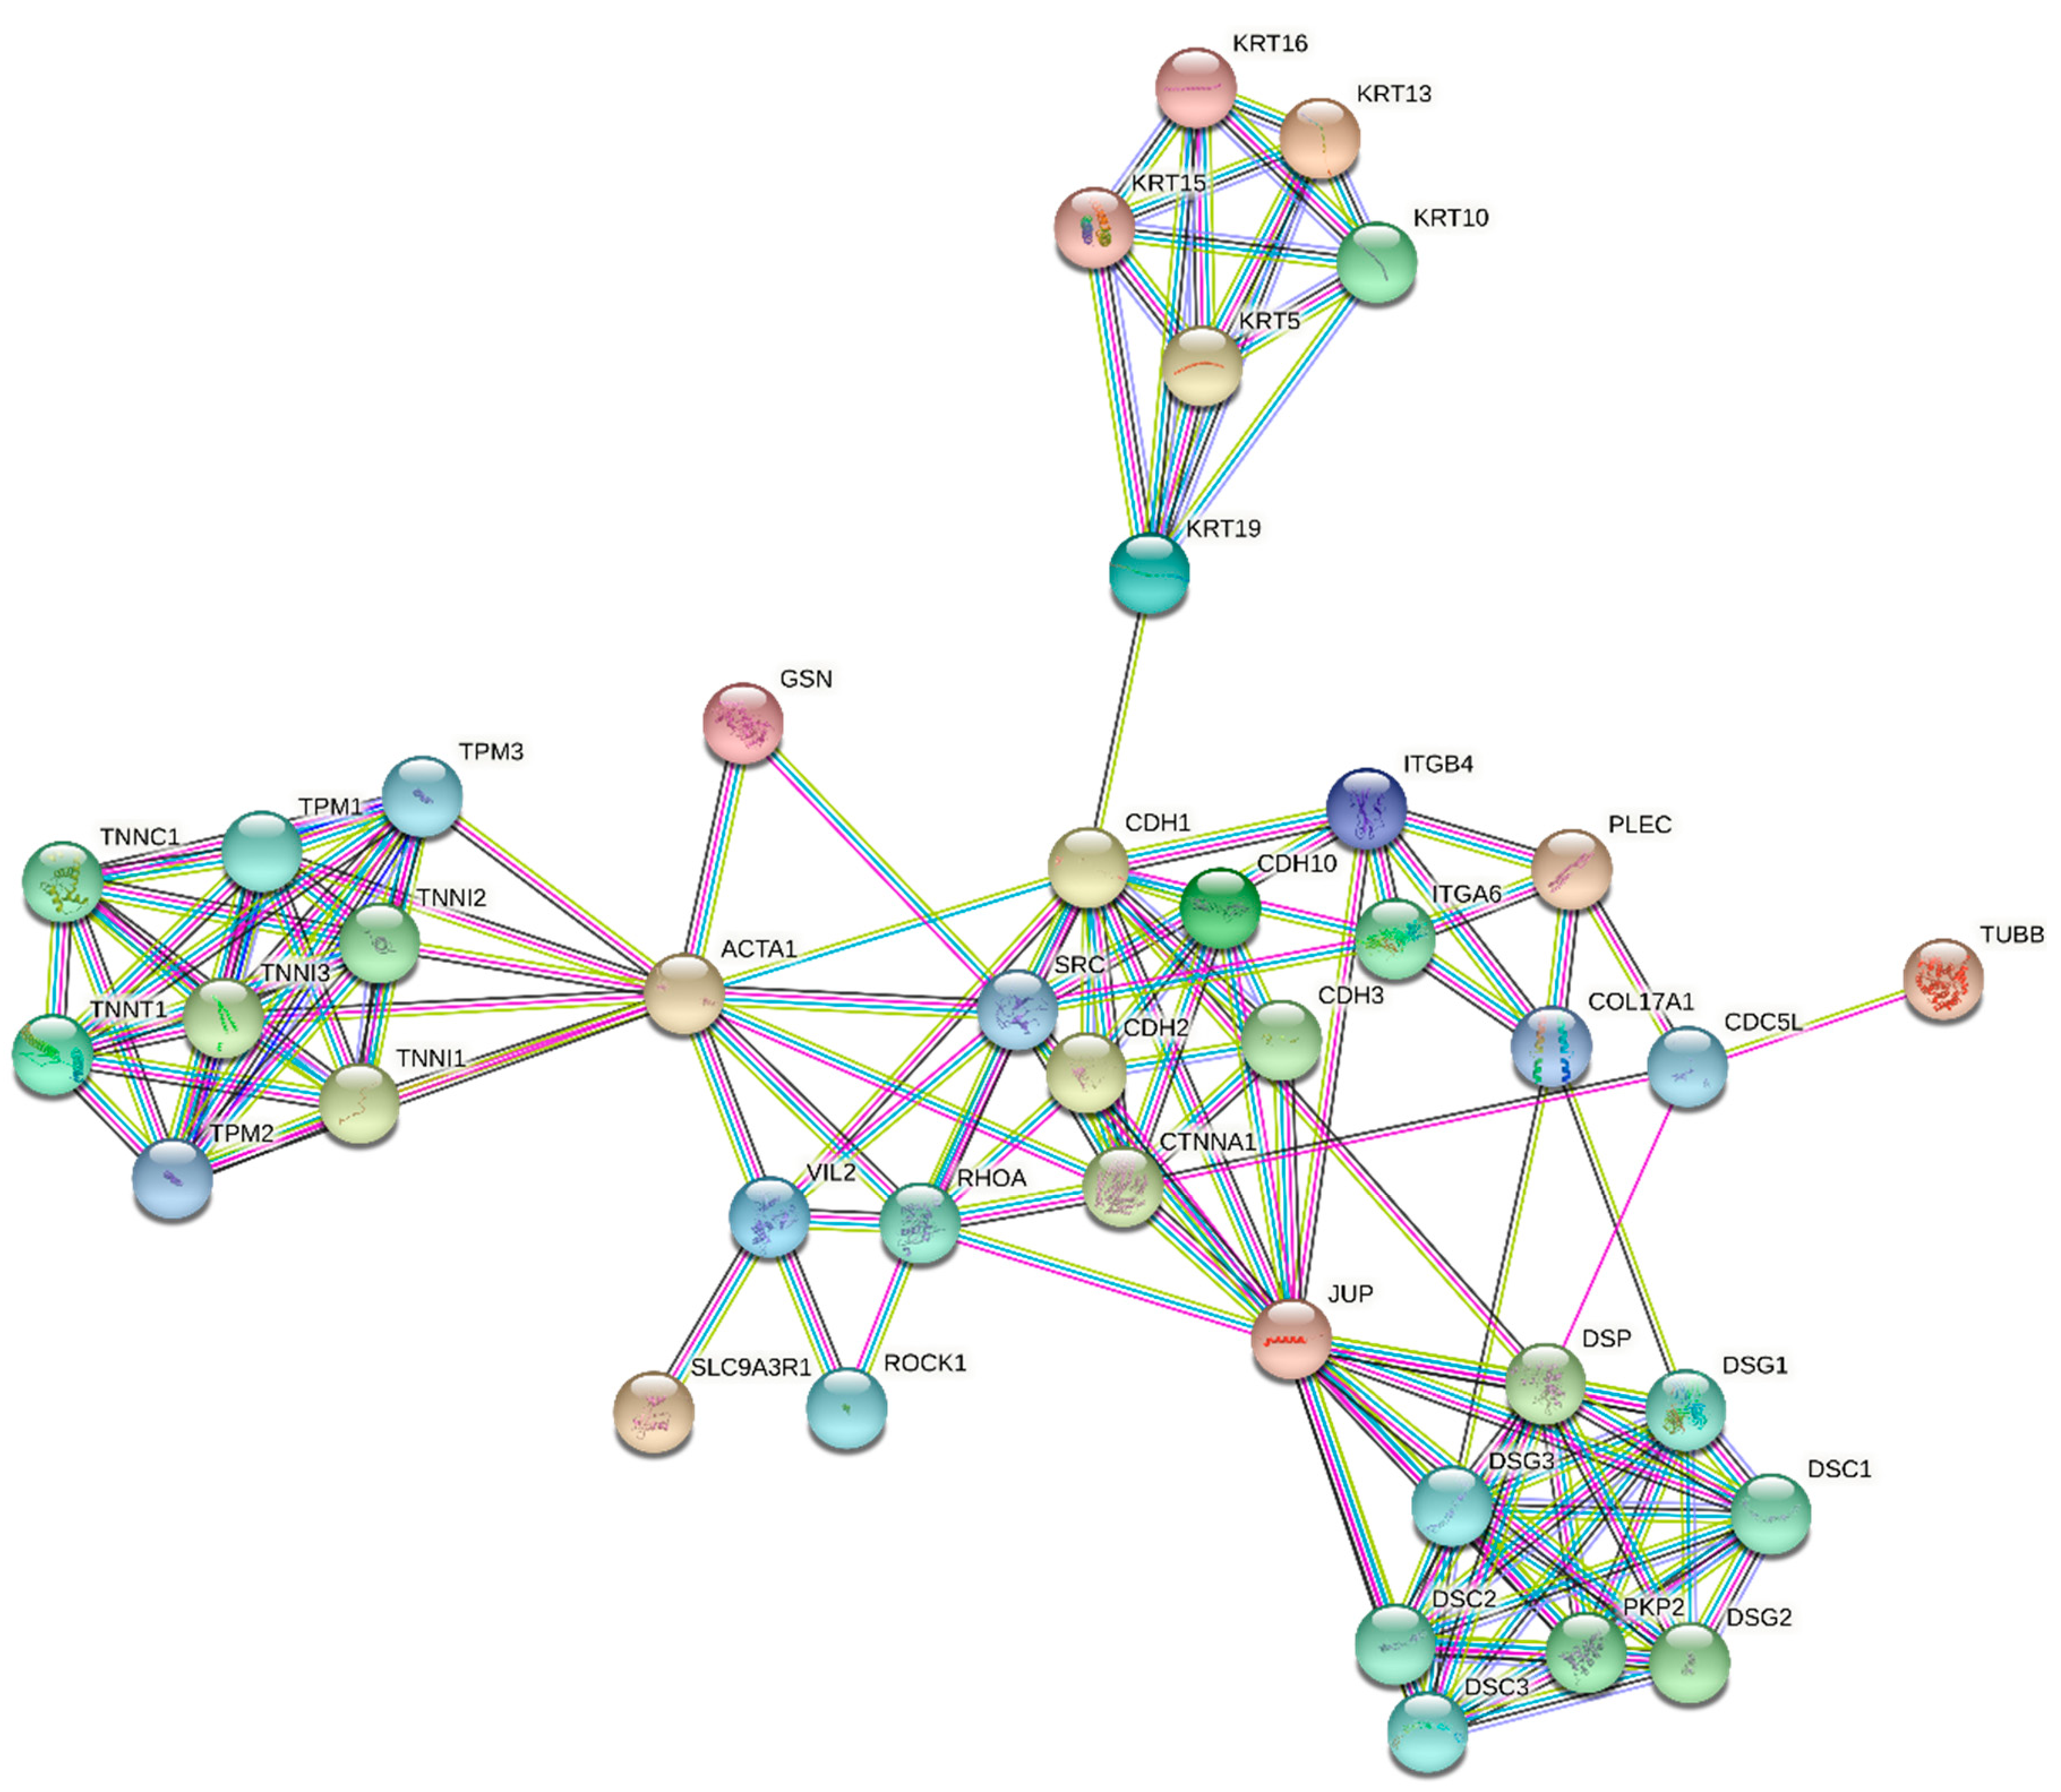
The first effect of statins, specifically simvastatin, studied by microarray analysis was focused on actomyosin contraction, gap formation, and barrier dysfunction produced by thrombin. The experiment was performed in human pulmonary artery endothelial cells (EC) treated with 5 µM simvastatin for 24 h. Several genes related to thrombin-mediated cytoskeletal dynamics and barrier regulation, including caldesmon and the thrombin receptor PAR-1, were dramatically downregulated. In addition, ITGB4, a protein known to be involved in cell–cell adhesion, was dramatically upregulated. RhoA and RhoC genes were also upregulated similarly to Rac1 and specific GEFs, potential regulators of preferential Rho GTPase activity. In contrast, the RhoGDP dissociation inhibitor was downregulated, which was interpreted as a compensatory response [82]. Consistent with these data, our results also indicated that statins directly affected the expression of specific genes related to the Rho GTPase signaling and cytoskeletal regulation. However, from all the Rho family members, only RhoB was significantly upregulated by all effective statins (pravastatin and rosuvastatin were not effective in our microarray study), and RhoA was significantly upregulated only by the most effective statins (cerivastatin, pitavastatin, and simvastatin). No changes were observed in the expression of genes encoding specific GEFs. Also, downregulation of caldesmon or the thrombin receptor PAR-1 was not observed in our study. This could vary in different types of cell lines evaluated.
Interestingly, a gene encoding the integrin beta 4 subunit of a receptor for the laminins; i.e., Itgb4, was the most significantly upregulated gene (fold change—7.57) of all the tested genes [83]. The reason for the enhanced transcription of a gene involved in the biology of invasive carcinoma is unclear. Another notable finding is that no changes were observed in the expression of the RhoB gene after treatment of EC with 5 µM simvastatin [84], whereas in our study, the RhoB gene was the more affected gene compared to the Itgb4 gene after treatment with all effective statins.
In the other study, the DNA microarrays were used to identify gene expression patterns in the cerebral cortex of mice treated with simvastatin (50 mg/kg b.wt.) by daily oral doses for 21 days. The maximum average concentration of simvastatin was determined as 600 pmol/g in brains. This study revealed the influence of simvastatin on the expression of several genes involved in cell growth and signaling. C-fos, c–myc, and Bcl-2 were of particular interest due to the linkage of simvastatin with cell growth and apoptosis. Simvastatin significantly reduced the expression of the proto-oncogene c-fos. On the other hand, it significantly increased the expression of the oncogene c-myc and antiapoptotic gene Bcl-2 [84,85]. In contrast to these data, neither the expression of previously mentioned genes nor of other genes attributed to apoptotic cell death (e.g., genes encoding death receptors or caspases, the only exception to which was caspase 9, which was upregulated by cerivastatin) were affected by statins in our microarray analysis. However, as demonstrated by the analysis of the most affected functional pathways, statins affected some processes related to DNA repair, such as base excision repair or mismatch repair [30]. It is known that failure of these processes could be followed by programmed necrosis [
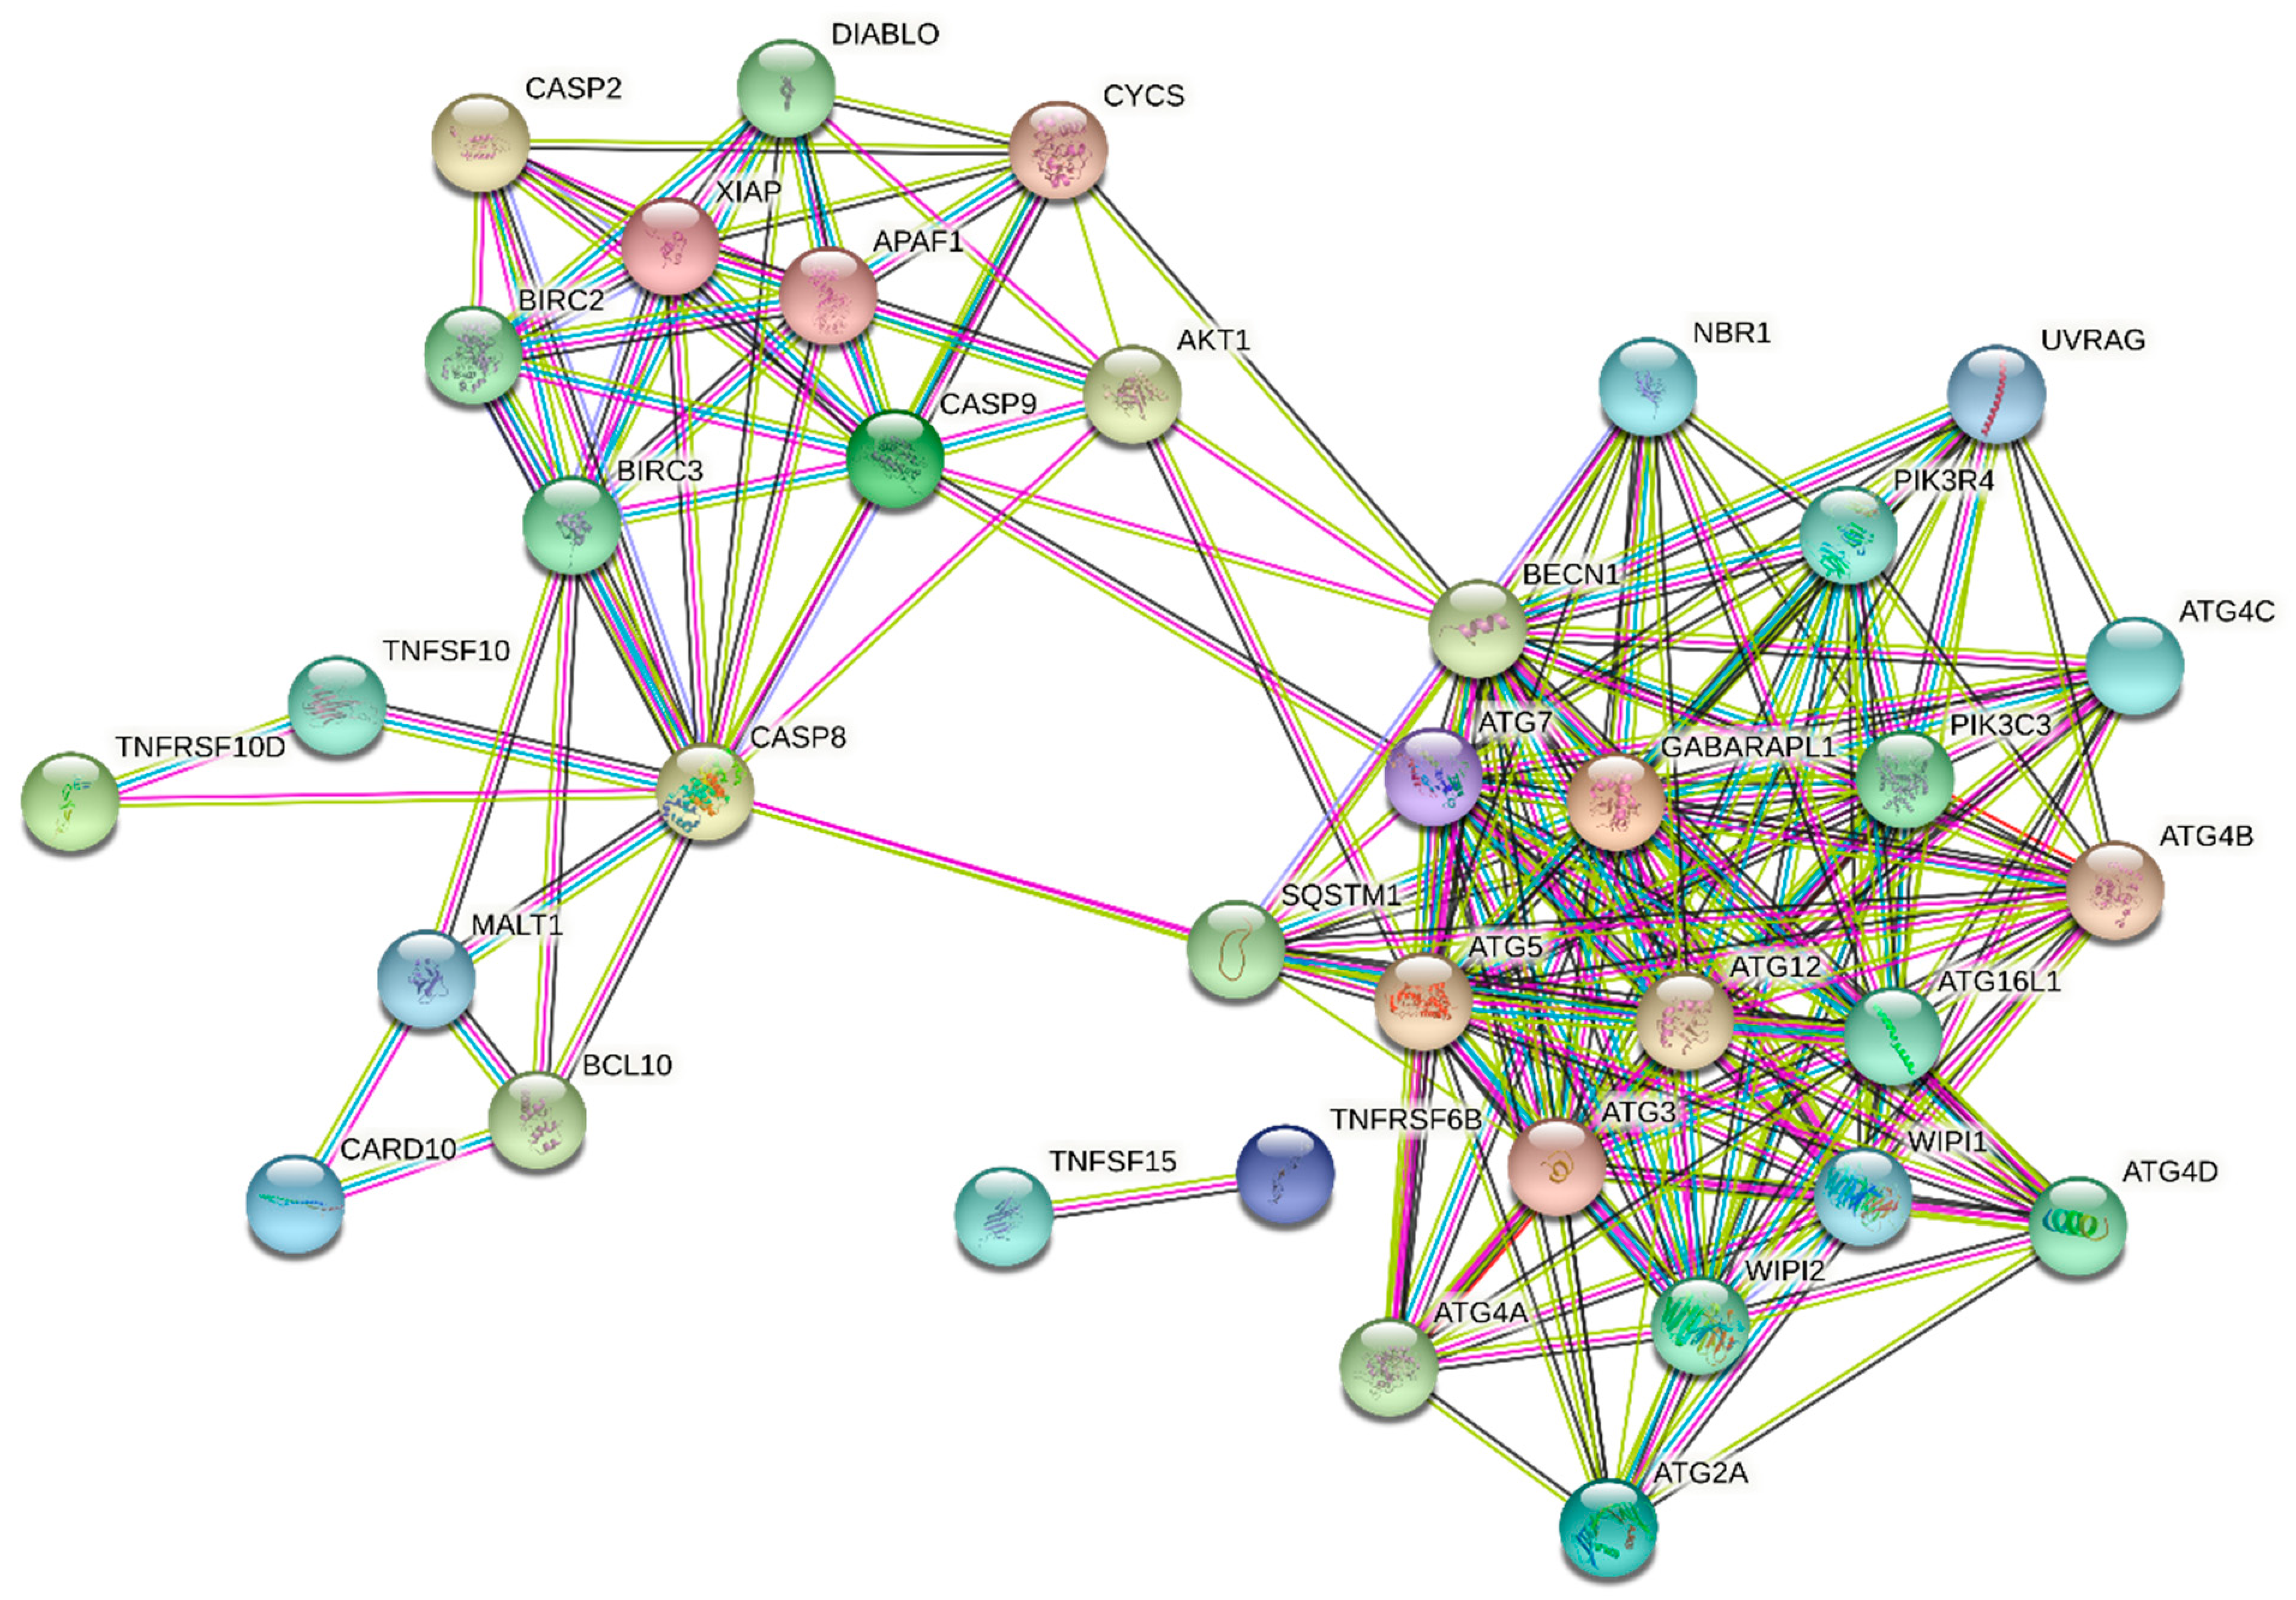
86]. Finally, the upregulation of the GABARAPL gene related to autophagy was observed (Table 5). Autophagy does not always result in programmed cell death, but it represents the important mechanism for catabolic production of ATP during nutrient stress, and also plays an important role in the turnover of proteins and organelles under nutrient-replete conditions [87]. The statin-treated cells were in nutrient stress due to inhibition of the mevalonate pathway. From many end products of this pathway, ubiquinone is required in a process of ATP formation during oxidative phosphorylation. Moreover, oxidative phosphorylation is also reported as one of the significantly affected functional pathways by statins [30]. Interestingly, it was published that ubiquitinated hydrophobic proteins that are prone to aggregation are kept on the surface of lipid droplets and subjected to autophagy, as well as proteasomal degradation [88].
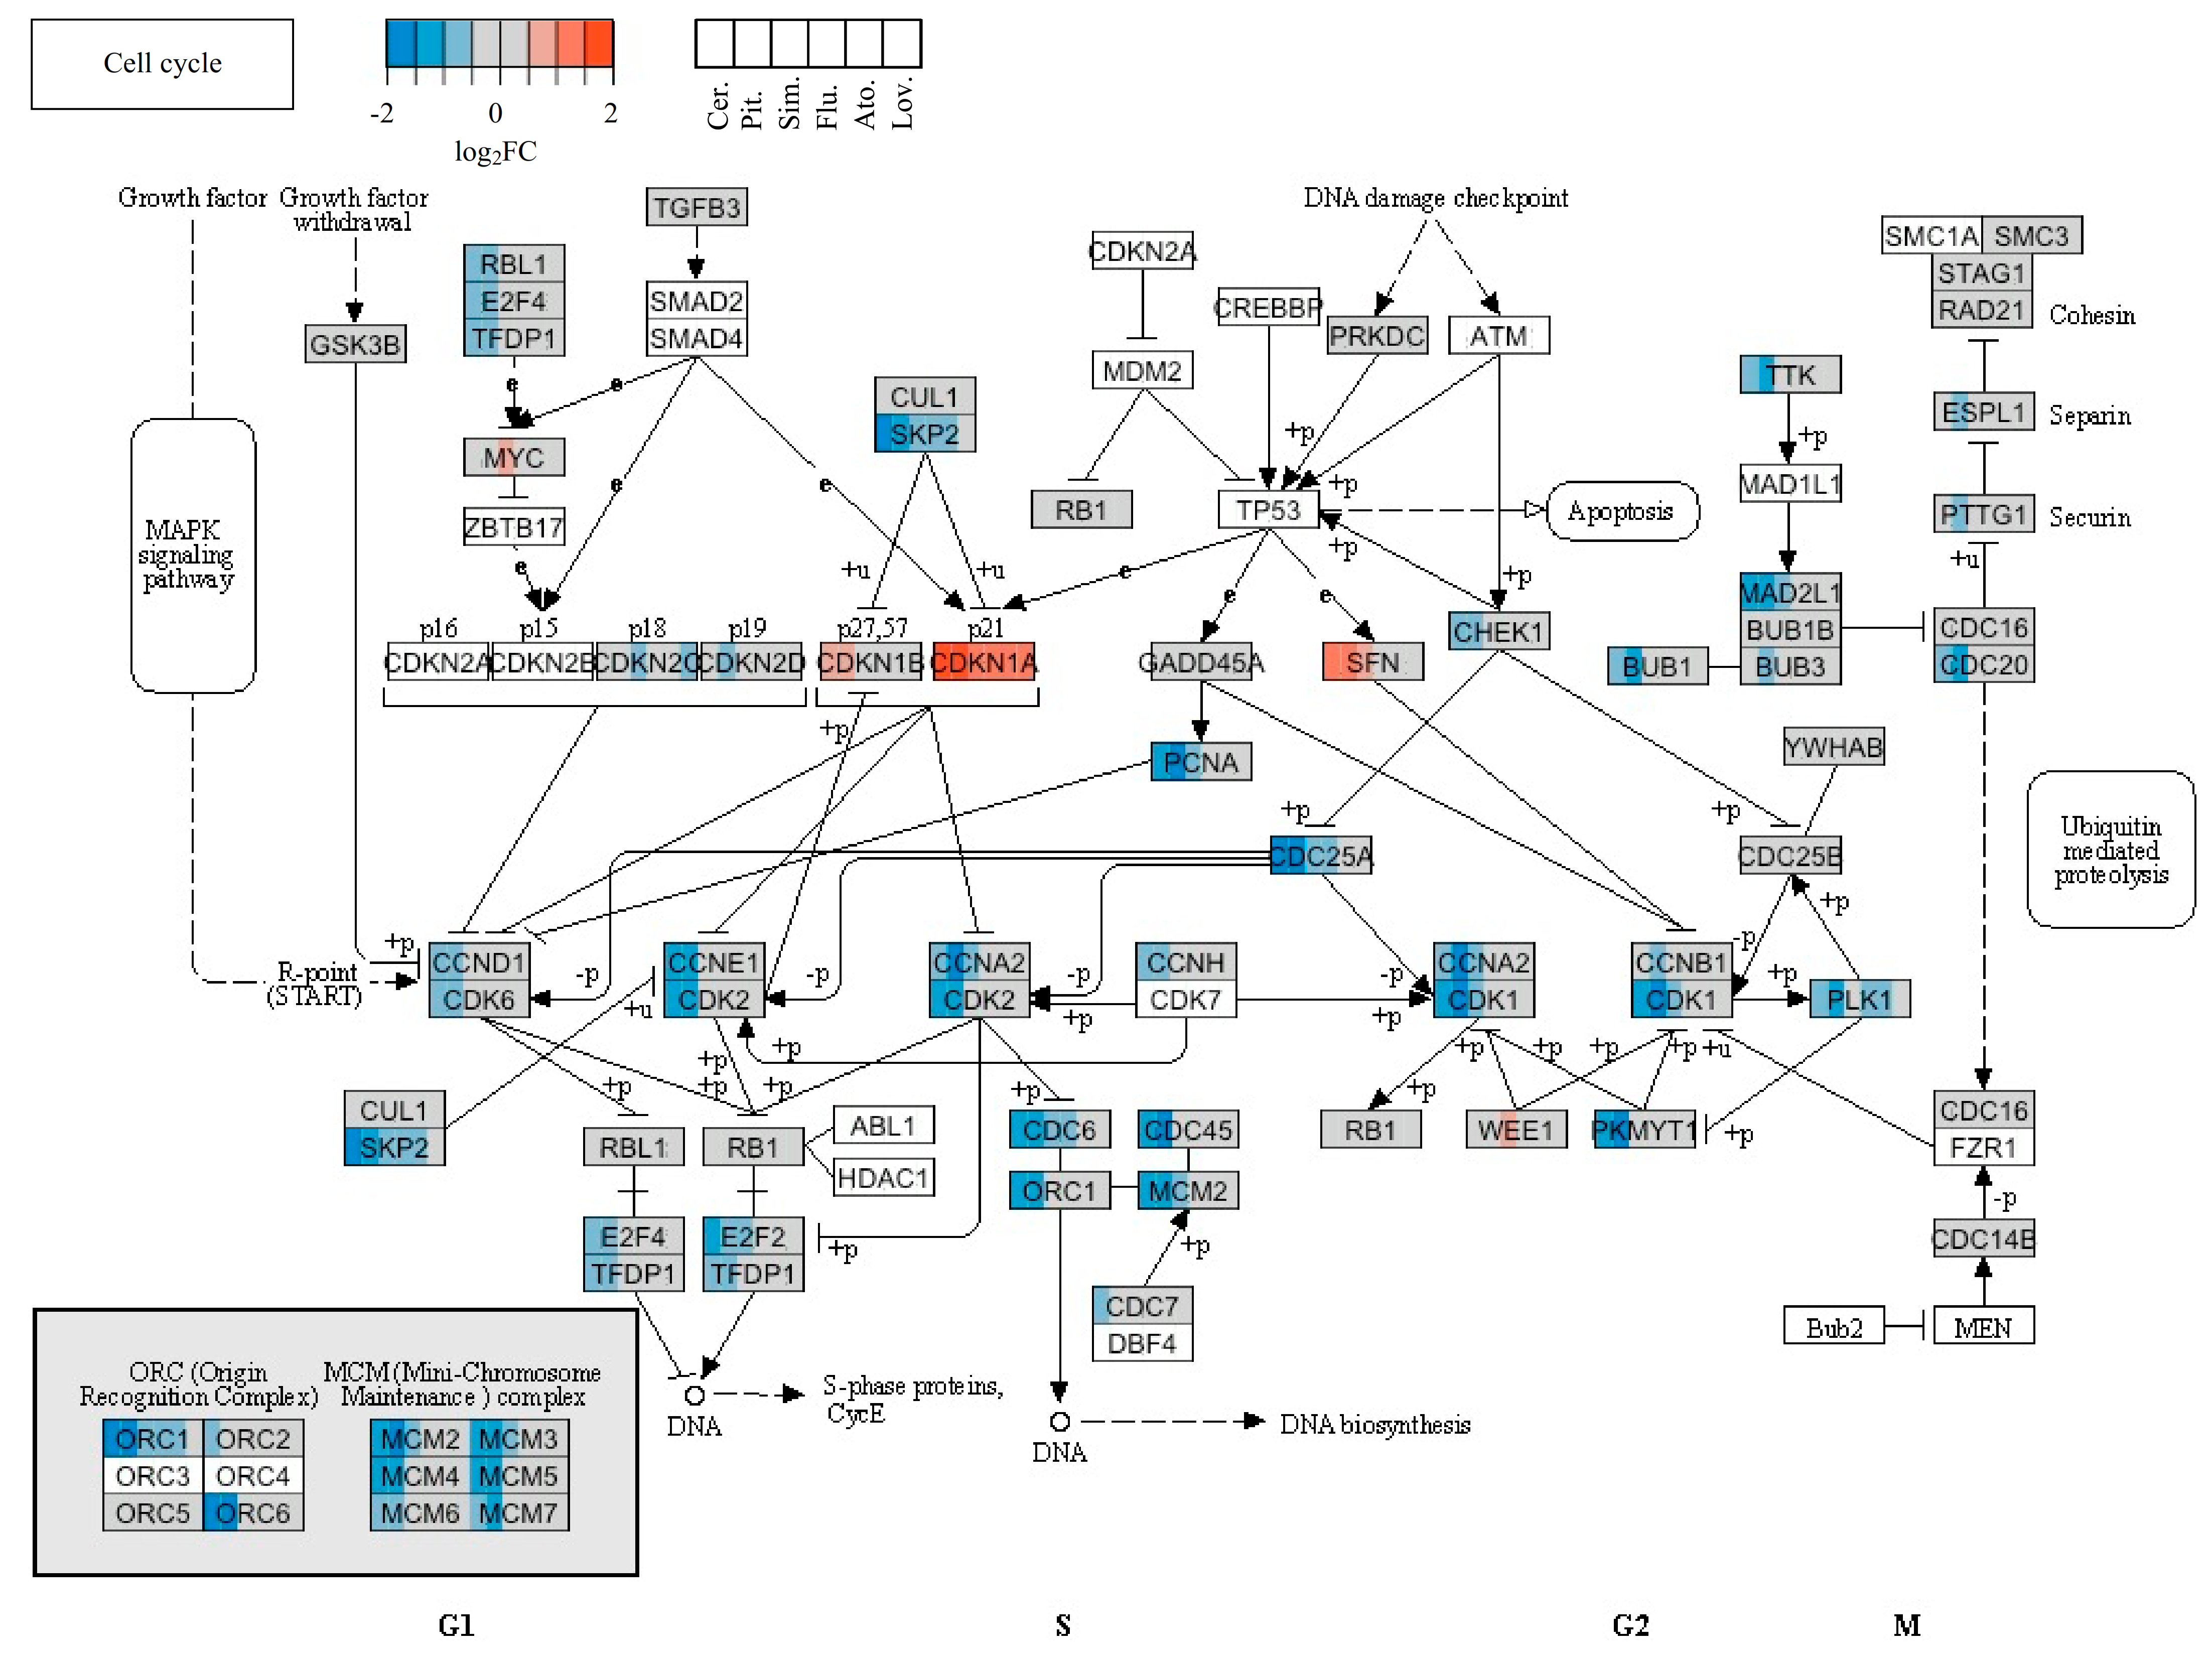
The cell-cycle arrest represents another frequently discussed event associated with statins. Many reports describe the effect of individual statins on the expression of cell-cycle-related genes. For example, changes in the expression of genes related to the cell cycle in chronic myelogenous leukemia cells K562 were described. Fifteen downregulated and 9 upregulated cell-cycle-related genes were observed in the presence of 20 µM simvastatin for 48 h. The results of flow cytometry showed that the cell cycle was arrested in the G1 phase [89]. Assmus et al. performed a microarray analysis of about 12,000 genes in endothelial progenitor cells (a primary cell line) treated with 0.1 µM atorvastatin for 10 h. The expression of cyclins and proliferating cell nuclear antigen (PCNA) was increased after atorvastatin treatment. Moreover, the expression of the cell-cycle inhibitory protein p27 was reduced [90]. In the next study, downregulation of cyclin D1, PCNA, and c-myc, and upregulation of p21 and p19, were provided by the treatment of human breast cancer cells with cerivastatin [91].
In our microarray analysis, the expression of genes encoding cyclin D1 was affected only by cerivastatin, cyclin A2 by pitavastatin, and cyclin E2 by both mentioned statins, similar to the PCNA gene. Other statins did not affect the expression of genes encoding cyclins or PCNA. The expression of the p21 gene was increased by all effective statins. Moreover, the genes associated with DNA replication, such as ORC1L, MCM2, or MCM3, were downregulated by cerivastatin and pitavastatin (
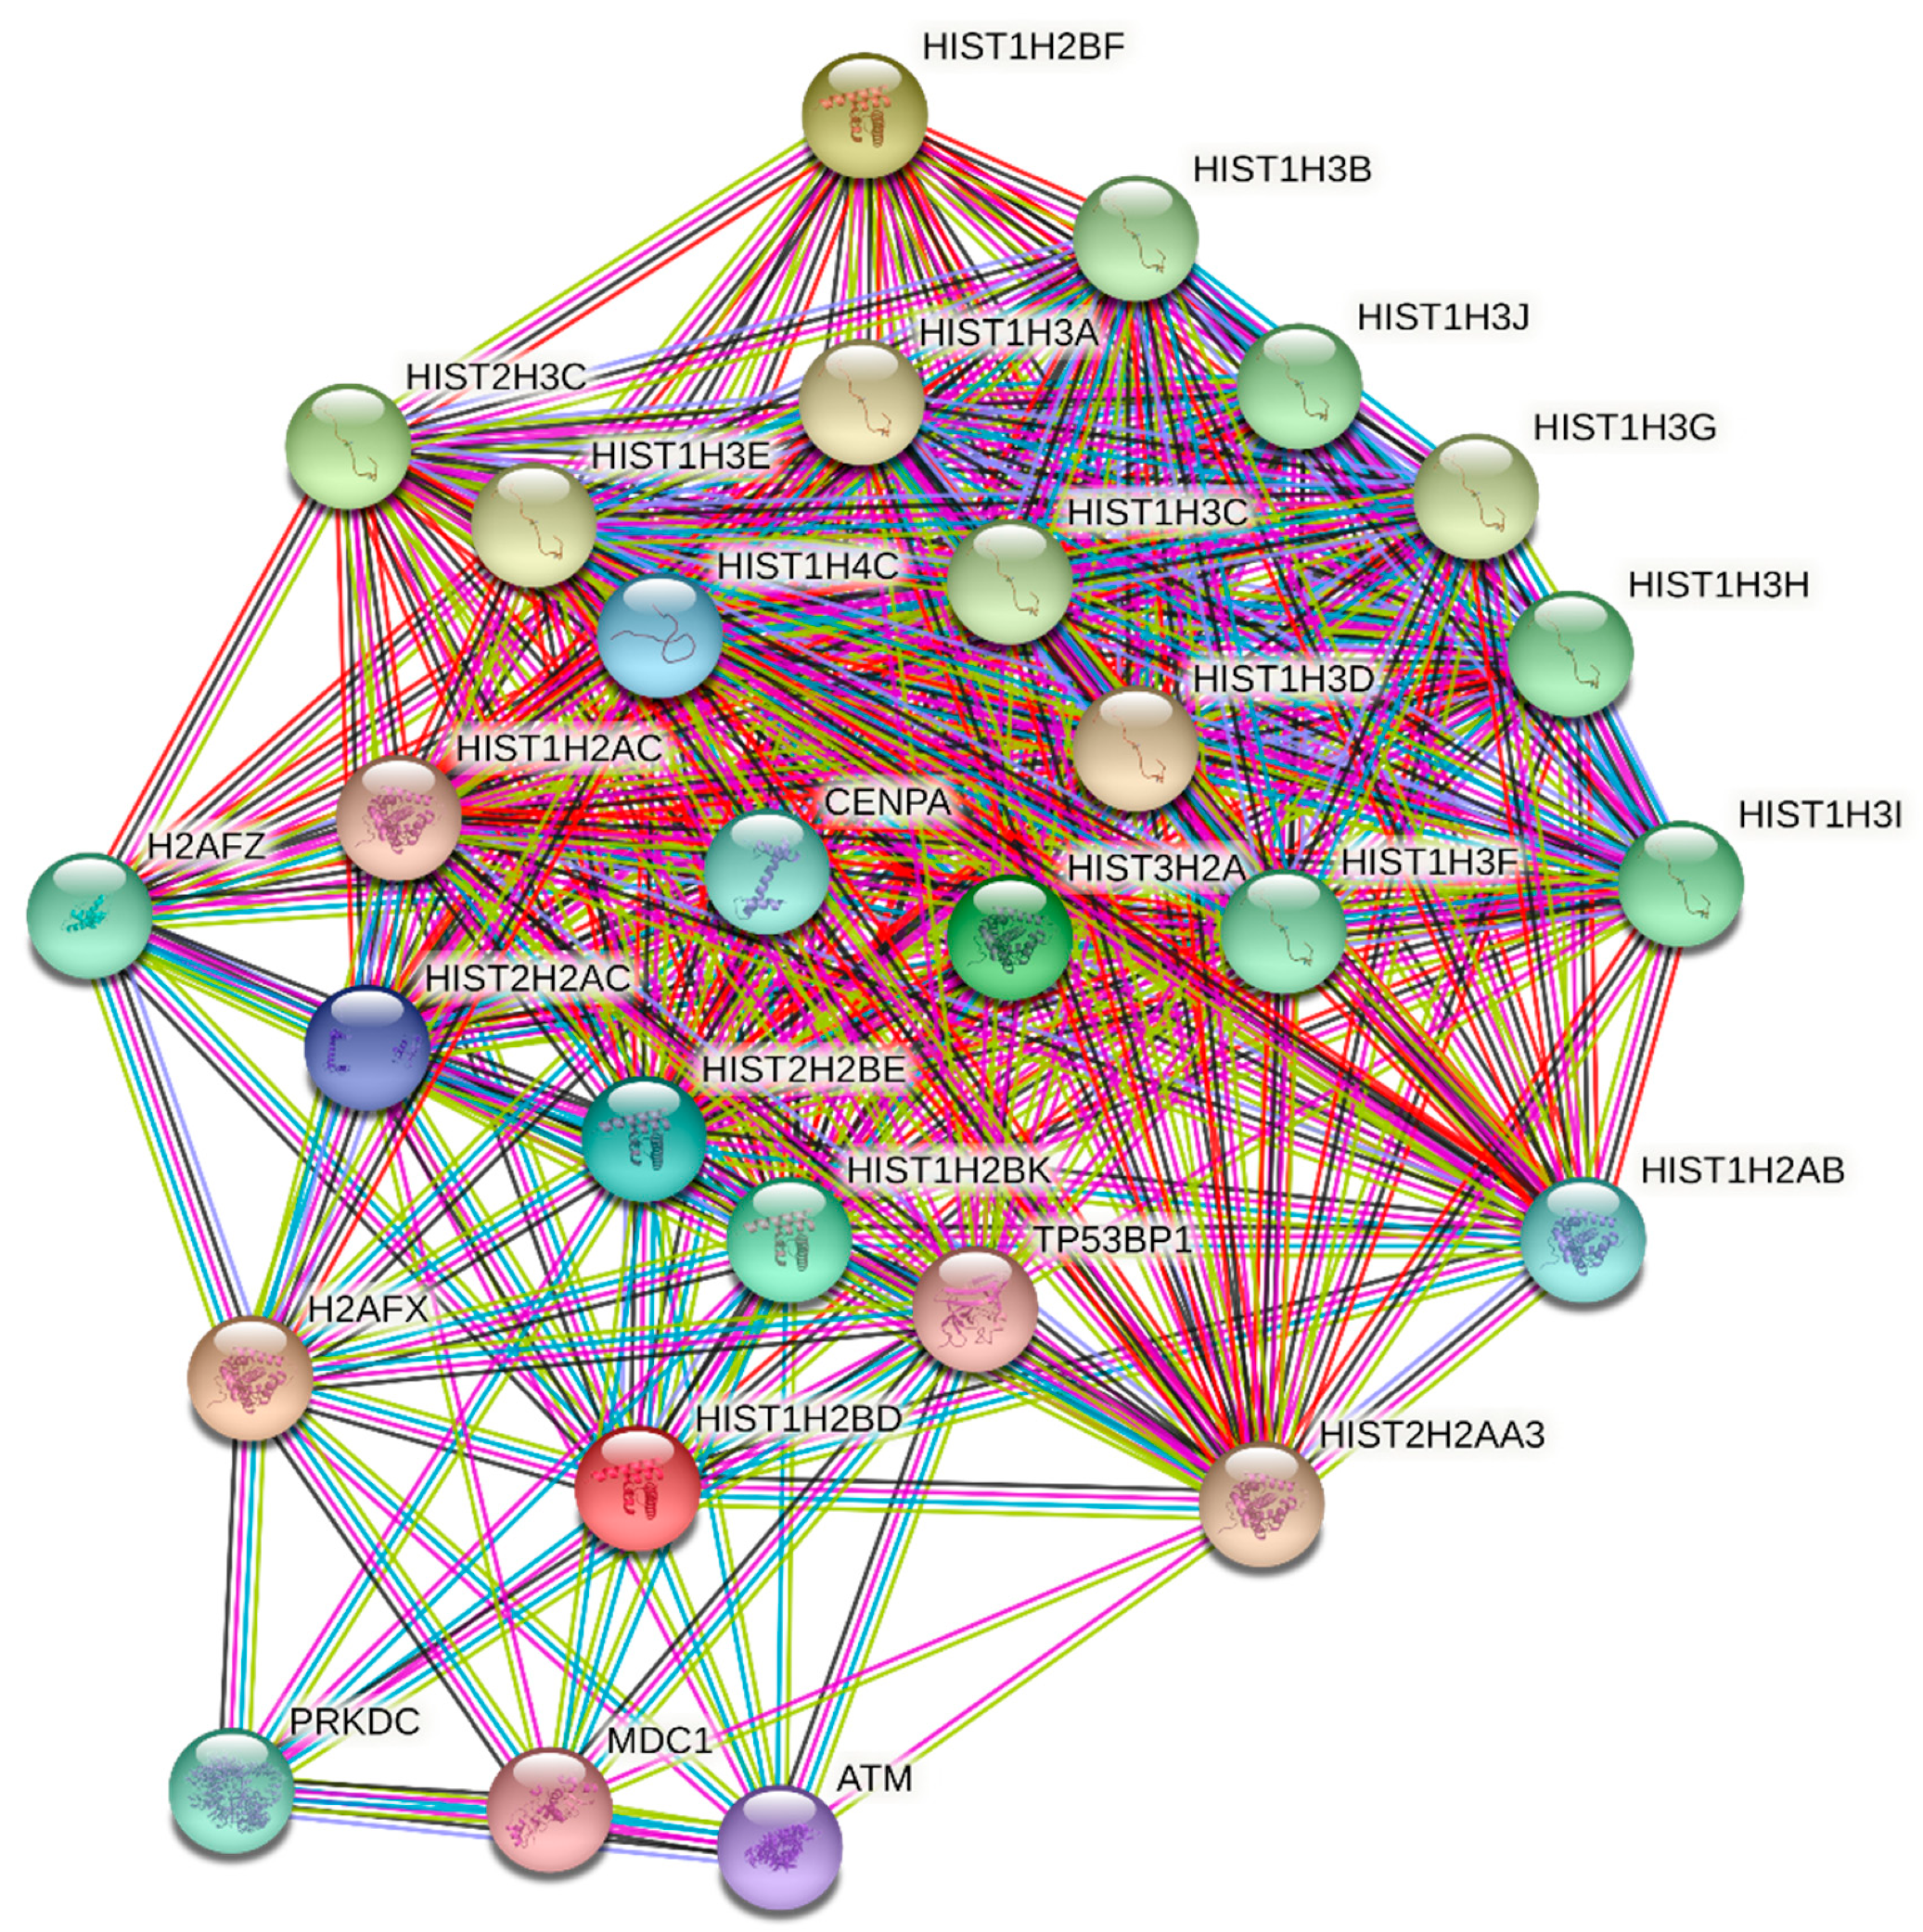
Table 4). This suggests that statins blocked the progress of the cell cycle through the S phase of MiaPaCa-2 cells. The downregulation of the genes encoding histone H4 and upregulation of the gene encoding histone H2B by the three most effective statins (cerivastatin, pitavastatin, and simvastatin) also was very interesting. The effect of simvastatin on expression of the gene encoding histone was also observed in a report by Johnson-Anuna et al., in which the expression level of the gene encoding the linker histone H1.2 was increased after simvastatin therapy [84]. Likewise, other proteins related to the S phase (SKP2, E2F2) or M phase (CDC2, CDC25B) were downregulated by cerivastatin and pitavastatin treatment of MiaPaCa-2 cells in our study, indicating that except for the G1 phase, the most effective statins blocked the cell-cycle entry into the M phase. This was not surprising, as lovastatin is used in the cell-cycle synchronization protocols [92] and as a pharmacological tool for controlling the growth of neoplastic cells both in vitro and in vivo [23,93,94]. Furthermore, lovastatin is commercially available as an inhibitor of the cell cycle in the G1 and G2/M phases (Sigma, USA). The G1 block has been attributed to the inhibition of either cytokinesis or cell spreading following cytokinesis [95]. Several authors have also noted the retardation or arrest of the cell cycle at the G2/M transition [93,94,96]. However, the mechanism of the cell-cycle arrest by statins is not exactly clear. Despite a piece of evidence that lovastatin suppresses cell proliferation through inhibition of proteasome-mediated degradation of p21 and p27 [97], it was concluded that lovastatin neither synchronizes cells nor arrests the cells in the G1 phase of the division cycle [98].
To explain the reported results, the distinct impact of statins on gene expression profiles in MiaPaCa-2 cells should be related to their inhibitory activity interfering with the mevalonate pathway. Quantum biochemistry computations indicated some variations among the attractive forces of four tested statins (atorvastatin, rosuvastatin, simvastatin, and fluvastatin) and the HMG-CoA reductase binding site. The highest binding energies was determined for atorvastatin followed by rosuvastatin, while the lowest were found for simvastatin and fluvastatin; i.e., binding energies of 320, 310, 290, and 290 kcal·mol-1, respectively [99]. However, in this study, cerivastatin, lovastatin, and pitavastatin were not included in the calculations. In another study, the crystal structures of the catalytic moiety of HMG-CoA reductase in a complex with six statins documented van der Waals interactions of the rigid hydrophobic moieties of the statins through a shallow nonpolar binding pocket and a part of the binding surface for CoA [100]. These interactions prevented the binding of the substrate HMG-CoA to the active site of the enzyme. No dramatic differences were found among the numbers of binding interactions among the statins evaluated, namely: compactin, simvastatin, fluvastatin, cerivastatin, atorvastatin, and rosuvastatin. Atorvastatin, simvastatin, lovastatin, fluvastatin, and cerivastatin are relatively lipophilic and are metabolized by the cytochrome P450 system. The other lipophilic compound pitavastatin is metabolized poorly via this pathway. Very limited P450-mediated metabolization was reported also for hydrophilic pravastatin and rosuvastatin, which were only nonsignificantly metabolized. Interestingly, high systemic bioavailability was reported for both cerivastatin and pitavastatin (60% [101] and 80% [102], respectively), which could explain their large impact on changes in gene expression. Except for pravastatin, all the other statins were efficiently bound to plasma proteins. However, the unbound pravastatin was poorly distributed in tissues due to its high hydrophilic nature [103].
Further, the distinct efficacy of individual statins on both antiproliferative activity and changes in gene expression could be also correlated with the statin levels inside cells. This correlation was the strongest for the least efficient statins (rosuvastatin and pravastatin); whereas for the most bioavailable statins (in particular lovastatin), this correlation was not so strong [30]. Thus, the statin effects on whole gene expression correlated with their bioavailability, as well as the impact on cell viability, only to a limited extent. This hypothesis held for cerivastatin; however, not so for pitavastatin and lovastatin, which led us to the conclusion that other crucial factors played an important role in the differences of statin effects on pancreatic cancer cell proliferation.
In summary, differences in the efficacy of individual statins are known depending on their structure, concentration, duration of action, or microenvironment. Although tumor cells exhibit many identical properties, the effect of statins depends also on the cell type [104]. The antitumor effect of statins is not only a function of the mechanism of their action, but also of how they are metabolized. In general, healthy cells are generally more resistant to statins than tumor cells [105]. The use of statins in the treatment of cancer as monotherapeutics is not effective enough, but their use in combination with other therapeutic approaches would significantly increase the effectiveness of cancer treatments and patient survival [106,107].

Supplementary Materials

The following are available online: Table S1: Legend for figures from STRING database.

Author Contributions

Conceptualization, L.V., H.G., S.R.; methodology, L.V., H.S., H.G. software, M.K., S.R.; validation, H.S.; formal analysis, M.K., H.G.; investigation, L.V., H.S., H.G.; resources, S.R., M.K., H.G.; data curation, M.K., H.G., S.R.; writing—original draft preparation, H.G., S.R.; writing—review and editing, M.K., T.R., L.V.; visualization S.R., M.K.; supervision, L.V., T.R; project administration, L.V.; funding acquisition, L.V., T.R. All authors have read and agreed to the published version of the manuscript.

Funding

This research was funded by grant no. APVV-15-0217 given by the Slovak Research and Devel-opment Agency; by the Operational Programme Research, Development, and Education (Reg. No. CZ.02.1.01/0.0/0.0/16_019/0000785); and by grant no. RVO-VFN64165/2021 given by the Czech Ministry of Health.

Institutional Review Board Statement:

Not applicable.

Informed Consent Statement

Not applicable.

Data Availability Statement:

The gene microarray data have been deposited in the ArrayExpress database (accession number E-MTAB-3263).

Acknowledgments

We gratefully acknowledge Martina Krausová, Jana Šáchová, and Miluše Hradilová for excellent technical support.

Conflicts of Interest

The authors declare no conflict of interest.

References

  1. Goldstein, J.L.; Brown, M.S. A century of cholesterol and coronaries: From plaques to genes to statins. Cell 2015, 161, 161–172. [Google Scholar] [CrossRef] [PubMed] [Green Version]
  2. Alexandrova, R.; Dinev, D.; Glavcheva, M.; Danova, J.; Yetik-Anacak, G.; Krasilnikova, J.; Podlipnik, C. Briefly about anticancer properties of statins. Biomed. J. Sci. Tech. Res. 2019, 7, 12655–12659. [Google Scholar] [CrossRef] [Green Version]
  3. Mohammadkhani, N.; Gharbib, S.; Rajani, H.F.; Farzaneh, A.; Mahjoobe, G.; Hoseinsalari, A.; Korsching, E. Statins: Complex outcomes but increasingly helpful treatment options for patients. European J. Pharmacol. 2019, 863, 1–8. [Google Scholar] [CrossRef] [PubMed]
  4. Tavintharan, S.; Ong, C.N.; Jeyaseelan, K.; Sivakumar, M.; Lim, S.C.; Sum, C.F. Reduced mitochondrial coenzyme Q10 levels in HepG2 cells treated with high-dose simvastatin: A possible role in statin-induced hepatotoxicity? Toxicol. Appl. Pharmacol. 2007, 223, 173–179. [Google Scholar] [CrossRef] [PubMed]
  5. Svoboda, M.; Vyskočil, J.; Nováková, J. Statiny v onkologii. Klin. Farmakol. Farm. 2005, 19, 155–159. [Google Scholar]
  6. Newman, T.B.; Hulley, S.B. Carcinogenicity of lipid-lowering drugs. JAMA 1996, 275, 55–60. [Google Scholar] [CrossRef] [PubMed]
  7. Dalen, J.E.; Dalton, W.S. Does lowering cholesterol cause cancer? JAMA 1996, 275, 67–69. [Google Scholar] [CrossRef]
  8. Sacks, F.M.; Pfeffer, M.A.; Moye, L.A.; Rouleau, J.L.; Rutherford, J.D.; Cole, T.G.; Brown, L.; Warnica, J.W.; Arnold, J.M.; Wun, C.C.; et al. The effect of pravastatin on coronary events after myocardial infarction in patients with average cholesterol levels. Cholesterol and recurrent events trial investigators. N. Engl. J. Med. 1996, 335, 1001–1009. [Google Scholar] [CrossRef]
  9. Downs, J.R.; Clearfield, M.; Weis, S.; Whitney, E.; Shapiro, D.R.; Beere, P.A.; Langendorfer, A.; Stein, E.A.; Kruyer, W.; Gotto, A.M., Jr. Primary prevention of acute coronary events with lovastatin in men and women with average cholesterol levels: Results of AFCAPS/TexCAPS. Air Force/Texas Coronary Atherosclerosis Prevention Study. JAMA 1998, 279, 1615–1622. [Google Scholar] [CrossRef]
  10. Graaf, M.R.; Beiderbeck, A.B.; Egberts, A.C.; Richel, D.J.; Guchelaar, H.J. The risk of cancer in users of statins. Am. J. Clin. Oncol. 2004, 22, 2388–2394. [Google Scholar] [CrossRef]
  11. Scandinavian Simvastatin Survival Study Group. Randomised trial of cholesterol lowering in 4444 patients with coronary heart disease: The Scandinavian Simvastatin Survival Study (4S). Lancet 1994, 344, 1383–1389. [Google Scholar] [CrossRef]
  12. Shepherd, J.; Cobbe, S.M.; Ford, I.; Isles, C.G.; Lorimer, A.R.; MacFarlane, P.W.; McKillop, J.H.; Packard, C.J. West of Scotland Coronary Prevention Study Group. Prevention of coronary heart disease with pravastatin in men with hypercholesterolemia. N. Engl. J. Med. 1995, 333, 1301–1307. [Google Scholar] [CrossRef]
  13. Lewis, S.J.; Sacks, F.M.; Mitchell, J.S.; East, C.; Glasser, S.; Kell, S.; Letterer, R.; Limacher, M.; Moye, L.A.; Rouleau, J.L.; et al. Effect of pravastatin on cardiovascular events in women after myocardial infarction: The cholesterol and recurrent events (CARE) trial. J. Am. Coll. Cardiol. 1998, 32, 40–46. [Google Scholar] [CrossRef] [Green Version]
  14. Ridker, P.M.; Rifai, N.; Pfeffer, M.A.; Sacks, F.M.; Moye, L.A.; Goldman, S.; Flaker, G.C.; Braunwald, E. Inflammation, pravastatin, and the risk of coronary events after myocardial infarction in patients with average cholesterol levels. Cholesterol and recurrent events (CARE) investigators. Circulation 1998, 98, 839–844. [Google Scholar] [CrossRef]
  15. Long-Term Intervention with Pravastatin in Ischaemic Disease (LIPID) Study Group. Prevention of cardiovascular events and death with pravastatin in patients with coronary heart disease and a broad range of initial cholesterol levels. N. Engl. J. Med. 1998, 339, 1349–1357. [Google Scholar] [CrossRef] [Green Version]
  16. Athyros, V.G.; Papageorgiou, A.A.; Mercouris, B.R.; Athyrou, V.V.; Symeonidis, A.N.; Basayannis, E.O.; Demitriadis, D.S.; Kontopoulos, A.G. Treatment with atorvastatin to the National Cholesterol Educational Program goal versus ‘usual’ care in secondary coronary heart disease prevention. The GREek Atorvastatin and Coronary-heart-disease Evaluation (GREACE) study. Curr. Med. Res. Opin. 2002, 18, 220–228. [Google Scholar] [CrossRef]
  17. Khurana, V.; Bejjanki, H.R.; Caldito, G.; Owens, M.W. Statins reduce the risk of lung cancer in humans: A large case-control study of US Veterans. Chest 2007, 131, 1282–1288. [Google Scholar] [CrossRef]
  18. Kochhar, R.; Khurana, V.; Bejjanki, H.; Caldito, G.; Fort, C. Statins reduce breast cancer risk: A case control study in US female veterans. J. Clin. Oncol. 2005, 23, 514. [Google Scholar] [CrossRef]
  19. Singal, R.; Khurana, V.; Caldito, G.; Fort, C. Statins and prostate cancer risk. J. Clin. Oncol. 2005, 23, 1004. [Google Scholar] [CrossRef]
  20. Poynter, J.N.; Gruber, S.B.; Higgins, P.D.; Almog, R.; Bonner, J.D.; Rennert, H.S.; Low, M.; Greenson, J.K.; Rennert, G. Statins and the risk of colorectal cancer. N. Engl. J. Med. 2005, 352, 2184–2192. [Google Scholar] [CrossRef] [Green Version]
  21. Kawata, S.; Nagase, T.; Yamasaki, E.; Ishiguro, H.; Matsuzawa, Y. Modulation of the mevalonate pathway and cell growth by pravastatin and dlimonene in a human hepatoma cell line (Hep G2). Br. J. Cancer 1994, 69, 1015–1020. [Google Scholar] [CrossRef] [Green Version]
  22. Hawk, M.A.; Cesen, K.T.; Siglin, J.C.; Stoner, G.D.; Ruch, R.J. Inhibition of lung tumor cell growth in vitro and mouse lung tumor formation by lovastatin. Cancer Lett. 1996, 109, 217–222. [Google Scholar] [CrossRef]
  23. Feleszko, W.; Jakobisiak, M. Lovastatin augments apoptosis induced by chemotherapeutic agents in colon cancer cells. Clin. Cancer Res. 2000, 6, 1198–1199. [Google Scholar]
  24. Kawata, S.; Yamasaki, E.; Nagase, T.; Inui, Y.; Ito, N.; Matsuda, Y.; Inada, M.; Tamura, S.; Noda, S.; Imai, Y.; et al. Effect of pravastatin on survival in patients with advanced hepatocellular carcinoma. A randomized controlled trial. Br. J. Cancer 2001, 84, 886–891. [Google Scholar] [CrossRef] [Green Version]
  25. Kim, W.S.; Kim, M.M.; Choi, H.J.; Yoon, S.S.; Lee, M.H.; Park, K.; Park, C.H.; Kang, W.K. Phase II study of high-dose lovastatin in patients with advanced Bystric adenocarcinoma. Incest. New Drugs 2001, 19, 81–83. [Google Scholar] [CrossRef]
  26. Larner, J.; Jane, J.; Laws, E.; Packer, R.; Myers, C.; Shaffrey, M. A phase I-II trial of lovastatin for anaplastic astrocytoma and glioblastoma multiforme. Am. J. Clin. Oncol. 1998, 21, 579–583. [Google Scholar] [CrossRef]
  27. Bonovas, S.; Filioussi, K.; Sitaras, N.M. Statins are not associated with a reduced risk of pancreatic cancer at the population level, when taken at low doses for managing hypercholesterolemia: Evidence from a meta-analysis of 12 studies. Am. J. Gastroenterol. 2008, 103, 2646–3651. [Google Scholar] [CrossRef]
  28. Bonovas, S.; Filioussi, K.; Tsantes, A.; Sitaras, N.M. Use of statins and risk of haematological malignancies: A meta-analysis of six randomized clinical trials and eight observational studies. Br. J. Clin. Pharmacol. 2007, 64, 255–262. [Google Scholar] [CrossRef] [Green Version]
  29. Bonovas, S.; Sitaras, N.M. Does pravastatin promote cancer in elderly patients? A metaanalysis. CMAJ 2007, 176, 649–654. [Google Scholar] [CrossRef] [Green Version]
  30. Gbelcová, H.; Rimpelová, S.; Ruml, T.; Fenclová, M.; Kosek, V.; Hajšlová, J.; Strnad, H.; Kolář, M.; Vítek, L. Variability in statin-induced changes in gene expression profiles of pancreatic cancer. Sci. Rep. 2017, 7, 44219. [Google Scholar] [CrossRef] [Green Version]
  31. Gbelcová, H.; Leníček, M.; Zelenka, J.; Knejzlík, Z.; Dvořáková, G.; Zadinová, M.; Poučková, P.; Kudla, M.; Balaž, P.; Ruml, T.; et al. Differences in antitumor effects of various statins on human pancreatic cancer. Int. J. Cancer 2008, 122, 1214–1221. [Google Scholar] [CrossRef] [PubMed]
  32. Longo, J.; van Leeuwen, J.E.; Elbaz, M.; Branchard, E.; Penn, L.Z. Statins as anticancer agents in the era of precision medicine. Clin. Cancer Res. 2020, 26, 5791–5800. [Google Scholar] [CrossRef] [PubMed]
  33. Mullen, P.J.; Yu, R.; Longo, J.; Archer, M.C.; Penn, L.Z. The interplay between cell signalling and the mevalonate pathway in cancer. Nat. Rev. Cancer 2016, 16, 718–731. [Google Scholar] [CrossRef] [PubMed]
  34. Di Bello, E.; Zwergel, C.; Mai, A.; Valente, S. The innovative potential of statins in cancer: New targets for new therapies. Front. Chem. 2020, 8, 516. [Google Scholar] [CrossRef] [PubMed]
  35. Ahmadi, M.; Amiri, S.; Pecic, S.; Machaj, F.; Rosik, J.; Łos, M.J.; Alizadeh, J.; Mahdian, R.; da Silva Rosa, S.C.; Schaafsma, D.; et al. Pleiotropic effects of statins: A focus on cancer. Biochim. Biophys. Acta Mol. Basis Dis. 2020, 1866, 165968. [Google Scholar] [CrossRef] [PubMed]
  36. Zhang, Y.; Liang, M.; Sun, C.; Qu, G.; Shi, T.; Min, M.; Wu, Y.; Sun, Y. Statin use and risk of pancreatic cancer an updated meta-analysis of 26 studies. Pancreas 2019, 48, 142–150. [Google Scholar] [CrossRef] [PubMed]
  37. Riscal, R.; Skuli, N.; Simon, M.C. Even cancer cells watch their cholesterol! Mol. Cell 2019, 76, 220–231. [Google Scholar] [CrossRef]
  38. Zhuang, L.; Kim, J.; Adam, R.M.; Solomon, K.R.; Freeman, M.R. Cholesterol targeting alters lipid raft composition and cell survival in prostate cancer cells and xenografts. J. Clin. Investig. 2005, 115, 959–968. [Google Scholar] [CrossRef] [Green Version]
  39. Gordon, R.E.; Zhang, L.; Peri, S.; Kuo, Y.M.; Du, F.; Egleston, B.L.; Ng, J.M.Y.; Andrews, A.J.; Astsaturov, I.; Curran, T.; et al. Statins synergize with hedgehog pathway inhibitors for treatment of medulloblastoma. Clin. Cancer Res. 2018, 24, 1375–1388. [Google Scholar] [CrossRef] [Green Version]
  40. Eaton, S. Multiple roles for lipids in the Hedgehog signalling pathway. Nat. Rev. Mol. Cell. Biol. 2008, 9, 437–445. [Google Scholar] [CrossRef]
  41. Allen, B.L.; Tenzen, T.; McMahon, A.P. The hedgehog-binding proteins GAS1 and CDO cooperate to positively regulate SHH signalling during mouse development. Genes Dev. 2007, 21, 1244–1257. [Google Scholar] [CrossRef] [Green Version]
  42. Martinelli, D.C.; Fan, C.M. Gas1 extends the range of hedgehog action by facilitating its signalling. Genes Dev. 2007, 21, 1231–1243. [Google Scholar] [CrossRef] [Green Version]
  43. Shao, W.; Espenshade, P.J. Expanding roles for SREBP in metabolism. Cell Metab. 2012, 16, 414–419. [Google Scholar] [CrossRef] [Green Version]
  44. Li, X.; Chen, Y.T.; Hu, P.; Huang, W.C. Fatostatin displays high antitumor activity in prostate cancer by blocking SREBP-regulated metabolic pathways and androgen receptor signaling. Mol. Cancer Ther. 2014, 13, 855–866. [Google Scholar] [CrossRef] [Green Version]
  45. Wen, Y.A.; Xiong, X.; Zaytseva, Y.Y.; Napier, D.L.; Vallee, E.; Li, A.T.; Wang, C.; Weiss, H.L.; Evers, B.M.; Gao, T. Downregulation of SREBP inhibits tumor growth and initiation by altering cellular metabolism in colon cancer. Cell Death Dis. 2018, 9, 265. [Google Scholar] [CrossRef] [Green Version]
  46. Carrer, A.; Trefely, S.; Zhao, S.; Campbell, S.L.; Norgard, R.J.; Schultz, K.C.; Sidoli, S.; Parris, J.L.D.; Affronti, H.C.; Sivanand, S.; et al. AcetylCoA metabolism supports multistep pancreatic tumorigenesis. Cancer Discov. 2019, 9, 416–435. [Google Scholar] [CrossRef] [Green Version]
  47. Fraga, M.F.; Ballestar, E.; Villar-Garea, A.; Boix-Chornet, M.; Espada, J.; Schotta, G.; Bonaldi, T.; Haydon, C.; Ropero, S.; Petrie, K.; et al. Loss of acetylation at Lys16 and trimethylation at Lys20 of histone H4 is a common hallmark of human cancer. Nat. Genet. 2005, 37, 391–400. [Google Scholar] [CrossRef]
  48. Sahai, E.; Marshall, C.J. Rho-GTPases and cancer. Nat. Rev. Cancer 2002, 21, 133–142. [Google Scholar] [CrossRef]
  49. Ridley, A.J. Rho proteins and cancer. Breast Cancer Res. Treat. 2004, 84, 13–19. [Google Scholar] [CrossRef]
  50. Mazieres, J.; Tillement, V.; Allal, C.; Clanet, C.; Bobin, L.; Chen, Z.; Sebti, S.M.; Favre, G.; Pradines, A. Geranylgeranylated, but not farnesylated, RhoB suppresses Ras transformation of NIH-3T3 cells. Exp. Cell Res. 2005, 304, 354–364. [Google Scholar] [CrossRef]
  51. Prendergast, G.C. Actin’ up: RhoB in cancer and apoptosis. Nat. Rev. Cancer 2001, 1, 162–168. [Google Scholar] [CrossRef]
  52. Furuhjelm, J.; Peränen, J. The C-terminal end of R-Ras contains a focal adhesion targeting signal. J. Cell Sci. 2003, 116, 3729–3738. [Google Scholar] [CrossRef] [Green Version]
  53. Nowak, J.; Archange, C.; Tardivel-Lacombe, J.; Pontarotti, P.; Pébusque, M.J.; Vaccaro, M.I.; Velasco, G.; Dagorn, J.C.; Iovanna, J.L. The TP53INP2 protein is required for autophagy in mammalian cells. Mol. Biol. Cell 2008, 20, 870–881. [Google Scholar] [CrossRef] [Green Version]
  54. NCBI. Available online: https://www.ncbi.nlm.nih.gov/sites/entrez?db=gene&cmd=Retrieve&dopt=Graphics&list_uids=4998 (accessed on 9 February 2021).
  55. NCBI. Available online: http://www.ncbi.nlm.nih.gov/sites/entrez?db=gene&cmd=Retrieve&dopt=Graphics&list_uids=983 (accessed on 9 February 2021).
  56. NCBI. Available online: http://www.ncbi.nlm.nih.gov/sites/entrez?db=gene&cmd=Retrieve&dopt=Graphics&list_uids=994 (accessed on 9 February 2021).
  57. NCBI. Available online: http://www.ncbi.nlm.nih.gov/sites/entrez?db=gene&cmd=Retrieve&dopt=Graphics&list_uids=6502 (accessed on 9 February 2021).
  58. NCBI. Available online: http://www.ncbi.nlm.nih.gov/sites/entrez?db=gene&cmd=Retrieve&dopt=Graphics&list_uids=1870 (accessed on 9 February 2021).
  59. NCBI. Available online: http://www.ncbi.nlm.nih.gov/sites/entrez?db=gene&cmd=Retrieve&dopt=Graphics&list_uids=8793 (accessed on 9 February 2021).
  60. Corpataux, J.M.; Naik, J.; Porter, K.E.; London, N.J. The effect of six different statins on the proliferation, migration, and invasion of human smooth muscle cells. J. Surg. Res. 2005, 129, 52–56. [Google Scholar] [CrossRef]
  61. Fromigue, O.; Hamidouche, Z.; Vaudin, P.; Lecanda, F.; Patino, A.; Barbry, P.; Mari, B.; Marie, P.J. CYR61 downregulation reduces osteosarcoma cell invasion, migration, and metastasis. J. Bone Miner. Res. 2011, 26, 1533–1542. [Google Scholar] [CrossRef]
  62. Kidera, Y.; Tsubaki, M.; Yamazoe, Y.; Shoji, K.; Nakamura, H.; Ogaki, M.; Satou, T.; Itoh, T.; Isozaki, M.; Kaneko, J.; et al. Reduction of lung metastasis, cell invasion, and adhesion in mouse melanoma by statin-induced blockade of the Rho/Rho-associated coiled-coil-containing protein kinase pathway. J. Exp. Clin. Cancer Res. 2010, 29, 127. [Google Scholar] [CrossRef] [Green Version]
  63. Brown, M.; Hart, C.; Tawadros, T.; Ramani, V.; Sangar, V.; Lau, M.; Clarke, N. The differential effects of statins on the metastatic behaviour of prostate cancer. Br. J. Cancer 2012, 106, 1689–1696. [Google Scholar] [CrossRef] [Green Version]
  64. Wang, G.; Cao, R.; Wang, Y.; Qian, G.; Dan, H.C.; Jiang, W.; Ju, J.; Wu, M.; Xiao, Y.; Wang, X. Simvastatin induces cell cycle arrest and inhibits proliferation of bladder cancer cells via PPARγ signalling pathway. Sci. Rep. 2016, 6, 35783. [Google Scholar] [CrossRef] [Green Version]
  65. Sheng, S.; Barnett, D.H.; Katzenellenbogen, B.S. Differential estradiol and selective estrogen receptor modulator (SERM) regulation of Keratin 13 gene expression and its underlying mechanism in breast cancer cells. Mol. Cell Endocrinol. 2008, 296, 1–9. [Google Scholar] [CrossRef] [Green Version]
  66. NCBI. Available online: http://www.ncbi.nlm.nih.gov/sites/entrez?db=gene&cmd=Retrieve&dopt=Graphics&list_uids=7138 (accessed on 9 February 2021).
  67. Sun, H.Q.; Yamamoto, M.; Mejillano, M.; Yin, H.L. Gelsolin, a multifunctional actin regulatory protein. J. Biol. Chem. 1999, 274, 33179–33182. [Google Scholar] [CrossRef] [Green Version]
  68. Schnitzer, M.J.; Block, S.M. Kinesin hydrolyses one ATP per 8-nm step. Nature 1997, 388, 386–390. [Google Scholar] [CrossRef] [PubMed]
  69. NCBI. Available online: http://www.ncbi.nlm.nih.gov/sites/entrez?db=gene&cmd=Retrieve&dopt=Graphics&list_uids=3728 (accessed on 9 February 2021).
  70. NCBI. Available online: http://www.ncbi.nlm.nih.gov/sites/entrez?db=gene&cmd=Retrieve&dopt=Graphics&list_uids=7430 (accessed on 9 February 2021).
  71. NCBI. Available online: http://www.ncbi.nlm.nih.gov/sites/entrez?db=gene&cmd=Retrieve&dopt=Graphics&list_uids=1008 (accessed on 9 February 2021).
  72. Durinck, S.; Moreau, Y.; Kasprzyk, A.; Davis, S.; De Moor, B.; Brazma, A.; Huber, W. BioMart and Bioconductor: A powerful link between biological databases and microarray data analysis. Bioinformatics 2005, 21, 3439–3440. [Google Scholar] [CrossRef] [PubMed] [Green Version]
  73. Hubbard, J.P.; Aken, B.L.; Beal, K.; Ballester, B.; Caccamo, M.; Chen, Y.; Clarke, L.; Coates, G.; Cunningham, F.; Cutts, T.; et al. Ensembl 2007. Nuc. Acids Res. 2007, 35, D610–D617. [Google Scholar] [CrossRef] [PubMed]
  74. Luo, W.; Brouwer, C. Pathview: An R/Bioconductor package for pathway-based data integration and visualization. Bioinformatics 2013, 29, 1830–1831. [Google Scholar] [CrossRef] [Green Version]
  75. Kanehisa, M.; Goto, S. KEGG: Kyoto encyclopedia of genes and genomes. Nucl. Acids Res. 2000, 28, 27–30. [Google Scholar] [CrossRef]
  76. Livak, K.J.; Schmittgen, T.D. Analysis of relative gene expression data using real-time quantitative PCR and the 2(-Delta Delta C(T)) Method. Methods 2001, 25, 402–408. [Google Scholar] [CrossRef]
  77. R Core Team. R: A Language and Environment for Statistical Computing; R Foundation for Statistical Computing; Vienna, Austria. Available online: https://www.R-project.org/ (accessed on 20 February 2021).
  78. Vandesompele, J.; De Preter, K.; Pattyn, F.; Poppe, B.; Van Roy, N.; De Paepe, A.; Speleman, F. Accurate normalization of real-time quantitative RT-PCR data by geometric averaging of multiple internal control genes. Genome Biol. 2002, 3, research0034.1. [Google Scholar] [CrossRef] [Green Version]
  79. STRING. Available online: https://string-db.org/ (accessed on 9 February 2021).
  80. Stocker, R.; Bowry, V.W.; Frei, B. Ubiquinol-10 protects human low density lipoprotein more efficiently against lipid peroxidation than doe’s α-tocopherol. Med. Sci. 1991, 88, 1646–1650. [Google Scholar] [CrossRef] [Green Version]
  81. Wong, W.W.; Clendening, J.W.; Martirosyan, A.; Boutros, P.C.; Bros, C.; Khosravi, F.; Jurisica, I.; Stewart, A.K.; Bergsagel, P.L.; Penn, L.Z. Determinants of sensitivity to lovastatin-induced apoptosis in multiple myeloma. Mol. Cancer Ther. 2007, 6, 1886–1897. [Google Scholar] [CrossRef] [Green Version]
  82. Jacobson, J.R.; Wong, W.W.; Dimitroulakos, J.; Minden, M.D.; Penn, L.Z. HMG-CoA reductase inhibitors and the malignant cell: The statin family of drugs as triggers of tumor-specific apoptosis. Leukemia 2002, 16, 508–519. [Google Scholar] [CrossRef] [Green Version]
  83. Jacobson, J.R.; Dudek, S.M.; Birukov, K.G.; Ye, S.Q.; Grigoryev, D.N.; Girgis, R.E.; Garcia, J.G. Cytoskeletal activation and altered gene expression in endothelial barrier regulation by simvastatin. Am. J. Respir. Cell Mol. Biol. 2004, 30, 662–670. [Google Scholar] [CrossRef] [Green Version]
  84. Johnson-Anuna, L.N.; Eckert, G.P.; Keller, J.H.; Igbavboa, U.; Franke, C.; Fechner, T.; Schubert-Zsilavecz, M.; Karas, M.; Müller, W.E.; Wood, W.G. Chronic administration of statins alters multiple gene expression patterns in mouse cerebral cortex. J. Pharmacol. Exp. Ther. 2005, 312, 786–793. [Google Scholar] [CrossRef] [Green Version]
  85. Adamkov, M.; Halasova, E.; Rajcani, J.; Bencat, M.; Vybohova, D.; Rybarova, S.; Galbavy, S. Relation between expression pattern of p53 and survivin in cutaneous basal cell carcinomas. Med. Sci. Monit. 2011, 17, BR74–BR80. [Google Scholar] [CrossRef] [Green Version]
  86. Zong, W.X.; Ditsworth, D.; Bauer, D.E.; Wang, Z.Q.; Thompson, C.B. Alkylating DNA damage stimulates a regulated form of necrotic cell death. Genes Dev. 2004, 18, 1272–1282. [Google Scholar] [CrossRef] [Green Version]
  87. Klionsky, D.J.; Emr, S.D. Autophagy as a regulated pathway of cellular degradation. Science 2000, 290, 1717–1721. [Google Scholar] [CrossRef]
  88. Fujimoto, T.; Ohsaki, Y. Proteasomal and autophagic pathways converge on lipid droplets. Autophagy 2006, 2, 299–301. [Google Scholar] [CrossRef] [Green Version]
  89. Yang, Y.C.; Huang, W.F.; Chuan, L.M.; Xiao, D.W.; Zeng, Y.L.; Zhou, D.A.; Xu, G.Q.; Liu, W.; Huang, B.; Hu, Q. In vitro and in vivo study of cell growth inhibition of simvastatin on chronic myelogenous leukemia cells. Chemotherapy 2008, 54, 438–446. [Google Scholar] [CrossRef]
  90. Assmus, B.; Urbich, C.; Aicher, A.; Hofmann, W.K.; Haendeler, J.; Rössig, L.; Spyridopoulos, I.; Zeiher, A.M.; Dimmeler, S. HMG-CoA reductase inhibitors reduce senescence and increase proliferation of endothelial progenitor cells via regulation of cell cycle regulatory genes. Circ. Res. 2003, 92, 1049–1055. [Google Scholar] [CrossRef] [Green Version]
  91. Denoyelle, C.; Albanese, P.; Uzan, G.; Hong, L.; Vannier, J.P.; Soria, J.; Soria, C. Molecular mechanism of the anti-cancer activity of cerivastatin, an inhibitor of HMG-CoA reductase, on aggressive human breast cancer cells. Cell Signal. 2003, 15, 327–338. [Google Scholar] [CrossRef]
  92. Keyomarsi, K.; Sandoval, L.; Band, V.; Pardee, A.B. Synchronization of tumor and normal cells from G1 to multiple cell cycles by lovastatin. Cancer Res. 1991, 51, 3602–3609. [Google Scholar]
  93. Maltese, W.A.; Sheridan, K.M. Differentiation of neuroblastoma cells induced by an inhibitor of mevalonate synthesis: Relation of neurite outgrowth and acetylcholinesterase activity to changes in cell proliferation and blocked isoprenoid synthesis. J. Cell Physiol. 1985, 125, 540–558. [Google Scholar] [CrossRef]
  94. Jakóbisiak, M.; Bruno, S.; Skierski, J.S.; Darzynkiewicz, Z. Cell cycle-specific effects of lovastatin. Proc. Natl. Acad. Sci. USA 1991, 88, 3628–3632. [Google Scholar] [CrossRef] [Green Version]
  95. Ghosh, P.M.; Mott, G.E.; Ghosh-Choudhury, N.; Radnik, R.A.; Stapleton, M.L.; Ghidoni, J.J.; Kreisberg, J.I. Lovastatin induces apoptosis by inhibiting mitotic and post-mitotic events in cultured mesangial cells. Biochim. Biophys. Acta. 1997, 1359, 13–24. [Google Scholar] [CrossRef] [Green Version]
  96. Engelke, K.J.; Hacker, M.P. A non-characteristic response of L1210 cells to lovastatin. Biochem. Biophys. Res. Commun. 1994, 203, 400–407. [Google Scholar] [CrossRef]
  97. Rao, S.; Porter, D.C.; Chen, X.; Herliczek, T.; Lowe, M.; Keyomarsi, K. Lovastatin-mediated G1 arrest is through inhibition of the proteasome, independent of hydroxymethyl glutaryl-CoA reductase. Proc. Natl. Acad. Sci. USA 1999, 96, 7797–7802. [Google Scholar] [CrossRef] [Green Version]
  98. Cooper, S. Reappraisal of G1-phase arrest and synchronization by lovastatin. Cell Biol. Int. 2002, 26, 715–727. [Google Scholar] [CrossRef] [Green Version]
  99. da Costa, R.F.; Freire, V.N.; Bezerra, E.M.; Cavada, B.S.; Caetano, E.W.; de Lima Filho, J.L.; Albuquerque, E.L. Explaining statin inhibition effectiveness of HMG-CoA reductase by quantum biochemistry computations. Phys. Chem. Chem. Phys. 2012, 14, 1389–1398. [Google Scholar] [CrossRef]
  100. Istvan, E.S.; Deisenhofer, J. Structural mechanism for statin inhibition of HMG-CoA reductase. Science 2001, 292, 1160–1164. [Google Scholar] [CrossRef] [Green Version]
  101. Mück, W.; Ritter, W.; Ochmann, K.; Unger, S.; Ahr, G.; Wingender, W.; Kuhlmann, J. Absolute and relative bioavailability of the HMG-CoA reductase inhibitor cerivastatin. Int. J. Clin. Pharmacol. Ther. 1997, 35, 255–260. [Google Scholar] [PubMed]
  102. Kajinami, K.; Mabuchi, H.; Saito, Y. NK-104: A novel synthetic HMG-CoA reductase inhibitor. Expert Opin. Investig. Drugs. 2000, 9, 2653–2661. [Google Scholar] [CrossRef]
  103. Hamelin, B.A.; Turgeon, J. Hydrophilicity/lipophilicity: Relevance for the pharmacology and clinical effects of HMG-CoA reductase inhibitors. Trends Pharmacol. Sci. 1998, 19, 26–37. [Google Scholar] [CrossRef]
  104. Menter, D.G.; Ramsauer, V.P.; Harirforoosh, S.; Chakraborty, K.; Yang, P.; Hsi, L.; Newman, R.A.; Krishnan, K. Differential effects of pravastatin and simvastatin on the growth of tumor cells from different organ sites. PLoS ONE 2011, 6, e28813. [Google Scholar] [CrossRef] [PubMed] [Green Version]
  105. Hindler, K.; Cleeland, C.S.; Rivera, E.; Collard, C.D. The role of statins in cancer therapy. Oncologist 2006, 11, 306–315. [Google Scholar] [CrossRef] [PubMed] [Green Version]
  106. Chimento, A.; Casaburi, I.; Avena, P.; Trotta, F.; De Luca, A.; Rago, V.; Pezzi, V.; Sirianni, R. Cholesterol and its metabolites in tumor growth: Therapeutic potential of statins in cancer treatment. Front Endocrinol. (Lausanne) 2019, 9, 807. [Google Scholar] [CrossRef] [Green Version]
  107. Sopková, J.; Vidomanová, E.; Strnádel, J.; Škovierová, H.; Halašová, E. The role of statins as therapeutic agents in cancer. Gen. Phys. Biophys. 2017, 36, 501–511. [Google Scholar] [CrossRef]
Figure 1. Chemical structures of statins.
Molecules 26 03528 g001
Figure 2. Mevalonate pathway and the changes induced by statin treatment in the expression of the genes that code for enzymes of the pathway. The color fill of the nodes indicates the base-2 logarithm of the fold change in gene expression upon treatment by a statin. Different statins are shown in the distinct position of the node as indicated in the bottom key.
Molecules 26 03528 g002
Figure 3. STRING enrichment analysis of epigenetic regulators significantly affected by statin treatment (mainly by cerivastatin and pitavastatin) of MiaPaCa-2 cells at 12 µM concentration for 24 h. Individual nodes represent affected gene products and their interactions. Input nodes represent the genes listed in Table 2 (HIST1H4C, HIST1H2BF, HIST2H3C, H2AFX, HIST2H2BE, HIST1H2BD, HIST1H2BK, and HIST3H2A). The evidence view of the association network was generated according to the known and predicted interactions in Homo sapiens. Known interactions: turquoise—from curated databases; violet—experimentally determined. Predicted interactions: green—gene neighborhood; red—gene fusions; blue—gene co-occurrence. Others: grass green—text-mining; black—co-expression; light blue—protein homology. A complete description of the nodes is given in Supplementary Table S1.
Molecules 26 03528 g003
Figure 4. RAS signaling pathway and the changes induced by statin treatment in the expression of the genes that code for members of the pathway. The color fill of the nodes indicates the base-2 logarithm of the fold change in gene expression upon treatment by a statin. Different statins are shown in the distinct position of the node as indicated in the key.
Molecules 26 03528 g004
Figure 5. Cell-cycle signalization and the changes induced by statin treatment in the expression of the genes that code for members of the circuit. The color fill of the nodes indicates the base-2 logarithm of the fold change in gene expression upon treatment by a statin. Different statins are shown in the distinct position of the node as indicated in the key.
Molecules 26 03528 g005
Figure 6. STRING enrichment analysis of products of genes involved in cell death significantly affected by statin treatment (mainly by cerivastatin and pitavastatin) of MiaPaCa-2 cells at 12 µM concentration for 24 h. Individual nodes represent affected gene products and their interactions. Input nodes were based on the genes listed in Table 5 (TNFRSF10D, SLC6A12, DRAM, CASP9, GABARAPL1, ATG2A, TNFAIP1, CARD10, and TNFRSF6B). A complete description of the nodes is given in Supplementary Table S1. See Figure 3’s caption for color coding of the edges.
Molecules 26 03528 g006
Figure 7. STRING enrichment analysis of products of genes involved in cytoskeleton maintenance significantly affected by statin treatment (mainly by cerivastatin, pitavastatin, and simvastatin) of MiaPaCa-2 cells at 12 µM concentration for 24 h. Individual nodes represent affected gene products and their interactions. Input nodes were based on the genes listed in Table 6 (LOC400578, KRT16, MGC102966, KRT15, KLHL24, JUP, TUBB1, KRT13, KRT19, GSN, KIF1A, TNNT1, ITGB4, VIL2, NAV1, GSN, CDH10, and SYNM). A complete description of the nodes is given in Supplementary Table S1. See Figure 3’s caption for color coding of the edges.
Molecules 26 03528 g007
Table 1. Genes involved in the metabolism of lipids and steroids that were affected by statin treatment of MiaPaCa-2 cells. Numeric columns display fold changes of the gene expression between cells treated by individual statins at 12 µM concentration for 24 h and untreated cells. Cer.—cerivastatin; Pit.—pitavastatin; Sim.—simvastatin; Flu.—fluvastatin; Ato.—atorvastatin; Lov.—lovastatin. Pravastatin and rosuvastatin did not induce any significant change in MiaPaCa-2 cell gene expression.
Gene SymbolRef. IDProduct NameCer.Pit.Sim.Flu.Ato.Lov.
Fold Change
HMGCS1NM_002130HMG-CoA synthase (EC 2.3.3.10) 5.672.994.132.962.902.80
HMGCRNM_000859HMG-CoA reductase (EC 1.1.1.34)3.913.163.042.662.352.08
MVDNM_002461Mevalonate pyrophosphate decarboxylase (EC 4.1.1.33)3.662.112.322.01--
PPAP2ANM_003711Phosphatidic acid phosphatase 2a (EC 3.1.3.4)3.412.782.15---
AGPAT2NM_0064121-acyl-glycerol-phosphate acyltransferase 2 (EC 2.3.1.51)2.632.28----
Table 2. Epigenetic regulator genes that were affected by statin treatment of MiaPaCa-2 cells. Numeric columns display fold changes of the gene expression between cells treated by individual statins at 12 µM concentration for 24 h and untreated cells. Cer.—cerivastatin; Pit.—pitavastatin; Sim.—simvastatin; Flu.—fluvastatin. Atorvastatin, lovastatin, pravastatin, and rosuvastatin did not induce any significant change in MiaPaCa-2 cells’ gene expression.
Gene SymbolRef. IDProduct NameCer.Pit.Sim.Flu.
Fold Change
HIST1H4CNM_003542.3Histone H40.410.340.49-
HIST1H2BFNM_003522.3Histone H2B type 1-K 0.330.410.430.49
HIST2H3CNM_021059.2Histone H3C type 2-0.50--
H2AFXNM_002105.2Histone H2A family member X-0.43--
HIST2H2BENM_003528.2Histone H2B type 2-E4.324.332.05-
HIST1H2BDNM_138720.1Histone H2B type 1-D4.154.552.01-
HIST1H2BKNM_080593.1Histone H2B type 1-K2.102.67--
HIST3H2ANM_033445.2Histone H2A type 3-2.02--
Table 3. Genes involved in posttranslational regulation affected by statin treatment of MiaPaCa-2 cells. Numeric columns display fold changes of the gene expression between cells treated by individual statins at 12 µM concentration for 24 h and untreated cells. Cer.—cerivastatin; Pit.—pitavastatin; Sim.—simvastatin; Flu.—fluvastatin; Ato.—atorvastatin; Lov.—lovastatin. Pravastatin and rosuvastatin did not induce any significant change in MiaPaCa-2 cell gene expression.
Gene SymbolRef. IDProduct NameCer.Pit.Sim.Flu.Ato.Lov.
Fold Change
RHOBNM_004040.2Ras homolog gene family, member B12.4811.9010.817.115.594.92
RASL10ANM_001007279.1RAS-like, family 10, member A4.143.582.652.172.01-
KRASNM_033360.2Kirsten rat sarcoma viral oncogene homolog3.232.642.582.00--
RAB40BNM_006822.1Member RAS oncogene family3.142.892.16---
RRASNM_006270.3Related RAS viral (r-ras) oncogene homolog2.582.532.04---
RAB5BNM_002868.2RAS oncogene family member 2.462.04----
RAB6BNM_016577.3RAS oncogene family member2.322.31----
RHOANM_001664.2Ras homolog gene family, member A2.212.402.03---
ARHGEF3NM_019555.1Rho guanine nucleotide exchange factor (GEF) 32.212.09----
RHOQNM_012249.3Ras homolog gene family, member Q2.17-----
RRAGCNM_022157.2Ras-related GTP binding C2.06-----
RAB38NM_022337.1Member RAS oncogene family0.41-----
ARHGAP19NM_032900.4Rho GTPase activating protein 190.470.38----
Table 4. Genes involved in the cell cycle and DNA replication affected by statin treatment of MiaPaCa-2 cells. Numeric columns display fold changes of the gene expression between cells treated by individual statins at 12 µM concentration for 24 h and untreated cells. Cer.—cerivastatin; Pit.—pitavastatin; Sim.—simvastatin; Flu.—fluvastatin; Ato.—atorvastatin; Lov.—lovastatin. Pravastatin and rosuvastatin did not induce any significant change in MiaPaCa-2 cell gene expression.
Gene SymbolRef. IDProduct NameCer.Pit.Sim.Flu.Ato.Lov.
Fold Change
CDKN1ANM_000389.2Cyclin-dependent kinase inhibitor 1A (p21, Cip1)3.644.212.742.592.332.40
SFNNM_006142.3Stratifin2.402.57----
CDKN1CNM_057735.1Cyclin-dependent kinase inhibitor 1C (p57, Kip2) -2.37----
CCNE2NM_057735.1Cyclin E20.300.29----
CDC25ANM_001789.2Cell division cycle 25 homolog A0.300.33----
ORC1LNM_004153.2Origin recognition complex, subunit 1-like0.300.22----
ORC6LNM_014321.2Origin recognition complex, subunit 6 like0.310.30----
SKP2NM_005983.2S-phase kinase-associated protein 2 (p45)0.340.37----
MCM7NM_005916.3Minichromosome maintenance complex component 70.380.45----
E2F2NM_004091.2E2F transcription factor 20.390.40----
CDC45LNM_003504.3CDC45 cell division cycle 45-like0.390.27----
MCM2NM_004526.2Minichromosome maintenance complex component 20.400.30----
MCM3NM_002388.3Minichromosome maintenance complex component 30.410.33----
CDC6NM_001254.3Cell division cycle 6 homolog0.410.47----
CDC2NM_001786.2Cell division cycle 2, G1 to S and G2 to M0.410.32----
CCND1NM_053056.2Cyclin D10.43-----
MCM4NM_005914.2Minichromosome maintenance complex component 40.430.36----
MCM5NM_006739.3Minichromosome maintenance complex component 50.450.35----
PCNANM_182649.1Proliferating cell nuclear antigen (PCNA), transcript variant 20.460.45----
CDK2NM_001798.2Cyclin-dependent kinase 20.480.44----
PKMYT1NM_182687.1Protein kinase, membrane associated tyrosine/threonine 10.490.30----
MAD2L1NM_002358.2MAD2 mitotic arrest deficient-like 10.490.36----
CCNA2NM_001237.2Cyclin A2-0.31----
TTKNM_003318.3TTK protein kinase-0.41----
CDC20NM_001255.2Cell division cycle 20 homolog-0.46----
CDC25CNM_001790.3Cell division cycle 25 homolog C-0.46----
PLK1NM_005030.3Polo-like kinase 1-0.47----
BUB1NM_004336.2BUB1 budding uninhibited by benzimidazoles 1 homolog-0.48----
Table 5. Genes involved in cell death affected by statin treatment of MiaPaCa-2 cells. Numeric columns display fold changes of the gene expression between cells treated by individual statins at 12 µM concentration for 24 h and untreated cells. Cer.—cerivastatin; Pit.—pitavastatin; Sim.—simvastatin; Flu.—fluvastatin; Ato.—atorvastatin; Lov.—lovastatin. Pravastatin and rosuvastatin did not induce any significant change in MiaPaCa-2 cell gene expression.
Gene SymbolRef. IDProduct NameCer.Pit.Sim.Flu.Ato.Lov.
Fold Change
TNFRSF10DNM_003840.3Tumor necrosis factor receptor superfamily, member 10d3.713.174.683.062.762.60
SLC6A12NM_003044.2Solute carrier family 6 (betaine/GABA), member 122.452.162.842.45--
DRAMNM_018370.2Damage-regulated autophagy modulator2.182.41----
CASP9NM_032996.1Caspase 9, apoptosis-related cysteine peptidase2.16-----
GABARAPL1NM_031412.2GABA(A) receptor-associated protein like 12.133.762.492.13--
ATG2ANM_015104.1ATG2 autophagy related 2 homolog A 2.08-----
TNFAIP1NM_021137.3Tumor necrosis factor, alpha-induced protein 1 2.01-----
CARD10NM_014550.3Caspase recruitment domain family, member 100.430.49----
TNFRSF6BNM_032945.2Tumor necrosis factor receptor superfamily, member 6b0.48-----
Table 6. Genes involved in cytoskeleton maintenance affected by statin treatment of MiaPaCa-2 cells. Numeric columns display fold changes of the gene expression between cells treated by individual statins at 12 µM concentration for 24 h and untreated cells. Cer.—cerivastatin; Pit.—pitavastatin; Sim.—simvastatin; Flu.—fluvastatin; Ato.—atorvastatin; Lov.—lovastatin. Pravastatin and rosuvastatin did not induce any significant change in MiaPaCa-2 cell gene expression.
Gene SymbolRef. IDProduct NameCer.Pit.Sim.Flu.Ato.Lov.
Fold Change
LOC400578XR_017543.1Similar to keratin, type I cytoskeletal 14 (Cytokeratin-14)15.8012.215.443.623.322.59
KRT16NM_005557.2Keratin 16 13.8512.214.603.523.282.23
MGC102966XR_015970.1Similar to keratin, type I cytoskeletal 16 (Cytokeratin-16)13.5411.954.843.533.182.31
KRT15NM_002275.2Homo sapiens keratin 155.975.863.853.433.023.25
KLHL24NM_017644.3Kelch-like 24 5.784.562.892.212.21-
JUPNM_002230.1Junction plakoglobin5.334.092.782.512.00-
TUBB1NM_030773.2Tubulin, beta 14.02--2.23--
KRT13NM_002274.3Keratin 13 3.164.353.382.842.683.05
KRT19NM_002276.3Keratin 193.132.882.502.202.11-
GSNNM_198252.2Gelsolin (amyloidosis, Finnish type)2.972.322.452.00--
KIF1ANM_004321.4Kinesin family member 1A2.733.052.26---
TNNT1NM_003283.3Troponin T, slow skeletal muscle2.703.572.10---
ITGB4NM_001005619.1Homo sapiens integrin, beta 42.452.492.182.03-2.20
VIL2NM_003379.3Villin 2 (ezrin)2.162.182.01---
NAV1NM_020443.2Neuron navigator 12.142.382.13---
GSNNM_198252.2Gelsolin (amyloidosis, Finnish type)------
CDH10NM_006727.2Cadherin 10, type 2 (T2-cadherin)0.310.280.330.480.45-
SYNMNM_015286.5Synemin, intermediate filament protein0.480.50----
Publisher’s Note: MDPI stays neutral with regard to jurisdictional claims in published maps and institutional affiliations.

