 Sophie Rabouille1,2*
 Douglas A. Campbell3,4
 Takako Masuda3
 Tomáš Zavřel5
 Gábor Bernát3,6
 Lubos Polerecky7
 Kimberly Halsey8
 Meri Eichner3,9
 Eva Kotabová3
 Susanne Stephan10,11
 Martin Lukeš3
 Pascal Claquin12
 José Bonomi-Barufi13Ana Teresa Lombardi14
 Jan Červený5
 David J. Suggett15Mario Giordano3,16
 Jacco C. Kromkamp17
 Ondřej Prášil3
- 1Sorbonne Université, CNRS, LOV, Villefranche-sur-Mer, France
- 2Sorbonne Université, CNRS, LOMIC, Banyuls-sur-Mer, France
- 3Centre Algatech, Institute of Microbiology of the Czech Academy of Sciences, Třeboň, Czechia
- 4Mount Allison University, Sackville, NB, Canada
- 5Department of Adaptive Biotechnologies, Global Change Research Institute CAS, Brno, Czechia
- 6Centre for Ecological Research, Balaton Limnological Institute, Klebelsberg Kuno u. 3. 8237 Tihany, Hungary
- 7Department of Earth Sciences, Utrecht University, Utrecht, Netherlands
- 8Department of Microbiology, Oregon State University, Corvallis, OR, United States
- 9Max Planck Institute for Marine Microbiology, Bremen, Germany
- 10Leibniz-Institute of Freshwater Ecology and Inland Fisheries, Zur alten Fischerhütte 2, Stechlin, Germany
- 11Department of Ecology, Berlin Institute of Technology (TU Berlin), Ernst-Reuter-Platz 1, Berlin, Germany
- 12UMR BOREA (CNRS 8067), MNHN, IRD (207), Université de Caen Basse-Normandie, Caen, France
- 13Departamento de Botânica, Centro de Ciências Biológicas, Universidade Federal de Santa Catarina, Florianópolis, Brazil
- 14Universidade Federal de São Carlos, São Carlos, Brazil
- 15University of Technology Sydney, Climate Change Cluster, Faculty of Science, Ultimo, NSW, Australia
- 16Dipartimento di Scienze della Vita e dell’Ambiente, UniversitaÌ Politecnica delle Marche, Ancona, Italy
- 17NIOZ Royal Netherlands Institute for Sea Research and Utrecht University, Utrecht, Netherlands
Marine diazotrophs are a diverse group with key roles in biogeochemical fluxes linked to primary productivity. The unicellular, diazotrophic cyanobacterium Cyanothece is widely found in coastal, subtropical oceans. We analyze the consequences of diazotrophy on growth efficiency, compared to NO3–-supported growth in Cyanothece, to understand how cells cope with N2-fixation when they also have to face carbon limitation, which may transiently affect populations in coastal environments or during blooms of phytoplankton communities. When grown in obligate diazotrophy, cells face the double burden of a more ATP-demanding N-acquisition mode and additional metabolic losses imposed by the transient storage of reducing potential as carbohydrate, compared to a hypothetical N2 assimilation directly driven by photosynthetic electron transport. Further, this energetic burden imposed by N2-fixation could not be alleviated, despite the high irradiance level within the cultures, because photosynthesis was limited by the availability of dissolved inorganic carbon (DIC), and possibly by a constrained capacity for carbon storage. DIC limitation exacerbates the costs on growth imposed by nitrogen fixation. Therefore, the competitive efficiency of diazotrophs could be hindered in areas with insufficient renewal of dissolved gases and/or with intense phytoplankton biomass that both decrease available light energy and draw the DIC level down.
Introduction
While the structures and genetic regulation of the key enzymes of photosynthesis and nitrogen (N2) fixation are relatively well understood, we lack understanding of how these two processes interact, in particular under fluctuating environmental conditions. Regulation of N2-fixation in photosynthetic diazotrophs is especially important, as molecular oxygen (O2), a product of photosynthesis, irreversibly denatures nitrogenase (Gallon, 1992), the key enzyme responsible for N2-fixation. Autotrophic, unicellular cyanobacterial diazotrophs within the known groups B and C (UCYN-B, C; Zehr et al., 2001; Taniuchi et al., 2012) overcome nitrogenase inhibition by O2 through temporal separation of day-time photosynthesis from N2-fixation (Fay, 1992; Gallon, 1992; Bergman et al., 1997) fueled by night-time respiration of carbon reserves accumulated during previous day-time photosynthesis. Despite this temporal offset, the yield of N2-fixation remains tightly dependent upon the efficiency of photosynthesis (Agawin et al., 2007; Großkopf and LaRoche, 2012; Grimaud et al., 2014). Further, the ability of UCYN to meet their nitrogen requirements using either N2 or NO3– provides them with more flexibility in fluctuating environments. For instance, Agawin et al. (2007) demonstrated that a unicellular diazotroph can efficiently compete against nitrogen-limited phytoplankton incapable of N2-fixation, if sufficient light energy is available to support the extra costs of diazotrophy. We expect the respective demands and allocations of photosynthetic reductant in cells grown on nitrate or under obligate diazotrophy to differ because of the stoichiometries of these N assimilation pathways, but also because of their different timing in the light cycle, which imply distinct metabolic routes. It is therefore still unclear how reductant and energy demands are affected by the source of nitrogen and how much more costly it really is, for a diazotroph to grow on N2 vs NO3–.
Because UCYN so much rely on dynamic internal reserves of carbon, an efficient photosynthesis and storage is key to their success. We therefore raise the question of the regulation of cellular processes by dissolved inorganic carbon (DIC) availability. As discussed by Stoll et al. (2019), DIC limitation occurred over glacial cycles which periodically triggered upregulations of the algal carbon concentrating mechanism (CCM). CCM is an essential component of the photosynthetic machinery as it maintains the intracellular CO2 concentration (Badger et al., 1998; Badger et al., 2006; Xu et al., 2008; Rae et al., 2013), enhancing the growth efficiency. Although absolute DIC limitation is rare in the open ocean, Riebesell et al. (1993) argued that depending on which inorganic carbon forms can be used under non-limiting light and nutrient conditions, the growth rate of diatoms could actually be limited by the supply of CO2. Such observation, made from a microbial primary producer, may hint towards similar effects in diazotrophic cyanobacteria. Should DIC become transiently limiting, it could affect both the immediate photosynthetic efficiency and the subsequent activity of N2-fixation in UCYN. In coastal environments and freshwater systems, where DIC concentrations are lower than in the open ocean, phytoplankton blooms may draw down DIC to levels where the absolute amount of DIC can become limiting for growth, at least transiently. So far, the literature demonstrates that DIC limitation can be a main determinant of phytoplankton growth in estuaries (Fogel et al., 1992) as well as in brackish waters during red tide episodes (Hansen et al., 2007). The development of harmful algal blooms leads to conditions of DIC limitation, in which cyanobacteria are likely to outcompete eukaryotic phytoplankton (O’Neil et al., 2012; Van Dam et al., 2018) and we therefore wonder whether such conditions could also constitute temporary niches for diazotrophs. Not only Lu et al. (2019) reported the presence of N2-fixing, cyanobacterial strains during a cyanobacteria-dominated harmful algal bloom (HAB) but they also demonstrated and their facilitating role on the onset of the toxic bloom. The photosynthetic efficiency in intertidal communities of diatom-dominated microphytobenthos is also periodically constrained by DIC availability (Vieira et al., 2016; Marques da Silva et al., 2017). In freshwater systems, Kragh and Sand-Jensen (2018) challenged the paradigm that nutrients or light limit primary production in lakes, showing that DIC is a strong limiting factor, especially in the soft-water lakes. DIC limitation, or coupled P and DIC limitation, was also found in Saint Anna Lake in Transylvania (Lajos Vörös, personal communication). DIC limitation also controls primary production in alkaline ponds (Zeng et al., 2019).
Thus this work addresses two questions. First, the consequences of diazotrophy on growth efficiency, compared to NO3–-supported growth, are not yet quantified. Second, we wonder how UCYN cope with the energetic burden of N2-fixation should they also have to face carbon limitation. Selected strains in the genus Cyanothece have extensively been studied as model organisms to address various physiological or gene regulation features (Schneegurt et al., 1994; Cólon-López et al., 1997; Sherman et al., 1998; Toepel et al., 2008; Bandyopadhyay et al., 2013). Cyanothece is also becoming an emerging model for studying the performance of diazotrophy during the natural diel cycles of photosynthesis and N2-fixation in coastal environments (Rabouille et al., 2014; Aryal et al., 2018, Sicora et al., 2019), where it naturally occurs. The issue of a possible DIC limitation is therefore all the more relevant for this genus. We chose the strain Cyanothece sp. ATCC 51142 (hereafter Cyanothece), recently re-classified as Crocosphaera subtropica ATCC 51142 (Mareš et al., 2019)). As a starting point, we consider the theoretical energy and reducing power requirements of photosynthesis, N2-fixation and NO3– uptake, to compare the direct costs of these two N assimilatory pathways. Double arrows indicate a multiple step conversion. N2-fixation and NO3– acquisition are distinct growth modes that impose different reductant and ATP burdens upon cells, as illustrated by the stoichiometric reactions involved (Falkowski and Raven, 2007):
Photosynthetic Electron Transport:
Carbon Fixation:
where CO2external refers to the extracellular CO2 and CO2internal to the intracellular CO2. Note that in this study we do not distinguish between the form(s) of inorganic carbon used by cells and abbreviate them as CO2.
Nitrogen Assimilation:
Carbohydrate Re-oxidation:
Aerobic Respiration:
Linear photosynthetic electron transport (eqn. 1) generates ∼ 4 e– and translocates ∼ 12 H+ across the thylakoid membranes per two water molecules oxidized at Photosystem II (PSII). Concurrently, 3 ATP molecules are synthesized during one full rotation of the AtpC subunit of the ATP synthase, driven by 14 H+ flowing through the membrane. Hence, linear electron transport generates 3 ATP × 12/14 ≈ 2.6 ATP per two water molecules oxidized. Combining eqn. 1 and 2 to express this ratio in terms of electrons per ATP yields 1.55 e–/ATP. In contrast, the reductant/ATP ratio needed for the Calvin cycle is 2NADPH/3ATP = 1.33 e–/ATP. Achieving sufficient reductant to ATP ratio, depending on the demands of cellular processes, is, at least partly, tuned by the cyclic electron transport around PSI generating only ATP (for further details, see e.g. Bernát and Rögner, 2011; Kramer and Evans, 2011). Carbon assimilation into biomass then costs 4 e– and 4 ATP per carbon atom (eqn. 3 & 4), including a nominal cost of 1 ATP/CO2external to account for the cost of CCM moving CO2external to CO2internal (Raven et al., 2014). Every N atom assimilated from NO3– to organic N (glutamate) costs 1 ATP per NO3– for uptake (Flores et al., 2005), followed by 8 + 2 = 10 e– and one ATP for reductive assimilation (eqn. 5 & 7). In contrast, N assimilated from N2 costs 4 + 2 = 6 e– but 8 + 1 = 9 ATP (eqn. 6 & 7). To the extent the H2 byproduct of N2-fixation is re-captured by dehydrogenase activity (Tamagnini et al., 2007; Wilson et al., 2012), the net metabolic reductant cost further drops towards 4 e– per N for diazotrophy, whilst further protecting the nitrogenase against oxygen toxicity (Zhang et al., 2014).
Thus, in a cell with a C:N ratio of 7:1, growing on NO3–, the direct photosynthetic generation of a C7:N1 biomass implies an allocation to C assimilation of ∼7 × 4 = 28 e– and ∼7 × 4 = 28 ATP and an allocation of 10 e– and 2 ATP to N assimilation. This represents an investment of 38 e– and 30 ATP overall per C7:N1. The same cell growing with N2 as N source with a hypothetical direct photosynthetic generation of a C7:N1 biomass would make the same ∼28 e– and ∼28 ATP allocation to C assimilation, but 4–6 e– and 9 ATP towards N assimilation, i.e. 32–34 e– and 37 ATP total.
Thus, there is a lower electrons demand but higher ATP demand for photosynthetic growth under diazotrophy. Alternately stated, when growing on NO3– the photosynthetic production of biomass uses ∼38 e–/30 ATP ≈ 1.27 e–/ATP ratio, closely matching the output of the photosynthetic electron transport coupled to proton translocation, i.e. 1.33 e–/ATP. In contrast, photosynthetic diazotrophy requires only a 32–34 e–/37 ATP ≈ 0.9 e–/ATP ratio to accumulate the same biomass, resulting in a mismatch between the output of (linear) photosynthetic electron transport and metabolic requirements. Hence, these alternative modes of growth could cause differences in photosynthetic resource allocation and performance. Note that these estimates shift further if NO3– or N2 assimilation are fueled indirectly by respiratory oxidation of carbohydrate because the yield of ATP/e– then depends upon the relative allocation of electrons to respiratory electron transport vs. recycling into assimilatory paths. Furthermore, the assembly, protection, and daily de novo (re)synthesis of the iron-rich, labile nitrogenase complex imposes additional costs upon diazotrophic cells (Großkopf and LaRoche, 2012), which are expected to be higher than the cost of maintenance of the more stable enzymes of the NO3–/NO2– uptake and reductase system.
While NO3– assimilation can occur in the light and, therefore, be directly provisioned with electrons and ATP by photosynthesis, Cyanothece fixes N2 during the night, using both electrons and ATP generated at the expense of respiration of previously stored carbon reserves. Thus, each electron and ATP equivalent ultimately destined for N2-fixation passes transiently through a CH2O reserve stage, increasing the instantaneous burden upon the carbon assimilation system during the photoperiod. Efficient carbon acquisition and storage is therefore essential for the diazotrophic growth of Cyanothece. It is, however, unknown how the processes of photosynthesis, carbon storage and N2-fixation interact to optimize light saturated growth with dissolved inorganic carbon (DIC) that transitions from replete to a possible DIC limitation during the day, and back to DIC replete conditions during the night. These temporal shifts in DIC availability further exacerbate the competition for electrons between CO2 and nitrogen sources.
In the following, we assess the energetic demands of Cyanothece under diazotrophic growth versus reductive assimilation of NO3– and we describe the related electron transport and biomass dynamics when a periodical DIC limitation negatively affects carbon fixation. Cultures were continuously maintained in a state of exponential growth using bioreactors run in turbidostat mode. Using these systems, we simultaneously monitored photosynthetic electron transport, the electron requirement for carbon fixation, as well as carbon and nitrogen acquisition and incorporation in cells. We also evaluated whether the additional energy demand for N2-fixation translated into greater carbon storage or consumption. All these parameters were obtained from a variety of analyses, some of which are described in more details in the Supplementary material.
Materials and Methods
The core of this study uses a close monitoring of the dynamics of the photosynthetic apparatus (detailed below) to trace electron fluxes through/around photosystems, with parallel assessments of the related carbon fluxes, carbon and nitrogen storage, and of the overall growth efficiency. The monitoring was completed with a series of bulk analyses (cell counts, biomass, cellular C and N contents, and an assessment of carbon allocation using Fourier Transform Infrared Spectroscopy (FTIR, Supplementary Figure 1)). UV-Vis spectroscopy was applied to determine the pigment composition of the cells including Chl a, carotenoids and phycobiliproteins (Table 1), while Photosystem I to Photosystem II (PSI:PSII) and phycobilisomes to PSII abundance ratios were derived using low temperature (77K) fluorescence emission spectroscopy (Supplementary Figure 2). The specific growth rates were derived from changes in optical density (Supplementary Figure 3, Figure 1). Online monitoring of dissolved O2 concentrations in the cultures informed on the net production or consumption of oxygen (Figure 2 and Supplementary Figure 4). Last, photosynthetic efficiency was monitored using a membrane inlet mass spectrometer (MIMS). Specifically, gross and net O2 fluxes in light and dark were measured using an 18O2-based approach that allows for differentiating between photosynthetic O2 evolution and light-dependent O2 uptake by Mehler reaction and photorespiration (Supplementary Figure 5). Additionally, CO2 draw down by the cultures was monitored while simultaneously observing O2 fluxes (Supplementary Figure 6; see Supplementary material). We detail below the conditions under which the experiments were performed as well as the methodology related to the photosynthetic activity measurements, which constitute the core of the work. The methods related to all other parameters can be found in the Supplementary material.
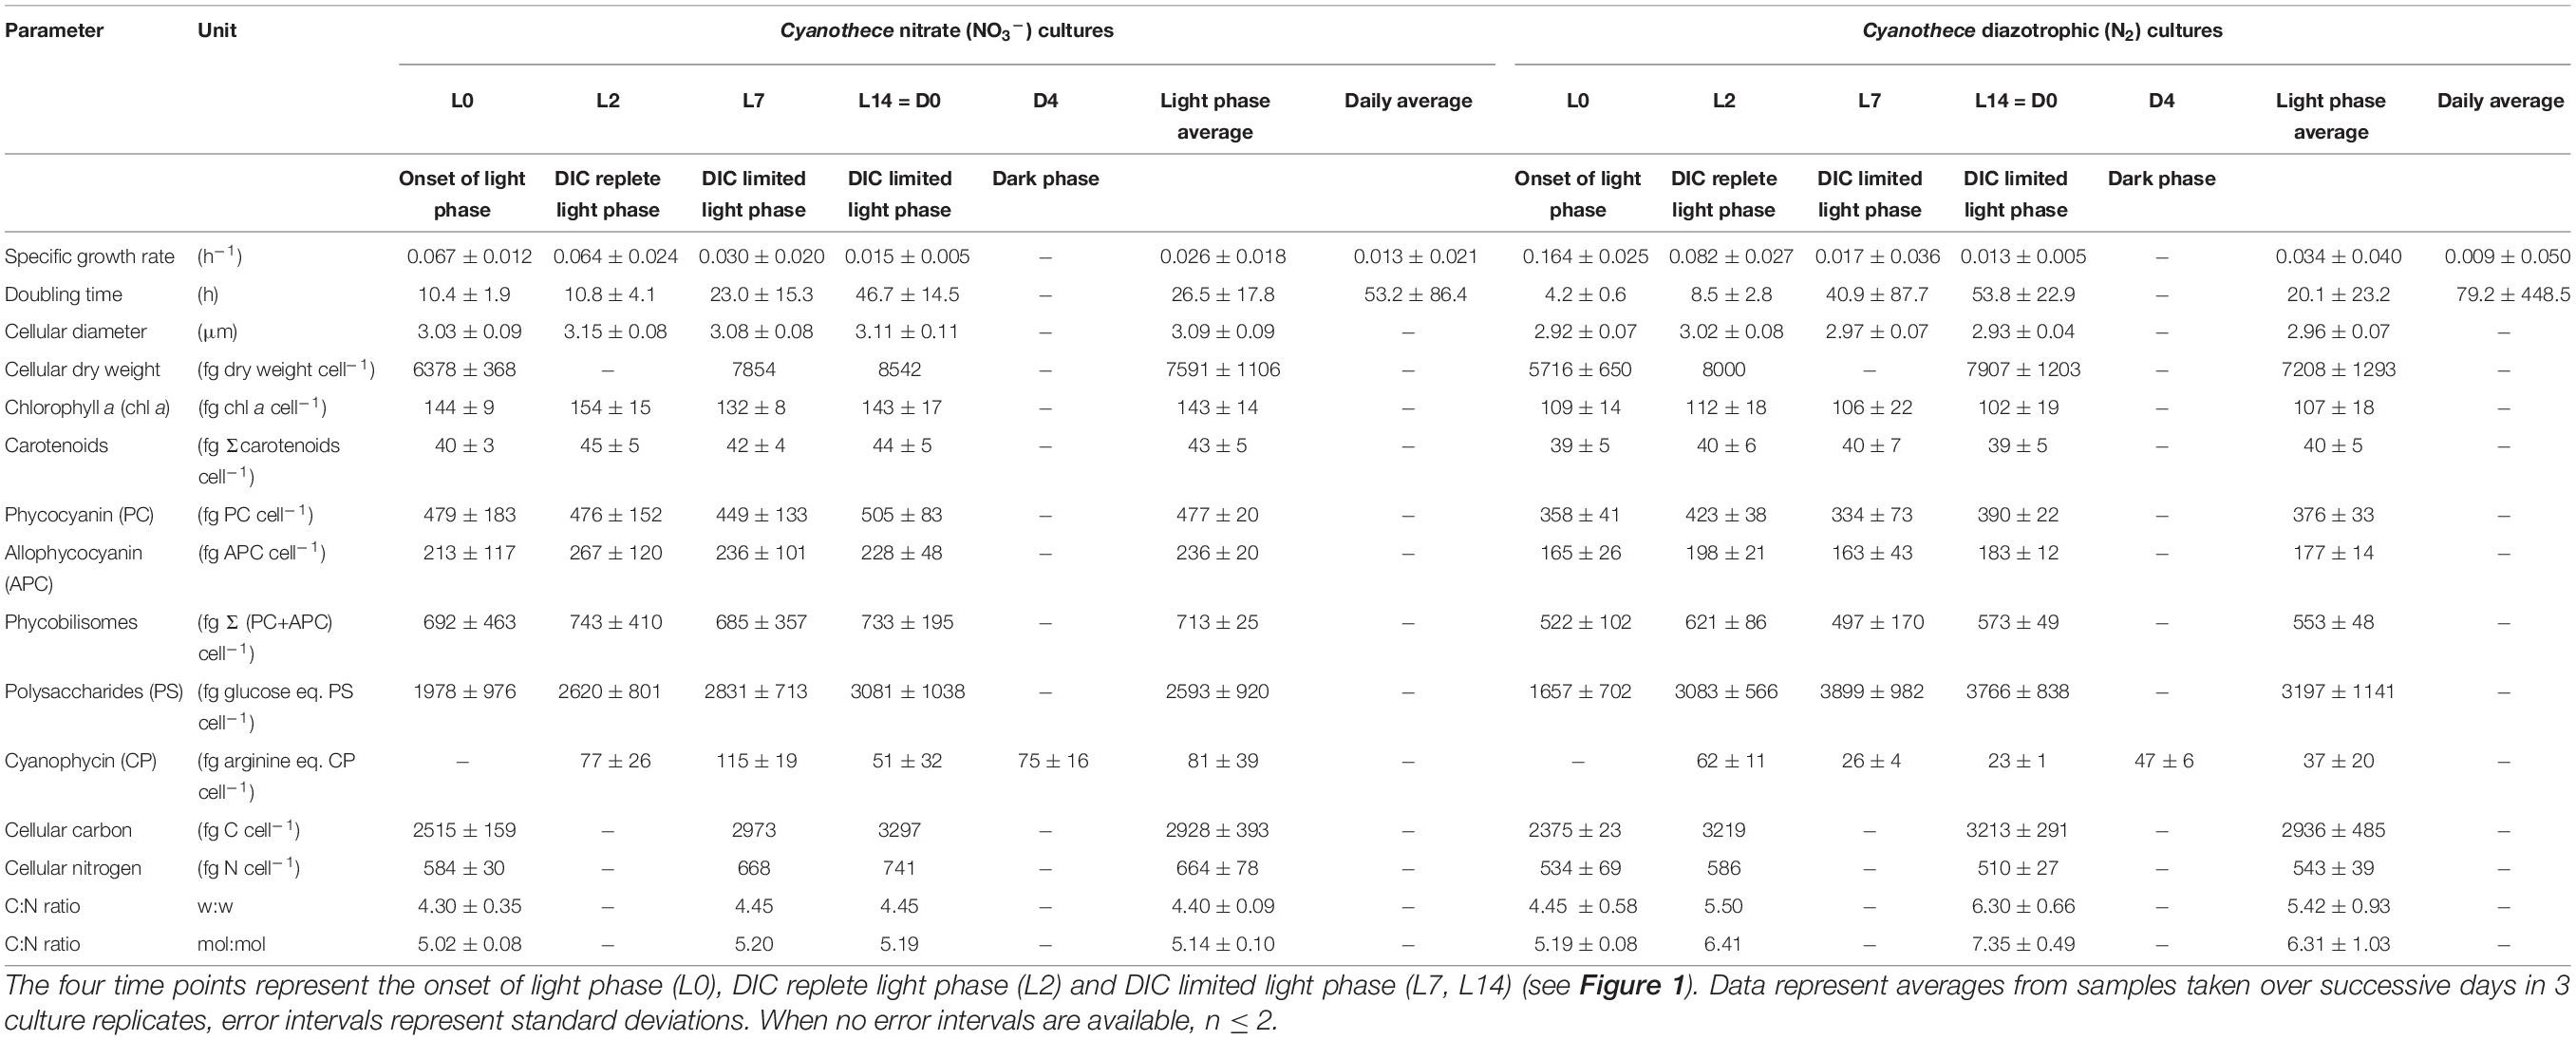
Table 1. Morphology and composition of Cyanothece cells cultivated in ASP2 medium supplemented with nitrate (NO3–) or under obligate diazotrophic (N2) conditions, normalized per cell.
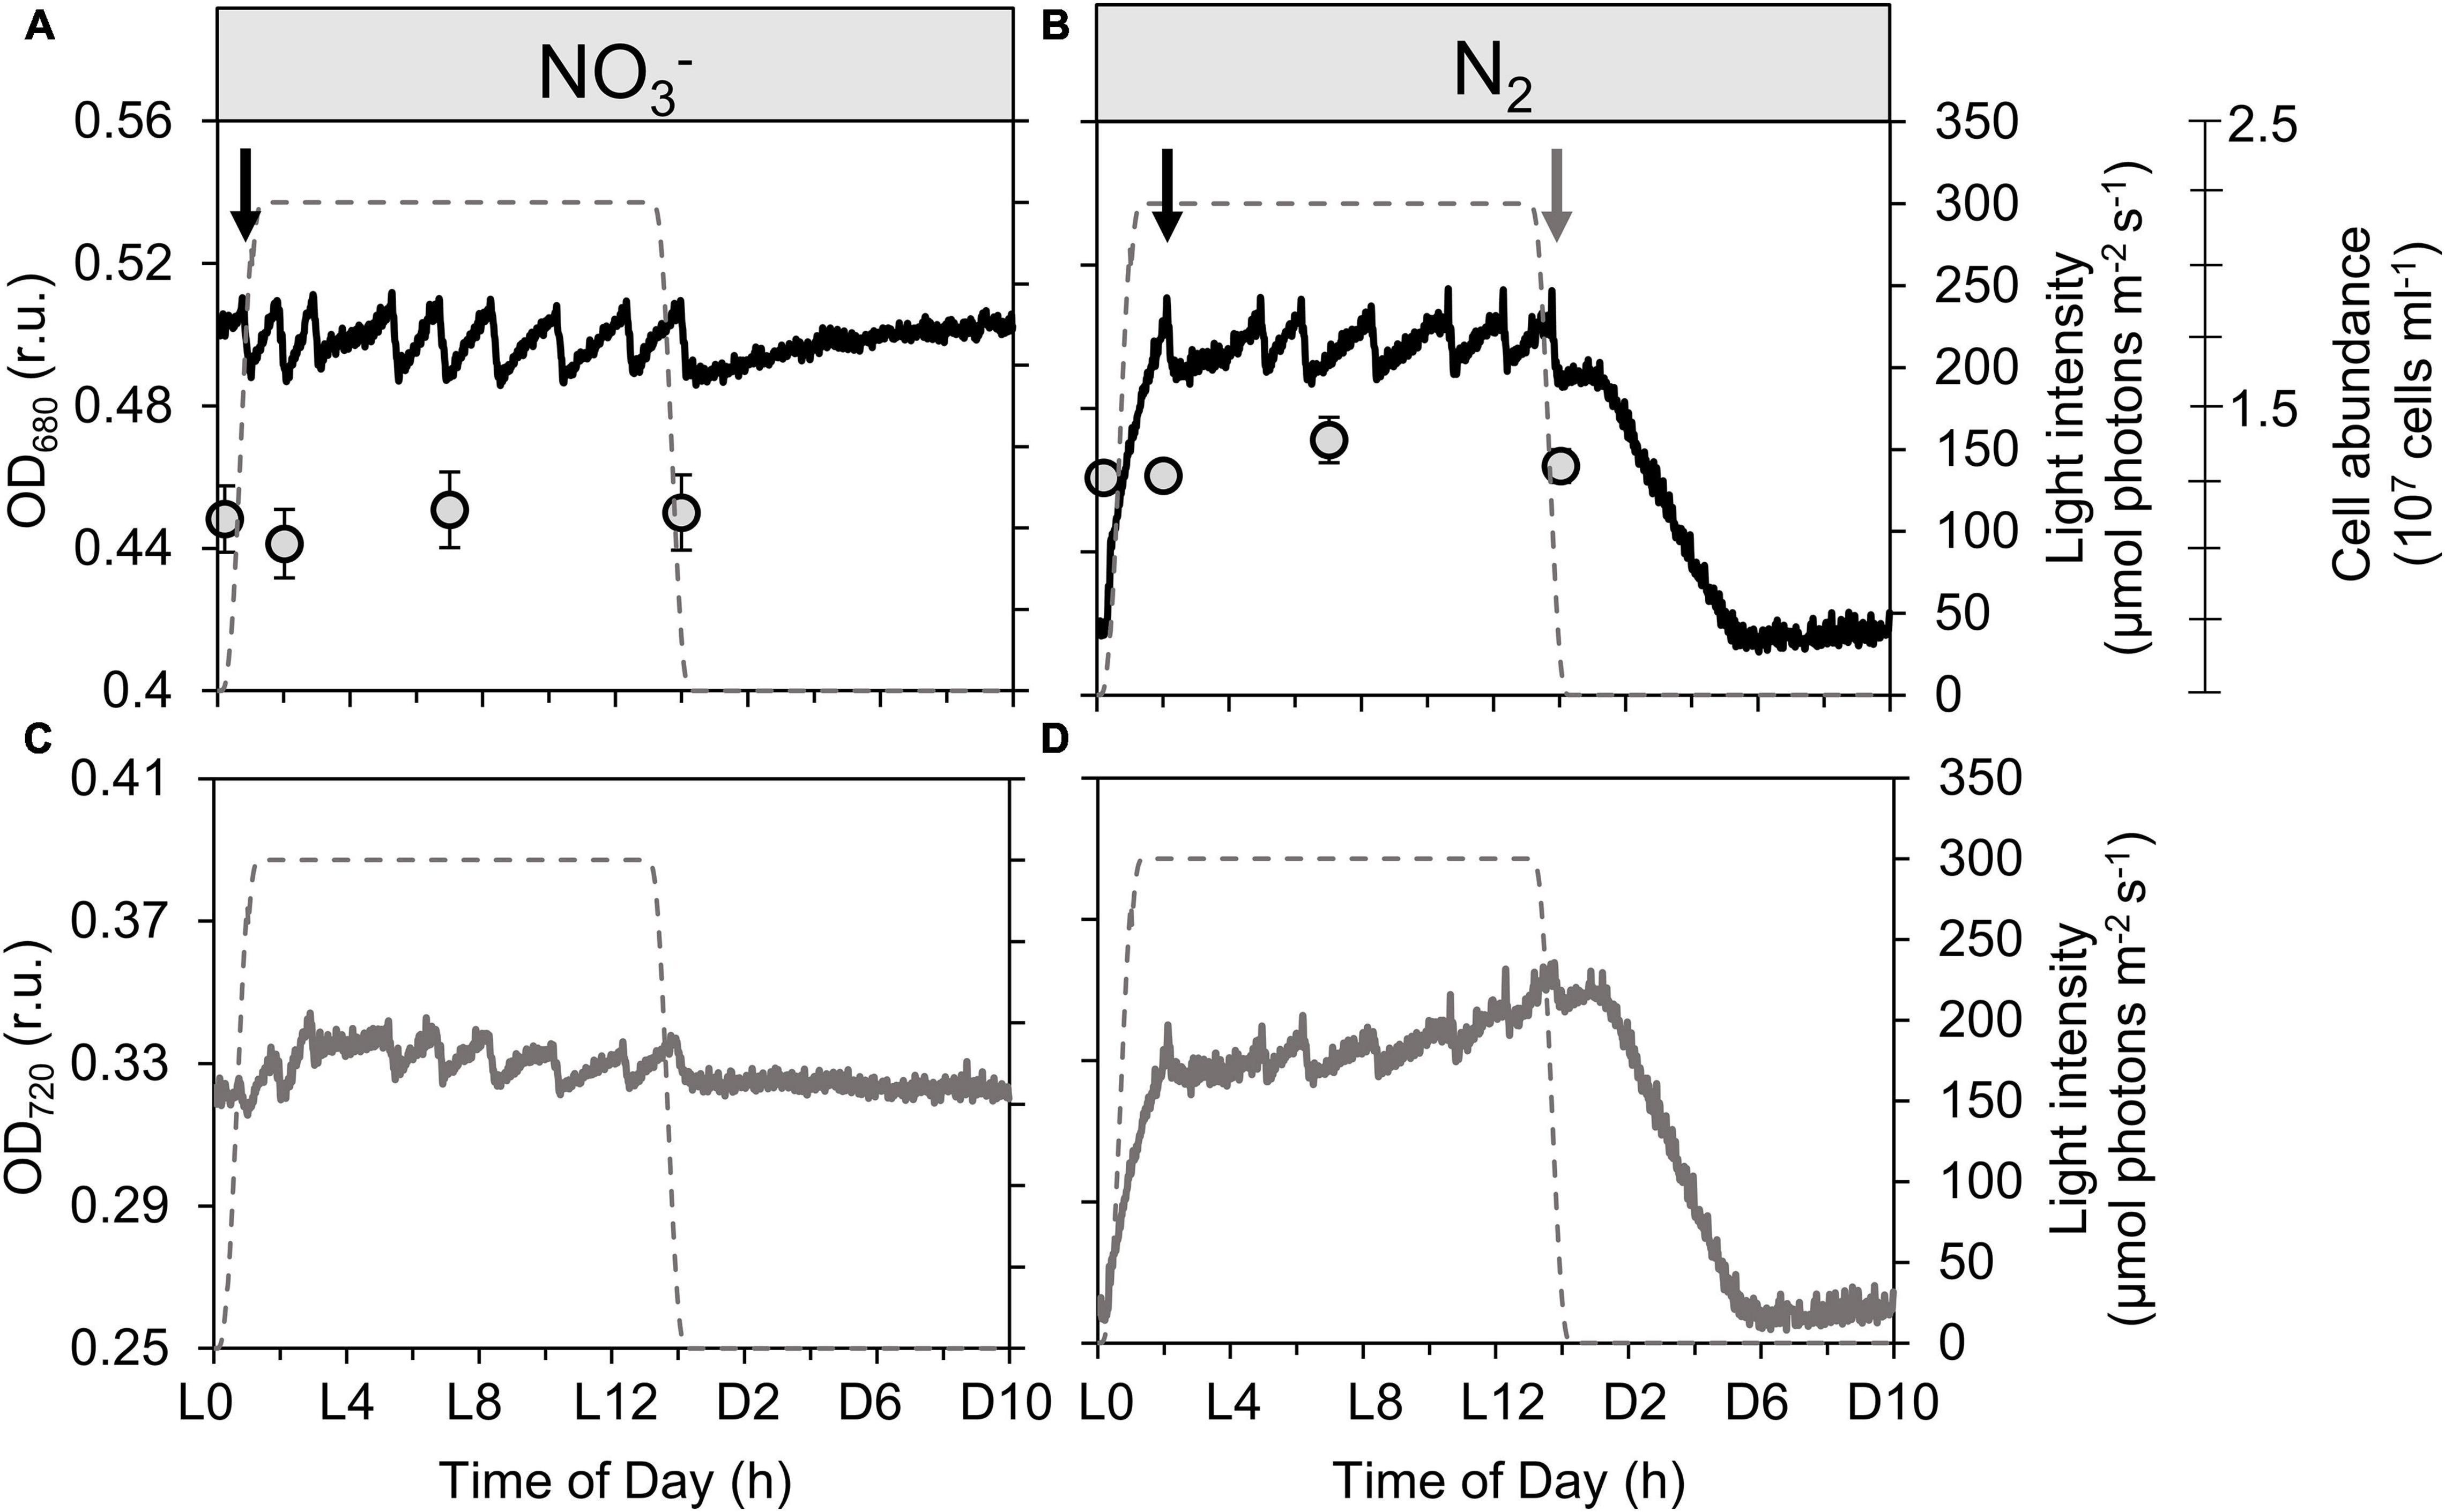
Figure 1. Record of dynamics in optical density measured at 680 nm [black lines; OD680, (A,B)] and 720 nm [gray lines; OD720, (C,D)] together with cell abundance [gray circles; (A,B)] of Cyanothece turbidostat cultures cultivated in ASP 2 medium supplemented with NO3– (A,C) and under obligate diazotrophy (B,D). The OD680 (more sensitive to changes in Chl a content) and OD720 (more sensitive to changes in non-pigment biomass) signals are measured within the photobioreactor vessel and represent a typical record of optical density over a diel cycle. The cell abundance data are averages from 9 samples from 3 independent bioreactors for each treatment; error bars show standard deviations. The gray dashed lines show the light profile throughout the day. Black arrows point to the first culture dilution event at the beginning of each light phase, while the gray arrow points to the last dilution event in the N2-fixing culture.
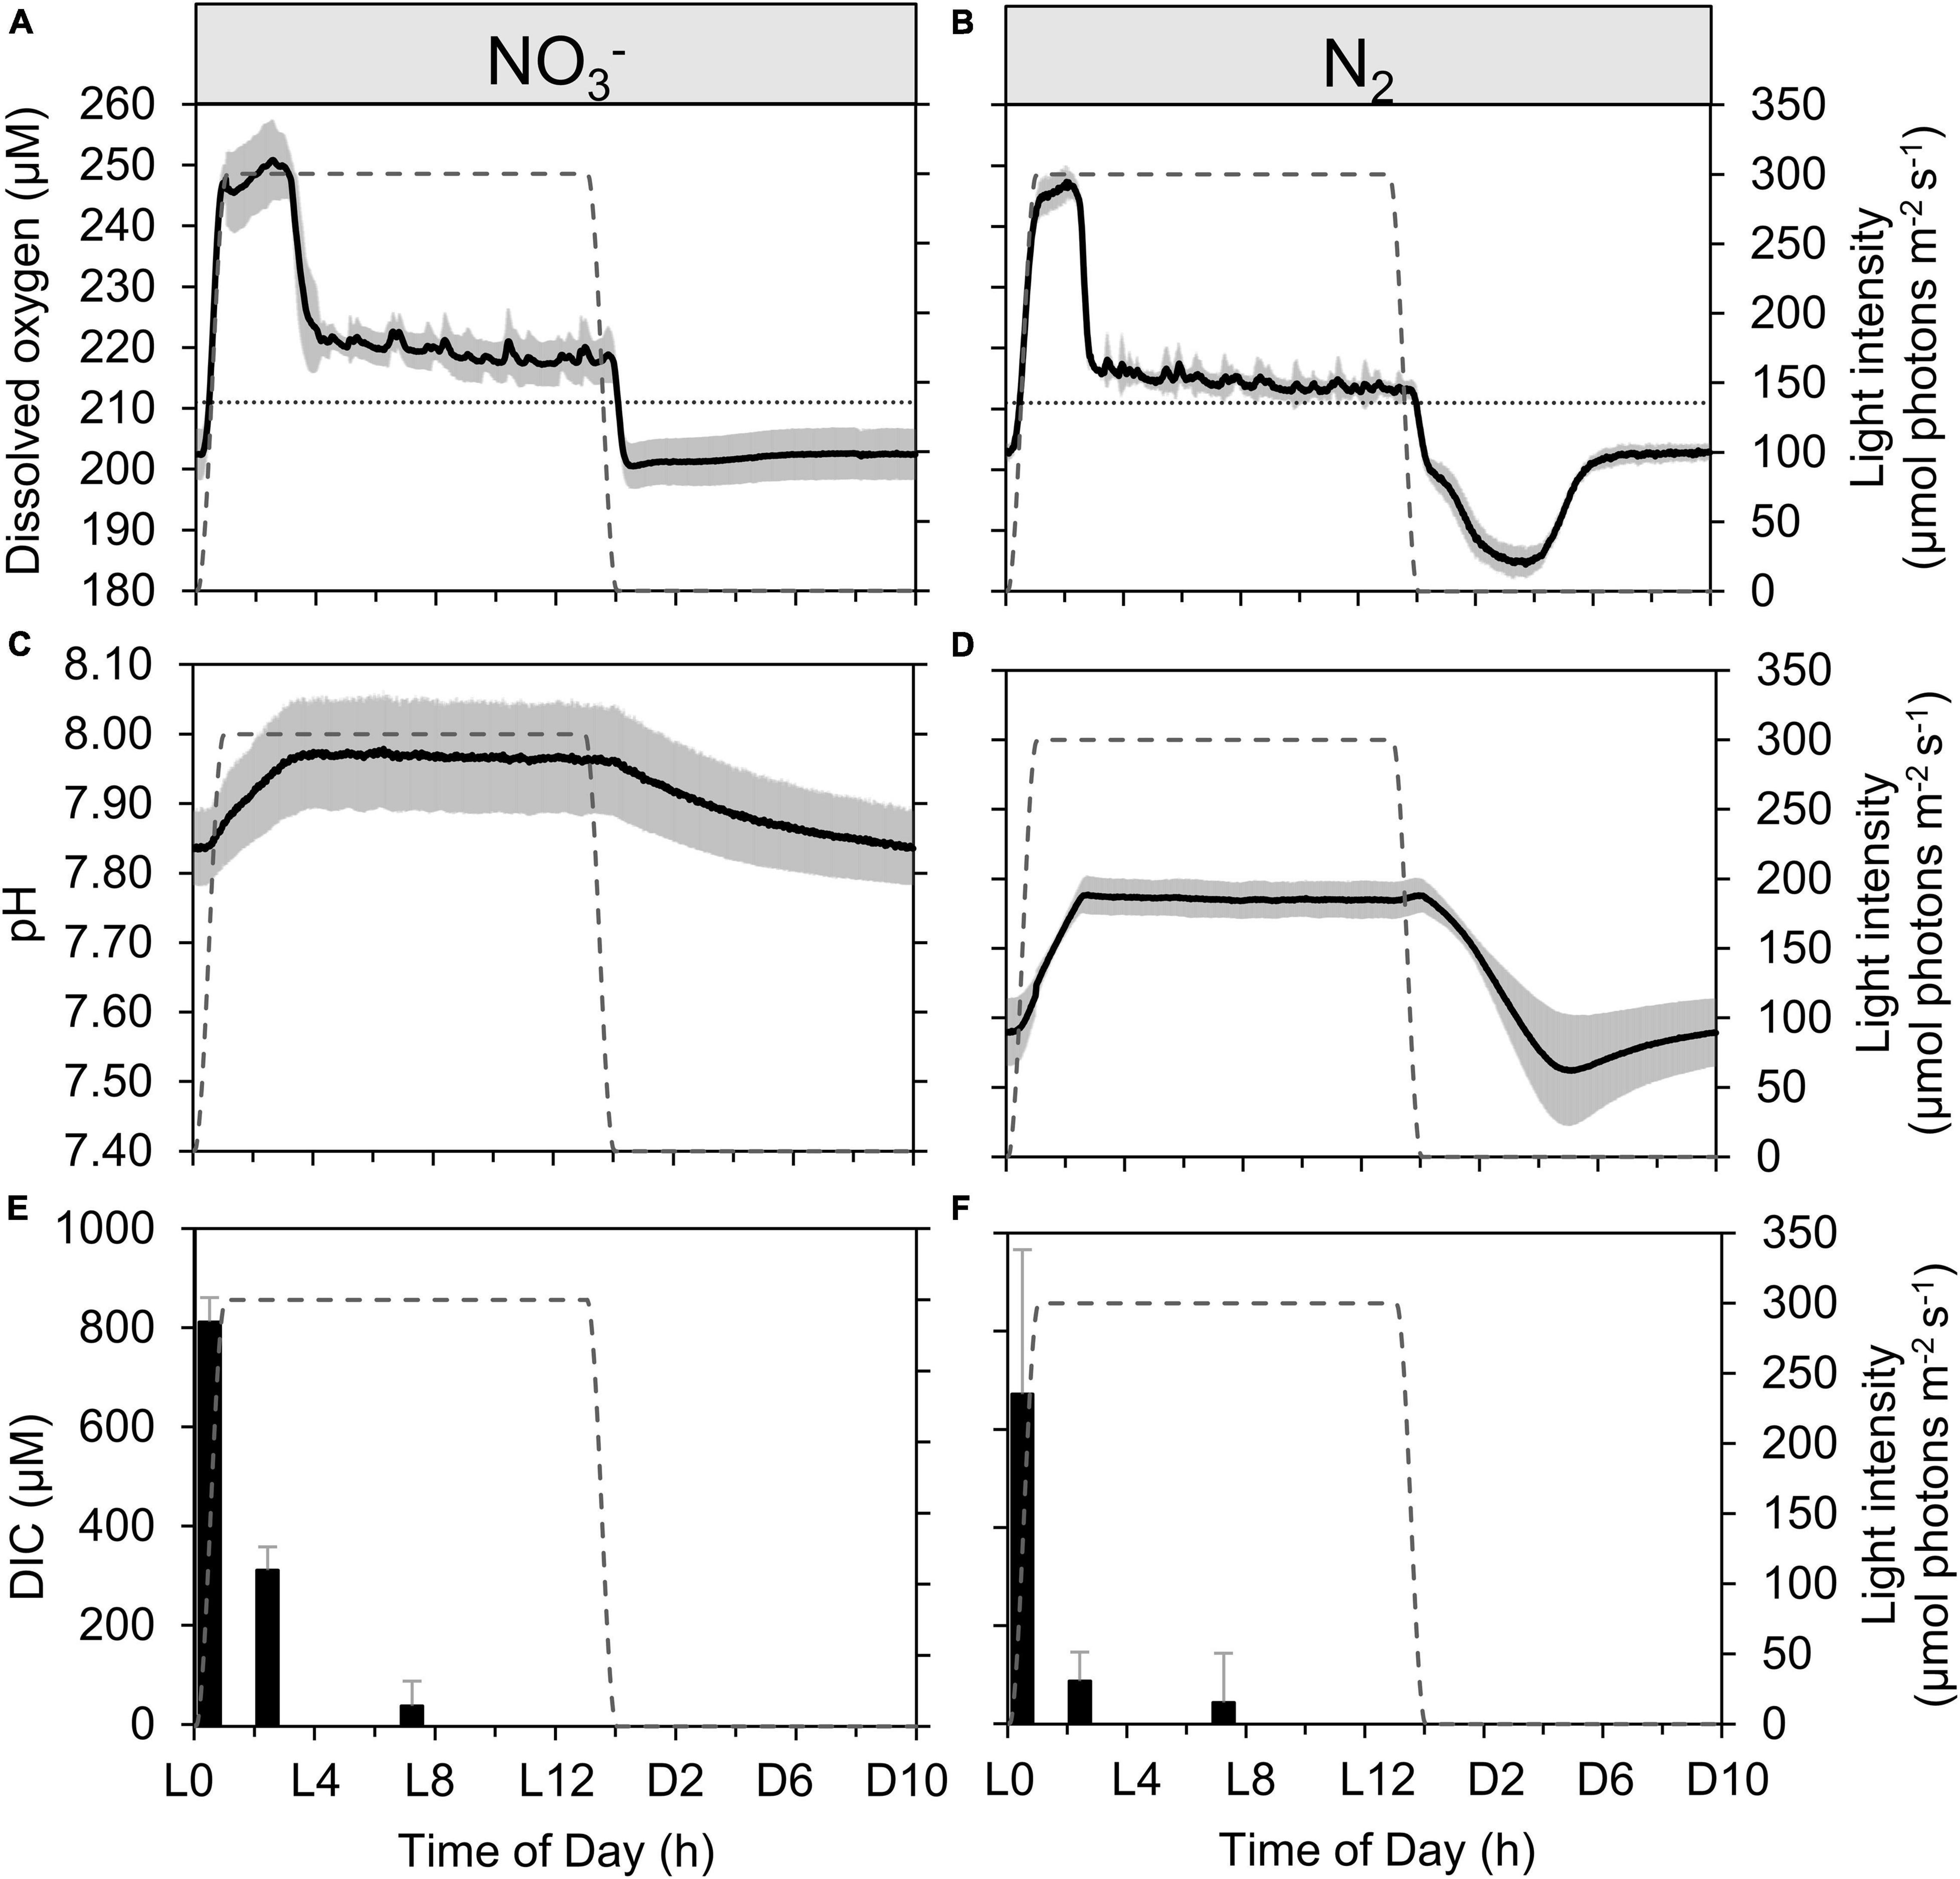
Figure 2. Dynamics of dissolved oxygen (A,B), pH (C,D), and dissolved inorganic carbon [DIC, (E,F)] in continuous Cyanothece cultures grown in ASP 2 medium either supplemented with NO3– (A,C,E) or not (B,D,F), throughout the daily 14h/10h light/dark cycle. Each trace represents averages of 5–6 light/dark cycles of 2 (A–D) or 3 (E) (with the exception of L3 sample with n = 2), (F) independent cultures, with error intervals and bars, respectively (representing standard deviations). The dotted lines in panels (A,B) represent the level of O2 equilibrium at 28°C in the medium, while the gray dashed line in each panel represents the light profile throughout the day.
Cyanobacteria Culturing
Cyanothece sp. ATCC 51142 was cultivated in flat panel FMT-150 photobioreactors (Photon Systems Instruments, Drásov, Czech Republic) of 400 mL or 1000 mL volume at 28°C in ASP 2 medium (Provasoli et al., 1957; van Baalen, 1962) buffered with 15 mM TAPS (pH of the medium was set to 7.8 by addition of a few drops of 1 M NaOH). Since the pioneering works of Reddy et al. (1993), ASP 2 medium has been widely used to grow the genus Cyanothece. ASP 2 medium was either prepared without addition of inorganic nitrogen (for N2 fixing cultures, thereafter called N2-fixing cultures.) or supplemented with NO3– (17.6 mM) for the nitrate-rich cultures (thereafter called NO3– cultures). Both these treatments were run in triplicate and all cultures were bubbled with ambient air (∼410 ppm CO2) with a flow rate of 200 mL min−1, as controlled by a gas monitoring system described in detail in (Červený et al., 2009). The air was supplied to the culture through U-shape metal tubes with four perforations of 0.7 mm diameter along the bottom part. This resulted in an average bubble size of diameter 2.6 mm (Nedbal et al., 2010). A vent topped with an air filter (Minisart, hydrophobic, 0.2 μm) connected the culture headspace with the atmosphere. Additional cultures were run with the exact same setup but with a regulated CO2 supply as a control for DIC replete cultures.
Illumination was provided by cool-white LEDs following 14h:10h L:D daily cycles with maximal light intensity set to 300 μmol photons m–2 s–1. The light intensity of the initial and the final hour of each light cycle was set to follow a sinusoidal increase and decrease, respectively. Built in probes mounted within the reactors allowed a real-time, continuous monitoring of dissolved O2 (InPro6800 electrode), pH and temperature (InPro3253, both probes are manufactured by Mettler-Toledo Inc, Columbus, OH, USA), the yield of steady-state chlorophyll a (Chl a) fluorescence emission using an built in pulse-amplitude modulated system, as well as optical density measured at as well as OD720 (as a 428 proxy for light scattering) and OD680 (as a proxy for both 429 light scattering and Chl a concentration). The pH and dO2 probes were calibrated before and after the experiment while the OD sensors were calibrated only before the experiments, both according to the instructions of the manufacturer. Cultures were run in turbidostat mode controlled by the OD680 signal (see the Supplementary file for detailed methodology). The specific growth rate in each culture was determined by exponential fitting of the OD720 signal (Supplementary Figure 3) provided by the built in sensor during the turbidostat mode, according to (Zavřel et al., 2015).
Cyanothece was cultivated continuously for at least 21 days, and sampled regularly four times a day after cultures had reached equilibrium. Time is expressed in hours into the 14h:10h light cycle: the prefix L indicates hours in the light (from L0 to L14) and the prefix D means hours into the dark (from D0 to D10). Samples were taken at the onset of the light (L0), after two hours of light (L2), at mid-light phase (i.e. after 7h of light, L7), and at the time of light to dark transition (L14 = D0). Some additional samples were also taken after 1h of light (L1) and after 2 or 4 hours of darkness (D2 and D4, respectively).
Photosynthetic Activity Measurements
PSII Kinetics
Variable fluorescence data were collected using a FastOcean Fast Repetition Rate fluorimeter (FRRf, Chelsea Technologies Group, West Molesey, Surrey, UK) on culture samples acclimated to low light (ca. 5 μmol photons m–2 s–1 for at least 20 min) to ensure full oxidation of the electron transport chain prior to measurements, as described previously (Suggett et al., 2015). Briefly, the FRRf was set to deliver a single turnover induction protocol of 100 flashlets over ca. 200 μs (2 μs flashlet pitch). Excitation was provided from a bank of blue and orange LEDs (setting of ELED 450 nm of 1.10 and ELED 624 nm of 1.26) to ensure full and consistent QA reduction. Measurements were recorded as an average of 10 consecutive acquisitions applied at intervals of 200 ms. Each FRRf acquisition was then fitted to the KPF model (Kolber et al., 1998) using FastPRO8 software (Chelsea Technologies Group) to yield the minimum (F0, or F′) and maximum (FM, or FM′) PSII fluorescence, PSII absorption cross-section (σPSII, or σPSII′; nm2 photon–1) for dark and actinic light (′) conditions. After the single turnover induction to close PSII the flashlet pitch was slowed to allow estimation of the lifetime for re-opening of PSII by downstream electron transport (τ or τ′, μs). All fluorescence yields were adjusted for baseline fluorescence retrieved from parallel FRRf measurements upon filtrates of each sample passed through a 0.22 μm pore filter (cellulose acetate, syringe filter; Whatman, USA). Values of σPSII were taxonomically weighted to the composite blue-orange excitation spectra and thus spectrally adjusted to match a white spectrum (Suggett et al., 2004). We used these parameters to quantify PSII electron transport during the light cycle, following:
where YII is the effective quantum yield of photosystem II photochemistry, calculated as
PSI Kinetics
PSI parameters were determined using a Dual-PAM-100 measuring system (Walz GmbH, Effeltrich, Germany). 3 mL of cell suspension were filtered through a GF/F filter and placed between the perspex rods of the emitter (DUAL-E) and detector (DUAL-DR) units of the system using a DUAL-B leaf holder. A default “induction with recovery” protocol was run after 2 min of dark adaptation, with 10 s of initial far red illumination followed by 40 s darkness and, subsequently, by 200 μmol photons m–2 s–1 red actinic light with saturating pulses (30 ms, 10.000 μmol photons m–2 s–1) on top. These saturating pulses (SPs) served to probe maximal P700 levels in the dark and during the actinic illumination (Pm and Pm′, respectively). SPs were given at 20 s intervals over the actinic light period and the average of signal intensities at pulses 2 to 5 (4 pulses) were considered in order to minimize the effect of state transitions on the PSI quantum yields [Y(I)] that might have been induced by the dark adaptation. Raw data were corrected by subtracting a blank value of about 19.5 mV, determined by using a wet filter paper without Cyanothece cells. ETR(I) was subsequently normalized according to Pm values (to take into account changes in PSI abundance) and Chl a concentration. Rates of P700 re-reduction kinetics were calculated from manually determined t1/2 values using saturating pulses during the initial dark period of the “induction with recovery” protocol.
NAD(P)H Kinetics
Light-induced formation of NAD(P)H as well as its post-illumination reduction to NAD(P)+, and concomitant changes in Chl a fluorescence was probed using cell suspensions filled into a standard 1 cm quartz cuvette placed in the Optical Unit ED-101US/MD of the Dual-PAM-100 measuring system (Walz). Simultaneous detection of NAD(P)H and Chl a fluorescence was performed using a NADPH/9-AA module (consisting DUAL-ENADPH and DUAL-DNADPH) combined with DUAL-DPD and DUAL-DR (Schreiber and Klughammer, 2009). Before measurements, samples were spun down and resuspended in fresh ASP 2 medium supplemented with NO3– (nitrate-rich cultures) or not (obligate diazotrophic cultures), for a final Chl a concentration of 7 μmol–1 followed by 10 min of dark adaptation. Then, 60 s of 200 μmol photons m–2 s–1 red actinic light was applied to initiate photosynthetic electron transport and NAD(P)H and Chl a fluorescence were simultaneously recorded. Dark NAD(P)H reduction level was estimated by dividing the signal increase upon illumination with the total signal amplitude between the maximum upon illumination [NAD(P)H] and post-illumination minimum [NAD(P)+]:
Post-illumination increase of the Chl a fluorescence (if any) was interpreted as reduction of the PQ pool (Deng et al., 2003).
Results and Discussion
Continuous Cyanothece cultures were cultivated in photobioreactors in two distinct growth regimes: either (i) in standard ASP 2 medium supplemented with NO3– as nitrogen source, or (ii) in a modified ASP 2 medium without NO3–, to impose dependence upon N2-fixation. Overall, and across our 4-day monitoring during the equilibrium phase (within a 19-day experiment; see Materials & Methods), the average growth rates are 0.22 ± 0.07 d–1 in N2-fixing cultures and 0.30 ± 0.08 d–1 in the NO3– cultures. These values are significantly different (p < 0.05, ANOVA, Tukey HSD test, n = 7 consecutive days for N2-fixing cultures and 11 for NO3– cultures) and reflect the overall lower growth in cells growing as obligate diazotrophs compared to cells growing on NO3–. When integrated from the transient, hourly growth phases (Tables 1, 2 and Supplementary Figure 3), the daily mean and SD values of the specific growth rates are 0.21 ± 1.19 d–1 in the N2-fixing cultures and 0.31 ± 0.51 d–1 in the NO3– cultures. The large standard deviations illustrate that instantaneous, metabolic processes are highly dynamic and lead to significant variability in transient cell growth processes within a 24 h period. For instance, and as discussed below, apparent negative growth rates obtained in the early dark phase in the N2-fixing cultures are related to the significant consumption of carbon reserves to fuel N2-fixation, which led to a decrease in the overall carbon biomass (hence in optical density). Cyanothece has achieved much higher growth rates in other studies (see for instance Reddy et al., 1993; Agawin et al., 2007; Brauer et al., 2013), and we believe the lower achieved growth in our bioreactor experiments results from transient DIC limitations. In an ocean acidification scenario with elevated pCO2 and DIC levels (380 vs. 980 μatm pCO2, 1970 vs. 2150 μmol kg–1 DIC), increased particulate organic carbon (POC) and nitrogen (PON) production rates in Cyanothece were attributed to lowered energy costs for the CCM (Eichner et al., 2014). Similarly, Crocosphaera grown diazotrophically under low pCO2 treatment (180 ppm) shows a lowered growth rate compared to a high pCO2 (800 ppm), which was attributed to an ATP deficit due to the extra energy invested in the CCM (Garcia et al., 2013). As we will see below, the efficiency of CCM in the studied Cyanothece is limited and, in addition to the energy cost to operate these mechanisms, a remaining carbon limitation likely still hinders carbon acquisition in both treatments as DIC levels in the bioreactors are drawn down.
Biomass Buildup and Transient Growth Dynamics Within the Light Cycle
As cell sizes differ slightly, but significantly, between the two treatments (mean comparison test, n = 32, p < 0.001), the concentration of all major cellular components are expressed on both cell (Table 1) and biovolume bases (Table 2). On average, diameters of cells grown on NO3– are 5% larger (3.12 ± 0.05 μm vs. 2.96 ± 0.05 μm; Table 1) and accumulate 19% more nitrogen, in particular in pigments and nitrogen storage pools (see Supplementary Material). In contrast, although the daily average of total cellular carbon content is similar in both types of cultures, and they also both show a diurnal increase in cellular carbon content, the diel pattern of a carbon storage strategy is more pronounced in the N2-fixing cultures. FTIR spectra reveal striking differences in carbon allocation into carbon reserves and their temporal dynamics (Supplementary Figure 1) with, in particular, larger allocation into the carbohydrate pools and a storage buildup strategy in the N2-fixing cultures, while the NO3– cultures tend to accumulate more proteins. The carbohydrate content of the cells determined by FTIR increases linearly during the light period. By the end of the light period, the carbohydrate content of the NO3– culture increased by 50%, while carbohydrate content of the N2-fixing culture increased by 230%, compared to onset of light (Supplementary Figure 1). The strategy of Cyanothece to store significant carbon reserves in the light to operate a respiratory protection of nitrogenase and to fuel N2-fixation during the dark is well known (Reddy et al., 1993; Schneegurt et al., 1994). We further see here that this strategy is quite adaptable as, when provided with NO3–, the extra energy that N2-fixation required is no longer needed and Cyanothece accumulates far lower reserves in the light.
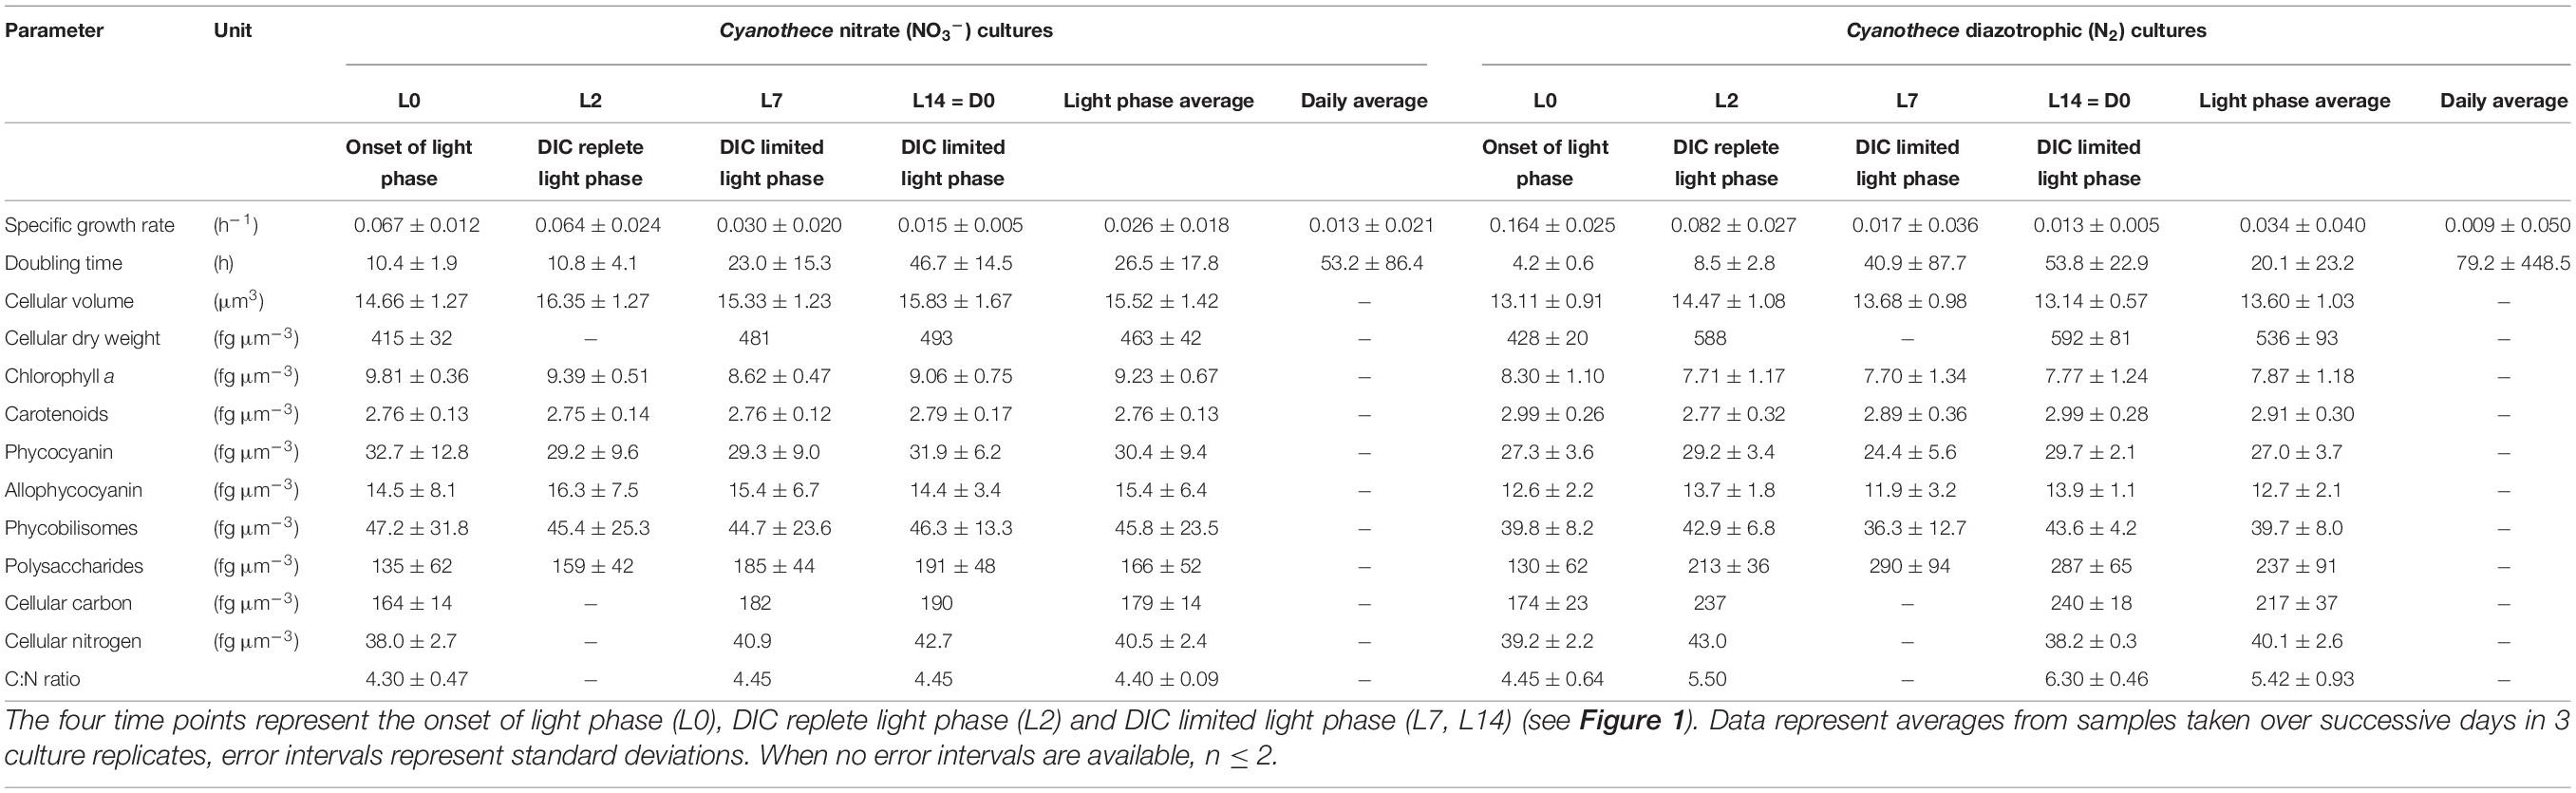
Table 2. Morphology and composition of Cyanothece cells cultivated in ASP2 medium supplemented with nitrate (NO3–) or under obligate diazotrophic (N2) conditions, normalized per biovolume.
Slight differences can be observed in the temporal dynamics of proteins, which can be related to the N acquisition strategy (nitrate uptake in the light phase vs. N2-fixation in the dark phase), as shown by the analysis of FTIR spectra (see Supplementary Material). However, the amplitude of protein fluctuations is quantitatively comparable in the two treatments and the protein content of both cultures is similar at the end of the light phase (Supplementary Figure 1).
In the subsections below, we use biochemical data to describe the growth dynamics observed in each treatment within the light cycle. We will see that cultures pass through two distinct phases during the light period: firstly, a DIC-replete, light-saturated phase that lasts for about 3 h in the N2-fixing cultures and 4h in the NO3– cultures, followed by a DIC-limited phase for the rest of the light period. Then, clear differences in their behavior appear in the dark, related to N2-fixation in the N2-fixing cultures.
Changes in cell abundance and composition are visualized by monitoring OD680 and OD720. Figure 1 shows the high-frequency data obtained with the probes recording OD680 and OD720 in real-time within the cultures. Typically, in any given culture, OD rises as biomass increases; when cultures are run in turbidostat mode, dilution is controlled so as to maintain the biomass concentration close to the setpoint (in this case, an OD680 setpoint). Therefore, each time the set OD680 threshold is reached, the automated pump activates to replace the culture with new medium, thereby diluting the biomass concentration; this leads to a drop in the OD signal(s), which then acts as a stop signal for the pump. In the following, we are describing growth processes at shorter time scales than the cell division cycle, which result in transient changes in the cell C and N composition, thereby affecting the OD signal. These processes can for instance be carbon incorporation, carbon consumption through respiration, biomass buildup from reserves, nitrogen incorporation, etc. Therefore, the “growth” we describe using the OD proxy encompasses all of these processes. As we will see in section Growth Dynamics During the Dark Phase, OD720 is particularly sensitive to changes in the refractile intracellular POC. When growth processes are relatively constant, successive dilutions occur at rather regular time intervals in the cultures, as often as needed to maintain the culture density near the desired value, which lead to zigzagging trends in the OD records. As we will see below (see section Growth Dynamics During the Dark Phase), OD720 is particularly sensitive to changes in the refractile intracellular POC, which makes it a suitable proxy to describe the dynamics of the carbohydrate pools.
Growth Dynamics During the Light Phase
Unless something changes in the cultures conditions, the dilution events are expected to go on at regular intervals, for the entire light phase, as carbon is incorporated. The visible disruption in dilution events, as observed by the slower increase in density and so, the absence of any dilution event between ∼L3 and L5 in both NO3– and N2-fixing cultures shows something changed in the overall physiology of cells from about L3—L4. Using these results and the concomitantly logged levels of dissolved oxygen and pH (Figure 2), we identified a series of physiological phases in the diel dynamics of Cyanothece. The dynamics of ODs compared to [O2] provides a deeper insight on this phenomenon. The OD720 signal was also used to derive the average, daily growth rate, as well as the transient rates of growth observed at the scale of hours (Supplementary Figure 3).
A very high, instantaneous growth rate (0.16 ± 0.02 h–1) is derived from the rapid increase in OD720 at the onset of the light period in the N2-fixing culture (Figure 1B and Supplementary Figure 3B), which reflects a buildup of C stores. Deschamps et al. (2008) identified these storage compounds as being polysaccharides. Conversely, the NO3– culture shows only minor variability in OD (Figures 1A,C); the already high OD720 at the dark to light transition suggests that persisting cellular carbon reserves are rather significant, consequent to a lower carbon demand during dark hours in NO3– cultures (Figure 1C). The instantaneous growth rate in NO3– cultures in the first hours of light period thus appears much lower (0.06 ± 0.01 h–1; Supplementary Figure 3A) compared to the N2-fixing cultures. Over these early light hours, the level of dissolved oxygen increases rapidly in both types of cultures as a result of photosynthetic O2 evolution initiated by the increasing irradiance (from dark to 300 μmol photons m–2 s–1; Figures 2A,B). The pH in the N2-fixing cultures increases faster (0.095 h–1) compared to the NO3– cultures (0.049 h–1; Figures 2C,D) due to a rapid DIC consumption, which decreases the DIC concentration to less than a third of that observed in the NO3– cultures (Figures 2E,F). The pH decrease in the N2-fixing cultures during the dark phase was not compensated due to the weaker TAPS buffering capacity below pH 7.7.
After the initial rapid increase, and as irradiance stabilizes, the O2 concentration increases only slightly: 5.14 ± 0.05 μmol O2 L–1 h–1 in the NO3– cultures and 2.41 ± 0.02 μmol O2 L–1 h–1 in the N2-fixing cultures (derived from the O2 signal as shown in Figures 2A,B). This stage corresponds to light-limited photosynthesis, at a rate sufficient to maintain O2 concentration significantly above the physical equilibrium expected from the bubbling. When grown under favorable conditions under a 12:12 light:dark regime, oxygen evolution in Cyanothece peaks around the mid-light phase to L8, following a progressive photoacclimation of PSII centers, before decreasing in the second half of the light phase (Meunier et al., 1997, 1998). In the present experiments, the increasing stage is interrupted well before mid-light as DIC becomes limiting at about L3.5 in the NO3– cultures and L2.5 in the N2-fixing cultures (Figures 2E,F). The onset of DIC limitation coincides with a massive decline in photosynthetic O2 production in both cultures, as seen by the decrease in the concentration of dissolved O2 (Figures 2A,B). The O2 level starts to decline earlier in the N2-fixing cultures, in correlation with their much faster depletion of DIC (Figures 2E,F). As a consequence, instantaneous growth rates progressively revert to very low values (Supplementary Figure 3B). The decline in photosynthetic rates following the draw-down of DIC was confirmed by trends in 13C incorporation shown in a companion paper (Polerecky et al., 2021), with a decrease in C specific assimilation rates from 1.7 ± 0.35 d–1 (morning) to 0.39 ± d–1 (afternoon) in N2-fixing cultures and from 0.84 ± 0.15 d–1 (morning) to 0.42 ± 0.07 d–1 (afternoon) in NO3– cultures (Polerecky et al., 2021). When CO2 concentration in the inflow air is increased, the DIC limitation is relaxed and O2 concentration increases during the light phase (Supplementary Figure 4). The dO2 dynamics under DIC limitation was indeed different from a setup where DIC limitation was prevented and where no sharp decline of photosynthetic activity during the day could be observed (Červený and Nedbal, 2009).
During the light period, electrons provided by photosynthetic water-splitting in the N2-fixing culture cells are allocated for CO2 fixation, while none are used directly for N acquisition. In contrast, in cells growing on NO3– as a nitrogen source diurnal patterns in NO3– assimilation follow those in C assimilation, with highest rates in both processes measured in the morning (Polerecky et al., 2021). NO3– reduction requires 8 + 2 electrons per NO3– ion assimilated to glutamate (see Introduction), originating ultimately from the photosynthetic electron transport. Hence, these cells must divert at least some of the electrons generated by photosynthesis from carbon fixation to NO3– reduction. This concurrent and competing demand for photosynthetic electrons limits the rate of DIC drawdown in the NO3– culture as compared to the N2-fixing culture that draws down the DIC pool sooner (Figure 2F). Therefore, light saturated photosynthesis can proceed a little longer into the light period in the NO3– grown cells before the DIC pool becomes depleted (Figures 2A,B,E,F). This agrees with the theoretical, comparative electron demand based upon C:N ratios for each metabolic strategy outlined earlier, multiplied by their respective growth rates.
For the remaining 10 h of the light period, the O2 concentration decreases slowly at an average rate of −0.40 μmol O2 L–1 h–1 in the NO3– cultures and −0.27 μmol O2 L–1 h–1 in the N2-fixing cultures (Figures 2A,B). Nonetheless, the oxygen concentration remains super-saturated above the equilibrium concentration, indicating a lower, but persistent photosynthetic activity in both types of cultures, which is sufficient to outrun the equilibration driven by bubbling with air. During this phase, O2 evolution approaches a compensation point among DIC-limited photosynthesis, respiration, and O2 exchange due to bubbling. MIMS data (see Supplementary Material) confirm the observed robust DIC drawdown and show that net O2 evolution is the same between treatments while respiratory and light-dependent O2 uptake is higher in the NO3– culture (Supplementary Figure 5). Concomitantly, the successive increases in OD triggering dilution events confirm that growth recovers at least partially during this period of sustained DIC limitation (Figure 1) and both cultures show an equivalent growth rate of 0.02 ± 0.01 h–1. This recovery most probably reflects induction of CCM (Supplementary Figure 6) to counter the drawdown of DIC. DIC concentrations decreased to about 50 μmol L–1, irrespective of the growth regime, by the middle of the day (Figures 2E,F). Assuming a balanced carbonate system, at the pH of the cultures (pH of ∼8) the CO2aq: DIC ratio is predicted to be ∼1:100, implying a minimum CO2 concentration of ca. 0.5 μmol L–1 CO2 in the bioreactors. This is 2–3 orders of magnitude lower than the typical KM of cyanobacterial RuBisCO (105–185 μmol CO2 L–1; Badger et al., 1998), suggesting also that high activity of carbon concentrating mechanisms (CCM) are required to supply RubisCO.
We note that the lower pH in the N2-fixing cultures could result in additional costs for maintaining pH homeostasis and/or fueling N2-fixation (Shi et al., 2012; Luo et al., 2019). However, the pH difference between culture types of 0.02 ± 0.004 (Figure 2) was small enough to consider this effect negligible (< 5%), compared to the larger differences in the energetic costs of N2 fixation (equation 5) vs. NO3– assimilation (equation 6).
Growth Dynamics During the Dark Phase
An immediate drop in O2 concentration is clearly visible at the onset of the dark period as soon as photosynthesis stops, which is likely accentuated by the upregulation of the terminal electron acceptor of the respiratory chain (the cytochrome c oxidase, Stöckel et al., 2008) and increased respiration upon the onset of the dark (Meunier et al., 1997). O2 concentrations decline to a sub-saturation level in both N2 and NO3– cultures (dotted lines, Figures 2A,B), indicative of sustained respiratory activity that is not fully compensated by the continuous bubbling of the turbidostats. However, the distinct OD dynamics and O2 fluxes suggest that different processes operate under the two nitrogen regimes.
In the NO3– culture, the O2 concentration decreases to 201 μmol L–1, stabilizes for almost half an hour and then slightly and monotonically increases throughout the dark period. Sub-saturated oxygen concentrations remain for the entire dark phase, indicative of a basal, dark respiration activity. The concomitant OD signal shows first an initial decrease in OD680 due to the last dilution event (Figure 1B). Then OD680 slowly increases while OD720 slowly decreases during the night (Figures 1A,C). We hypothesize that these dynamics are due to pigment synthesis (increase in OD680) and respiration of refractile carbohydrate storage granules resulting in a decrease in (OD720).
In the N2-fixing culture, after an initial decrease in OD (caused by the last dilution event; Figure 1B, grey downward arrow), followed by a short (∼1 h) stabilization phase, both OD680 and OD720 decrease linearly for over 5 h. The overall decrease in OD matches that of the initial increase in the light period. Since neither cell divisions (León et al., 1986; Dron et al., 2013) nor dilution events occur in the dark, the rapidly decreasing OD signals suggests a decline in the refractile intracellular particulate material. Moreover, in contrast to the NO3– culture with relatively stable O2 in the darkness, the O2 concentration in the N2-fixing culture shows a remarkable transient decrease (to 184 μmol L–1) over the initial 4 h of darkness (Figure 2B). This O2 dynamic exposes the oxygen demand associated with the respiratory requirements for N2-fixation (Meunier et al., 1997; see also Supplementary Figure 4), which, based on the O2 signal, seems to primarily occur during the first half of the dark period. The highest oxygen consumption occurs between D3 and D4, which is congruent with both the minimum O2 evolution and the maximum respiration rate also reported around D4 in the same species by Sherman et al. (1998). Thus, the change in OD720 is caused by respiration of refractile carbohydrate storage granules to fuel N2-fixation. In good agreement with the O2 signal, OD720 then stabilizes at its minimum value over the last four hours of darkness, indicating that carbohydrate reserves are no longer being rapidly respired and N2-fixation activity terminated, causing the O2 concentration to increase and stabilize at a level comparable to the NO3– culture (dotted line, Figures 2A,B). Comparison of these two dynamics suggests that no significant N2-fixation occurred in the NO3– culture. Overall, the N2-fixation relies on the provision of ATP and, hence, on significant respiratory activity, while NO3– uptake requires more electrons, but can proceed under illumination and, therefore, has less immediate effect upon O2 dynamics during the dark period. Given that respiration is O2-saturated at levels far below the concentration of O2 in air saturated water, we believe that O2 was not limiting metabolic processes at night. Had nitrogenase activity been limited by oxygen for respiration, a plateau would have been observed once the lowest O2 level was reached, instead of a negative peak (Figure 2B). Instead, the O2 signal did not remain at this minimum but re-increased before the 4th hour of dark, indicating a decreased oxygen demand coincident with a decrease in nitrogenase activity. The temporal dynamics of nitrogenase activity suggested by the O2 signal is also further supported by the FM and Y(II) dynamics at night (Figures 3B,D), as capacity for electron transport around PSII has proved to be a proxy for nitrogenase activity in the unicellular diazotroph Cyanothece (Rabouille et al., 2014).
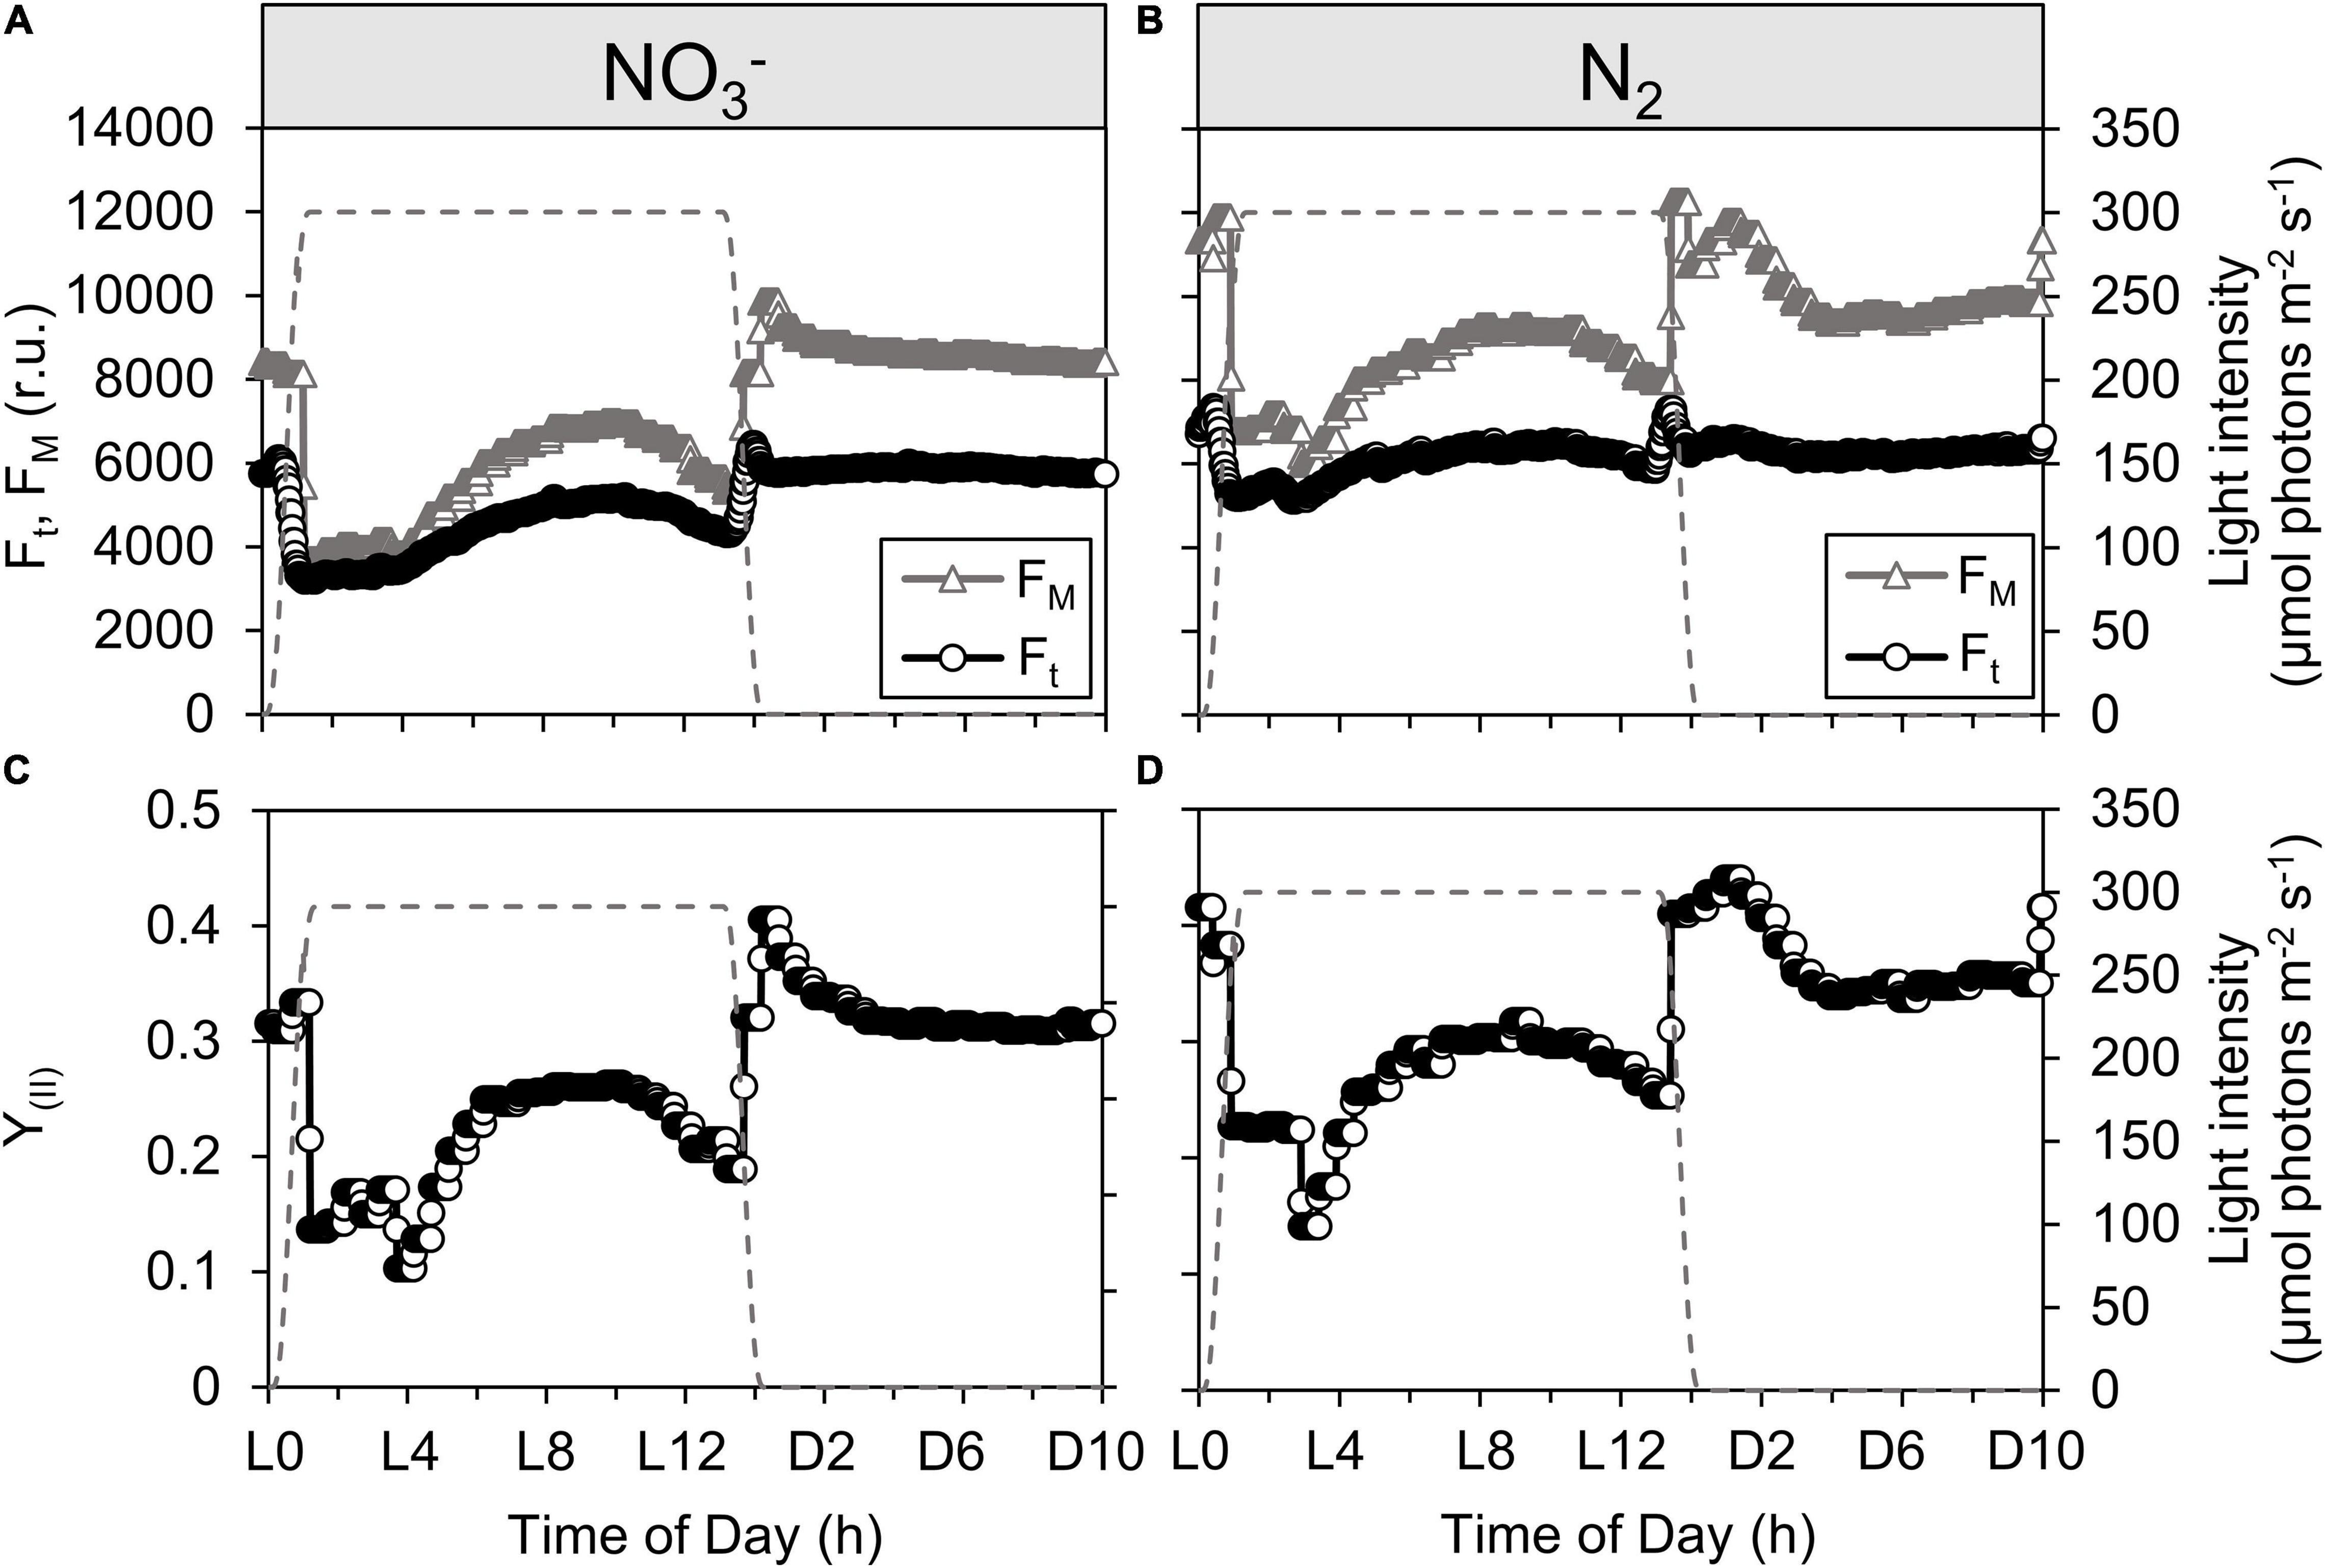
Figure 3. Dynamics of steady-state fluorescence yield, Ft [open circles; (A,B)], maximal fluorescence yields, FM and FM [open triangles; (A,B)] and quantum yield of PSII, YII [open circles; (C,D)] during Cyanothece cultivation in ASP 2 medium supplemented with NO3.. (A,C) or under obligate diazotrophy (B,D). The traces of Ft, FM (or FM′) and YII represent one typical record throughout a 24 h period acquired by the online pulse-amplitude modulated sensors of the photobioreactors. The gray dashed line represents the light profile over a 24 h period.
The incorporation of labelled C and N presented in a companion paper clearly indicates that N2-fixation occurs primarily in the first half of the dark period, and decreases by two orders of magnitude during the second half of the dark phase (1.34 ± 0.79 d–1 in early night vs. 0.012 ± 0.047 d–1 in late night; Polerecky et al., 2021). This result is in good agreement with the OD720 dynamics, confirming that the active respiration of carbohydrates to fuel N2-fixation also stops by the mid-dark phase. However, cells still contain significant bulk polysaccharide reserves at the end of the dark phase (see D10 = L0 in Tables 1, 2), indicating that termination of N2-fixation is not due to exhaustion of the carbon reserves potentially available to fuel this activity. The nitrogenase enzyme is under the control of a tight circadian program which probably triggered a post translational regulation of and/or decay of the enzyme pool (Cólon-López et al., 1997). We postulate that the reason for such a control before the end of the dark is related to the replenishment of the nitrogen reserves: sufficient new N2 may have been assimilated into N storage given the overall growth rate achieved under the present conditions, making it unnecessary for the N2-fixation machinery to keep operating.
Photosynthetic Efficiency
Similarly to other oxygenic photoautotrophs, cyanobacteria feature an excitation energy transfer from the antennae to photosynthetic reaction centres and the distribution of absorbed light between photosystems that can be modulated by short-term light acclimation processes. In particular, state transitions balance the distribution of excitation energy between photosystems, depending upon the redox state of the plastoquinone (PQ) pool (Meunier et al., 1997). These regulatory processes interact to cause changes in photochemical and Chl a fluorescence yields depending upon light and metabolic conditions. In the following, we used the fluorescence data to reveal the mechanisms underlying the observed two phases during the light period.
Online fluorescence monitoring within the cultures was used to probe the efficiency of PSII (YII), which is a proxy for the immediate conversion of photon energy into chemical energy. Under favorable conditions, the expression of genes encoding PSII subunits is highest in the very early light phase (Stöckel et al., 2008), suggesting that PSII should quickly be operational upon the onset of the light. In the early light phase, the Ft signal closely approaches FM′ in the NO3– cultures (Figure 3A), which leads to a drop in YII upon illumination (Figure 3C). This is indicative of a stronger PSII closure compared to the N2-fixing culture (Figures 3B,D), consistent with the higher phycobiliprotein content (see Supplementary Material) allowing a broader collection of photons, and therefore higher excitation pressure upon PSII, in the NO3– cultures. The observed, lower photosynthetic yield in the NO3– cultures coincides with a lower rate of carbon incorporation and change in optical density (Figure 1) in the early light phase. This YII pattern is also further confirmed by longer lifetimes (τ) for PSII reopening after a single turnover saturating flash (Figure 4A, solid line), particularly in τ measured immediately after a shift to darkness (Figure 4A, dashed line). These YII and τ dynamics suggest that PSII reopening is slowed down because electrons linger downstream: they are not very efficiently drawn away from PSII, which then tends to remain closed for longer times. This downstream limitation upon electron transport away from PSII relaxes later in the photoperiod (from L4 in the NO3– cultures and L3 in the N2-fixing cultures) when the τ from NO3– and N2-fixing cultures converge under DIC limitation, allowing Ft to again fall below FM Figures 3A,B) as the PSII pool partially reopens. We thus have the counterintuitive finding that capacity for electron transport away from PSII actually accelerates as the cells progress from a DIC replete light phase of rapid light-saturated oxygen evolution to DIC limited oxygen evolution. This acceleration of downstream electron transport capacity reflects opening of electron fluxes, which is also paralleled by a partial reestablishment of growth (Figure 1) during the photoperiod. Fluorescence data therefore further support the conclusion that CCM is induced in both culture treatments under DIC limited growth (Badger and Price, 2003) and generates additional electron flux downstream of PSII.
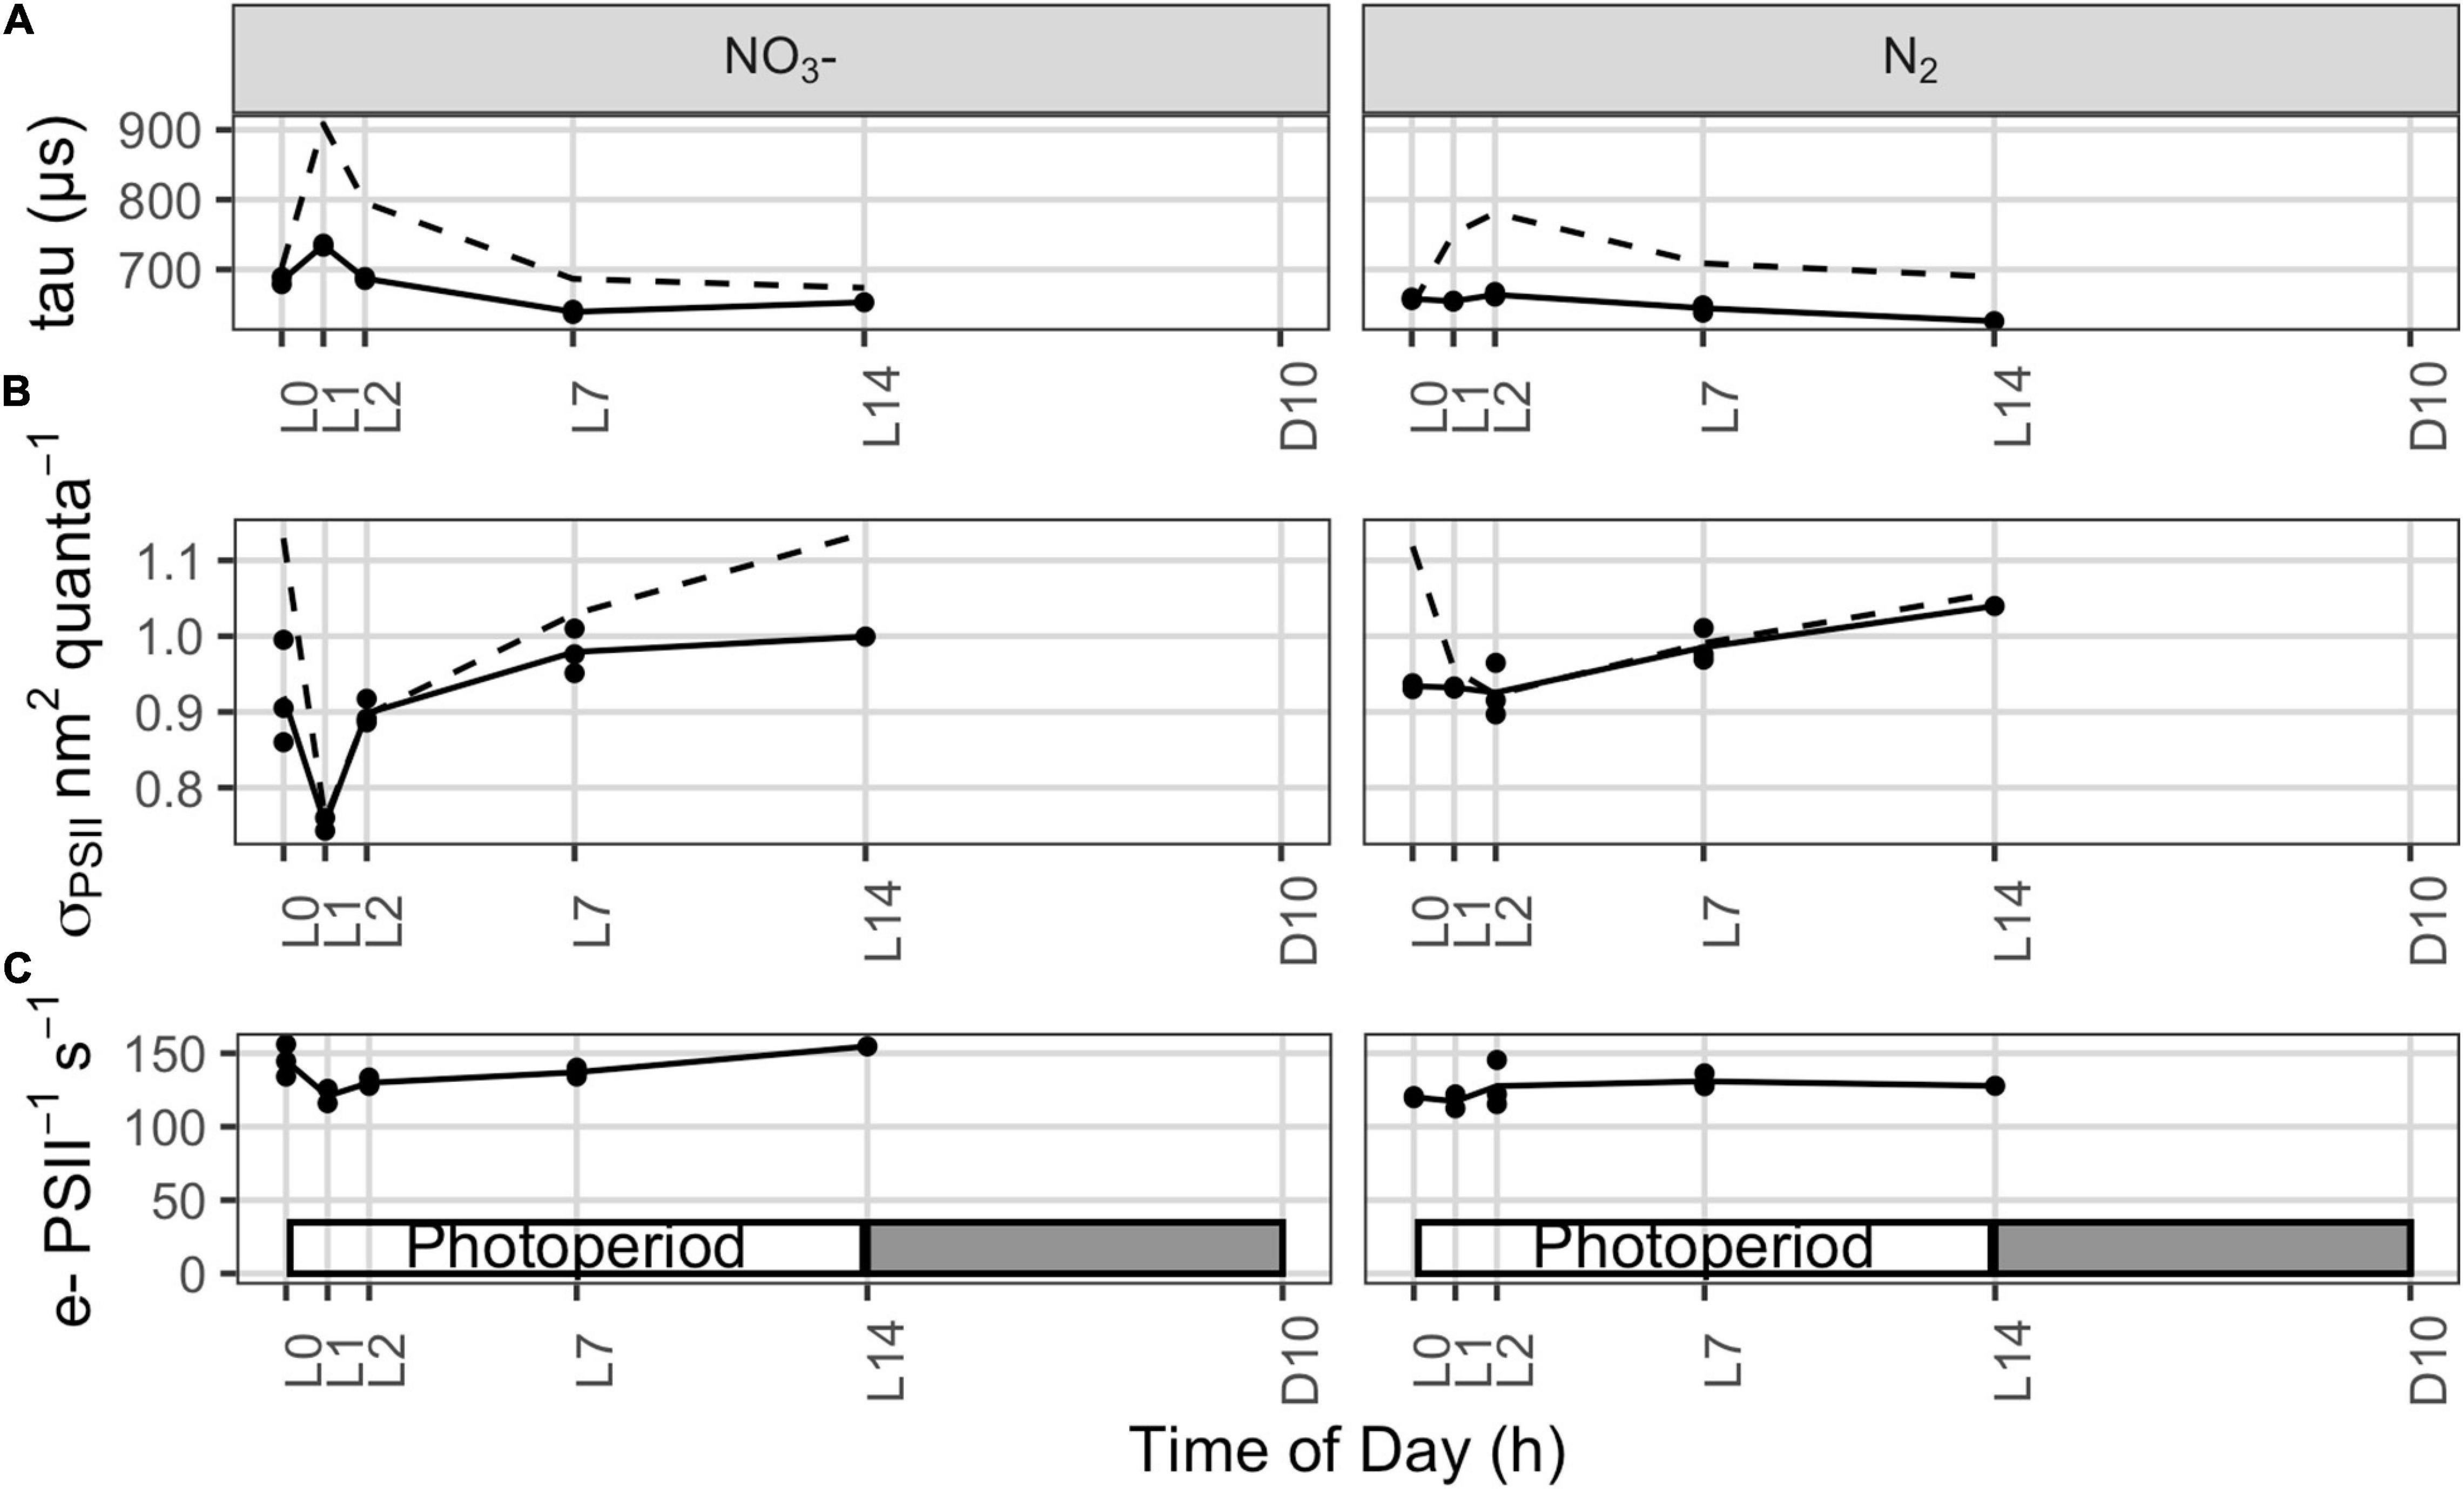
Figure 4. (A) Lifetime for reopening of Photosystem II, τ (μs), reflecting capacity for transport of electrons away from PSII, measured using FRRf relaxation after a single turnover saturating flash, applied on top of actinic illumination (τ′, solid lines), similar to the growth light level of 300 μmol photons m–2 s–1 in the photobioreactors. Dashed lines show the average of τ measures taken from the same samples in darkness. (B) Effective absorption cross section for Photosystem II measured using FRRf under growth illumination (solid lines; σPSII′, nm2 quanta–1) or under darkness (dashed lines; σPSII, nm2 quanta–1). (C) Photosystem II electron transport (e– PSII–1 s–1) under growth illumination estimated from FRRf parameters, following eqn.10.
During the initial light phase with intense oxygen evolution, the effective absorption cross section for PSII under growth irradiance (σPSII′, nm2 quanta–1) is transiently down-regulated in the NO3– cultures (Figure 4B), consistent with the quenching of fluorescence yields observed over the same period from the built in sensors in the photobioreactors (Figure 3A). These findings, together, suggest a state transition towards State II, with a transient drop in relative allocation of excitation to PSII photochemistry. These changes in fluorescence yield and σPSII′ could possibly also be explained by induction of fluorescence quenching through the Orange Carotenoid Protein (OCP) system (Kirilovsky, 2015), which is encoded in the Cyanothece genome. But the parallel increase in τ (Figure 4A) rather indicates changes in downstream processes which lead to an increased reduction of the intersystem electron carriers, triggering the transition towards State II. Furthermore, the built in detectors show parallel responses of fluorescence whether excited either by blue, through Chl a, or by orange/red, through the phycobilisome antenna (data not shown). A response mediated by OCP would rather be expected to act preferentially upon excitation delivered through the phycobilisomes, rather than similarly upon excitation delivered through both Chl a and the phycobilisomes.
In contrast, this initial decline in σPSII′ and increase in τ upon illumination are absent or muted in the N2 bioreactors (Figure 4B), perhaps reflecting differences in electron dynamics related to the depletion of carbohydrate reserves in darkness in the N2-fixing cultures, compared to the NO3– cultures which retain carbohydrate reserves from the dark phase to support respiration upon re-illumination. Furthermore, the phycobilisome content (both allophycocyanin and phycocyanin) is lower in the N2-fixing cultures (Tables 1, 2; see Supplementary Material), possibly affecting state transition and excitation pressure upon PSII.
Upon the end of the light saturated phase, the NO3– cultures transition back towards State I as shown by the increase in σPSII′ (Figure 4B). This, together with the recovery of fluorescence yields within the culture (Figure 3A) and a progressive decrease in τ (Figure 4A), suggest the induction of down-stream capacity to carry electrons away from PSII allowing re-oxidation of the intersystem transport chain.
Even though net oxygen evolution is high during early illumination (Figure 1), PSII-mediated electron transport (e– PSII–1 s–1), estimated from FRRf under growth illumination, decreases (NO3– cultures) or remains steady (N2-fixing cultures; Figure 4C), consistent with the fluorescence quenching and down-stream limitation of electron transport observed over the same initial illumination period. This shows that over this period, despite slower electron flow through PSII, cells are nevertheless allocating a larger fraction of electrons flowing from PSII to net assimilatory reduction, leaving a high net oxygen evolution.
When net oxygen evolution decreases to a lower rate limited by DIC (Figure 1), PSII-mediated electron transport (e– PSII–1 s–1) actually increases (Figure 4C), consistent with an increase in pseudo-cyclic flow of electrons away from PSII but back to O2, as confirmed by MIMS measurements showing high rates of O2 uptake in the light reaching 37 ± 8% (N2-fixing culture) or 61 ± 16% (NO3– culture) of gross O2 evolution (Supplementary Figure 5), thereby accelerating τ (Figure 4A) and allowing Ft to drop below FM′ as PSII centers re-open (Figure 3A). This re-opening is a gradual process from ∼L4.5 to ∼L9 in both the NO3– and N2 bioreactors (Figures 3, 4A), consistent with a regulatory induction of alternate electron sink(s) concurrent with the onset of DIC limitation of oxygen evolution (Figure 1). This induction, however, does not depend upon DIC limitation because a similar pattern occurred even in bioreactors bubbled with CO2 to relieve the diel onset of DIC limitation (Supplementary Figure 1). Taken together, the data show a constitutive induction of alternate electron flows in late subjective morning, possibly after cellular requirements for CH2O accumulation have been met or saturated during the initial period of rapid net oxygen evolution (Polerecky et al., 2021).
Finally, upon the onset of darkness, PSII centers open (increasing FM signal relative to Ft, Figures 3A,B), YII thereby increases (Figures 3C,D) and the potential for PSII-mediated electron transport fully recovers in the NO3– cultures or remains steady in the N2-fixing cultures (Figure 4C).
In agreement with 77 K fluorescence emission data showing a decrease in the PSI:PSII ratio during the light period (Supplementary Figures 2A,B), the maximal P700 level, Pm (normalized to Chl a), which is considered to be proportional to PSI abundance, decreases monotonically through the photoperiod in both the NO3– and N2-fixing cultures, (Figures 5A,B). As Chl a is associated with both PSII and PSI, a decrease in PSI abundance relative to Chl a suggests an increase in the PSII population, which is consistent with a decrease in quantum yields of non-photochemical energy dissipation in PSI due to donor side limitation, Y(ND) (data not shown). Since there are more PSI than PSII in the cells, the increase in PSII abundance must be more pronounced than the decrease in the (relative) PSI abundance. Thus, the opening of PSII reaction centers and upregulation of the linear electron flow to alternate electron sinks during the light phase (see Figure 4 and corresponding text) are accompanied by a concomitant increase in the PSII to PSI ratios and these processes take place in a concerted manner. Similar phenomena were found during the diel cycle of Crocosphaera watsonii WH8501 (Masuda et al., 2018), with a further inactivation of PSII in the dark (Rabouille and Claquin, 2016), and in greening Synechocyctis sp. 6803 (Barthel et al., 2013). The observed transition from State II back to State I later in the photoperiod (Figure 4) also supports an enhanced flux of electrons to alternate electron sinks. In accordance, again, with the 77 K fluorescence emission data (Supplementary Figures 2A,B), no significant difference is observed between the NO3– and N2-fixing culture.
Figure 5. Dynamics of relative PSI abundance during Cyanothece cultivation in ASP 2 medium supplemented with NO3– (A) and under obligate diazotrophy (B). Maximal P700 levels (Pm), which is proportional to PSI abundance was normalized to corresponding Chl a concentrations. Data represent averages from 3 replicates, with error bars representing standard deviations. An ANOVA with post hoc Tukey HSD test points to i/a significant difference between L0 and L14 samples in both cultures and ii/no significant difference between cultures.
Kinetics of electron transport processes through and around PSI were determined by P700 SP methods. PSI-mediated electron flow [ETR(I)] shows a characteristic daily pattern in both the NO3– and N2-fixing cultures (Figures 6A,B, respectively). An ANOVA with post hoc Tukey HSD test (n = 3 at each column) indicates that values do not differ significantly in statistical terms in the NO3– culture (Figure 6A), while L0 differs significantly from both L2 (p < 0.05) and L7 (p < 0.01) in the N2-fixing culture (Figure 6B). However, much stronger statistical differences appear in the dynamics of k, the rate constant for re-reduction of P700 by intersystem electrons after a flash. L0 significantly differs from all other time points in the NO3– culture and from L2 and L7 in the N2-fixing culture. There is an additional statistically significant difference between the NO3– and N2-fixing cultures at L14 = D0 (Figure 6B). Quantum yields of PSI [Y(I)] show very similar patterns (data not shown). ETR(I) and Y(I) are relatively low in both types of cultures at D0 (light to dark transition) and L0 (dark to light transition) and then show a gradual increase to a daily maximum during the light phase (L7). This increase is in fairly good correlation with the online records of the photobioreactors showing partial re-opening of PSII (Figure 3) and PSII functional data (Figure 4B) showing an acceleration of electron transport away from PSII. The increase is slower in the NO3– culture (values at L0 and L2 are almost the same) and faster in the N2-fixing culture. This suggests that the increase in ETR(I) is (directly or indirectly) related to the kinetics of O2 and pH (i.e. drawdown of the DIC pool), and possibly also State I to State II transition, which all show similar differences between NO3– and N2-fixing cultures (Figures 2A–D). Remarkably, the pH increase in the cultures results in a faster ETR(I) in chloroplasts (Tikhonov, 2013 and references therein), in good agreement with our finding. It was postulated that alkalization of stroma (in cyanobacteria: alkalization of cytoplasm) induces activation of the Bassham-Benson-Calvin cycle reactions, and, thereby, promotes efflux of electrons from PSI to NADPH+ (Tikhonov, 2013). Concomitantly, the increase in ETR(I) could also be directly related to the induction of CCM (i.e., cyclic electron transport around PSI and the NDH-1 complex for CO2 uptake, see Supplementary Figure 6 and text above), which could also explain the higher ETR(I) in N2-fixing culture (compared to NO3– culture) at L2, when N2-fixing culture is already DIC depleted, while NO3– culture still has some DIC (Figures 2E,F) available. A similar daily pattern of an increase from L0 to daily maximum (L7), was observed also in the rate of P700 re-reduction kinetics (Figures 6C,D) which show about a twofold increase in both the NO3– and N2-fixing cultures. Nevertheless, there are remarkable differences in kinetics between these two growth conditions: rate constants (k) of P700 re-reduction kinetics increase from 68 ± 13 s–1 to 147 ± 3 s–1 in NO3– culture but only from 49 ± 9 s–1 and 92 ± 4 s–1 in the N2-fixing culture. This, again, can partly be explained by a difference in external pH (Figures 2C,D) which was lower in the N2-fixing culture, and, therefore, implied slower P700 re-reduction kinetics (Tikhonov, 2013). Importantly, the observed increase in ETR(I) (Figures 6A,B), rate of P700 re-reduction kinetics (Figures 6C,D), and the State II to State I transition (Figure 4) during the light phase perfectly complement the re-opening of the PSII RCs and acceleration of τ showing again that all of these processes take place in a concerted manner.
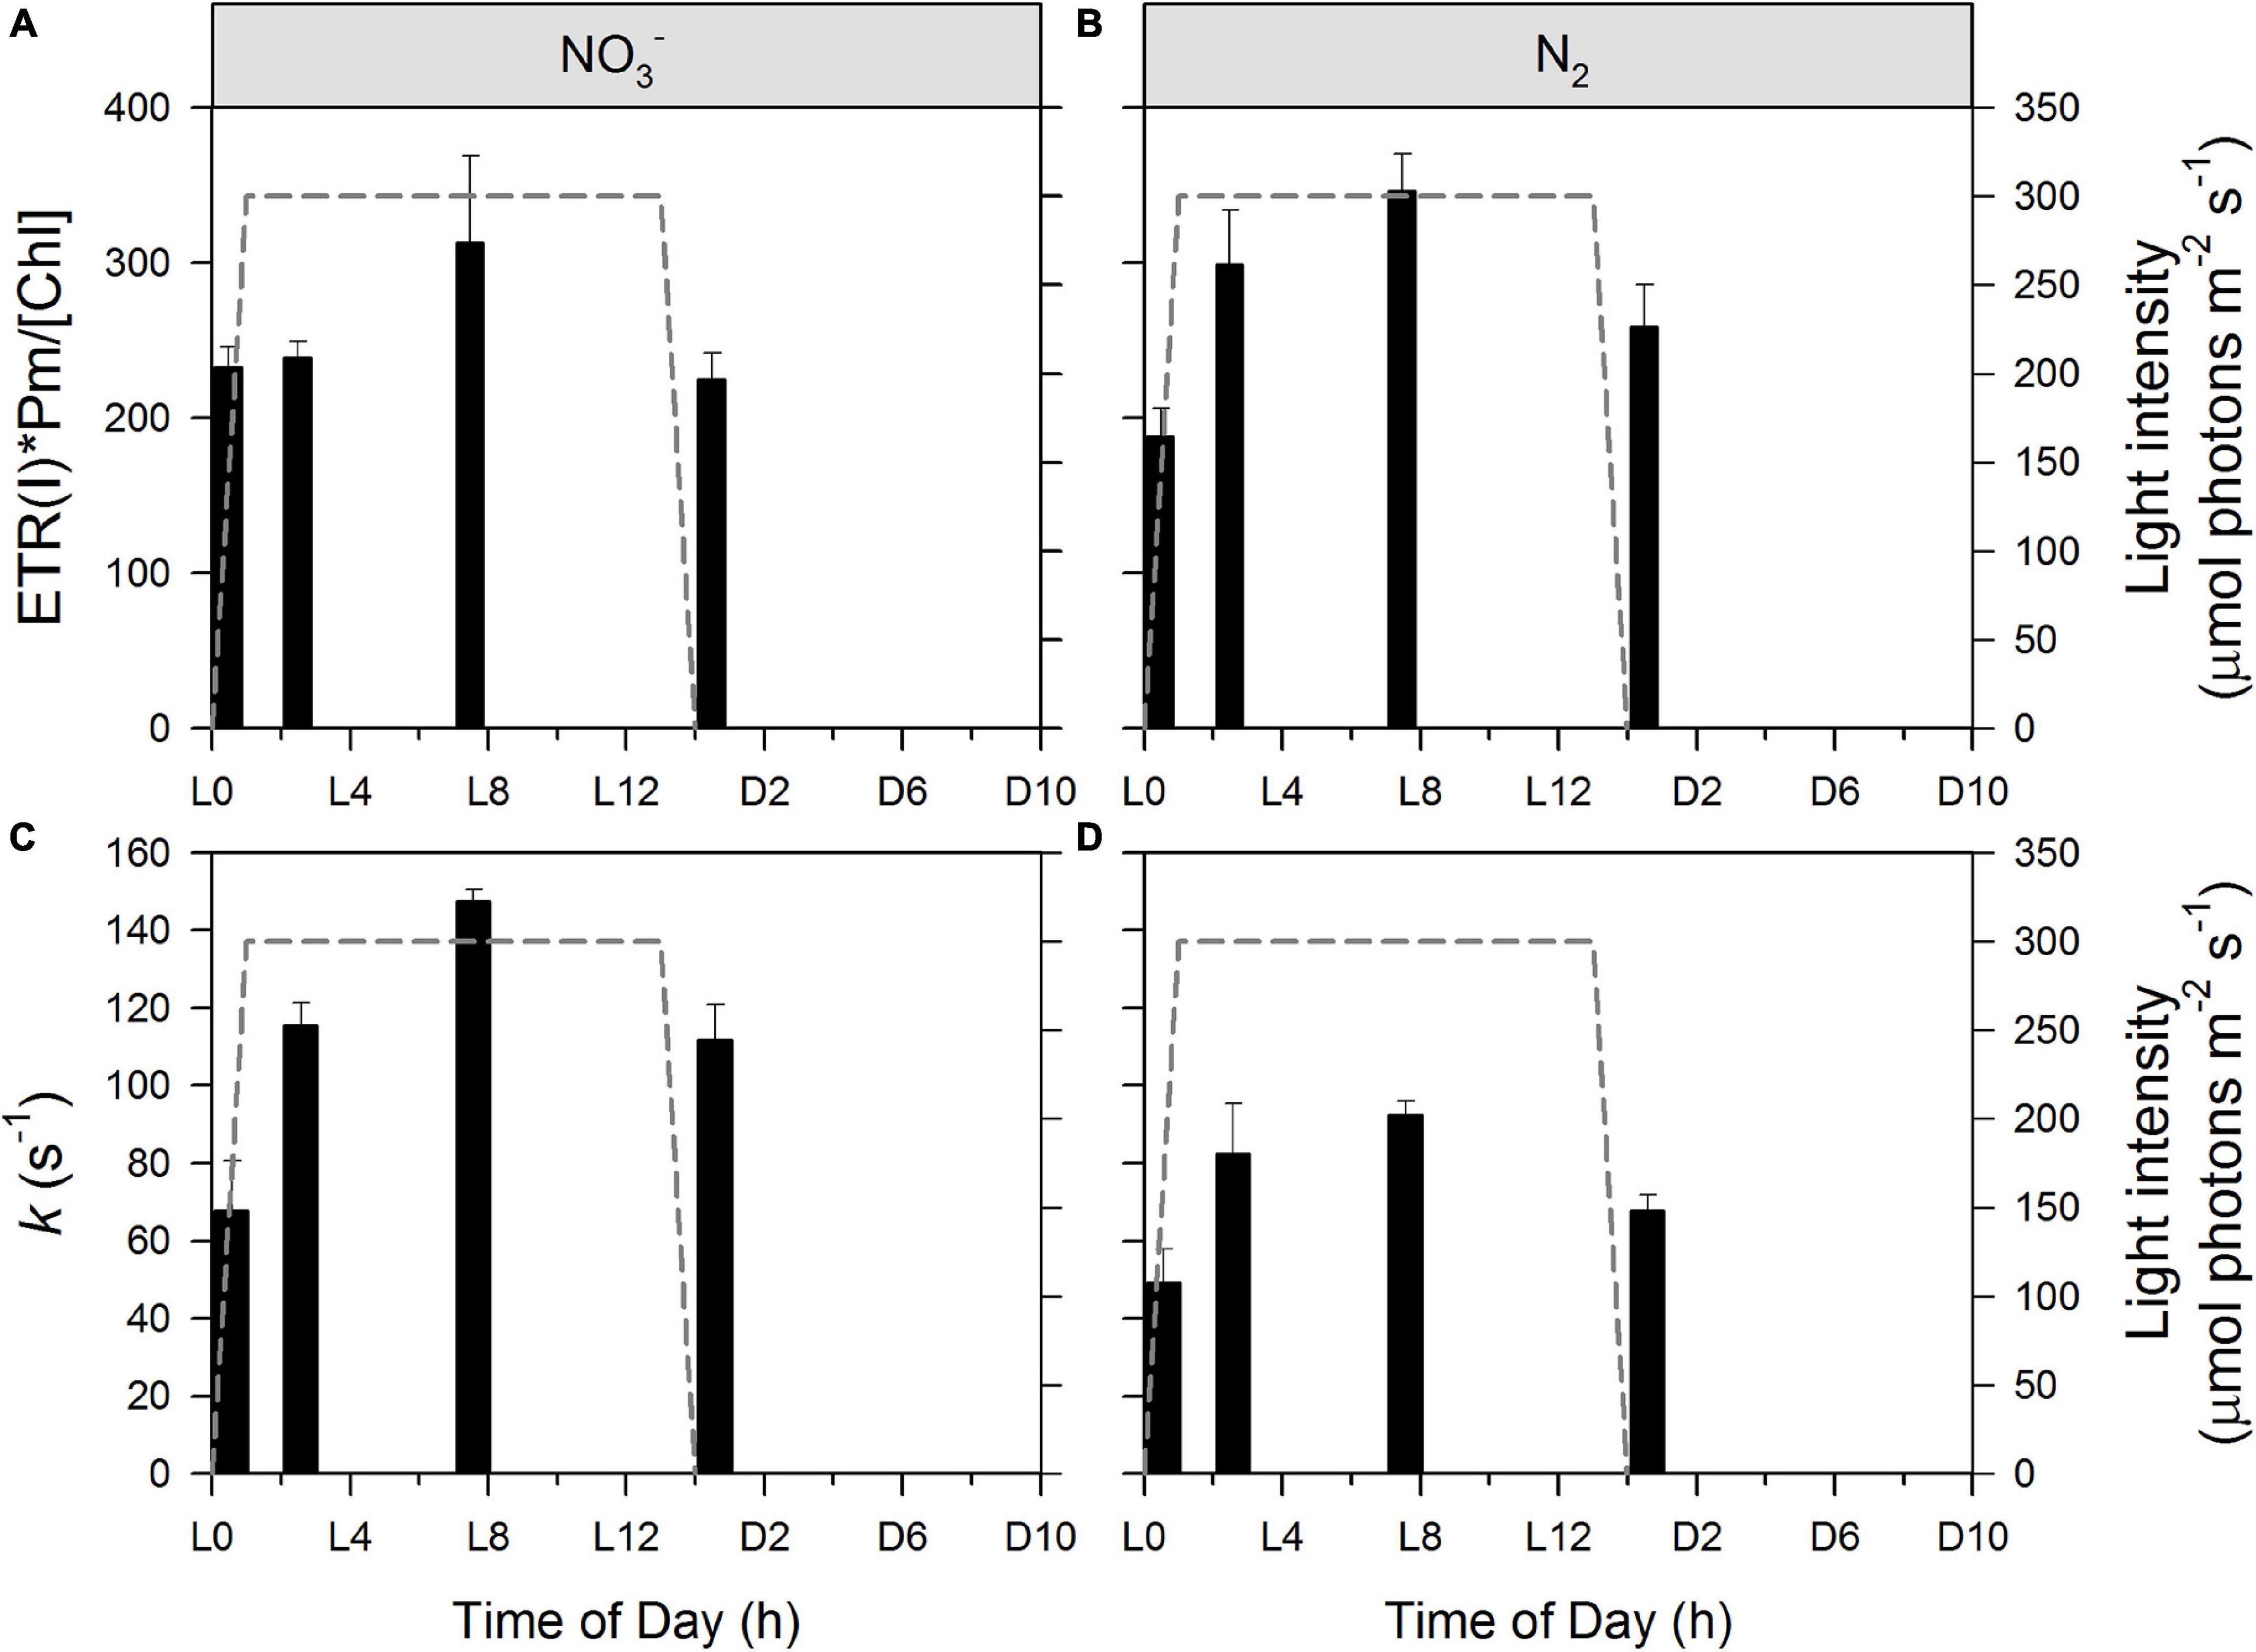
Figure 6. Dynamics of PSI-mediated electron flow [ETR(I)] during Cyanothece cultivation in ASP 2 medium supplemented with NO3– (A,C) and under obligate diazotrophy (B,D). Raw ETR(I) values were normalized according to Pm values and Chl a concentration (A,B). k represents the rate constant for re-reduction of P700 by intersystem electrons after a flash (C,D). Data represent averages from 3 replicates, with error bars representing standard deviations.
NAD(P)H is a reducing agent and an essential electron donor in all organisms. The rate at which it regenerates from its oxidized form (NAD(P)+) can therefore constitute a limiting factor in different biosynthetic pathways. The bioenergetic costs of diazotrophic (N2) growth versus reductive assimilation of NO3– in Cyanothece show a major difference in ATP vs. NAD(P)H demand of the NO3– and diazotrophic (N2) cultures, due to the high electron demand of NO3– uptake (8 + 2 e–/N) relative to N2 reduction (1—2 e–/N) (see also Introduction). Hence, remarkably higher NAD(P)H/ATP ratios are needed in the NO3– cultures as compared to diazotrophic (N2) cultures, and this higher demand for reductant must have a major influence on electron transport and NAD(P)H dynamics as well. High rates of electron transport to O2 via the photosynthetic electron transport chain (e.g., Mehler reaction, photorespiration, flavodiiron protein-dependent O2 uptake; Supplementary Figure 5) lead to an increased reduction of the PQ-pool, which, in turn, triggers a transition towards State II (Figure 4). The lower respiratory activity and accompanying high accumulation of carbohydrates during the light period in the N2-fixing culture (Tables 1, 2 and Supplementary Figure 5) are in good agreement with both the lower overall demand for reductants and the high nocturnal energy demand related to dark N2-fixation in this culture. These differences in the demand for reductants and consequently in respiratory electron fluxes, are also shown in the post-illumination pattern of the Chl a fluorescence. A significant post-illumination reduction of the PQ pool is seen in the NO3– culture during its photoperiod (Figure 7A, L2 and L7 at 80s). In contrast, this post-illumination fluorescence transient is much smaller in the corresponding D0 (= L14) sample and is completely absent in all records of the diazotrophic (N2) culture (Figures 7A,B).
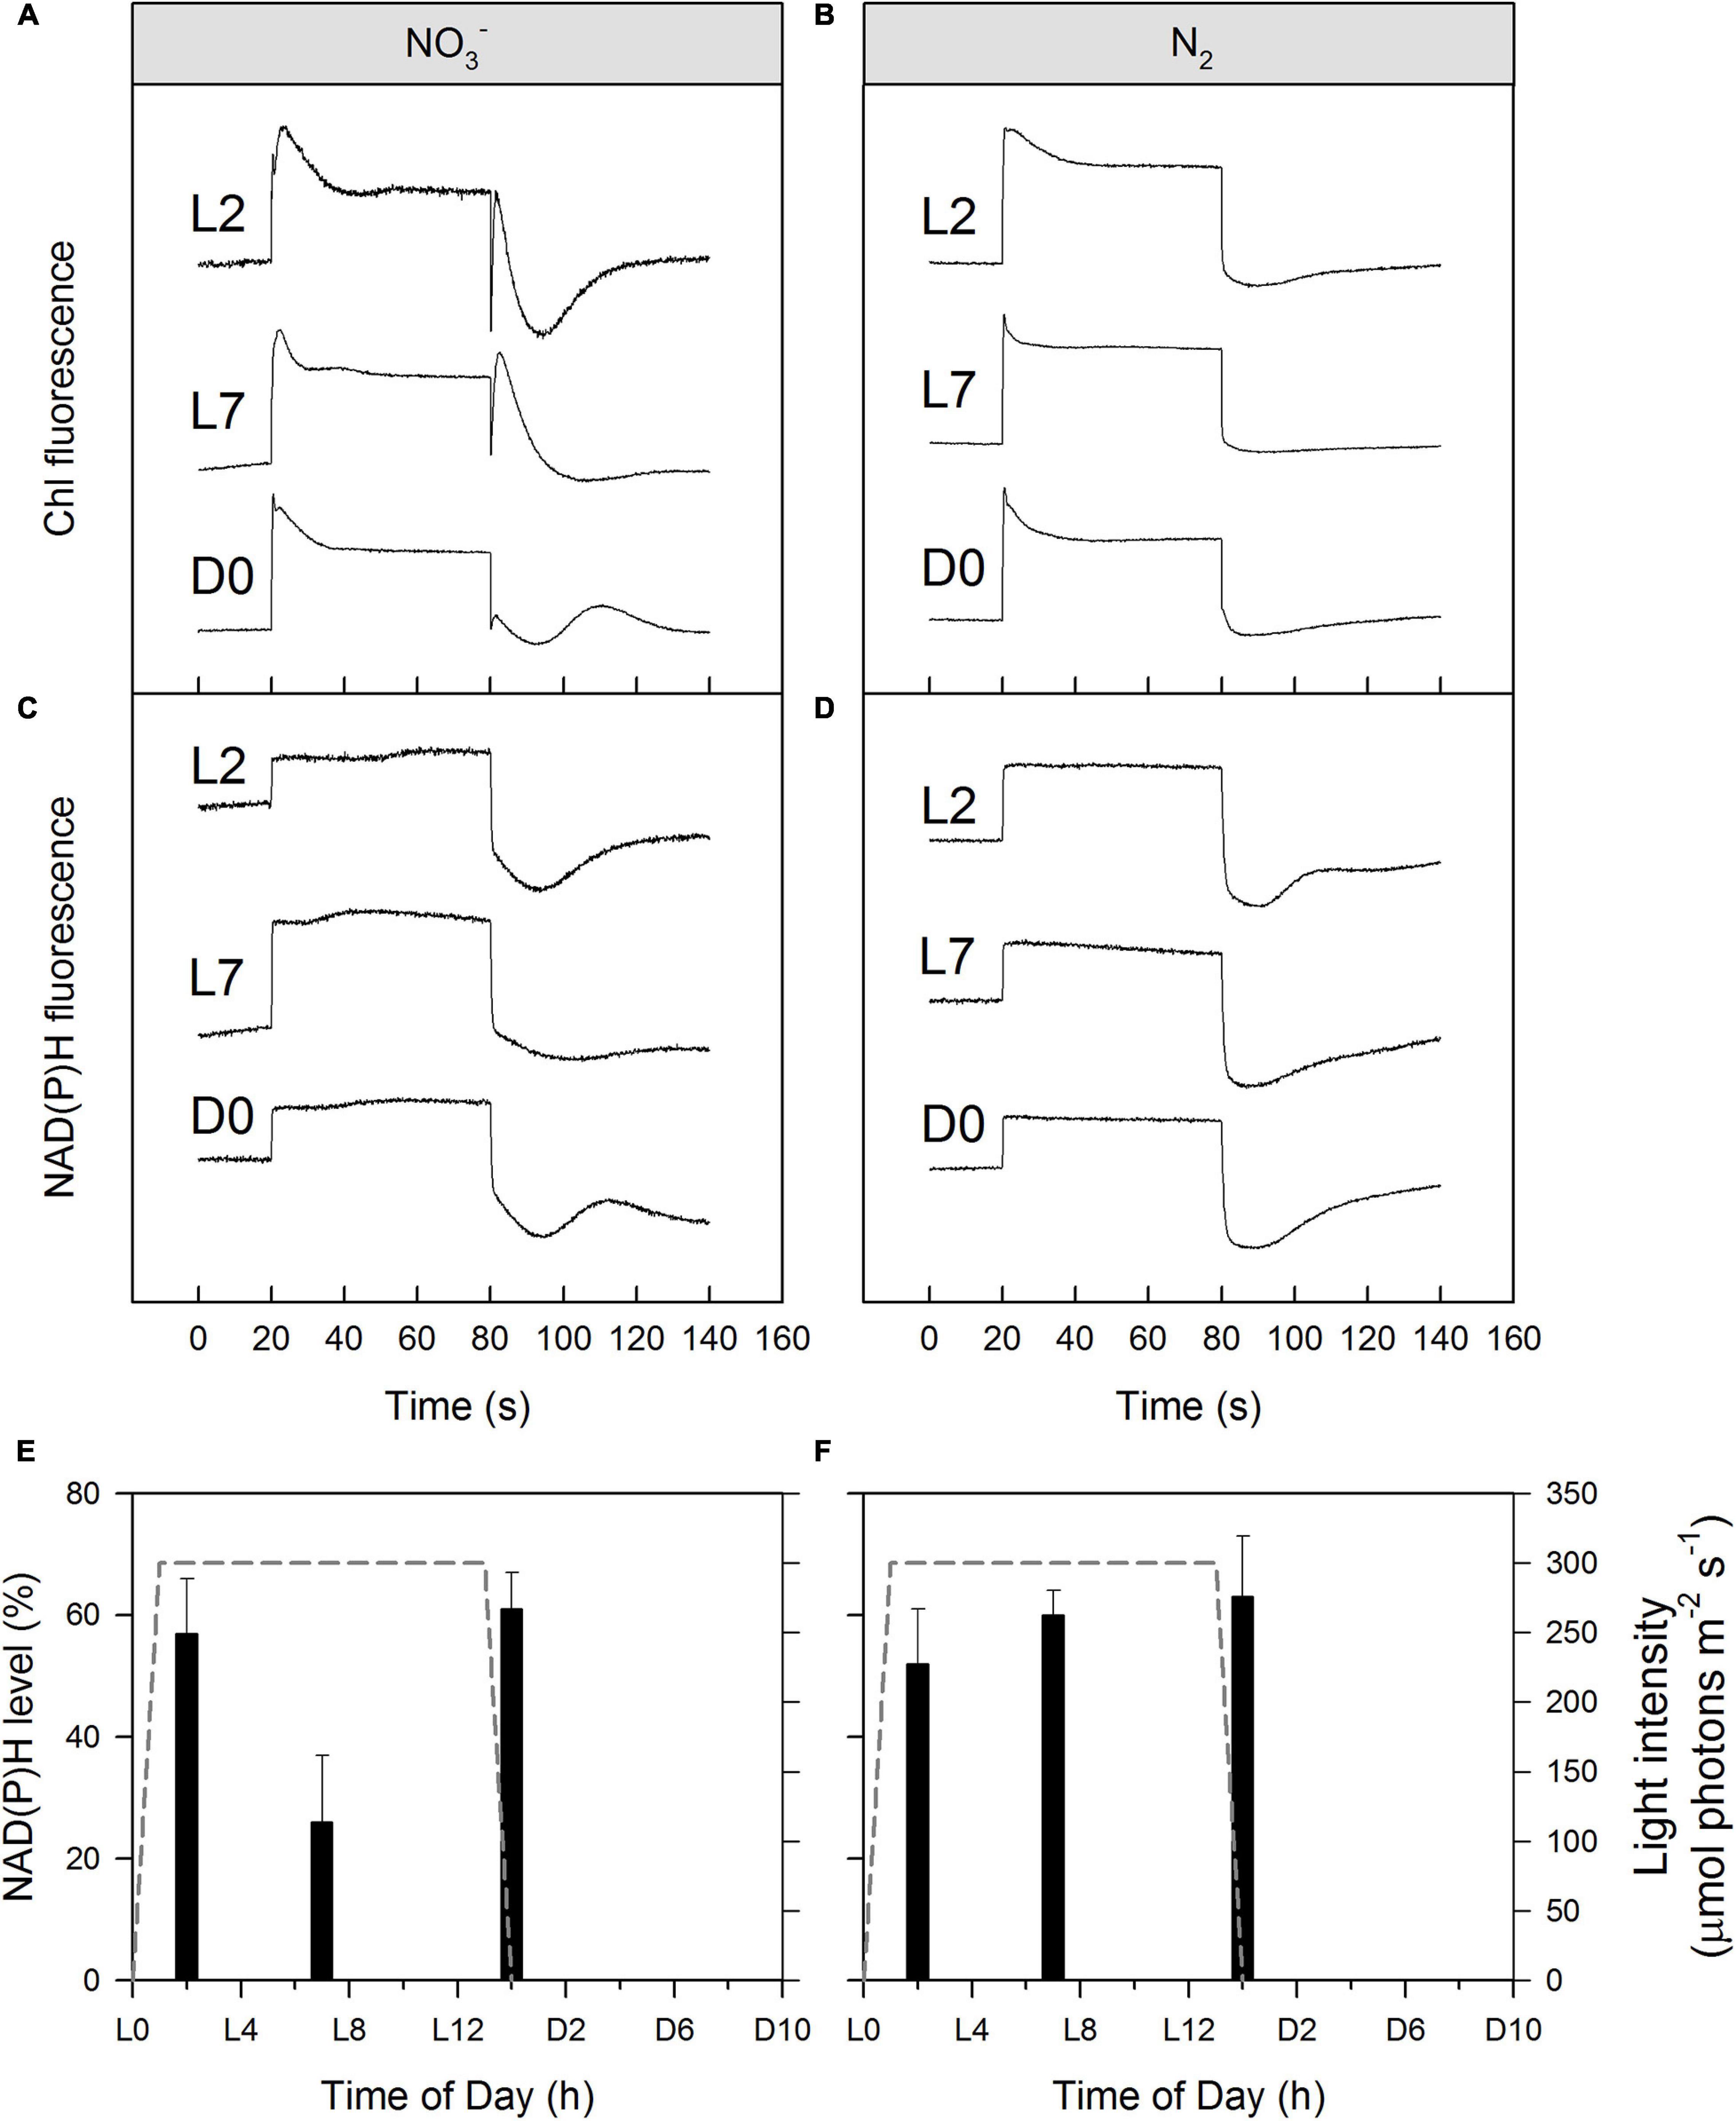
Figure 7. Simultaneously recorded Chl a (A,B) and NAD(P)H fluorescence (C,D) induction curves (with recovery) of Cyanothece cultures during/after the light phase as well as corresponding calculated NAD(P)H levels as a percentage of the entire NAD(P)H:NADP+ pool in darkness (E,F). Cultures were nitrate-rich (A,C,E) or under obligate diazotrophic conditions (B,D,F). Panels (A–D) show typical induction curves, while data on panels (E,F) represent averages from 3 to 4 replicates, with error bars representing standard deviations. For more details, see Materials and Methods.
Regarding NAD(P)H/NAD(P)+ redox levels, in most of the NO3– and N2-fixing culture samples we observed about 50–60% reduction in the dark-adapted samples (Figures 7C–F), in good agreement with the literature range (Kauny and Sétif, 2014). However, in the midday (L7) NO3– cultures (Figures 7C,E, 7 h) the NAD(P)H/NAD(P)+ redox level was only 26 ± 11% indicating an enhanced NAD(P)H consumption in these samples, again, in accordance with the high e– demand of NO3– to NH4+ reduction (see above) and with our hypothesized opening of alternate electron sinks upon drawdown of the DIC pool.
Growth Budgets
The transient storage of reducing potential as carbohydrate imposes additional losses compared to a hypothetical N2 assimilation directly driven by photosynthetic electron transport. Fueling N2-fixation at night requires first prior carbon fixation (equations 3 and 4) and then carbohydrate re-oxidation (equation 8) through aerobic respiration (equation 9), to produce both the ATP and reducing power needed to fix N2.
The electrons produced by carbohydrate re-oxidation in the dark must be partitioned between ATP generation, or biosynthetic reductions, as for example:
The fixation of one mole of N thus requires 1 CH2O worth of biosynthetic reductant (4e–) and 1.33 CH2O (6e–) worth of reductant for the respiratory regeneration of the required ∼ 8 ATP, so in total the equivalent of ∼2.33 stored CH2O, a slightly higher estimate than provided by Großkopf and LaRoche (2012), who counted a requirement of 3e– for N2-fixation and the equivalent 1.33 CH2O to generate the required 8 ATP. Following up the stoichiometric analyses presented in the introduction, for a cell with C7:N1 ratio growing diazotrophically with CO2 fixation in the light period and N fixation in the dark period at the expense of previously stored carbohydrate:
Light period:
Dark period:
Overall the cells using N2-fixation thus incur a daily cost of 38 e– + 38 ATP per assimilation of C7:N1. In contrast, as outlined in the Introduction a cell with a C:N-ratio of 7:1, growing upon NO3– with direct photosynthetic generation of biomass implies an allocation of 38 e– and 30 ATP overall (Figure 8). This opportunity cost of ∼8 additional ATP for offsetting dark N2-fixation from light CO2 fixation thereby contributes to the lower growth rate we observed in the N2-fixing cultures. In the end, this would imply a 8/30 = 27% increase in diel ATP costs for diazotrophic growth. Although overly simplistic, this analysis is in good agreement with the achieved diel growth rates of μNO3 = 0.312 d–1 vs. μN2 = 0.216 d–1, which point to a 31% drop in the overall growth efficiency under diazotrophy. That is, the observed difference in the net growth rate matches the direct penalty to grow on N2-fixation. Yet, the energy needed to synthesize the nitrogenase enzyme and the enhanced respiration required to lower oxygen concentration within cells impose additional costs that could further affect the growth efficiency. Because the resultant, net growth in the N2-fixing cultures wasn’t impacted any further, we deduce that the larger carbon reserves accumulated in the N2-fixing cultures were sufficient to cover all the indirect costs. It is very likely that, had cultures been grown under replete CO2, the N2-fixing cells would have accumulated more reserves, thus possibly allowing a better coverage of the direct costs of N2-fixation as well. As stressed by Großkopf and LaRoche (2012), the energetic investment associated with assimilatory NO3– reduction and N2-fixation (when considering the direct costs only) can come rather close, and depend on the respiration efficiency (ATP generated per CH2O respired).
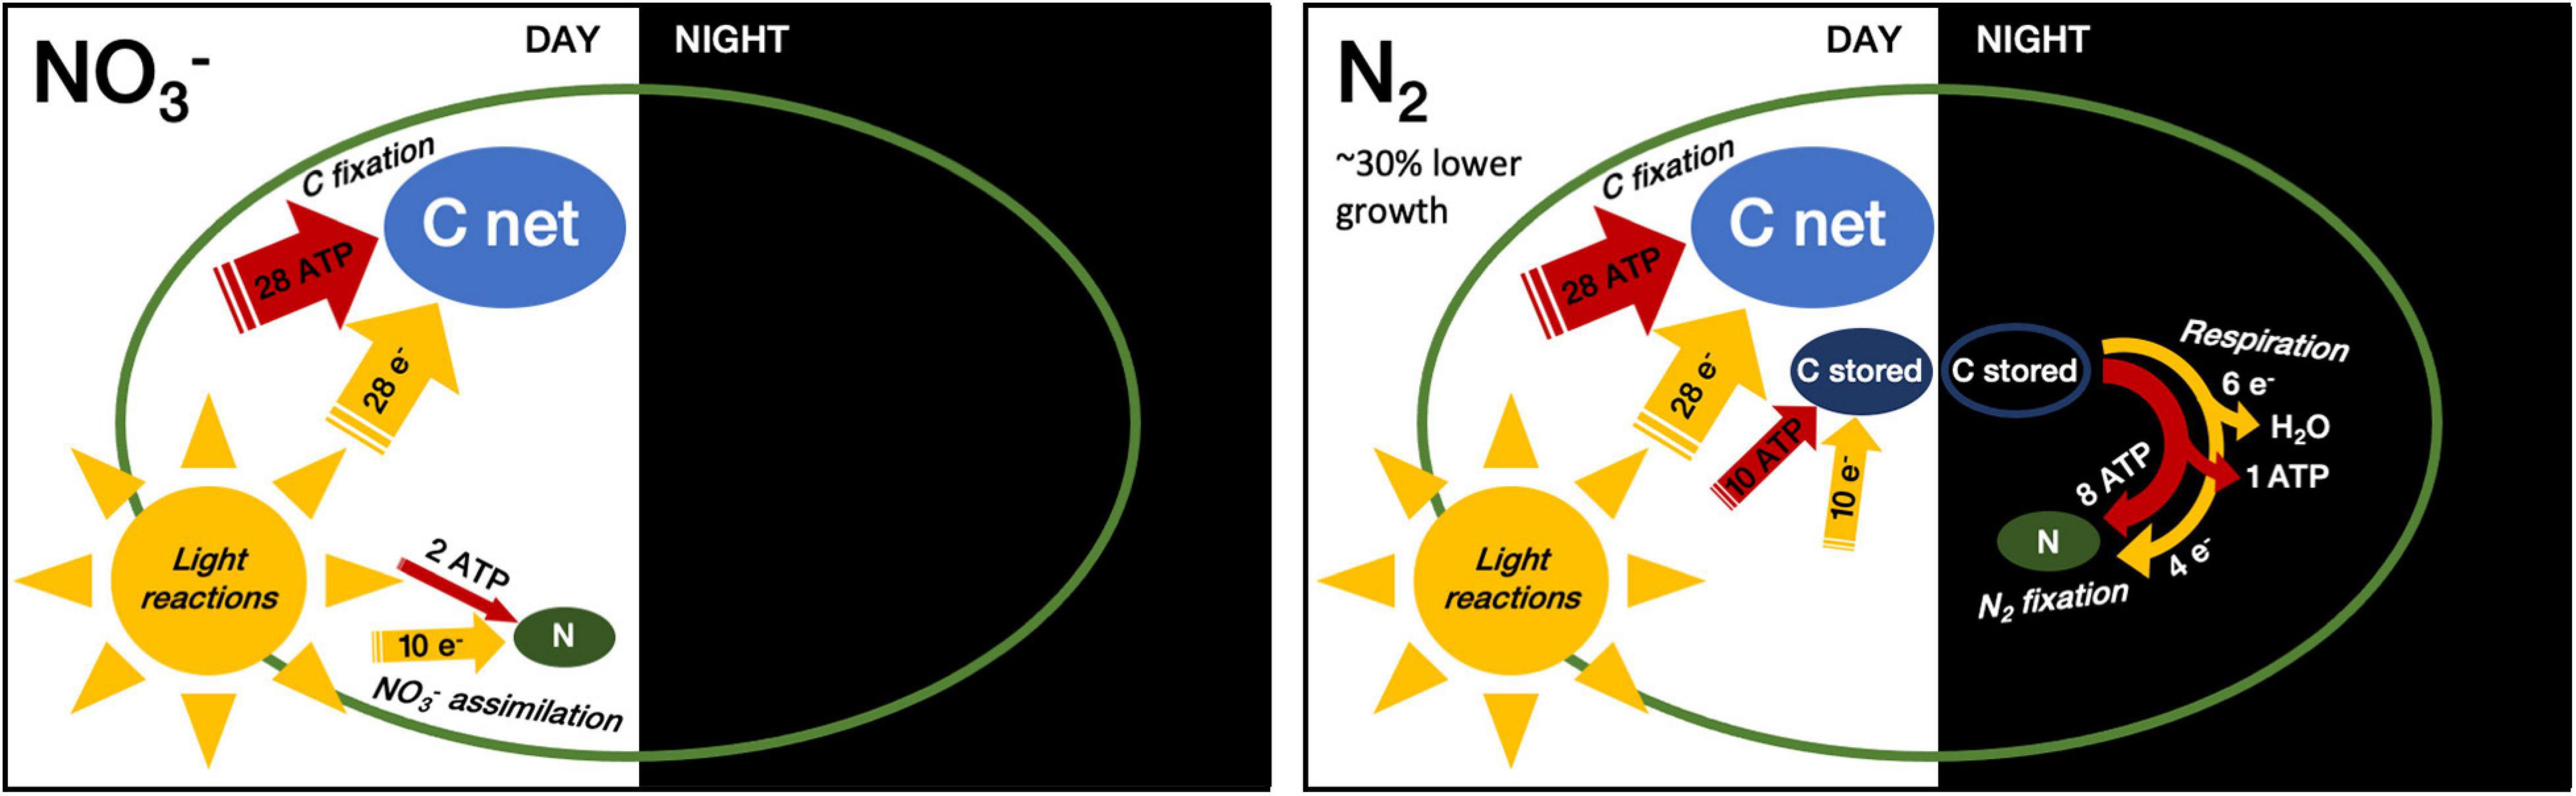
Figure 8. Relative consumption of energy equivalents by C and N assimilation in NO3– consuming vs. N2 fixing cells. Width of arrows and size of pools reflect approximate relative amounts of energy equivalents (ATP and reducing equivalents) and pool sizes (C net, C stored and N) per mole of assimilated N. This figure compares direct assimilation costs for C and N, ignoring basal respiration as well as indirect costs such as those for daily de novo synthesis of nitrogenase. While carbohydrate accumulation occurs in both N conditions, N2-fixation requires the build-up of an additional, transient C pool (C stored) that is respired to fuel N2-fixation during the following night.
Conclusion
When grown on NO3–, Cyanothece uses the photoperiod for simultaneous, reductive assimilation of both CO2 and NO3– with an overall metabolic e–:ATP stoichiometry requirement close to the predicted output of linear photosynthetic electron transport. In this mode, direct reductive NO3– assimilation competes with inorganic carbon assimilation for photosynthetic reductant, which slows the drawdown of the DIC pool in our turbidostat experiments. The subsequent dark phase is then a period of maintenance respiration and synthesis of cell components like Chl a, and proteins (Polerecky et al., 2021). In marked contrast, Cyanothece grown in obligate diazotrophy does not take up nitrogen in the light and therefore can funnel more photosynthetic reductant to CO2 assimilation, thereby accumulating a larger stock of refractile carbohydrate, a necessity to subsequently support the e–:ATP requirements of N2-fixation during the succeeding dark period. Consequent to the higher rate of carbon fixation in the early light is a more rapid depletion of available DIC, explaining why DIC becomes limiting earlier in the day in the N2-fixing cultures. In the early dark period, a high respiration rate engages to fuel N2-fixation; later on in the dark, and despite still available carbohydrate reserves, Cyanothece reverts to a dark maintenance mode similar to that observed in the NO3– cultures.
In our experiments, Cyanothece achieves higher overall growth rates under NO3–. When grown in obligate diazotrophy, cells face the double burden of a more ATP-demanding, N-acquisition mode and the additional losses imposed by the transient storage of reducing potential as carbohydrate, compared to a hypothetical N2 assimilation directly driven by photosynthetic electron transport. Further, this energetic burden imposed by N2-fixation could not be alleviated, despite the high irradiance level within the cultures, because photosynthesis was limited by the availability of DIC. A relaxation of DIC limitation in the bioreactors might allow N2-fixing Cyanothece to accelerate towards the growth rate of NO3– Cyanothece, by unleashing a higher carbon fixation potential in the light when growing diazotrophically. But, bearing in mind that the capacity of cells to store reserves is also sterically limited (Talmy et al., 2014), whether saturating light and DIC levels could allow the obligate diazotroph to match the growth rates of the nitrate-grown Cyanothece still has to be demonstrated.
The higher instantaneous carbon fixation rates, consequent to the temporal decoupling between carbon and nitrogen acquisition under diazotrophy, probably constitute a competitive advantage in the natural environment, given the known, high storage capacity of unicellular diazotrophic cyanobacteria. Yet, as DIC limitation exacerbates the costs on growth imposed by N2-fixation, the competitive efficiency of such diazotrophs could be hindered in areas with insufficient renewal of dissolved gases and/or with intense phytoplankton biomass that both decrease available light energy and draw the DIC level down, like lakes and the coastal ocean during bloom periods. As progress is made in the automation of in situ instruments, the future literature shall inform on a closer monitoring of DIC availability at the diel scale and finer spatial scales that will reveal the likelihood and frequency of DIC limitation in coastal environments, for a better understanding of cyanobacterial dominance.
Lastly, this study also stresses how important it is to carefully monitor culture experiments. Undesired limitations or differences can easily and surreptitiously introduce a bias in the experiment and lead to potentially erroneous results. A difference in light level will occur in the culture as soon as either the control or treatment starts to get denser than the other. Light then becomes a co-limitation factor with differential impact on the cultures, leading to a distorted observation of the initially targeted, physiological response. DIC limitation is also a potential source of biases in culture experiments and our present results also serve to illustrate how much that can affect both immediate (e.g. photosynthesis) and temporally de-coupled (e.g. N2-fixation) processes and the overall growth response.
Data Availability Statement
The raw data supporting the conclusions of this article will be made available by the authors, without undue reservation.
Author Contributions
The experimental part of this study was conducted during the 10th Group for Aquatic Productivity (GAP) workshop in August 2017 organized by OP. SR, TM, DC, KH, JČ, and OP designed the study. All authors contributed to sampling, samples analyses and data interpretation. SR and DC drafted the manuscript and all authors provided input during writing of the manuscript.
Funding
SR acknowledges support from the LEFE-INSU funding program. DC was supported by Mobility project: CZ.02.2.69/0.0/0.0/16_027/0007990, international mobility of researchers of the Institute of Microbiology of the CAS. TM and OP were supported by the Czech science foundation (GACR 20-17627S). The work of GB was partly supported by the National Research, Development and Innovation Office of Hungary, NKFIH, grant No. K 128950. JČ and TZ were supported by the Ministry of Education, Youth and Sports of the Czech Republic (OP RDE grant number CZ.02.1.01/0.0/0.0/16–026/0008413 ’Strategic Partnership for Environmental Technologies and Energy Production’) and by the Czech Science Foundation (GA CR, grant number 19-00973S). SS was supported by ILES (Illuminating Lake Ecosystem), a project funded through the Leibniz Competition (SAW-2015-IGB-1). AL was supported by FAPESP Grant No. 2017/12450-1. JB-B was supported by the National Council for Scientific and Technological Development (CNPq, proc. n.304122/2017-3).
Conflict of Interest
The authors declare that the research was conducted in the absence of any commercial or financial relationships that could be construed as a potential conflict of interest.
Acknowledgments
This work results from the Group for Aquatic Photosynthesis (GAP) workshop held in Třeboň, Czech Republic, in August 2017 and subsequent discussions. We are thankful to Erika Weiz-Bersch for her help with DIC measurements. We are also very thankful to the reviewers who evaluated this work. Their thorough reading and extremely constructive comments was very inspiring to produce a more didactic, final version of this manuscript.
Supplementary Material
The Supplementary Material for this article can be found online at: https://www.frontiersin.org/articles/10.3389/fmicb.2021.617802/full#supplementary-material
References
Agawin, N. S. R., Rabouille, S., Veldhuis, M. J. W., Servatius, L., Hol, S., Van Overzee, H. M. J., et al. (2007). Competition and facilitation between unicellular nitrogen-fixing cyanobacteria and non-nitrogen-fixing phytoplankton species. Limnol. Oceanogr. 52, 2233–2248. doi: 10.4319/lo.2007.52.5.2233
Aryal, U. K., Ding, Z., Hedrick, V., Sobreira, T. J. P., Kihara, D., and Sherman, L. A. (2018). Analysis of protein complexes in the unicellular cyanobacterium Cyanothece ATCC 51142. J. Proteome Res. 17, 3628–3643.
Badger, M. R., and Price, G. D. (2003). CO2 concentrating mechanisms in cyanobacteria: molecular components, their diversity and evolution. J. Exp. Bot. 54, 609–622. doi: 10.1093/jxb/erg076
Badger, M. R., Andrews, T. J., Whitney, S. M., Ludwig, M., Yellowlees, D. C., Leggat, W., et al. (1998). The diversity and coevolution of Rubisco, plastids, pyrenoids, and chloroplast-based CO2-concentrating mechanisms in algae. Can. J. Bot. 76, 1052–1071. doi: 10.1139/cjb-76-6-1052
Badger, M. R., Price, G. D., Long, B. M., and Woodger, F. J. (2006). The environmental plasticity and ecological genomics of the cyanobacterial CO2 concentrating mechanism. J. Exp. Bot. 57, 249–265. doi: 10.1093/jxb/eri286
Bandyopadhyay, A., Elvitigala, T., Liberton, M., and Pakrasi, H. B. (2013). Variations in the rhythms of respiration and nitrogen fixation in members of the unicellular diazotrophic cyanobacterial genus Cyanothece. Plant Physiol. 161, 1334–1346. doi: 10.1104/pp.112.208231
Barthel, S., Bernát, G., Rupprecht, E., Kahmann, U., and Schneider, D. (2013). Thylakoid membrane maturation and PS II activation are linked in greening Synechocystis sp. PCC 6803 cells. Plant Physiol. 163, 1037–1046. doi: 10.1104/pp.113.224428
Bergman, B., Gallon, J., Rai, A., and Stal, L. (1997). N2 Fixation by non-heterocystous cyanobacteria. FEMS Microbiol. Rev. 19, 139–185. doi: 10.1016/s0168-6445(96)00028-9
Bernát, G., and Rögner, M. (2011). “Center of the cyanobacterial electron transport network: the cytochrome b6f complex,” in Bioenergetic Processes of Cyanobacteria: From Evolutionary Singularity to Ecological Diversity, eds G. A. Peschek, C. Obinger, and G. Renger (Dordrecht: Springer), 573–606. doi: 10.1007/978-94-007-0388-9_20
Brauer, V., Stomp, M., Rosso, C., van Beusekom, S. A. M., Emmerich, B., Stal, L. J., et al. (2013). Low temperature delays timing and enhances the cost of nitrogen fixation in the unicellular cyanobacterium Cyanothece. ISME J. 7, 2105–2115. doi: 10.1038/ismej.2013.103
Červený, J., and Nedbal, L. (2009). Metabolic rhythms of the cyanobacterium Cyanothece sp. ATCC 51142 correlate with modeled dynamics of circadian clock. J. Biol. Rhythms 24, 295–303. doi: 10.1177/0748730409338367
Červený, J., Šetlík, I., Trtílek, M., and Nedbal, L. (2009). Photobioreactor for cultivation and real-time, in-situ measurement of O2 and CO2 exchange rates, growth dynamics, and of chlorophyll fluorescence emission of photoautotrophic microorganisms. Eng. Life Sci. 9, 247–253. doi: 10.1002/elsc.200800123
Cólon-López, M. S., Sherman, D. M., and Sherman, L. A. (1997). Transcriptional and translational regulation of nitrogenase in light- dark- and continuous-light-grown cultures of the unicellular cyanobacterium Cyanothece sp. strain ATCC 51142. J. Bacteriol. 179, 4319–4327. doi: 10.1128/jb.179.13.4319-4327.1997
Deng, X., Hu, Z.-A., Wang, H.-X., Wen, X.-G. and Kuang, T.-Y. (2003). A comparison of photosynthetic apparatus of the detached leaves of the resurrection plant Boea hygrometrica with its non-tolerant relative Chirita heterotrichia in response to dehydration and rehydration. Plant Sci. 165, 851–861. doi: 10.1016/S0168-9452(03)00284-X
Deschamps, P., Colleoni, C., Nakamura, Y., Suzuki, E., Putaux, J. L., Buléon, A., et al. (2008). Metabolic symbiosis and the birth of the plant kingdom. Mol. Biol. Evol. 25, 536–548. doi: 10.1093/molbev/msm280
Dron, A., Rabouille, S., Claquin, P., Talec, A., Raimbault, V., and Sciandra, A. (2013). Photoperiod length paces the temporal orchestration of cell cycle and carbon-nitrogen metabolism in Crocosphaera watsonii. Environ. Microbiol. 15, 3292–3304. doi: 10.1111/1462-2920.12163
Eichner, M., Rost, B., and Kranz, S. A. (2014). Diversity of ocean acidification effects on marine N2 fixers. J. Exp. Mar. Biol. Ecol. 457, 199–207. doi: 10.1016/j.jembe.2014.04.015
Falkowski, P. G., and Raven, J. A. (2007). Aquatic Photosynthesis, 2nd Edn. Princeton, NJ: Princeton University Press.
Fay, P. (1992). Oxygen relations of nitrogen-fixation in Cyanobacteria. Microbiol. Rev. 56, 340–373. doi: 10.1128/mr.56.2.340-373.1992
Flores, E., Frías, J. E., Rubio, L. M., and Herrero, A. (2005). Photosynthetic nitrate assimilation in cyanobacteria. Photosynth. Res. 83, 117–133. doi: 10.1007/s11120-004-5830-9
Fogel, M., Cifuentes, L., Velinsky, D., and Sharp, J. H. (1992). Relationship of carbon availability in estuarine phytoplankton to isotopic composition. Mar. Ecol. Prog. Ser. 82, 291–300. doi: 10.3354/meps082291
Gallon, J. R. (1992). Reconciling the incompatible – N2 fixation and O2. New Phytol. 122, 571–609. doi: 10.1111/j.1469-8137.1992.tb00087.x
Garcia, N., Fu, F.-X., and Hutchins, D. (2013). Colimitation of the unicellular photosynthetic diazotroph Crocosphaera watsonii by phosphorus, light, and carbon dioxide. Limnol. Oceanogr. 58, 1501–1512. doi: 10.4319/lo.2013.58.4.1501
Grimaud, G. M., Rabouille, S., Dron, A., Sciandra, A., and Bernard, O. (2014). Modelling the dynamics of carbon-nitrogen metabolism in the unicellular diazotrophic cyanobacterium Crocosphaera watsonii WH8501, under variable light regimes. Ecol. Model. 291, 121–133. doi: 10.1016/j.ecolmodel.2014.07.016
Großkopf, T., and LaRoche, J. (2012). Direct and indirect costs of dinitrogen fixation in Crocosphaera watsonii WH8501 and possible implications for the nitrogen cycle. Front. Microbiol. 3:236. doi: 10.3389/fmicb.2012.00236
Hansen, P., Lundholm, N., and Rost, B. (2007). Growth limitation in marine red-tide dinoflagellates: effects of pH versus inorganic carbon availability. Mar. Ecol. Prog. Ser. 334, 63–71. doi: 10.3354/meps334063
Kauny, J., and Sétif, P. (2014). NADPH fluorescence in the cyanobacterium Synechocystis sp. PCC 6803: a versatile probe for in vivo measurements of rates, yields and pools. Biochim. Biophys. Acta 1837, 792–801. doi: 10.1016/j.bbabio.2014.01.009
Kirilovsky, D. (2015). Modulating energy arriving at photochemical reaction centers: orange carotenoid protein-related photoprotection and state transitions. Photosynth. Res. 126, 3–17. doi: 10.1007/s11120-014-0031-7
Kolber, Z. S., Prášil, O., and Falkowski, P. G. (1998). Measurements of variable chlorophyll fluorescence using fast repetition rate techniques: defining methodology and experimental protocols. Biochim. Biophys. Acta 1367, 88–106. doi: 10.1016/s0005-2728(98)00135-2
Kragh, T., and Sand-Jensen, K. (2018). Carbon limitation of lake productivity. Proc. Biol. Sci. 285:20181415. doi: 10.1098/rspb.2018.1415
Kramer, D. M., and Evans, J. R. (2011). The importance of energy balance in improving photosynthetic productivity. Plant Physiol. 155, 70–78. doi: 10.1104/pp.110.166652
León, C., Kumazawa, S., and Mitsui, A. (1986). Cyclic appearance of aerobic nitrogenase activity during synchronous growth of unicellular cyanobacteria. Curr. Microbiol. 13, 149–153. doi: 10.1007/bf01568510
Lu, J., Zhu, B., Struewing, I., Xu, N., and Duan, S. (2019). Nitrogen–phosphorus-associated metabolic activities during the development of a cyanobacterial bloom revealed by metatranscriptomics. Sci. Rep. 9:2480.
Luo, Y. W., Shi, D., Kranz, S. A., Hopkinson, B. M., Hong, H., Shen, R., et al. (2019). Reduced nitrogenase efficiency dominates response of the globally important nitrogen fixer Trichodesmium to ocean acidification. Nat. Commun. 10:1512.
Mareš, J., Johansen, J. R., Hauer, T., Zima, J., Ventura, S., Cuzman, O., et al. (2019). Taxonomic resolution of the genus Cyanothece (Chroococcales, Cyanobacteria), with a treatment on Gloeothece and three new genera, Crocosphaera, Rippkaea, and Zehria. J. Phycol. 55, 578–610.
Marques da Silva, J., Cruz, S., and Cartaxana, P. (2017). Inorganic carbon availability in benthic diatom communities: photosynthesis and migration. Phil. Trans. R Soc. B 372:20160398. doi: 10.1098/rstb.2016.0398
Masuda, T., Bernát, G., Bečková, M., Kotabová, E., Lawrenz, E., Lukeš, M., et al. (2018). Diel regulation of photosynthetic activity in the oceanic unicellular diazotrophic cyanobacterium Crocosphaera watsonii WH8501. Environ. Microbiol. 20, 546–560. doi: 10.1111/1462-2920.13963
Meunier, P. C., Colon-lopez, M. S., and Sherman, L. A. (1997). Temporal changes in state transitions and photosystem organization in the unicellular, diazotrophic cyanobacterium Cyanothece sp. ATCC 51142. Plant Physiol. 115, 991–1000. doi: 10.1104/pp.115.3.991
Meunier, P. C., Colon-Lopez, M. S., and Sherman, L. A. (1998). Photosystem II cyclic heterogeneity and photoactivation in the diazotrophic, unicellular cyanobacterium Cyanothece species ATCC 51142. Plant Physiol. 116, 1551–1562. doi: 10.1104/pp.116.4.1551
Nedbal, L., Červený, J., Keren, N., and Kaplan, A. (2010). Experimental validation of a nonequilibrium model of CO2 fluxes between gas, liquid medium, and algae in a flat-panel photobioreactor. J. Ind. Microbiol. Biotechnol. 37, 1319–1326. doi: 10.1007/s10295-010-0876-5
O’Neil, J. M., Davis, T. W., Burford, M. A., and Gobler, C. J. (2012). The rise of harmful cyanobacteria blooms: the potential roles of eutrophication and climate change. Harmful Algae 14, 313–334. doi: 10.1016/j.hal.2011.10.027
Polerecky, L., Masuda, T., Eichner, M., Rabouille, S., Vancová, M., Kienhuis, M. V. M., et al. (2021). Temporal patterns and intra- and inter-cellular variability in carbon and nitrogen assimilation by the unicellular cyanobacterium Cyanothece sp. ATCC 51142. Front. Microbiol. 12:620915. doi: 10.3389/fmicb.2021.620915
Provasoli, L., Mclaughlin, J. J. A., and Droop, M. R. (1957). The development of artificial media for marine algae. Arch. Mikrobiol. 25, 392–428. doi: 10.1007/bf00446694
Rabouille, S., and Claquin, P. (2016). Photosystem-II shutdown evolved with Nitrogen fixation in the unicellular diazotroph Crocosphaera watsonii. Environ. Microbiol. 18, 477–485. doi: 10.1111/1462-2920.13157
Rabouille, S., Van De Waal, D. B., Matthijs, H. C. P., and Huisman, J. (2014). Nitrogen fixation and respiratory electron transport in the cyanobacterium Cyanothece under different light/dark cycles. FEMS Microbiol. Ecol. 87, 630–638. doi: 10.1111/1574-6941.12251
Rae, B. D., Long, B. M., Whitehead, L. F., Förster, B., Badger, M. R., and Price, G. D. (2013). Cyanobacterial carboxysomes: microcompartments that facilitate CO2 fixation. J. Mol. Microbiol. Biotechnol. 23, 300–307. doi: 10.1159/000351342
Raven, J. A., Beardall, J., and Giordano, M. (2014). Energy costs of carbon dioxide concentrating mechanisms in aquatic organisms. Photosynth. Res. 121, 111–124. doi: 10.1007/s11120-013-9962-7
Reddy, K. J., Haskell, J. B., Sherman, D. M., and Sherman, L. A. (1993). Unicellular, aerobic nitrogen-fixing cyanobacteria of the genus Cyanothece. J. Bacteriol. 175, 1284–1292. doi: 10.1128/jb.175.5.1284-1292.1993
Riebesell, U., Wolf-Gladrow, D., and Smetacek, V. (1993). Carbon dioxide limitation of marine phytoplankton growth rates. Nature 361, 249–251. doi: 10.1038/361249a0
Schneegurt, M. A., Sherman, D. M., Nayar, S., and Sherman, L. A. (1994). Oscillating behavior of carbohydrate granule formation and dinitrogen fixation in the cyanobacterium Cyanothece sp. strain ATCC 51142. J. Bacteriol. 176, 1586–1597. doi: 10.1128/jb.176.6.1586-1597.1994
Schreiber, U., and Klughammer, C. (2009). New NADPH/9-AA module for the DUAL-PAM-100: description, operation and examples of application. PAM Appl. Notes 2, 1–13.
Sherman, L. A., Meunier, P., and Cólon-López, M. S. (1998). Diurnal rhythms in metabolism: a day in the life of a unicellular, diazotrophic cyanobacterium. Photosynth. Res. 58, 25–42.
Shi, D., Kranz, S. A., Kim, J. M., and Morel, F. M. M. (2012). Ocean acidification slows nitrogen fixation and growth in the dominant diazotroph Trichodesmium under low-iron conditions. Proc. Natl. Acad. Sci. U.S.A. 109, E3094–E3100.
Sicora, C. I., Chiş, I., Chiş, C., and Sicora, O. (2019). Regulation of PSII function in Cyanothece sp. ATCC 51142 during a light–dark cycle. Photosynth. Res. 139, 461–473. doi: 10.1007/s11120-018-0598-5
Stöckel, J., Welsh, E. A., Liberton, M., Kunnvakkam, R., Aurora, R., and Pakrasi, H. B. (2008). Global transcriptomic analysis of Cyanothece 51142 reveals robust diurnal oscillation of central metabolic processes. Proc. Natl. Acad. Sci. U.S.A. 105, 6156–6161. doi: 10.1073/pnas.0711068105
Stoll, H., Guitián, J., Hernández-Almeida, I., Mejía, L. M., Phelps, S., Polissar, P., et al. (2019). Upregulation of phytoplankton carbon concentrating mechanisms during low CO2 glacial periods and implications for the phytoplankton pCO2 proxy. Quat. Sci. Rev. 208, 1–20. doi: 10.1016/j.quascirev.2019.01.012
Suggett, D. J., Goyen, S., Evenhuis, C., Szabó, M., Pettay, D. T., Warner, M. E., et al. (2015). Functional diversity of photobiological traits within the genus Symbiodinium appears to be governed by the interaction of cell size with cladal designation. New Phytol. 208, 370–381. doi: 10.1111/nph.13483
Suggett, D. J., Macintyre, H. L., and Geider, R. J. (2004). Evaluation of biophysical and optical determinations of light absorption by photosystem II in phytoplankton. Limnol. Oceanogr. Methods 2, 316–332. doi: 10.4319/lom.2004.2.316
Talmy, D., Blackford, J., Hardman-Mountford, N. J., Polimene, L., Follows, M. J., Geider, R. J., et al. (2014). Flexible C : N ratio enhances metabolism of large phytoplankton when resource supply is intermittent. Biogeosciences 11, 4881-4895. doi: 10.5194/bg-11-4881-2014
Tamagnini, P., Leitão, E., Oliveira, P., Ferreira, D., Pinto, F., Harris, D. J., et al. (2007). Cyanobacterial hydrogenases: diversity, regulation and applications. FEMS Microbiol. Rev. 31, 692–720. doi: 10.1111/j.1574-6976.2007.00085.x
Taniuchi, Y., Chen, Y.-L. L., Chen, H.-Y., Tsai, M.-L., and Ohki, K. (2012). Isolation and characterization of the unicellular diazotrophic cyanobacterium Group C TW3 from the tropical western Pacific Ocean. Environ. Microbiol. 14, 641–654. doi: 10.1111/j.1462-2920.2011.02606.x
Tikhonov, A. N. (2013). pH-dependent regulation of electron transport and ATP synthesis in chloroplasts. Photosynth. Res. 116, 511–534. doi: 10.1007/s11120-013-9845-y
Toepel, J., Welsh, E., Summerfield, T. C., Pakrasi, H. B., and Sherman, L. A. (2008). Differential transcriptional analysis of the cyanobacterium Cyanothece sp. strain ATCC 51142 during light-dark and continuous-light growth. J. Bacteriol. 190, 3904–3913. doi: 10.1128/jb.00206-08
Van Dam, B. R., Tobias, C., Holbach, A., Paerl, H. W., and Zhu, G. (2018). CO2 limited conditions favor cyanobacteria in a hypereutrophic lake: an empirical and theoretical stable isotope study. Limnol. Oceanogr. 63, 1643–1659. doi: 10.1002/lno.10798
Vieira, S., Cartaxana, P., Máguas, C., and Silva, J. (2016). Photosynthesis in estuarine intertidal microphytobenthos is limited by inorganic carbon availability. Photosynth. Res. 128, 85–92. doi: 10.1007/s11120-015-0203-0
Wilson, S. T., Karl, D. M., Kolber, Z. S., Tozzi, S., and Zehr, J. P. (2012). Nitrogen fixation, hydrogen cycling, and electron transport kinetics in Trichodesmium Erythraeum (Cyanobacteria) strain IMS101. J. Phycol. 48, 595–606. doi: 10.1111/j.1529-8817.2012.01166.x
Xu, M., Bernát, G., Singh, A., Mi, H., Rögner, M., Pakrasi, H. B., et al. (2008). Properties of mutants of Synechocystis sp. strain PCC 6803 lacking inorganic carbon sequestration systems. Plant Cell Phys. 49, 1672–1677. doi: 10.1093/pcp/pcn139
Zavřel, T., Sinetova, M. A., Búzová, D., Literáková, P., and Červený, J. (2015). Characterization of a model cyanobacterium Synechocystis sp. PCC 6803 autotrophic growth in a flat-panel photobioreactor. Eng. Life Sci. 15, 122–132. doi: 10.1002/elsc.201300165
Zehr, J. P., Waterbury, J. B., and Turner, P. J. (2001). Unicellular cyanobacteria fix N2 in the subtropical North Pacific Ocean. Nature 412, 635–638. doi: 10.1038/35088063
Zeng, S., Liu, H., Liu, Z., Kaufmann, G., Zeng, Q., and Chen, B. (2019). Seasonal and diurnal variations in DIC, NO3– and TOC concentrations in spring-pond ecosystems under different land-uses at the Shawan Karst test site, SW China: carbon limitation of aquatic photosynthesis. J. Hydrol. 574, 811–821. doi: 10.1016/j.jhydrol.2019.04.090
Keywords: Cyanothece, Crocosphaera subtropica, photosynthesis, light limitation, carbon limitation, nitrogen fixation
Citation: Rabouille S, Campbell DA, Masuda T, Zavřel T, Bernát G, Polerecky L, Halsey K, Eichner M, Kotabová E, Stephan S, Lukeš M, Claquin P, Bonomi-Barufi J, Lombardi AT, Červený J, Suggett DJ, Giordano M, Kromkamp JC and Prášil O (2021) Electron & Biomass Dynamics of Cyanothece Under Interacting Nitrogen & Carbon Limitations. Front. Microbiol. 12:617802. doi: 10.3389/fmicb.2021.617802
Received: 15 October 2020; Accepted: 01 March 2021;
Published: 09 April 2021.
Edited by:
Mar Benavides, Institut de Recherche Pour le Développement (IRD), FranceReviewed by:
Sven Alexander Kranz, Florida State University, United StatesCarolin Regina Löscher, University of Southern Denmark, Denmark
Copyright © 2021 Rabouille, Campbell, Masuda, Zavřel, Bernát, Polerecky, Halsey, Eichner, Kotabová, Stephan, Lukeš, Claquin, Bonomi-Barufi, Lombardi, Červený, Suggett, Giordano, Kromkamp and Prášil. This is an open-access article distributed under the terms of the Creative Commons Attribution License (CC BY). The use, distribution or reproduction in other forums is permitted, provided the original author(s) and the copyright owner(s) are credited and that the original publication in this journal is cited, in accordance with accepted academic practice. No use, distribution or reproduction is permitted which does not comply with these terms.
*Correspondence: Sophie Rabouille, rabouille@obs-banyuls.fr