Monitoring of Morphology and Properties During Preparation of PCL/PLA Microfibrillar Composites With Organophilic Montmorillonite
 Miroslav Slouf
 Aleksandra Ujcic
 Martina Nevoralova
 Tatana Vackova
 Luca Fambri
 Ivan Kelnar1
- 1Institute of Macromolecular Chemistry, Academy of Sciences of the Czech Republic, Prague, Czechia
- 2Department of Industrial Engineering, University of Trento, Trento, Italy
Biodegradable microfibrillar composites PCL/PLA/C15, where PCL is poly(ε-caprolactone), PLA is poly(lactic acid), and C15 is organophilic montmorillonite, have been prepared. Microindentation hardness testing was employed in monitoring the gradual improvement of PCL stiffness due to PLA addition, C15 addition, flow-induced orientation, and changing crystallinity throughout the whole preparation process. Neat PCL after extrusion and injection molding was quite soft, but the stiffness of the material increased after melt-blending with 20 wt.% of PLA, after the addition of 2 wt.% of C15, and after the preparation of the final microfibrillar composite. The indentation modulus and indentation hardness of all intermediate products and the final PCL/PLA/C15 microfibrillar composite were associated not only with the composition and morphology but also with the crystallinity of both components. The modulus of the final PCL/PLA/C15 composite was almost two times higher in comparison with the original PCL matrix.
Introduction
Poly(ε-caprolactone) (PCL) is a biodegradable semicrystalline polyester with the broad range of applications in medicine, packaging, microelectronics or adhesives (Labet and Thielemans, 2009). PCL exhibits low glass transition temperature and relatively soft crystalline phase, which results in its low stiffness and high ductility. The low stiffness of PCL is frequently enhanced by blending with stiffer polymers, such as biodegradable poly(lactic acid), PLA (Ostafinska et al., 2015, 2017; Navarro-Baena et al., 2016). An alternative way of increasing PCL stiffness is the preparation of composites with PLA-based fibers (Ju et al., 2013; Chen et al., 2014; Kelnar et al., 2016a), natural fibers (Chen et al., 2005; Cocca et al., 2015), and various nanofillers such as layered silicates (Chen and Evans, 2006; Chrissafis et al., 2007, Labidi et al., 2010; Neppalli et al., 2011), isometric silica nanoparticles (Chrissafis et al., 2007), TiO2-based particles and nanotubes (Vackova et al., 2017), or carbon and halloysite nanotubes (Chrissafis et al., 2007; Lee and Chang, 2013).
As for polymer blending in general, PCL has the rare property of being miscible with numerous polymers such as poly(vinyl chloride) (PVC), acrylonitrile butadiene styrene (ABS), or polycarbonates (PC) (Labet and Thielemans, 2009). Some other polymers (such as functionalized polyolefins or natural rubber) exhibit reasonable mechanical compatibility with PCL, but the blending with PLA was mostly reported to result in immiscible and non-compatible blends (Na et al., 2002; Tuba et al., 2011). Nevertheless, recently we have shown that under precisely optimized processing conditions, composition and viscosity ratios of the components, the compatible PLA/PCL systems with high stiffness (due to PLA matrix) and toughness (due to PCL particles acting as impact modifier) could be prepared (Ostafinska et al., 2015, 2017); similar results were achieved in parallel studies of Bai et al. (2012, 2013).
As for the reinforcing of PCL with PLA fibers, two great potential advantages emerge: (i) both polymers are biodegradable and the blend biodegradability can be controlled by composition, morphology and/or chemical modifications, and (ii) the blend properties can be optimized in a broad range starting from very stiff, brittle PLA to very tough, ductile PCL. As pointed out by Kelnar et al. (2016a), PCL/PLA blends (i.e., the blends with PCL matrix) have not been studied as broadly as PLA/PCL blends (i.e., the blends with PLA matrix, where PCL usually acts as impact modifier; Fortelny et al., 2019). Just a few papers have dealt with PCL/PLA blends or with PCL/PLA-based composites and most of them focused on different topics than reinforcing of PCL with PLA fibers: Jain et al. (2010) investigated PCL/PLA/talc composites from the point of view of morphology, crystallinity, and barrier properties, Wu et al. (2011) dealt with the selective localization of two different nanofillers (organoclay and carbon nanorubes) in PCL/PLA systems, Laredo et al. (2010) focused their attention on the conductivity of PCL/PLA blend filled with multiwall carbon nanotubes, Patricio and Bartolo (2013) described morphology and thermal stability of solvent casted PCL/PLA blends and their scaffolds, Haq et al. (2017) characterized mechanical properties of isotropic PCL/PLA blends, and Kelnar et al. (2017a) studied effect of blend ratio and graphite nanoplatelets localization on structure and properties of PCL/PLA systems. Navarro-Baena et al. (2016) prepared PCL/PLA blends with both PCL and PLA matrix and described their morphology, rheology, shape memory behavior and in vitro biodegradation rate. The few remaining studies dealing with PCL/PLA systems (Ju et al., 2013; Chen et al., 2014; Kelnar et al., 2016a,b,c, 2017b) were focused on the same subject like this contribution—on ehancing of PCL mechanical performance by means of PLA fibers, especially in combination with a suitable nanofiller. Kelnar et al. prepared melt-drawn microfibrillar composites (MFC) of PCL/PLA (80/20) containing organophilic montmorillonite (Kelnar et al., 2016a,b), halloysite (Kelnar et al., 2016c), or graphite nanoplatelets (Kelnar et al., 2017a) and achieved 2–3× higher tensile modulus of the final composites in comparison with pure PCL; the increase in modulus was accompanied by a moderate increase in the yield strength and a decrease in the toughness of the system. Analogous results were achieved by Ju et al. (2013), who melt-mixed PCL with commercial PLA fibers at 90°C (i.e., below the melting point of the polylactide fibers), although the overall increase in modulus was lower, ~2× in comparison with the original PCL, depending on final PLA concentration which ranged from 5 to 40 wt.%. Chen et al. (2014) prepared multi-layered PCL composites reinforced by electrospun PLA/PCL blend, reported that modulus increased almost twice in comparison to the neat PCL and concluded that PLA continuous fibers could act as the PCL reinforcement.
The comparison of the above-listed results suggests that one of the most promising methods of PCL reinforcing with PLA is the MFC concept, which maintains the biodegradability of the final product and which was used in the studies of Kelnar et al. (2016a,b,c); Kelnar et al. (2017a,b). The detailed description of the MFC method can be found, for example, in the recent work of Kakroodi et al. (2017). Briefly, the preparation of the MFC composite requires two polymers with different melting temperatures (Tm): melting temperature of dispersed/fibrillary phase (Tm1) needs to be at least 40°C higher than that of the matrix (Tm2). In the first step, the microfibers of the dispersed phase are formed during melt-blending in an extruder, followed by hot- or cold-stretching of the extrudate, which results in the thin bristle containing fibers of the dispersed phase, i.e., in the material with the MFC morphology. In the second step, the MFC bristle is processed to the final shape at a temperature between Tm1 and Tm2, which keeps the microfibers from the first step. It is worth noting that MFC method was successfully employed in recent preparation of various other blends such as PP/PA6 (Huang et al., 2017), PLA/PA6 (Kakroodi et al., 2017), polyolefin elastomer/poly(trimethylene terephthalate) (Wei et al., 2016), PP/PC (Xia et al., 2016), HDPE/PA6 (Kelnar et al., 2015), or olefinic block compolymer/PP (Li et al., 2016). In some cases the authors added nanoparticles in order to improve rheological properties during MFC preparation and/or to improve mechanical properties of the final MFC composite (Kelnar et al., 2016a,b,c; Li et al., 2016). This has to be done also in our case of PCL/PLA composites, where organo-modified clay was added in order to improve the stability and reproducibility of the hot-stretching process, as discussed below.
In this work, we characterized the biodegradable PCL/PLA microfibrillar composite analogous to that previously studied (Ju et al., 2013; Chen et al., 2014; Kelnar et al., 2016a,b,c). We focused our attention on the detailed explanation, what was the real reason for the observed changes in PCL/PLA mechanical performance and why the improvement in mechanical performance could not be even higher. In order to achieve this objective, we tracked the changes of the PCL/PLA morphology, crystallinity, and local mechanical properties during the whole process of MFC preparation. The local properties of the small samples from the first step (thin extrudates and bristles) could not be assessed by traditional methods requiring large specimens. Instead, we have employed instrumented microindentation hardness testing (Balta-Calleja and Fakirov, 2000; Ostafinska et al., 2015, 2017), which could be performed on both intermediate products and final specimens for the tensile experiments. For the final products, the standard tensile properties and the microindentation properties of the composites were compared with predictive models and with each other to verify the reliability and reproducibility of the micromechanical characterization.
Theoretical Background
This work is based on detailed evaluation of micromechanical properties of PCL/PLA/C15 systems and their comparison with morphology, crystallinity, macromechanical properties and several predictive models. The key relations employed throughout the rest of this work are summarized below.
Micromechanical Properties
It has been demonstrated (Balta-Calleja and Fakirov, 2000) that microhardness of numerous polymer systems obeys additive law (also known as rule of mixtures or linear model):
where vi and Hi are the volume fraction and microhardness of i-th component of the system. The additivity law can be applied also on semicrystalline polymers:
where the subscripts a and c denote amorphous and crystalline phase, respectively. Equation 2 shows that microhardness of semicrystalline polymers grows linearly with their crystallinity, vc. The direct proportionality given by Equation 2 holds also for weight fraction of crystalline phase, wc, due to the linear relation between the two quantities (vc = wc × ρ/ρc; where ρ and ρc are density of the polymer and density of the crystalline phase, respectively). Tabor (1951) derived a formula relating microhardness (a micromechanical property) and yield stress (Y; a macromechanical property):
where the approximate sign indicates that the Tabor's relation was derived for ideally plastic solids, while for the elasto-visco-plastic materials, such as polymers systems, it is just a first approximation. Struik (1991) found another approximate formula, which was shown to hold for amorphous and semicrystalline polymers, relating their elastic modulus (E) with yield stress (E ≈ 30Y). Combination of Struik's relation, Tabor's relation (Equation 3) and additivity law (Equation 2) gives us the final formula that connects microhardness, yield stress, elastic modulus, and crystallinity of semicrystalline polymers:
Due to the approximate nature of Tabor's and Struik's relations, the numerical constants in Equation 4 can vary in relatively broad range. However, the direct proportionality among the four quantities (E ∝ Y ∝H ∝ vc) holds usually very well for given semicrystalline polymer as evidenced in numerous previous studies (Martinez-Salazar et al., 1988; Balta-Calleja and Fakirov, 2000; Flores et al., 2009, 2011; Slouf et al., 2015, 2018). It is also worth mentioning that Equation 4 holds not only for macroscale tensile modulus (E), but also for microscale indentation modulus (EIT), which is given by the fact that the two moduli are proportional (E ≈ EIT) as evidenced elsewhere (Hardiman et al., 2016, Lesan-Khosh et al., 2011).
Predictive Models for Polymer Blends and Composites
The simplest model for the prediction of properties of polymer blends and composites is linear model (LIN). It has no initial assumptions and can be applied to any property (P) of a system, for which we know the properties of individual components (Pi) and their volume fractions (vi):
Despite its simplicity, the LIN model holds very well for several combinations of polymer systems and properties. Firstly, the LIN model holds for some properties of systems with very strong interfacial adhesion. An example is the above-discussed microhardness of semicrystalline polymers [we note that Equation 1 is a special case of Equation 5 (Balta-Calleja and Fakirov, 2000)], where the interfacial adhesion between amorphous and crystalline phase is extremely strong as they are interconnected by polymer chains. Secondly, the LIN model holds for some properties of systems where the interfacial adhesion does not play an important role. A well-known example is the elastic modulus of composites with long oriented long fibers (Nielsen and Landel, 1994), where the interfacial adhesion between fibers and polymer matrix is unimportant. For most other systems and mechanical properties, LIN model represents the upper achievable theoretical limit, whereas the real mechanical performance is lower.
A more realistic model, applicable to isotropic binary polymer blends, was developed by Kolarik (1996) and called equivalent box model (EBM). The EBM model can predict elastic modulus and yield stress of polymer blends:
where Ei and Yi represent the modulus and yield stress of the individual components, the volume fractions vij stand for the volume fractions [the first subscript i identifies the component (1 or 2) and the second subscript j determines the presence of the component in the parallel or serial branch of the EBM model (p or s) as explained elsewhere (Kolarik, 1996)], and coefficient A describes interfacial adhesion (A takes the values from 0 to 1, which correspond to zero and perfect adhesion, respectively). The volume fractions in parallel and serial branch of the model (vij) are connected with the particulate and continuous morphology of the components. The vij values can be either determined experimentally or estimated theoretically from percolation theory (Kolarik, 1996). In this work we used theoretical estimation, which had been demonstrated to be quite good approximation for polymer blends (Kolarik, 1996; Ostafinska et al., 2015, Ostafinska et al., 2017). In conclusion, the EBM model takes into consideration basic morphology of the system (by means of volume fractions vij in Equation 6, 7) and interfacial adhesion (by means of parameter A in Equation 7).
In order to predict properties of final anisotropic microfibrillar composites (we note that the above described EBM model was developed for isotropic blends) and the influence of the platelets of organophilic montmorillonite, we employed also Halpin-Tsai equations (HT), which can predict elastic modulus of soft polymer matrices with hard fillers (Nielsen and Landel, 1994):
where Em = modulus of the matrix, vf = volume fraction of the filler and A, B are constants depending on filler geometry. It is worth mentioning that for very long fibers (AR → ∞), the HT equation simplifies to the above discussed LIN model in the form: E = vmEm + vfEf. To predict the influence of PLA fibers (short oriented PLA fibers in PCL matrix) we used Equation 8 with constant A = 2·AR (AR = aspect ratio = fiber length/fiber diameter) and constant B = [(Ef/Em)−1]/[(Ef/Em)–A]. To predict the influence of exfoliated montmorillonite (unoriented organophilic montmorillonite in PCL/PLA matrix) we had to combine and average the calculations based on Equation 8 for parallel and perpendicular orientation of platelets as described elsewhere (Fornes and Paul, 2003). Finally, to predict the influence of non-exfoliated montmorillonite (isometric agglomerates of montmorillonite in PCL/PLA matrix) we employed simple Einstein equation (Maiti and Mahapatro, 1991):
All predictive models (LIN model, EBM model, HT equations, and Einstein equation) were developed for macroscopic properties (elastic modulus and/or yield stress). Nevertheless, they could be applied also to corresponding micromechanical properties (indentation modulus and/or hardness). The applicability of the models to micromechanical properties has been justified theoretically by the approximate linear relationships between the macroscale and microscale properties (Equation 3 and 4) and verified experimentally in our previous studies (Ostafinska et al., 2015, 2017, 2018).
Experimental
Materials
Poly(lactic acid) (PLA) Ingeo 2002D (D-isomer content of 4.3 %; Mw = 2.53 × 10⁵ g/mol; Tm = 150°C; melt flow index 6 g/10 min at 190°C and 2.16 kg; density 1.24 g.cm−3) was a product of NatureWorks (www.natureworksllc.com). Poly(ε-caprolactone) (PCL) CAPA 6800 (Mw = 8 × 10⁴ g/mol; Tm = 60°C; density 1.145 g.cm−3) was a product of Perstorp (www.perstorp.com). The organo-modified clay Cloisite 15A (C15) was based on natural montmorillonite modified with dialkyldimethylammonium chloride (95-meq/100-g), produced by Southern Clay Products, Inc. (TX, USA).
Preparation of Composites
Prior to melt-blending, PCL, PLA, and clay were dried at 45, 85, and 70°C, respectively, in a vacuum oven for 12 h. The mixing of all systems, with the exception of pure PLA, was carried out in a co-rotating segmented twin-screw extruder Brabender TSE 20, L/D 40, rotation speed 400 rpm, and temperatures of the respective zones (from feeding to die) of 170, 170, 170, 170, 175, and 180°C (for pure PLA the conditions were the same, but the temperature of all zones was set to 190°C due to the higher optimal processing temperature of PLA). The extruded bristle with the PCL/PLA 80/20 w/w composition was melt-drawn using an adjustable take-up device. The draw ratio (DR) was the ratio between the velocity of the take-up rolls and the initial velocity of the extruded bristle; DR = 5 was used in this study. Die diameter was 3 mm, the diameter of undrawn bristles was slightly above 3 mm (due to die-swell effect), and the diameter of drawn bristles was below 1 mm. Dog-bone specimens for tensile testing (gauge length 40 mm) were prepared in a laboratory micro-injection molding machine (DSM). The barrel and the mold temperatures were 137 and 30°C, respectively. The prepared samples are summarized in Table 1.
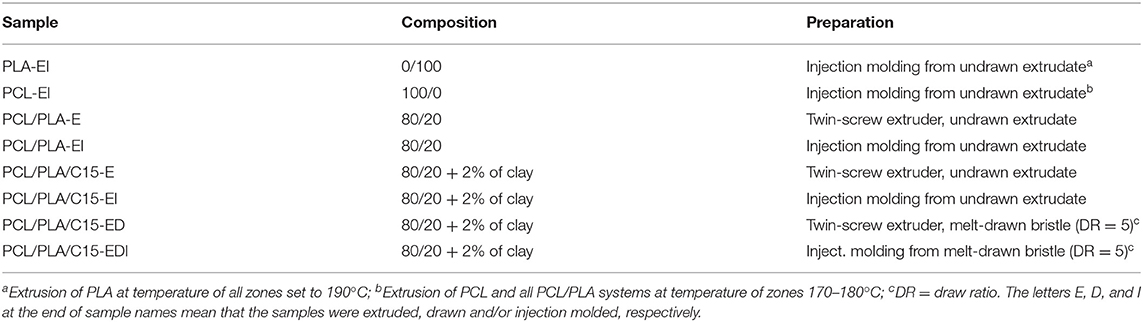
Table 1. List of investigated samples.
Characterization of Composites
Electron Microscopy
The phase morphology of all prepared samples (Table 1) was visualized using scanning electron microscopy (SEM; microscope Quanta 200 FEG; FEI, Czech Republic) and transmission electron microscopy (TEM; microscope Tecnai G2 Spirit Twin; FEI, Czech Republic).
SEM microscopy showed the overall morphology of the blends. All SEM micrographs were taken at accelerating voltage 10 kV using secondary electrons detector. The samples were broken under liquid nitrogen both parallel and perpendicular to the extrusion or injection molding direction. For selected specimens, the PLA phase was etched off using 20 % NaOH at room temperature for 30 min; this etching protocol was based on the faster hydrolysis of PLA in comparison with PCL. It is worth noting that the PLA fibrils could not be completely extracted from PCL matrix due to chemical similarity of both polyesters, which exhibit very similar solubility in most common solvents (Kelnar et al., 2016a, 2017b).
TEM microscopy was employed in visualization of the oMMT distribution in PCL/PLA blends. The ultrathin sections for TEM (thickness 60 nm) were prepared with an ultramicrotome (Ultracut UCT; Leica Austria) at cryo-conditions (sample and diamond knife temperature were −80 and −50°C, respectively). The ultrathin sections were transferred to a carbon-coated Cu grid and observed at 120 kV.
Differential Scanning Calorimetry
The differential scanning calorimetry (DSC) analysis was carried out using a Perkin-Elmer 8500 DSC apparatus. Samples of 5–10 mg were heated from 50 to 250°C at the heating rate of 10°C/min. Each specimen was measured two times and the results were averaged (standard deviations from just two measurements were not calculated, but experience shows that the standard deviations of final DSC crystallinities of semicrystalline polymers are usually around 2 %). The melting temperatures Tm of both polymers were identified as the maximum of their melting endotherms. The cold crystallization temperature Tcc of PLA was identified as the maximum of cold-crystallization exothermic peak. The crystallinity of PCL and PLA were calculated according to Equations 10, 11, respectively:
where ΔHm and ΔHcc are the enthalpy of melting and cold crystallization, respectively. In contrast to PCL crystallinity calculation (Equation 10), the PLA crystallinity calculation (Equation 11) has to take cold crystallization into account (Ostafinska et al., 2017). The crystalline fractions of PCL and PLA are related to pure polymers, i.e., the melting enthalpies were divided by weight fractions of PCL (w(PCL) in Equation 10) and PLA (w(PLA) in Equation 11), respectively. The same approach, which facilitates comparison of the crystallinities of the individual components in the systems with various compositions, was used in our previous studies (Ostafinska et al., 2015, 2017; Kelnar et al., 2016b). The values denote the enthalpy of melting 100%-crystalline polymers (139.5 and 93.1 J/g for PCL and PLA, respectively). The enthalpy value for PLA ( = 93.1 J/g), which was used also in our previous studies, was based on recent study of Lim et al. (2008), while some older studies reported slightly different value ( = 93.6 J/g; Fischer et al., 1973).
Macromechanical Properties: Tensile Testing
Tensile tests were carried out using an Instron 5800 apparatus at 22°C and crosshead speed of 20 mm/min. At least eight specimens were tested for each sample according to EN ISO 527. Young's modulus (E), yield stress (Y), and elongation at break (εb) were evaluated; the corresponding standard deviations did not exceed 10, 5, and 20%, respectively. For pure PLA polymer, which exhibited brittle behavior, the yield stress was approximated by the stress at break value (Y ≈ σb). The tensile testing was carried out with injection molded specimens, which means that all properties were measured along the injection molding direction.
Micromechanical Properties: Microindentation Hardness Testing
Micromechanical properties were characterized by instrumented microindentation hardness tester (Micro-Combi Tester; CSM Instruments, Switzerland). Smooth cut surfaces for the microindentation experiments were prepared with a rotary microtome (RM 2155; Leica, Austria) using a freshly broken glass knife (Knifemaker 7800; LKB Bromma, Sweden). All microindentation results in this manuscript come from the cut surfaces perpendicular to extrusion, drawing and/or injection molding direction; this means that the loading force was parallel with the extrusion, drawing and/or injection molding direction. Therefore, the loading force in macro- and micromechanical measurements was applied along the same direction. For each specimen, at least three independent smooth surfaces were prepared, and at least 10 indentations were carried out per surface, i.e., each sample was measured >30× and the results were averaged. All indentations were performed with a Vickers indenter (diamond square pyramid, angle between two non-adjacent faces 136 deg). Details about experiment geometry have been described elsewhere (Balta-Calleja and Fakirov, 2000; Slouf et al., 2015, 2017). The indenter was forced against the polymer surface using loading force 50 gf (0.4905 N), loading time 6 s, and linear loading/unloading rate 25 N/min. For all prepared blends or composites and given experimental setup, the size of the indents on the polymer surface was >110 μm, i.e., well above the coarseness of the phase structure. Consequently, the microindentation experiments yielded averaged information about the properties of investigated systems, which could be compared with macroscopic measurements. The experimental F-h curves (Figure 1) were used to calculate indentation hardness (HIT) and indentation modulus (EIT) according to the theory of Oliver and Pharr (1992):
In Equations 12–13 above, Fmax is maximum loading force, Ap(hc) is the projected area of the indentation (which is a function of the contact depth (hc) as described elsewhere (Oliver and Pharr, 1992; Slouf et al., 2018), and S = dF/dh denotes stiffness defined as the slope at the beginning of the unloading curve (see Figure 1). The indentation modulus (EIT) was calculated from reduced modulus (Er) using relation 1/Er = (1-ν)/Ei + (1-ν)/EIT, where Ei is modulus of the indenter (for diamond: Ei = 1,141 GPa), νi is Poisson's ratio of the indenter (for diamond: νi = 0.07), and νs is the Poisson's ration of the sample (in this work we calculated with approximate value νs = 0.4).
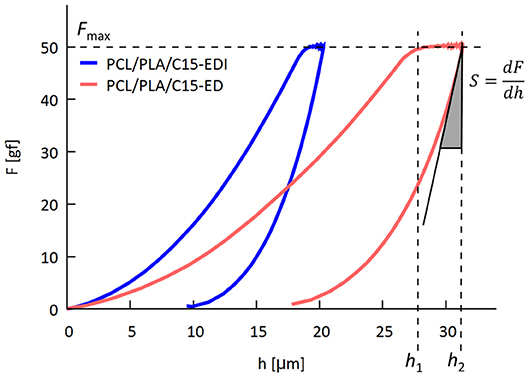
Figure 1. Principle of microindentation hardness testing, during which we measure time (t) loading force (F), and penetration depth of the indenter (h). The resulting F-h curves are employed in determination of indentation modulus (EIT) from stiffness (S) and indentation hardness (HIT) from corrected final penetration depth (hc < h2) according to Oliver & Pharr theory. The figure also documents clear difference between F-h curves of two samples studied in this work: PCL/PLA/C15-EDI and PCL/PLA/C15-ED (see Table 1 for description of the samples).
Statistical Evaluation
Pre-processing of experimental data and basic statistical calculations were performed in a spreadsheet program (MS Excel). More advanced statistical processing and calculations was carried out by means of the freeware Python programming language and its modules for data analysis (McKinney, 2018). The data were transferred from MS Excel to Python using Pandas module, linear regressions, correlation coefficients and p-values were calculated by SciPy module, common figures were prepared by means of NumPy and Matplotlib modules, and the special statistical scatterplot matrix graphs were prepared by means of Seaborn module. Two statistical coefficients were calculated in this work in order to quantify linear correlations: Pearson's correlation coefficients (r) and p-values (p). Detailed definitions of the coefficients can be found in statistical textbooks (Urdan, 2017). Briefly, Pearson's coefficients can take values from +1 (total positive linear correlation) through 0 (no linear correlation) to −1 (total negative linear correlation). The p-values, in our case, yield a probability that we would observe that strong (or stronger) linear correlation just by coincidence; the correlation is regarded as statistically significant if the calculated p-value is below the conventional value of 0.05 (i.e., if the probability is below 5 %).
Results and Discussion
Processing-Induced Changes of Morphology
All prepared PCL/PLA/C15 systems are summarized in Table 1 and their typical morphologies are shown in Figures 2, 3. All undrawn systems (PCL/PLA blends, and undrawn PCL/PLA/C15 composites) showed almost isotropic structure (Figures 2A,B). In the undrawn PCL/PLA blends, the PCL matrix contained nearly isometric PLA particles with diameter up to 1 μm (Figure 2A). Average particle size was ~0.4 μm according to measurement of >100 particles in SEM micrographs. The particles were just slightly elongated in the extrusion direction (Figure 2B). In the undrawn PCL/PLA/C15 composites, the addition of C15 did not influence the PLA particle size significantly (micrographs not shown for the sake of brevity), but the main benefit of C15 was the improved stability of the extrusion process as discussed in the next paragraph. The undrawn systems after injection molding (samples PCL/PLA-EI and PCL/PLA/C15-EI) represent control samples with isometric PLA particles. Therefore, the comparison of these samples with the final drawn system (sample PCL/PLA-EDI, i.e., the final microfibrillar composite with PLA fibers, which is described in the next paragraph) can reveal the reinforcing effect of PLA fibers.
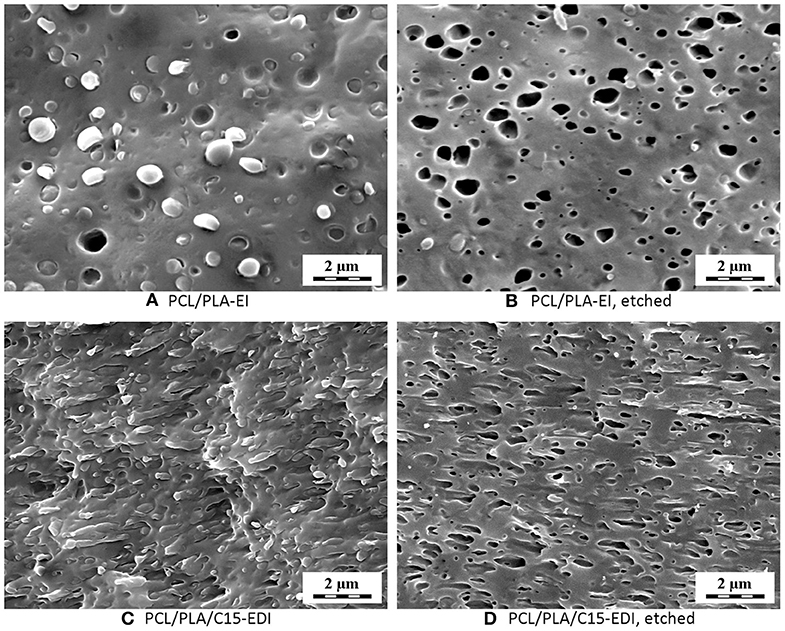
Figure 2. SEM micrographs showing phase morphology of (A,B) PCL/PLA-EI blend from undrawn extrudate and (C,D) PCL/PLA/C15-EDI composite; the micrographs show fracture surfaces parallel with melt flow before (A,C) and after (B,D) etching; sample names are explained in Table 1.
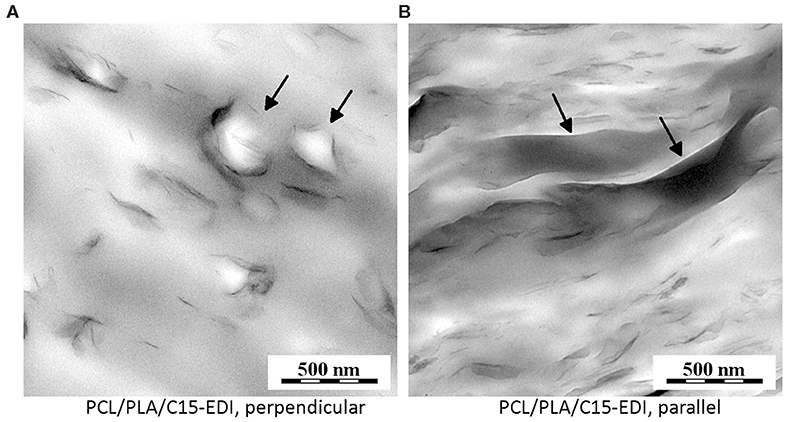
Figure 3. TEM micrographs showing filler dispersion in PCL/PLA/C15-EDI composite: (A) perpendicular to the melt flow and (B) parallel with the melt flow. Black arrows show that the C15 agglomerates tended to envelope PLA particles, which were somewhat elongated in the direction of melt flow.
Melt-blending and extrusion of PCL/PLA blends without addition of C15 lead to a bristle with low melt strength: the extrusion was unstable, the extruded bristle exhibited variable thickness and its drawing was impossible. This was probably caused by an unfavorable combination of rheological parameters (Yi et al., 2010; Kelnar et al., 2016a). Addition of 2 wt.% of C15 resulted in much more stable bristle with uniform thickness, which lead to successful melt drawing up to draw ratio 5. In the drawn systems, the PLA particles formed short oriented fibers (Figures 2C,D). The fiber thickness decreased to ~0.2 μm and their average aspect ratio (AR = L/d = fiber length / fiber thickness) increased to ~4, as estimated from SEM micrographs. A comparison of volume of spherical particles in undrawn systems (Figures 2A,B; d = 0.4 μm ⇒V = 1/6·π·d3 = 0.034 μm3) with the volume of elongated fibers in drawn systems (Figures 2C,D; d = 0.2 μm, AR = L/d = 4 ⇒V = 1/4· π·d2·L = π·d3 = 0.025 μm3) suggested that some particle breakup had occurred during the drawing process, but its extent had not been critical. It is worth noting that the value of AR ~ 4 from the SEM micrographs of injection molded samples could be underestimated due to non-perfect fiber orientation and tangling. On the other hand, the experimentally determined average value was in good agreement with the predictive models, as discussed below.
The filler in PCL/PLA/C15 composites was just partially exfoliated, but both the agglomerates and single sheets were quite homogeneously distributed within the system as evidenced by TEM micrographs (Figure 3). Although the insufficient contrast between the two polymer phases prevented us from precise localization of C15, the overall homogeneous dispersion of the filler (Figure 3) and theoretical considerations based on similar interfacial energies and wetting coefficients of the two polymers with respect to C15 (Kelnar et al., 2016a) indicated that the clay was present in both phases. Moreover, comparison of sections perpendicular (Figure 3A) and parallel (Figure 3B) to the melt flow showed some slight orientation of the clay agglomerates and nanoplatelets and suggested that they tended to partially envelop PLA fibers in the drawn sample PCL/PLA/C15-EDI—the diameter of numerous spherical structures in the perpendicular sections (Figure 3A; black arrows) and elongated structures in parallel sections (Figure 3B; black arrows) corresponded quite well to PLA fiber diameter as determined from SEM (Figures 2C,D; d ~ 0.2 μm).
Processing-Induced Changes of Crystallinity and Micromechanical Properties
The two-step MFC preparation, i.e., the drawing at higher temperature followed by the injection molding at lower temperature, influenced the crystalline structure of both polymers (Table 2). Consequently, the crystallinity changes influenced the micromechanical properties (Figure 4). The correlation between crystallinity of the components and mechanical performance was linear (in agreement with theory, see Equation 4) and statistically significant (Figure 5).
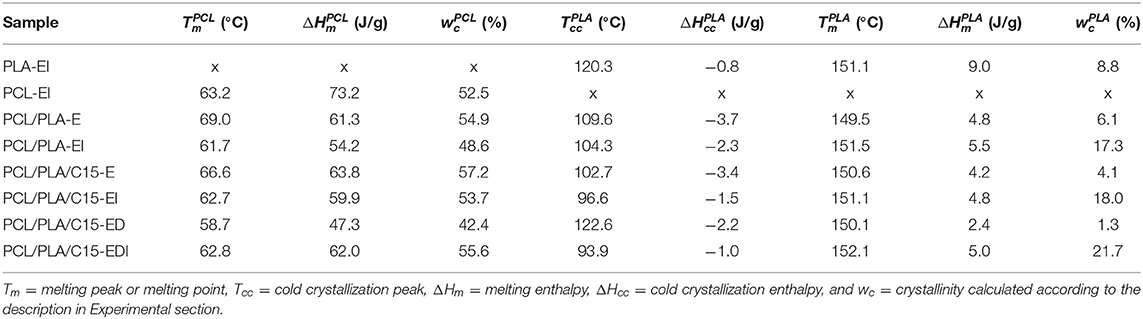
Table 2. DSC results: melting points and crystallinities of PCL and PLA in all prepared samples.
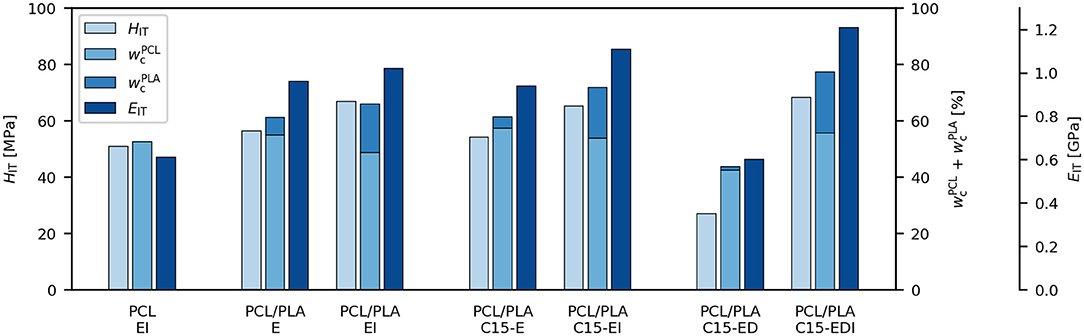
Figure 4. Correlation between sum of crystallinities of PCL matrix and PLA particles , indentation hardness (HIT) and indentation modulus (EIT).
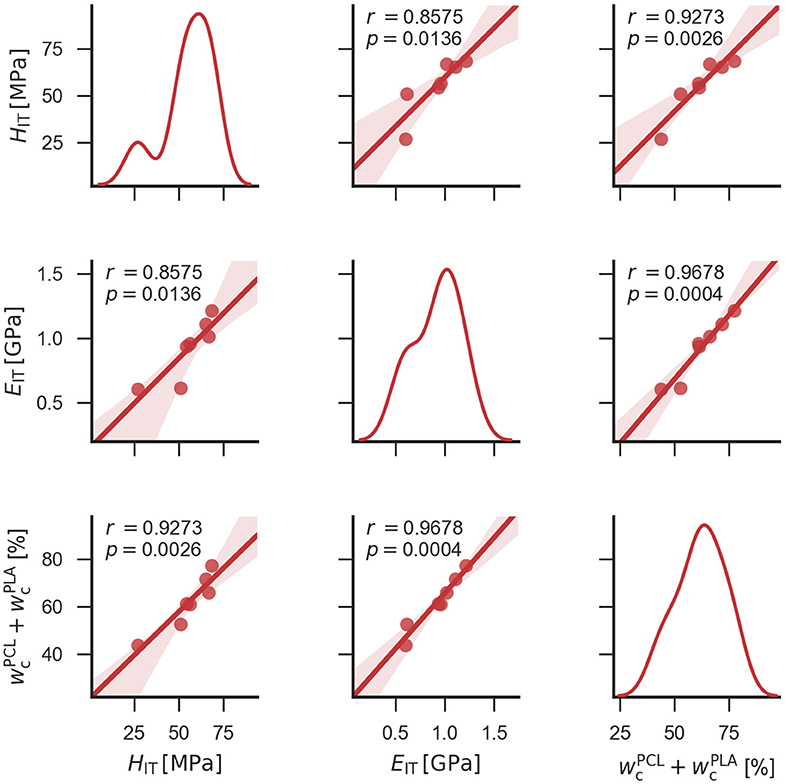
Figure 5. Scatterplot matrix graph showing correlations among indentation hardness (HIT), indentation modulus (EIT) and sum of crystallinities of PCL and PLA (). Diagonal elements of the graph display distribution of each quantity, while off-diagonal elements show correlations between each pair of quantities. Off-diagonal elements display also Pearson's correlation coefficients (r) and p-values (p). The scatterplot matrix graph, correlation coefficients and p-values were calculated with Python modules as described in Experimental section.
The DSC experiments yielded two quantities: (i) overall crystallinities, wc, and (ii) melting points, Tm. The values of Tm correlate with average lamellar thickness, lc, according to Thompson-Gibbs equation (Gedde, 1995; Slouf et al., 2016). For PCL, both wc and Tm were similar for all samples with the exception of drawn bristle before injection molding (sample PCL/PLA/C15-ED), where both parameters showed a notable decrease. For PLA, whose crystallinity is very sensitive to thermal history due to its cold crystallization (Ostafinska et al., 2015, 2017), the changes were more pronounced: the crystallinities of all injection molded specimens (PCL/PLA-EI, PCL/PLA/C15-EI, and PCL/PLA/C15-EDI) were systematically higher than the crystallinities of extrudates before the injection molding step (PCL/PLA-E, PCL/PLA/C15-E, and PCL/PLA/C15-ED); the remarkable decrease in crystallinity was observed for drawn bristle (PCL/PLA/C15-ED). The PLA melting points followed similar trends like crystallinities, but their variations were not so strong.
Figure 4 documents the close relationship between micromechanical properties (HIT and EIT) and crystallinities of all studied systems (more precisely, the sum of crystallinities of both components, ). The strong correlations among the three parameters (HIT, EIT and the sum of crystallinities) could be confirmed statistically in the form of scatterplot matrix graph (Figure 5), which shows also Pearson's correlation coefficients (r) and p-values (p) for all pairs of correlated quantities. All correlations in Figure 5 were strong, positive, and linear (r coefficients from 0.86 to 0.97, i.e., quite close to +1) and all were statistically significant (p-values from 0.003 to 0.014, i.e., well below 0.05). In conclusion, Figures 4, 5 indicate that the decisive parameter for final mechanical performance is not only the morphology of the blends, but also crystallinity of both components, which changes during the two-step preparation process.
A general theoretical justification of the observed linear correlations between HIT, EIT and crystallinity of is based on Equation 4, which combines key results of several previous studies (Tabor, 1951; Struik, 1991; Balta-Calleja and Fakirov, 2000) as explained in section Theoretical Background. The specific justification why in our case the HIT (and thus also EIT) is proportional to the sum of crystallinities of both blend components is given below. We start with the general formula for additivity law (Equation 1). It is worth reminding that the additivity law works very well for specific cases, such as microhardness semicrystalline polymers (Balta-Calleja and Fakirov, 2000) and elastic modulus of composites with infinitely long oriented fibers (Nielsen and Landel, 1994), while for mechanical properties of polymer blends it is just the first approximation (Ostafinska et al., 2017, Ostafinska et al., 2018). In spite of its approximate nature, the additivity law has been employed successfully for prediction of microhardness of polymer blends and/or composites as proved by many classical studies of Balta-Calleja and co-workers (Balta-Calleja and Fakirov, 2000; Flores et al., 2009). In this work, we employ the additivity law to explain the basic observed trends, namely the fact that the elastic modulus, yield stress and hardness are roughly proportional to the sum of crystallinities of the components. The additivity law applied to microhardness of our PCL/PLA/C15 system reads:
In Equation 14, we neglect the last member (vC15HC15) because it was demonstrated that isometric nanofillers at low concentrations (up to ca 6 %) do not influence microhardness (Flores et al., 2009; Vackova et al., 2017). Then we apply additivity law also to the blend components, which consist of amorphous (subscript a) and crystalline (subscript c) phase:
In Equation 15b, we neglect the first member () because the microhardness of the amorphous phase of semicrystalline polymers above their glass transition temperature is very low () as shown by Balta-Calleja (Balta-Calleja and Fakirov, 2000). Then we slightly modify the equation (using a simple formula relating volume fractions of PLA; ):
Equation 16b can be re-arranged to separate the crystallinities (i.e., the volume fractions of the crystalline phases, and , which change during the preparation) from the other constant values (considering that all studied systems have constant ratio of PCL/PLA = 80/20 and that the hardness values of amorphous and crystalline phase for given polymer are constant):
where the constants C1, C2, and C3 in Equation 17b substitute the corresponding constant expressions in square brackets in Equation 17a. In the final simplification of Equation 17b, we omit constant C3 (as the constant does not influence the linear relationship we want to justify), we set C1 ≈ C2 (this is very rough empirical simplification based on the fact that the influence of both components on the final hardness values is approximately the same—as confirmed by the results in Figures 4, 5), and we exchange volume fractions of crystalline phases ( and ) for weight fractions ( and ), which is possible because the relation between volume and weight fractions is also linear (vc = wc × ρ/ρc, where ρ is the density of the polymer and ρc is the density of its crystalline phase). Considering all simplifications above, we get the final approximate relation claiming that hardness in our specific case of PCL/PLA/C15 systems should be roughly proportional to the sum of crystallinities:
During the justification of Equation 18, we used numerous rough approximations such as (i) the assumption that the properties of PCL/PLA/C15 systems are described by simple additivity law (this is neither entirely precise nor completely wrong as shown in section: Influence of Composition, Morphology and Filler on Properties of Final MFC Composite), (ii) the neglection of the influence of the average lamellar thickness (this should not be critical as the contribution of lamellar thickness to final hardness value is relatively small (Flores et al., 2009) and, moreover, in our case the values of lamellar thickness followed the same trends as crystallinities as discussed in section: Processing-Induced Changes of Crystallinity and Micromechanical Properties), and namely (iii) the assumption that the impact of both components on the microhardness value is approximately the same (this is not more than an intentional simplification based on the experimental results). Despite all approximations, the final relation represented by Equation 18 yields a theoretical explanation of the observed correlation and corresponds very well to the experimental results, as documented by the statistically significant linear correlations in Figure 5.
Comparison of Macro- and Micromechanical Properties for Injection Molded Specimens
Figures 6, 7 show the mechanical properties of injection molded samples. The advantage of the injection molded specimens consisted in the fact that their mechanical performance could be characterized both in macroscale (tensile testing) and microscale (microindentation). This enabled us to verify the correlation between macro- and microscale properties, which was expected due to the theoretical considerations summarized in section Theoretical Background. Complete results of macro- and micromechanical measurements are summarized in Table 3.
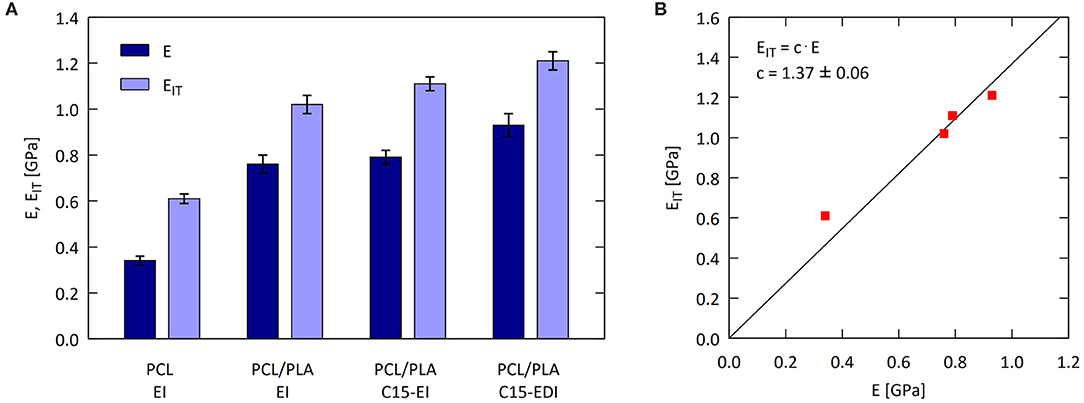
Figure 6. Elastic modulus of the injection molded specimens: (A) comparison of macroscopic tensile modulus (E) with microscopic indentation modulus (EIT) and (B) correlation E-EIT.
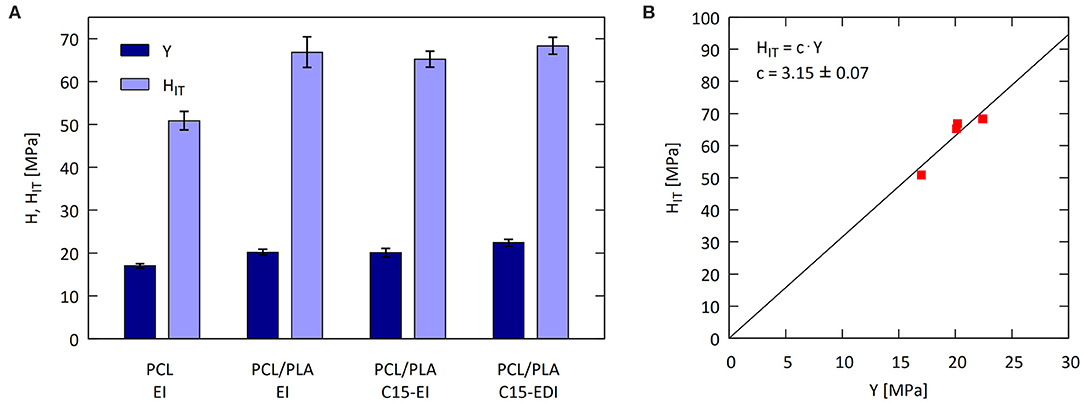
Figure 7. Yield stress and microhardness of the injection molded specimens: (A) comparison of macroscopic yield stress (Y) with microscopic indentation hardness (HIT) and (B) correlation Y-HIT.
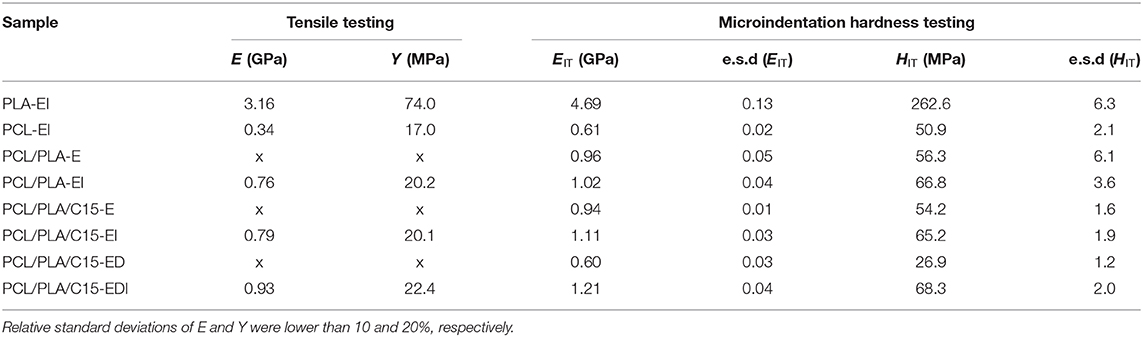
Table 3. Macro- and micromechanical properties.
Figure 6A documents that macroscale tensile modulus (E) and microscale indentation modulus (EIT) followed the same trend. For injection molded samples, which had similar crystallinities of both components, the stiffness of PCL matrix gradually increased after blending with PLA, after the addition of C15, and, finally, after drawing. Figure 6B confirmed the linear correlation between E and EIT, which was consistent with linear correlations given by Equation 4. The fact that the values of EIT were slightly higher than the values of E is quite common (Trachida et al., 2007; Kranenburg et al., 2009; Lesan-Khosh et al., 2011) and could be attributed to specific features of micro- and nanoindentation experiments (Hardiman et al., 2016).
Figure 7A illustrates that also macroscale tensile yield stress (Y) and microscale indentation hardness (HIT) showed good correlation and followed a similar trend as macro- and microscale elastic moduli (compare Figures 6A, 7A). The linear relation between Y and HIT (Figure 7B) was in agreement with Tabor's relation (Equation 3) and the value of the proportionality constant (C = 3.15 ± 0.07) was in quite good agreement with theory (C ≈ 3). In conclusion, the comparison of macro- and micromechanical properties, which were measured for bulk specimens, confirmed the validity of the theoretically predicted linear correlations among the measured quantities (E, EIT, Y, and HIT). Moreover, the good correlations between macro- and micromechanical properties evidenced the accuracy and precision of microindentation measurements, which were applied not only to bulk specimens (as shown in this section), but also to the thin extrudates and bristles (as discussed in the next section).
Figures 6, 7 indicate that the addition of PLA caused the main improvement of the stiffness of PCL/PLA systems (compare sample PCL with sample PCL/PLA-EI), while the effect of filler addition and drawing was minor (compare sample PCL/PLA-EI with samples PCL/PLA/C15-EI and PCL/PLA/C15-EDI). Despite the fact that the difference between isotropic blend (PCL/PLA-EI) and the final microfibrillar composite (PCL/PLA/C15-EDI) is relatively small, the positive effect of drawing is evident. The main reason why the effect of drawing was not higher in our specific case of PCL/PLA microfibrillar composites consisted in the relatively low aspect ratio of PLA fibers and other effects, which are discussed in the following section.
Influence of Composition, Morphology, and Filler on Properties of Final MFC Composite
Figure 8 shows the comparison of the experimentally determined mechanical properties (EIT and HIT) of all prepared PCL/PLA blends and composites with the predictive models. The models are described above in section Predictive Models for Polymer Blends and Composites; we just briefly summarize that the LIN model is a simple rule of mixing, representing the upper achievable limit for mechanical properties of polymer blends, the EBM model is a more realistic prediction for isotropic polymer blends, and the HT model considers also possible anisotropy of the blend. The system with the lowest crystallinities of the components (PCL/PLA/C15-ED) showed the worst properties regardless of the fact that it was the semi-final product, in which the PCL matrix had already been reinforced by PLA fibers and by the addition of C15. This re-confirmed the key role of crystallinity for the improvement of final properties. In contrast, the final injection-molded microfibrillar composite (PCL/PLA/C15-EDI), which had all improvements like the above-discussed PCL/PLA/C15 and the highest crystallinities, showed the best properties. At first, the indentation modulus of PCL/PLA/C15-EDI exceeded the HT prediction calculated for short oriented fibers with aspect estimated from SEM (Equation 8, AR = 4). At second, the indentation hardness of PCL/PLA/C15-EDI surpassed the EBM prediction calculated for PCL/PLA blend with maximum interfacial adhesion (Equation 7; A = 1). This indicated good compatibility between the polymer components and some small additional positive effects of the crystallinity and filler on the final mechanical performance. Before we discuss these small improvements (subject of the next paragraph), we note that the rest of the samples always exhibited better mechanical performance after injection molding (samples PCL/PLA/C15-EI and PCL/PLA-EI) and worse mechanical performance without injection molding (samples PCL/PLA/C15-E and PCL/PLA-E). This was again connected with the increase in overall crystallinity, because the injection molding supported cold crystallization of PLA, while the PCL crystallinity in all samples with the exception of PCL/PLA-ED was similar, as evidenced by DSC (Figure 4).
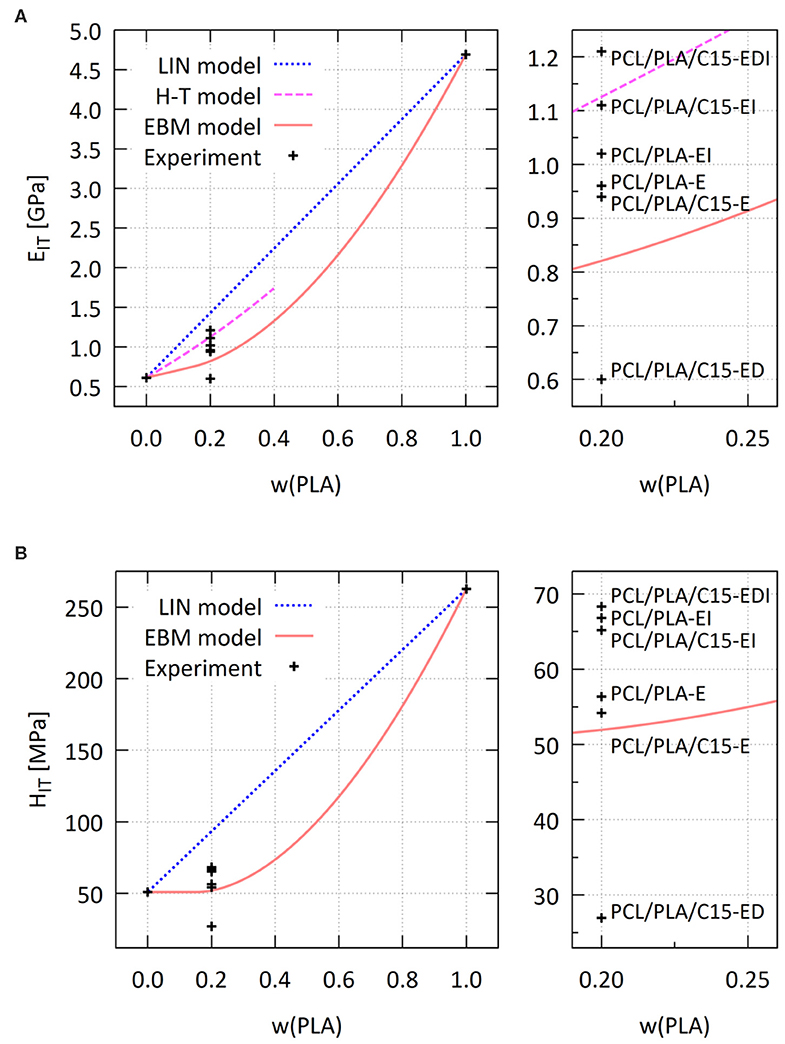
Figure 8. Comparison of experimental values of (A) indentation modulus and (B) indentation hardness with theoretical predictions based on linear model (LIN; dotted line), Halpin-Tsai model for short oriented fibers with aspect ratio = 4 (HT; dashed line), and equivalent box model calculated with default parameters (EBM; full line); the smaller graphs on the right show enlarged areas with experimental points from all PCL/PLA/C15 systems (see Table 1 for explanation of sample names).
Figure 9 focuses on the final microfibrillar composite PCL/PLA/C15-EDI and compares its experimentally determined indentation modulus (Figure 9, dotted line) with more detailed theoretical predictions. The final predictions were based on HT equations (Equation 8) because the SEM micrographs evidenced that the final composite PCL/PLA/C15-EDI was anisotropic, containing short oriented fibers (Figures 2C,D). As explained above in section Theoretical background, HT equations (Equation 8) were developed for such anisotropic systems, whereas LIN model (Equation 5) is just general rule of mixing, EBM model (Equations 6, 7) does not take anisotropy into account, and Einstein equation (Equation 9) assumes isotropic systems. Therefore, the calculations were performed for short oriented fibers according to HT equations (Equation 8) as a function of the aspect ratio of the PLA fibers. Additionally, we assumed that the orientation of crystalline lamellae within the PLA fibers was not changed significantly, because the cold crystallization was expected to change mostly the thickness, but not the orientation of the crystalline lamellae (which did not melt in the second processing step). This assumption is supported by our previous studies on analogous systems, which showed no signs of PLA isotropization at nanoscale level during preparation of microfibrillar composites (Kelnar et al., 2016a,b, 2017b). Finally, we assumed that the real AR was ~4 (Figure 9, dash-and-dot line), which was the value estimated from the analysis of SEM micrographs (Figure 2). The first model (Figure 9, Model 1) shows elastic modulus of the pure PCL/PLA microfibrillar composite (Equation 8, AR = 4, no filler). The second model (Figure 9, Model 2) shows the same system like Model 1 after addition of 2 wt. % of C15, supposing that the montmorillonite is not exfoliated and forms isometric agglomerates (the improvement of the PCL/PLA modulus due to isometric aggregates of C15 is calculated by means of Equation 9). The third model (Figure 9, Model 3) shows the same system like Model 2 after the increase of modulus of PLA fibers due to cold crystallization; we assumed increase of 10%, which is probably the maximum due to high Tg of PLA, resulting in high stiffness of the amorphous phase and relatively modest increase in stiffness due to higher crystallinity (Perego et al., 1996). The increase in the PLA crystallinity might have been enhanced by orientation of PLA chains (Fambri et al., 2006). The increase in the PCL crystallinity was not included in Model 3 as it was not changed much with respect to the original PCL (as discussed above and documented in Figure 4). The fourth model (Figure 9, Model 4) is the same like Model 3, but it assumes that the montmorillonite consists of fully dispersed, randomly oriented platelets (calculation according to Equation 8) with AR ≈ 20 as estimated from TEM micrographs (Figure 3). The prediction of EIT based on Model 4 was clearly too high, which confirmed that most of the montmorillonite platelets was not exfoliated as observed in the TEM micrographs (Figure 3).
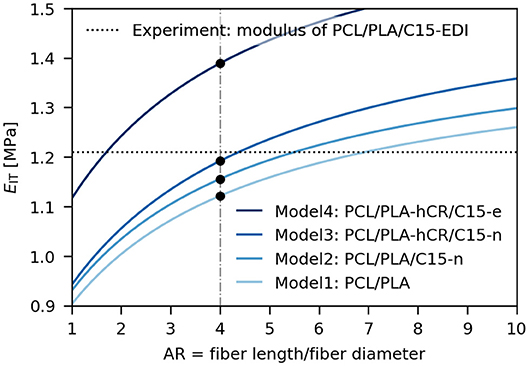
Figure 9. Comparison of experimental elastic modulus of the final MFC composite, PCL/PLA/C15-EDI (dotted line), with theoretical predictions (full lines). Aspect ratio of PLA fibers (AR = 4) was estimated from SEM micrographs (dash-and-dot line). The first model (Model1: PCL/PLA) assumes just short oriented PLA fibers in PCL matrix. The second model (Model2: PCL/PLA/C15-n) adds correction for non-dispersed/isometric filler C15. The third model (Model3: PCL/PLA-hCR/C15-n) adds correction for increased modulus of PLA fibers due to their higher crystallinity. The fourth model (Model4: PCL/PLA-hCR/C15-e) is like Model3, but assumes fully dispersed C15 nanoplatelets with random orientation.
Comparison of all models with the experimental value of EIT of PCL/PLA/C15-EDI in Figure 9 showed that the best was the third model (i.e., Figure 9, Model 3: PCL/PLA-hCR/C15-n, PCL with oriented PLA fibers, increased crystallinity of PLA fibers and not-fully-exfoliated montmorillonite). According to this model, the properties of the final microfibrillar composite were improved not only due to the formation of the oriented PLA fibers in the PCL matrix, but also due to the increased crystallinity of the PLA fibers, and due to the presence of filler. The additional improvement in final stiffness due to the processing-induced increase in PLA crystallinity was in perfect agreement with all microindentation measurements. The final increase in modulus due to the presence of C15 filler (even if the montmorillonite was not fully exfoliated) was quite logical, being in agreement with theory, represented here by Equation 9. Last but not the least, the modeling in Figure 9 suggests the possible ways and limitations of further improvement of modulus in PCL/PLA/C15 microfibrillar composites—it seems that the best performance would be achieved by better exfoliation of the montmorillonite filler.
Conclusions
Morphology and micromechanical properties of the PCL/PLA/C15 microfibrillar composites were monitored during the whole preparation process in order to elucidate the real reasons of the improvement of the mechanical properties. The microscopic and micromechanical measurements were compared with the final macroscopic properties. Both macro- and micromechanical properties were measured parallel with the direction of extrusion, drawing and/or injection molding. The main results could be summarized as follows:
At first, it has been confirmed that the two-step preparation of PCL/PLA microfibrillar composites is a complex process, during which both components change not only their morphology, but also their crystallinity. This additional complexity was connected with the high sensitivity of PLA to thermal treatment, which was associated with the cold crystallization of the polymer. Moreover, the addition of the filler (organophilic montmorillonite, C15) was found necessary for given PCL/PLA system in order to stabilize the extrusion, to make the drawing of the bristles possible, and to obtain the reproducible final PCL/PLA/C15 microfibrillar composite.
At second, it has been demonstrated that the aspect ratio of PLA fibrils (estimated from SEM micrographs) was just one of the factors influencing the final stiffness (macroscopic tensile modulus and microindentation modulus) and yield (macroscopic yield stress and microindentation hardness). The second important factor was the overall crystallinity of both components (which changed significantly throughout the preparation process, as evidenced by DSC). The third factor was the addition of the filler, which might not be fully exfoliated (as documented by TEM analysis and confirmed by comparison of final properties with predictive models), but it improved both stability of the composites during drawing and the final mechanical performance. The combination of the above mentioned three factors resulted in the twofold increase of the elastic modulus of the final PCL/PLA/C15 composite in comparison with the original PCL polymer. Although the increase in elastic modulus after formation of PLA fibrils was relatively low in comparison with isotropic PCL/PLA systems (due to relatively low aspect ratio of PLA fibrils), the observed effects were in quite good agreement with theoretical predictive schemes (linear model, equivalent box model and Halpin-Tsai model), and even slightly exceeded the most relevant theoretical prediction based on the Halpin-Tsai model for systems with short oriented fibers.
Finally, it has been verified that the microindentation hardness testing is a suitable and reliable tool for the monitoring of the mechanical properties of polymer systems at various stages of their preparation, especially in the case of small specimens like in this study where we characterized the mechanical properties of thin extruded and drawn bristles. Moreover, the micromechanical measurements yielded very good and reproducible results also for the final dog-bone specimens, which could be subjected to standard macroscopic tensile testing. The correlation between the final macroscopic tensile testing and the microindentation measurements was very good. The reliability and reproducibility of our microindentation measurements were based on careful specimen preparation (perfectly smooth surfaces for indentation prepared by microtomy) and high number of experiments per sample (even for small specimens, we performed at least 30 indentations and averaged the results).
Data Availability Statement
The datasets generated for this study are available on request to the corresponding author.
Author Contributions
MS and IK designed the study, which was performed by AU and MN (electron microscopy), TV (micromechanical properties), LF (differential scanning calorimetry), and IK (preparation of MFC composites and macroscale tensile testing). AU searched the literature and prepared a draft of the introduction. MS evaluated the results and wrote the manuscript with the assistance of IK and LF. All authors contributed to the article and approved the submitted version.
Funding
Financial support through grants TN01000008 (TA CR), TE01020118 (TA CR), 19-06065S (GA CR), and POLYMAT LO1507 (MEYS CR, program NPU I) was gratefully acknowledged.
Conflict of Interest
The authors declare that the research was conducted in the absence of any commercial or financial relationships that could be construed as a potential conflict of interest.
Acknowledgments
We would like to thank to Helena Vlkova for her technical assistance during microindentation measurements.
References
Bai, H., Huang, C., Xiu, H., Gao, Y., Zhang, Q., and Fu, Q. (2013). Toughening of poly(L-lactide) with poly(epsilon-caprolactone): combined effects of matrix crystallization and impact modifier particle size. Polymer 54, 5257–5266. doi: 10.1016/j.polymer.2013.07.051
Bai, H., Xiu, H., Gao, J., Deng, H., Zhang, Q., Yang, M., et al. (2012). Tailoring impact toughness of poly(L-lactide)/poly(epsilon-caprolactone) (PLLA/PCL) blends by controlling crystallizatior of PLLA matrix. ACS Appl. Mater. Interfaces 4, 897–905. doi: 10.1021/am201564f
Balta-Calleja, F. J., and Fakirov, S. (2000). Microhardness of Polymers, 1st Edn., Cambridge, UK: Cambridge University Press.
Chen, B., and Evans, J. R. G. (2006). Poly(ε-caprolactone)-Clay nanocomposites: structure and mechanical properties, Macromolecules 39, 747–754. doi: 10.1021/ma052154a
Chen, B., Sun, K., and Ren, T. (2005). Mechanical and viscoelastic properties of chitin fiber reinforced poly(e-caprolactone), Eur. Polym. J. 41, 453–457. doi: 10.1016/j.eurpolymj.2004.10.015
Chen, J., Lu, L., Wu, D., Yuan, L., Zhang, M., Hua, J., et al. (2014). Green Poly(ε-caprolactone) composites reinforced with electrospun polylactide/poly(ε-caprolactone) blend fiber mats, ACS Sustain. Chem. Eng. 2, 2102–2110. doi: 10.1021/sc500344n
Chrissafis, K., Antoniadis, G., Paraskevopoulos, K. M., Vassiliou, A., and Bikiaris, D. N. (2007). Comparative study of the effect of different nanoparticles on the mechanical properties and thermal degradation mechanism of in situ prepared poly(ε -caprolactone) nanocomposites, Compos. Sci. Technol. 67, 2165–2174. doi: 10.1016/j.compscitech.2006.10.027
Cocca, M., Avolio, R., Gentile, G., Di Pace, E., Errico, M. E., and Avella, M. (2015). Amorphized cellulose as filler in biocomposites based on poly(ε-caprolactone). Carbohydr. Polym. 118, 170–182. doi: 10.1016/j.carbpol.2014.11.024
Fambri, L., Bragagna, S., and Migliaresi, C. (2006). Biodegradable fibers of poly-L,DL-lactide 70/30 produced by melt spinning. Macromol. Symp. 234, 20–25. doi: 10.1002/masy.200650204
Fischer, E. W., Sterzel, H. J., and Wegner, G. (1973). Investigation of the structure of solution grown crystals of lactide copolymers by means of chemical reactions. Kolloid Zu.Z.Polymere 251, 980–990. doi: 10.1007/BF01498927
Flores, A., Ania, F., and Balta-Calleja, F. J. (2009). From the glassy state to ordered polymer structures: a microhardness study. Polymer 50, 729–746. doi: 10.1016/j.polymer.2008.11.037
Flores, A., Balta-Calleja, F. J., Di Marco, G., Sturniolo, S., and Pieruccini, M. (2011). Recrystallization processes in cold-crystallized poly(ethylene terephthalate): Interplay between structure evolution and conformational relaxation. Polymer 52, 3155–3162. doi: 10.1016/j.polymer.2011.05.013
Fornes, T. D., and Paul, D. R. (2003). Modeling properties of nylon 6/clay nanocomposites using composite theories. Polymer 44, 4993–5013. doi: 10.1016/S0032-3861(03)00471-3
Fortelny, I., Ujcic, A., Fambri, L., and Slouf, M. (2019). Phase structure, compatibility, and toughness of PLA/PCL blends: a review. Front. Mater. 6:206.doi: 10.3389/fmats.2019.00206
Gedde, U. W. (1995). “Crystalline polymers,” in Polymer Physics, ed U. W. Gedde (London: Chapman & Hall), 131–168.
Haq, R. H. A., Rahman, M. N. A., Ariffin, A. M. T., Hassan, M. F., Yunos, M. Z., and Adzila, S. (2017). Characterization and mechanical analysis of PCL/PLA composites for FDM feedstock filament, IOP Conf. Ser. Mater. Sci. Eng. 226:012038. doi: 10.1088/1757-899X/226/1/012038
Hardiman, M., Vaughan, T. J., and McCarthy, C. T. (2016). The effects of pile-up, viscoelasticity and hydrostatic stress on polymer matrix nanoindentation. Polym. Test. 52, 157–166. doi: 10.1016/j.polymertesting.2016.04.003
Huang, Y., He, Y., Ding, W., Yang, K., Yu, D., and Xin, C. (2017). Improved viscoelastic, thermal, and mechanical properties of in situ microfibrillar polypropylene/ polyamide 6,6 composites via direct extrusion using a triple-screw extruder, RSC Adv. 7, 5030–5038. doi: 10.1039/C6RA26734C
Jain, S., Reddy, M. M., Mohanty, A. K., Misra, M., and Ghosh, A. K. (2010). A new biodegradable flexible composite sheet from poly(lactic acid)/Poly(ε-caprolactone) blends and micro-talc, macromol. Mater. Eng. 295, 750–762. doi: 10.1002/mame.201000063
Ju, D., Han, L., Li, F., Chen, S., and Dong, L. (2013). Crystallization, mechanical properties, and enzymatic degradation of biodegradable poly(e-caprolactone) composites with poly(lactic acid) fibers, Polym. Compos. 34, 1745–1752. doi: 10.1002/pc.22578
Kakroodi, A. R., Kazemi, Y., Nofar, M., and Park, C.h.B. (2017). Tailoring poly(lactic acid) for packaging applications via the production of fully bio-based in situ microfibrillar composite films, Chem. Eng. J. 308, 772–782. doi: 10.1016/j.cej.2016.09.130
Kelnar, I., Fortelny, I., Kapralkova, L., and Hromadkova, J. (2015). Effect of nanofiller on fibril formation in melt-drawn HDPE/PA6 microfibrillar composite, Polym. Eng. Sci. 55, 2133–2139. doi: 10.1002/pen.24055
Kelnar, I., Fortelny, I., Kapralkova, L., Kratochvil, J., Angelov, B., and Nevoralova, M. (2016a). Effect of layered silicates on fibril formation and properties of PCL/PLA microfibrillar composites, J. Appl. Polym. Sci. 133:43061. doi: 10.1002/app.43061
Kelnar, I., Kratochvil, J., Fortelny, I., Kapralkova, L., Zhigunov, A., Khunova, V., et al. (2016c). Effect of halloysite on structure and properties of melt-drawn PCL/PLA microfibrillar composites, eXPRESS Polym. Lett. 5, 381–393. doi: 10.3144/expresspolymlett.2016.36
Kelnar, I., Kratochvil, J., Fortelny, I., Kapralkova, L., Zhigunov, A., and Nevoralova, M. (2017b). Effect of graphite nanoplatelets on melt drawing and properites of PCL/PLA microfibrillar composites, Polym. Compos. 39, 3147–3156. doi: 10.1002/pc.24322
Kelnar, I., Kratochvil, J., and Kapralkova, L. (2016b). Crystallization and thermal properties of melt-drawn PCL/PLA microfibrillar composites, J. Therm. Anal. Calorim. 124, 799–805. doi: 10.1007/s10973-015-5142-7
Kelnar, I., Kratochvil, J., Kapralkova, L., Zhigunov, A., and Nevoralova, M. (2017a). Graphite nanoplatelets-modified PLA/PCL: effect of blend ratio and nanofiller localization on structure and properties, J. Mech. Behav. Biomed. Mater. 71, 271–278. doi: 10.1016/j.jmbbm.2017.03.028
Kolarik, J. (1996). Simultaneous prediction of the modulus and yield strength of binary polymer blends. Polym. Eng. Sci. 36, 2518–2524. doi: 10.1002/pen.10650
Kranenburg, J. M., Tweedie, C. A., van Vliet, K. J., and Schubert, U. S. (2009). Challenges and progress in high-throughput screening of polymer mechanical properties by indentation. Adv. Mater. 21, 3551–3561. doi: 10.1002/adma.200803538
Labet, M., and Thielemans, W. (2009). Synthesis of polycaprolactone: a review, Chem. Soc. Rev. 38, 3484–3504. doi: 10.1039/b820162p
Labidi, S., Azema, N., Perrin, D., and Lopez-Cuesta, J.-M. (2010). Organo-modified montmorillonite/poly(ε-caprolactone) nanocomposites prepared by melt intercalation in a twin-screw extruder, Polym. Degrad. Stabil. 85, 382–388. doi: 10.1016/j.polymdegradstab.2009.11.013
Laredo, E., Grimau, M., Bello, A., Wu, D. F., Zhang, Y. S., and Lin, D. P. (2010). AC conductivity of selectively located carbon nanotubes in poly(ε-caprolactone)/polylactide blend nanocomposites, Biomacromolecules 11, 1339–1347. doi: 10.1021/bm100135n
Lee, K. S., and Chang, Y.-W. (2013). Thermal, mechanical, and rheological properties of poly(ε-caprolactone)/halloysite nanotube nanocomposites. J. Appl. Polym. Sci. 128, 2807–2816. doi: 10.1002/app.38457
Lesan-Khosh, R., Bagheri, R., and Asgari, S. (2011). Nanoindentation of isotactic polypropylene: correlations between hardness, yield stress, and modulus on the local and global scales. J. Appl. Polym. Sci. 121, 930–938. doi: 10.1002/app.33635
Li, Z., Li, X., Sun, C.h., Shi, Y., Zhang, Q., and Fu, Q. (2016). Effect of nanoparticles on fibril formation and mechanical performance of olefinic block copolymer (OBC)/polypropylene (PP) microfibrillar composites. RSC Adv. 6, 86520–86530. doi: 10.1039/C6RA19026J
Lim, L.-T., Auras, R., and Rubino, M. (2008). Processing technologies for poly(lactic acid). Prog. Polym. Sci. 33, 820–852. doi: 10.1016/j.progpolymsci.2008.05.004
Maiti, S. N., and Mahapatro, P. K. (1991). Mechanical properties of i-PP/CaCO3 composites. J. Appl. Pol. Sci. 42, 3101–3110. doi: 10.1002/app.1991.070421204
Martinez-Salazar, J., Garcia-Tijero, J. M., and Balta-Calleja, F. J. (1988). Microstructural changes in polyethylene-polypropylene blends as revealed by microhardness. J. Mater. Sci. 23, 862–866. doi: 10.1007/BF01153980
Na, Y. H., He, Y., Shuai, X., Kikkawa, Y., Doi, Y., and Inoue, Y. (2002). Compatibilization effect of poly(ε -caprolactone)-b-poly(ethylene glycol) block copolymers and phase morphology analysis in immiscible poly(lactide)/poly(e-caprolactone) blends. Biomacromolecules 3, 1179–1186. doi: 10.1021/bm020050r
Navarro-Baena, I., Sessini, V., Dominici, F., Torre, L., and Kenny, J. M. (2016). Design of biodegradable blends based on PLA and PCL: From morphological, thermal and mechanical studies to shape memory behavior. Polym. Degr. Stabil. 132, 97–108. doi: 10.1016/j.polymdegradstab.2016.03.037
Neppalli, R., Causin, V., Marega, C., Saini, R., Mba, M., and Marigo, A. (2011). Structure, morphology, and biodegradability of poly(e-caprolactone)-based nanocomposites. Polym. Eng. Sci. 51, 1489–1496. doi: 10.1002/pen.21948
Nielsen, L. E., and Landel, R. F. (1994), Mechanical properties of polymers and composites, 2nd Edn. New York, NY: Marcel Dekker.
Oliver, W. C., and Pharr, G. M. (1992). An improved technique for determining hardness and elastic modulus using load and displacement sensing indentation experiments. J. Mater. Res. 7, 1564–1583. doi: 10.1557/JMR.1992.1564
Ostafinska, A., Fortelny, I., Hodan, J., Krejcikova, S., Nevoralova, M., Kredatusova, J., et al. (2017). Strong synergistic effects in PLA/PCL blends: Impact of PLA matrix viscosity, J. Mech. Behav. Biomed. Mater. 69, 229–241. doi: 10.1016/j.jmbbm.2017.01.015
Ostafinska, A., Fortelny, I., Nevoralova, M., Hodan, J., Kredatusova, J., and Slouf, M. (2015). Synergistic effects in mechanical properties of PLA/PCL blends with optimized composition, processing, and morphology. RSC Adv. 5, 98971–98982. doi: 10.1039/C5RA21178F
Ostafinska, A., Vackova, T., and Slouf, M. (2018). Strong synergistic improvement of mechanical properties in HDPE/COC blends with fibrillar morphology. Polym. Eng. Sci. 58, 1955–1964. doi: 10.1002/pen.24805
Patricio, T., and Bartolo, P. (2013). Thermal stability of PCL/PLA blends produced by physical blending process. Procedia Eng. 59, 292–297. doi: 10.1016/j.proeng.2013.05.124
Perego, G., Cella, G. D., and Bastioli, C. (1996). Effect of molecular weight and crystallinity on poly(lactic acid) mechanical properties. J. Appl. Pol. Sci. 59, 37–43. doi: 10.1002/(SICI)1097-4628(19960103)59:1<37::AID-APP6>3.0.CO;2-N
Slouf, M., Krejcikova, S., and Hromadkova, J. (2017). Relationship among molecular structure, supermolecular structure and micromechanical properties of semicrystalline polymers. Chem. Listy 111, 239–245.
Slouf, M., Pavlova, E., Krejcikova, S., Ostafinska, A., Zhigunov, A., Krzyzanek, et al. (2018). Relationship between morphology and micromechanical properties of alpha, beta and gamma phases of iPP. Polym. Test. 67, 522–532. doi: 10.1016/j.polymertesting.2018.03.039
Slouf, M., Vackova, T., Nevoralova, M., and Pokorny, D. (2015). Micromechanical properties of one-step and sequentially crosslinked UHMWPEs for total joint replacements. Polym. Test. 41, 191–197. doi: 10.1016/j.polymertesting.2014.12.003
Slouf, M., Vackova, T., Zhigunov, A., Sikora, A., and Piorkowska, E. (2016). Nucleation of polypropylene crystallization with gold nanoparticles: relation between particle morphology and nucleation activity. J. Macromol. Sci. B 55, 393–410. doi: 10.1080/00222348.2016.1153402
Struik, L. C. E. (1991). Some problems in the non-linear viscoelasticity of amorphous glassy polymers. J. Non Cryst. Solids 131–133, 395–407. doi: 10.1016/0022-3093(91)90333-2
Trachida, D., Piccarolo, S., Loos, J., and Alexeev, A. (2007). Mechanical Characterization of Polymers on a Nanometer Scale through Nanoindentation. A Study on Pile-up and Viscoelasticity. Macromolecules 40, 1259–1267. doi: 10.1021/ma062140k
Tuba, F., Olah, L., and Nagy, P. (2011). Characterization of reactively compatibilized poly(D,L-lactide)/poly(ε-caprolactone) biodegradable blends by essential work of fracture method, Eng. Fract. Mech. 78, 3123–3133. doi: 10.1016/j.engfracmech.2011.09.010
Vackova, T., Kratochvil, J., Ostafinska, A., Krejcikova, S., Nevoralova, M., and Slouf, M. (2017). Impact of particle morphology on structure, crystallization kinetics and properties of PCL composites with TiO2-based particles. Polym. Bull. 74, 445–464. doi: 10.1007/s00289-016-1723-2
Wei, L., Dong, J., Qi, Y., Sun, J., and Qin, S. (2016). In situ polyolefin elastomer/poly(trimethylene terephthalate) microfibrillar composites fabricated via multistage stretching extrusion, Fiber. Polym. 17, 1916–1924. doi: 10.1007/s12221-016-6309-y
Wu, D., Lin, D., Zhang, J., Zhou, W., Zhang, M., Zhang, Y., et al. (2011). Selective localization of nanofillers: effect on morphology and crystallization of PLA/PCL blends, macromol. Chem. Phys. 212, 613–626. doi: 10.1002/macp.201000579
Xia, X.-,Ch., Yang, W., He, S., Xie, D.-D., Zhang, R. Y., Tian, F., et al. (2016). Formation of various crystalline structures in a polypropylene/polycarbonate in situ microfibrillar blend during the melt second flow, Phys. Chem. Chem. Phys. 18, 14030–14039. doi: 10.1039/C6CP01426G
Keywords: biodegradable microfibrillar composites, polycaprolactone, poly(lactic acid), micromechanical properties, microindentation
Citation: Slouf M, Ujcic A, Nevoralova M, Vackova T, Fambri L and Kelnar I (2020) Monitoring of Morphology and Properties During Preparation of PCL/PLA Microfibrillar Composites With Organophilic Montmorillonite. Front. Mater. 7:188. doi: 10.3389/fmats.2020.00188
Received: 16 July 2019; Accepted: 22 May 2020;
Published: 25 June 2020.
Edited by:
Patricia Krawczak, IMT Lille Douai, FranceCopyright © 2020 Slouf, Ujcic, Nevoralova, Vackova, Fambri and Kelnar. This is an open-access article distributed under the terms of the Creative Commons Attribution License (CC BY). The use, distribution or reproduction in other forums is permitted, provided the original author(s) and the copyright owner(s) are credited and that the original publication in this journal is cited, in accordance with accepted academic practice. No use, distribution or reproduction is permitted which does not comply with these terms.
*Correspondence: Miroslav Slouf, slouf@imc.cas.cz