Regulatory Variation in Functionally Polymorphic Globin Genes of the Bank Vole: A Possible Role for Adaptation
 Věra Dvořáková1
  Michaela Horníková
 Lucie Němcová
 Silvia Marková
 Petr Kotlík
- 1Laboratory of Molecular Ecology, Institute of Animal Physiology and Genetics, Czech Academy of Sciences, Liběchov, Czechia
- 2Department of Zoology, Faculty of Science, Charles University, Prague, Czechia
- 3Laboratory of Developmental Biology, Institute of Animal Physiology and Genetics, Czech Academy of Sciences, Liběchov, Czechia
Interaction between gene expression and protein-coding genetic variation is increasingly being appreciated as an important source of adaptive phenotypic variation. In this study, we used reverse transcription–qPCR to test for gene expression variation in two β-globin paralogs (HBB-T1 and HBB-T2) of the Eurasian bank vole (Myodes glareolus), which both display the same structural polymorphism Ser52Cys responsible for variation in Cys-based antioxidant capacity of red blood cells (RBCs). We first demonstrated that HBB-T1 is the major expressed adult HBB gene in the bank vole accounting for ~85% of total hemoglobin. We then measured the relative expression of the two homozygous genotypes in each gene and found that when present in HBB-T1, the oxidative-stress resistant Cys52 allele is significantly associated with higher expression ratio HBB-T1:HBB-T2. The results further indicated that the Cys52 allele present in HBB-T1 was associated with higher normalized expression of that gene compared to the Ser52 allele, although this difference was statistically significant only when using one reference gene but not the other. We argue that, altogether, our results indicate the presence of a cis-acting regulatory genetic variation modulating the expression of the two alleles in HBB-T1. Previous studies indicated that the resistant RBC phenotype is likely beneficial under conditions conducive to oxidative stress. The duplicate HBB genes of the bank vole thus may represent a novel example of gene-regulatory genetic variation interacting with a well-defined protein-coding variation to control an adaptive trait.
Introduction
Non-synonymous nucleotide variation altering the amino acid sequence of functionally important protein domains (e.g., ligand-binding sites) is a well-recognized source of adaptive phenotypic variation (Hoekstra et al., 2004; Wheat et al., 2006; Mitchell-Olds et al., 2007; Yokoyama et al., 2008; Storz et al., 2009). However, the phenotypic effect of a gene can also be modified through genetic variation in levels of gene expression (Harrison et al., 2012); for example, when this affects the concentration and hence, activity level of the resulting protein product (Steiner et al., 2007). Interaction between both types of variation can then yield complex patterns of phenotypic variation, where regulatory variants differentially modulate the functional effect of protein variants by changing their absolute or relative abundance in the cell. Therefore, a regulatory genetic variant can enhance or reduce the functional effects of a protein-coding variants, which can result in a stronger or weaker phenotypic effect than expected, if only the protein-coding variation was present (Dimas et al., 2008). When a regulatory variant is in linkage disequilibrium (cis-acting) with a coding variant, then selection on specific allelic combinations can result in adaptive expression differences between functionally-distinct protein alleles (Signor and Nuzhdin, 2018).
Variation in gene expression is common between species and within populations (Fraser, 2013). However, while genome-wide patterns have suggested that genetic interactions between regulatory (cis- as well as trans-acting) and protein-coding variation (i.e., epistasis; Dimas et al., 2008) may be a common cause of genetically complex phenotypes, it is not clear how much of such variation is adaptive, with well-characterized examples being limited to a few species and genetic systems (e.g., Laurie et al., 1991; Steiner et al., 2007). Here, we present the first report on gene expression variation in a pair of duplicate β-globin genes in wild populations of a Eurasian rodent, the bank vole (Myodes glareolus), as a potential candidate system with a red blood cell (RBC) phenotype controlled by both protein-coding and regulatory variation (Kotlík et al., 2014; Strážnická et al., 2018).
Although primarily known as an oxygen carrier, hemoglobin (Hb) is a multifunctional molecule with structural variation conveying functional adaptation to environmental stress in diverse organisms and circumstances (Reischl et al., 2007; Storz, 2019). However, duplicate Hb genes are also well-known for their ontogenetic regulatory switching, with the expression of a fetal gene being replaced with the expression of an adult gene, as well as for their expression variation between paralogous copies encoding each of the α (Storz et al., 2010; Marková et al., 2014) and β subunits (Weich et al., 1988; Kotlík et al., 2014) of the tetrameric Hb. Therefore, Hb represents a suitable system to look for the presence of both coding and regulatory variation. The bank vole shows striking Hb variation where individuals from across Europe may carry one of two structurally and functionally distinct adult Hb types (Kotlík et al., 2014; Strážnická et al., 2018), originally detected by protein electrophoresis and designated Hb S (slow) and Hb F (fast) (Hall, 1979). A recent study showed that Hb F homozygotes have significantly higher antioxidant capacity of the red blood cells (RBCs) than Hb S homozygotes, which is due to a single amino acid substitution of serine (Ser) with cysteine (Cys) at position 52 in the β subunit of Hb F (Kotlík et al., 2014). The explanation is that the thiol (–SH) group of the side chain of Cys52 in Hb F takes part in the RBC protein redox system involved in detoxification of reactive oxygen species (ROS) (Rossi et al., 1998; Storz et al., 2012; Kotlík et al., 2014; Petersen et al., 2017). Previous studies found evidence suggesting that the resistant RBC phenotype is advantageous under environmental conditions conducive of oxidative stress (Kotlík et al., 2014; Strážnická et al., 2018). The allele frequency variation across populations may therefore reflect the strength of local environmental selection (Strážnická et al., 2018).
Due to the history of frequent inter-paralog gene conversion (Strážnická et al., 2018), the same allelic variation Ser52Cys is shared by both gene duplicates encoding the β-globin in the bank vole, HBB-T1 and HBB-T2 (Kotlík et al., 2014; Strážnická et al., 2018). However, a preliminary comparison of the relative expression of the two genes using high-throughput RNA sequencing (RNA-seq) from three individuals suggested that HBB-T1 is the major β-globin gene expressed in adult RBCs, accounting for ~95% of total Hb (Kotlík et al., 2014). The phenotypic effect of the Cys52 allele is therefore dependent on whether it is present in the HBB-T1 (major) or HBB-T2 (minor) gene. Expression of HBB-T1 and HBB-T2 can be regulated independently of one another in rodents (Whitney, 1977). Therefore, there is a possibility that regulatory variation in the expression ratio of the two genes (Thompson et al., 2014; Sandkam et al., 2015a,b), but also of the two alleles within the same gene (Dimas et al., 2008), could add an additional dimension to variation in the RBC phenotype and contribute to evolutionary adaptation by helping to fine-tune the RBCs phenotype in response to selection pressures (Strážnická et al., 2018).
The aim of the present study was to test for gene expression variation as such variation potentially could modulate the functional effect of the two β-globin alleles in bank vole RBCs. Hence, we compare the expression levels of the two HBB paralogs as measured by quantitative reverse transcription PCR (RT-qPCR) between voles possessing different genotypes and originating from different populations across Europe, as evidenced by their mitochondrial DNA (mtDNA) clade membership (Filipi et al., 2015; Strážnická et al., 2018). As the result of an expansion from multiple isolated glacial refugia at the end of the last glaciation, the present range of the bank vole is partitioned into multiple clades, designated according to the glacial refugium from which the clade is derived (Filipi et al., 2015). Clade memberships thus serves as a proxy for historically separate population. We tested for the association of the protein-coding genotype (Ser52 or Cys52) with the expression level of the gene in which it is present (HBB-T1 or HBB-T2), as well as with the expression ratio between the two genes (HBB-T1:HBB-T2).
Materials and Methods
Samples and RNA Preparation
The study used 47 samples selected among the set previously studied by Strážnická et al. (2018) for which the Ser52Cys genotype in HBB-T1 and HBB-T2 had been determined by either pyrosequencing or by Sanger sequencing (Strážnická et al., 2018). The samples originated from eight localities across Europe [Germany (n = 1), Netherlands (n = 7), United Kingdom–England (n = 16), United Kingdom–Scotland (n = 4), Sweden (n = 4), Denmark (n = 5), Italy (n = 5), and Norway (n = 5); see Table S1], as described by Strážnická et al. (2018). All samples were spleen tissue, an erythropoietic organ in rodents (Brodsky et al., 1966), stored in RNA later (Qiagen, Valencia, CA) at −20°C. Only homozygotes Cys52Cys and Ser52Ser were included in this study (Table S1). The sample sizes of the two homozygotes in each gene and of each of the three commonly occurring two-locus combinations are given in Table 1, which lists the genotypes by mtDNA clade (Deffontaine et al., 2005; Filipi et al., 2015; Strážnická et al., 2018) as a proxy for historically separate population (Avise, 2000).
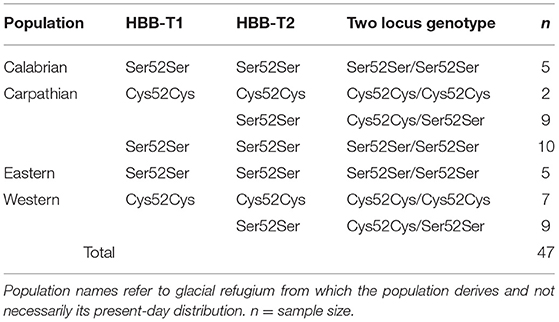
Table 1. Numbers of voles analyzed from each population (mtDNA clade) and HBB-T1 and HBB-T2 genotype.
Total RNA was extracted from ~0.05 mg of tissue by using the RNeasy Protect Mini Kit with RNase-Free DNase I treatment (Qiagen). The RNA concentration was measured with a NanoDrop 1000 spectrophotometer (Thermo Scientific) and its integrity was verified by gel electrophoresis. RNA in each sample was diluted in RT-PCR Grade Water (Invitrogen) to a final concentration of 10 ng/μl and stored at -80°C.
Reverse Transcription–qPCR Design
Primers for the RT-qPCR assays were designed using the Oligo 7 software (Colorado, USA). To make assays specific to each of the two HBB paralogs (HBB-T1 and HBB-T2), each assay used a gene-specific reverse amplification primer located within the 3′ untranslated region (UTR) showing consistent sequence differences between HBB-T1 and HBB-T2 (Kotlík et al., 2014). The forward primer was common to both assays and the reverse primers were positioned such that the amplicon length was similar between the two assays (Table S2). Primers were also designed for a selection of candidate reference genes for normalizing the RT-qPCR data, taking advantage of the previously available bank vole transcriptome assembly (Kotlík et al., 2018). Potential reference genes were selected based on literature reports from the bank vole and other mammals (Swiergosz-Kowalewska et al., 2007; Ren et al., 2010; Zarzycka et al., 2016; Eissa et al., 2017; Li et al., 2017). A total of seven genes, namely those encoding β-actin (Actb), glyceraldehyde 3-phosphate dehydrogenase (Gapdh), peptidyl-prolyl isomerase A (Ppia), 18S ribosomal RNA (Rn18s), 60S acidic ribosomal protein P0 (Rplp0), TATA box binding protein (Tbp), and ubiquitin-conjugating enzyme E2D 2A (Ube2d2a) were considered. To evaluate the expression stability of the candidate reference genes, the expression level of each gene was determined across eight individuals selected from the total sample of 47 specimens, which varied in genotype. Suitable reference genes were selected following the recommendations of Pfaffl et al. (2004).
RT-qPCR amplification was performed in a Rotor Gene 3000 (Corbett Research, Australia) cycler using the OneStep RT-PCR Kit (Qiagen) with EvaGreen dye (Biotium, California, US). The reactions were set up in a total volume of 10 μl and contained 2 μl 5 × reaction buffer, 0.4 μl dNTP mix (10 mM stock of each), 0.2 μl of both reverse and forward primers (0.02 mM stock), 0.4 μl Qiagen One Step RT-PCR enzyme mix, 4.6 μl RNase free water and 2 μl of RNA. All reactions were carried out in three replicates. Amplifications were performed using 0.1 ml strip tubes and caps (Qiagen) placed in the 72-well rotor of the Rotor Gene instrument, which allowed the HBB-T1 and HBB-T2 assays for each vole to be run simultaneously, in addition to negative controls. Run conditions were as follows: a cDNA synthesis at 50°C for 30 min and a pre-denaturation at 94°C for 15 min, followed by cycles consisting of a denaturation at 94°C for 3 s, an annealing at the temperature specific for each set of primers (Table S2) for 20 s and an extension at 72°C for 20 s, followed by a final extension at 72°C for 5 min. The specificities of the RT-qPCR assays were verified by a melting curve analysis tool of the Rotor-Gene Q Series Software, version 2.3.1. The amplification of the desired PCR product was confirmed by Sanger sequencing (Macrogen, Amsterdam, Netherlands) and BLAST comparison against the National Center for Biotechnology Information (NCBI, http://www.ncbi.nlm.nih.gov) database.
Quantification of HBB-T1 and HBB-T2 Expression
The expression ratio HBB-T1:HBB-T2 compares two genes in the same sample (rather than the same gene in two different samples normalized to a reference gene) and a simple mathematical model (1+E1)−Cq1/(1+E2)−Cq2 therefore applies (Thompson et al., 2014; Sandkam et al., 2015a,b), where Cq is the number of cycles each gene (1 and 2) takes to cross a fluorescence threshold, and E is the PCR amplification efficiency of that gene (Pfaffl, 2001). The term (1+E)−Cq therefore represents the input quantity of each gene relative to the quantity of that gene at the quantification cycle (Rieu and Powers, 2009). Such an approach has previously been applied to study expression ratios of gene duplicates (Thompson et al., 2014; Sandkam et al., 2015a,b), pairs of single genes (Ma et al., 2004; Goetz, 2006), and splice variants of the same gene (Camacho Londoño and Philipp, 2016). For a valid ratio calculation, the PCR amplification efficiencies of the two genes must be approximately equal, or a bias-correction needs to be applied (Thompson et al., 2014; Sandkam et al., 2015a,b). We validated the applicability of this approach to our system by assessing the mean amplification efficiency of each RT-qPCR assay using the Cq slope method, as recommended by Bustin et al. (2009) and Livak and Schmittgen (2001). We constructed a calibration curve for each gene from seven sequential dilution points (12.5, 3, 0.3, 0.1, 0.03, 0.003, and 0.0003 ng/μl). The slope of the calibration curve (–log(E+1)) plotting the values of Cq against the logarithm of the initial template concentration (Bustin et al., 2009) was −3.312 for HBB-T1 and −3.315 for HBB-T2, indicating the assays were approximately equally (ΔE < 0.5%) and near 100% efficient. The applicability of the model was further supported by a near-zero slope (0.0497) of a calibration curve plotting the difference in Cq values (ΔCq) between the two genes on the y axis (Livak and Schmittgen, 2001).
Despite the results suggesting near optimal and equal mean efficiencies of both assays, we applied the efficiency calibrated model above in order to account for any reaction-specific PCR efficiency variation (McCurdy et al., 2008). The amplification efficiency of each individual reaction was calculated with the comparative quantitation tool of the Rotor-Gene Q Series Software (McCurdy et al., 2008), which uses the second derivative of raw fluorescence values (the slope of the amplification curve) to calculate both the efficiency (E) of each reaction and the take-off point (Cq) at which the exponential phase of amplification begins (McCurdy et al., 2008; Camacho Londoño and Philipp, 2016).
In order to compare gene expression levels between voles carrying different genotypes, we normalized the expression of each gene relative to the two reference genes meeting the criteria for consistent expression levels (Pfaffl et al., 2004) (see Results). Calculations that consider reaction-specific PCR efficiencies were performed according to Pfaffl (2001).
Therefore, we obtained altogether nine measures of HBB expression for each of the 47 voles; specifically, the non-normalized expression (1+E)−Cq of each of HBB-T1 and HBB-T2, the ratio HBB-T1:HBB-T2, and the expression of each of HBB-T1 and HBB-T2 normalized to each of the two selected reference genes (see Results) and to their mean.
Statistical Analyses
We analyzed the data with SAS software, version 8.2 (SAS Inst. Inc., Cary, NC). The assumption of normality was tested for each variable using the Shapiro-Wilk W test. The null hypothesis of a normal distribution was not rejected for the ratio HBB-T1:HBB-T2 and therefore, ANOVA was used to test the differences between groups. The effect of population on gene expression differences between genotypes was tested by a two-way ANOVA with HBB-T1:HBB-T2 ratio as the dependent variable and genotype and mtDNA clade as explanatory variables, followed by Tukey-Kramer multiple comparison test. The values of (1+E)−Cq and the normalized expression values of the individual genes did not follow a normal distribution and therefore Kruskal-Wallis (non-parametric) test was applied.
Results
Difference in the Expression Between HBB-T1 and HBB-T2
The ratio HBB-T1:HBB-T2 ranged from 1.4- to 14.9-fold (mean ± SD, 6.69 ± 3.24), indicating higher expression level of HBB-T1 than HBB-T2 for all individuals. The Kruskal-Wallis test indicated the difference in the expression between HBB-T1 and HBB-T2 was significant (χ2 = 24.6, P < 0.0001).
The Effect of Ser52Cys SNP on Individual HBB Gene Expression
The expression levels for the candidate reference genes Actb, Gapdh, Rplp0, Tbp, and Ube2d2a varied substantially within datasets (maximum fold difference exceeded 2). Ppia and Rn18s showed the lowest coefficients of variance (13.8 and 23.3%, respectively) and the lowest standard deviations of the average Cq values (0.25 and 0.123), which indicated consistent expression levels (Pfaffl et al., 2004). Therefore, in order to compare the expression of each HBB-T1 and HBB-T2 paralog between individuals homozygous for different alleles in that gene, we normalized the expression of each paralog relative to, alternatively, Ppia, Rn18s and their mean (Figure 1). HBB-T1 homozygotes Cys52Cys showed on an average 1.7-fold higher gene expression compared to homozygotes Ser52Ser. However, the difference was only significant when Rn18s was used for normalization (Kruskal-Wallis test, χ2 = 5.91, P < 0.05), but not when Ppia was used (Figure 1). A similar difference in expression is also observed in HBB-T2, but is never statistically significant (Figure 1).

Figure 1. Box plot representation of gene expression normalized to two reference genes (Ppia and Rn18s) and their mean. *P < 0.05 (Kruskal-Wallis test).
The Effect of Ser52Cys SNP on HBB-T1:HBB-T2 Ratio
We then tested for association of HBB-T1 genotypes, HBB-T2 genotypes and different two-locus genotype combinations (HBB-T1/HBB-T2) with the (non-normalized) expression ratio HBB-T1:HBB-T2. HBB-T1 genotype Cys52Cys was associated with significantly higher ratio (8.5 vs. 5.6) compared to HBB-T1 genotype Ser52Ser (ANOVA, F = 11.06, P < 0.01; Figure 2). There was no significant difference in HBB-T1:HBB-T2 ratio between the two-locus genotypes Cys52Cys/Cys52Cys and Cys52Cys/Ser52Ser, but they were each associated with a significantly higher ratio (8.9 and 8.2 vs. 5.6, respectively) when compared to the two-locus genotype Ser52Ser/Ser52Ser (ANOVA, F = 5.61, P < 0.01; Figure 2).
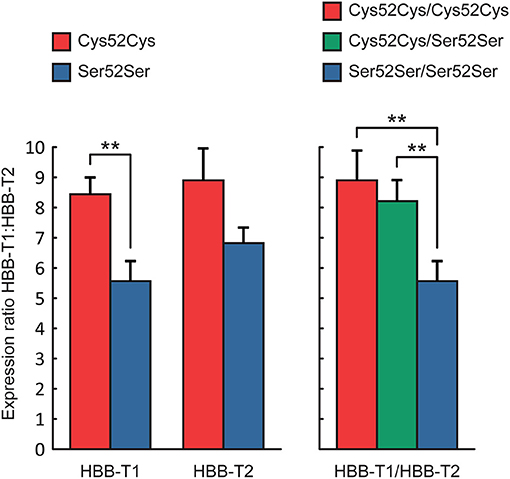
Figure 2. Expression ratio HBB-T1:HBB-T2 (LS Mean ± SE) across single-locus (HBB-T1 and HBB-T2) and two-locus genotypes (HBB-T1/HBB-T2). **P < 0.01 (ANOVA with Tukey-Kramer test).
Further analysis revealed that the two-locus genotypes did not, however, show significantly different expression ratios between populations (defined by mtDNA clades), with the exception of genotype Ser52Ser/Ser52Ser, which was associated with a significantly low ratio in the Calabrian population (2.9) vs. the Carpathian population (Figure 3).
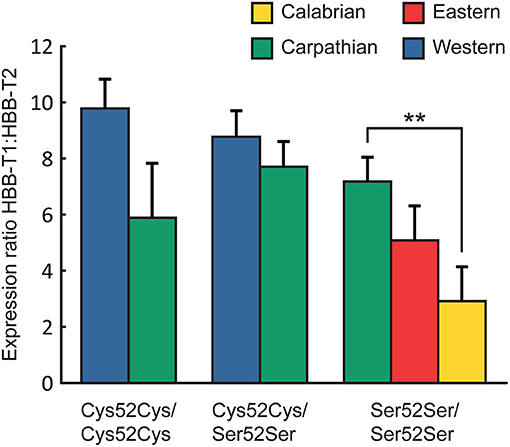
Figure 3. Expression ratio HBB-T1:HBB-T2 (LS Mean ± SE) of different two-locus genotypes (HBB-T1/HBB-T2) across populations (defined by mtDNA clade affinity; see Table 1). **P < 0.01 (ANOVA with Tukey-Kramer test).
Discussion
Regulatory Variation in the HBB Genes
Although our RT-qPCR analysis revealed broader variation in the HBB-T1:HBB-T2 ratio than previously reported from RNA-seq of three individuals (Kotlík et al., 2014), the data for 47 voles demonstrated that the HBB-T1 is the major adult-expressed gene for β-globin in the bank vole, accounting for an average of 85% of total β-globin mRNA. This agrees with previous findings (Kotlík et al., 2014) from protein electrophoresis analyses that showed that the major electrophoretic Hb polymorphism (Hb S/Hb F) (Hall, 1979) across 145 bank voles was explained by the HBB-T1 genotype, supporting that the relative transcript abundance of HBB-T1 and HBB-T2 reflects the relative abundance of Hb tetramers that incorporate the translated β-globin subunits of those two genes.
The β-globin gene cluster of mammals contains a set of developmentally regulated genes that are arranged in their temporal order of expression, with the 5′ end of the cluster delimited by the embryonic HBE gene and the later expressed (adult) HBD and HBB genes at the 3′ end of the cluster (Hoffmann et al., 2008; Gaudry et al., 2014). While in some mammals, products of HBD or HBB/HBD fusion genes combine with α-globin chains to produce up to 100% of adult Hb (Gaudry et al., 2014), one or more copies of HBB are the only functional adult β-globin genes in rodents (Hoffmann et al., 2008; Kotlík et al., 2014). Surprisingly little is, however, known about the relative transcript abundance of the HBB duplicates. Our findings of higher expression of HBB-T1 relative to HBB-T2 are in agreement with those from β-globin genes of the house mouse (Mus musculus), where the assessment of relative transcript abundance demonstrated about a 4-fold higher expression of the upstream gene-duplicate compared to the downstream paralog (Weich et al., 1988; Runck et al., 2009), and the Hb isoform encoded by HBB-T1 accounts for ~80% of total Hb (Whitney, 1977).
We found no significant difference in HBB-T1:HBB-T2 ratio between the two-locus genotypes Cys52Cys/Cys52Cys and Cys52Cys/Ser52Ser, and thus, there is no evidence that a change in the HBB-T1:HBB-T2 ratio by itself causes variation in Hb Cys content in the bank vole. However, we found allelic differences in the HBB-T1 expression, where there was an approximately two-fold difference in mean expression level between genotype Cys52Cys and genotype Ser52Ser. Although the difference was not statistically significant when normalized to Ppia, genotype Cys52Cys was also associated with a significantly elevated HBB-T1:HBB-T2 ratio, which does not depend on normalization. This also means that the variation in HBB-T1 expression level is likely not explained by higher rates of Hb synthesis (i.e., upregulation of all globin genes) in some individuals, for example due to age or physiological conditions (Stankiewicz et al., 2014). Also, the absence of differences in the expression ratio of each genotype between geographical populations indicates that the observed variation likely cannot be attributed to population-specific effects independent of HBB genotype, such as neutral divergence due to genetic drift (Staubach et al., 2010; Bryk et al., 2013). Rather, our findings are consistent with either an increase of expression of the Cys52 allele or decrease of expression of the Ser52 allele, or both. Such a pattern can be explained most reasonably by linkage disequilibrium between the HBB-T1 polymorphism and a regulatory genetic variant that influences HBB-T1 expression (Morley et al., 2004; Dimas et al., 2008). The basis for this regulatory polymorphism is presently unknown, but it can possibly be a SNP in a regulatory region, such as a promotor or enhancer, which is physically linked to HBB-T1 (cis-acting) and binds a trans-acting factor to regulate mRNA abundance (Stuve and Myers, 1990; Signor and Nuzhdin, 2018).
Interestingly, a similar pattern of allelic differences in gene expression seems to be present in the low-expression HBB-T2 paralog (Figure 1), although not statistically significant, which indicates the same cis-acting polymorphism may be found close to HBB-T2, possibly as a result of gene conversion with HBB-T1.
Balanced synthesis of α and β chains is necessary for the normal development and function of RBCs and sole upregulation or downregulation of a HBB gene would likely be deleterious, as it would distort the chain stoichiometry (Chaisue et al., 2007). Therefore, some type of compensatory regulatory mechanism most likely exists (Glassberg et al., 2019), whereby the HBB-T1 change leads to a compensatory adjustment of the expression of HBB-T2 (cis-acting) or of both genes (trans-acting) (Signor and Nuzhdin, 2018).
Possible Evolutionary Consequences
If, as our results indicate, the relative abundance in bank vole RBCs of the Hb tetramers that incorporate β-globin chains that differ in Cys content (Ser52 vs. Cys52 allele) is modulated by cis-regulatory genetic variation, it may have important evolutionary implications. Similar to reactive cysteine-containing Hbs of other rodents (Rossi et al., 1998; Storz et al., 2012), bank vole isoform incorporating the β-globin chain encoded by the Cys52 allele (Hb F) significantly increases the resistance of RBCs to oxidative stress (Kotlík et al., 2014). This resistant phenotype is explained by Hb F taking part in the RBC protein redox system involved in ROS detoxification via the highly-reactive thiol (–SH) group of Cys52, together with the glutathione (GSH) redox system (Rossi et al., 1998; Kotlík et al., 2014; Petersen et al., 2017). Because of the very high concentration of Hb in RBCs, regulatory variation differentially affecting the contribution of the β-globin alleles that differ in Cys content to Hb could provide an effective mechanism for modulating the antioxidant capacity of RBCs (Rossi et al., 1998; Storz et al., 2012; Petersen et al., 2017). A high proportion of redox-active Hb is likely beneficial under conditions conducive to oxidative stress (Rossi et al., 1998; Storz et al., 2012; Kotlík et al., 2014). However, Cys is a precursor for a variety of vital biomolecules, including GSH, and its potential limiting role is considered the source of physiological trade-offs in various organisms (Romero-Haro and Alonso-Alvarez, 2015; Galván, 2018). In the bank vole, there is likely a trade-off between the use of Cys for Hb synthesis and its use for synthesis of other biomolecules (including GSH), with the outcome of this trade-off possibly being linked to the levels of environmental oxidative stress (Strážnická et al., 2018). Therefore, it has been proposed that the allelic as well as interlocus variation in Hb Cys content provides a means of adjusting the RBC thiol level within populations (Strážnická et al., 2018), maintaining it high enough to provide protection against oxidative damage in RBCs, but without critically reducing the Cys availability for other biosynthetic processes (Beutler et al., 1998; Strážnická et al., 2018). Thus, although they require further empirical evidence, the results of the present study suggest the intriguing possibility that gene regulatory polymorphism may contribute to adaptation of the RBC phenotype in the bank vole by helping to fine-tune the intracellular redox-active thiol levels in response to selection. Therefore, we posit that the β-globin system of the bank vole can serve as a novel model system to study the interaction of gene-regulatory variation with a well-defined protein-coding variation controlling an adaptive physiological trait.
Data Availability Statement
All datasets generated for this study are included in the article/Supplementary Material.
Author Contributions
VD, LN, SM, and MH carried out the experiments. VD and LN analyzed data. VD and PK wrote the manuscript. PK conceived and supervised the study. All authors commented on the manuscript.
Funding
This study was carried out with the financial support from the Czech Science Foundation (Grant No. 16-03248S) and from the Ministry of Education, Youth and Sports of the Czech Republic (project EXCELLENCE CZ.02.1.01/0.0/0.0/15_003/0000460 OP RDE). Part of this research was performed while PK was a Visiting Scholar at Cornell University, supported by the project CZ.02.2.69/0.0/0.0/16_027/0008502, under the call 02_16_027 International Mobility of Researchers (MEYS, OP RDE).
Conflict of Interest
The authors declare that the research was conducted in the absence of any commercial or financial relationships that could be construed as a potential conflict of interest.
Acknowledgments
Lawrence J. Weider (University of Oklahoma) and Ahmed Gad (IAPG CAS) provided useful comments and suggestions.
Supplementary Material
The Supplementary Material for this article can be found online at: https://www.frontiersin.org/articles/10.3389/fevo.2019.00514/full#supplementary-material
References
Avise, J. C. (2000). Phylogeography: The History and Formation of Species. Cambridge, MA: Harvard University Press.
Beutler, E., Gelbart, T., and Demina, A. (1998). Racial variability in the UDP-glucuronosyltransferase 1 (UGT1A1) promoter: a balanced polymorphism for regulation of bilirubin metabolism? Proc. Natl. Acad. Sci. U.S.A. 95, 8170–8174. doi: 10.1073/pnas.95.14.8170
Brodsky, I., Dennis, L. H., and Kahn, S. B. (1966). Normal mouse erythropoiesis : I. The role of the spleen in mouse erythropoiesis. Cancer Res. 26:5.
Bryk, J., Somel, M., Lorenc, A., and Teschke, M. (2013). Early gene expression divergence between allopatric populations of the house mouse (Mus musculus domesticus). Ecol. Evol. 3, 558–568. doi: 10.1002/ece3.447
Bustin, S. A., Benes, V., Garson, J. A., Hellemans, J., Huggett, J., Kubista, M., et al. (2009). The MIQE guidelines: minimum information for publication of quantitative real-time PCR experiments. Clin. Chem. 55, 611–622. doi: 10.1373/clinchem.2008.112797
Camacho Londoño, J., and Philipp, S. E. (2016). A reliable method for quantification of splice variants using RT-qPCR. BMC Mol. Biol. 17:8. doi: 10.1186/s12867-016-0060-1
Chaisue, C., Kitcharoen, S., Wilairat, P., Jetsrisuparb, A., Fucharoen, G., and Fucharoen, S. (2007). α/β-Globin mRNA ratio determination by multiplex quantitative real-time reverse transcription-polymerase chain reaction as an indicator of globin gene function. Clin. Biochem. 40, 1373–1377. doi: 10.1016/j.clinbiochem.2007.08.005
Deffontaine, V., Libois, R., Kotlík, P., Sommer, R., Nieberding, C., Paradis, E., et al. (2005). Beyond the Mediterranean peninsulas: evidence of central European glacial refugia for a temperate forest mammal species, the bank vole (Clethrionomys glareolus). Mol. Ecol. 14, 1727–1739. doi: 10.1111/j.1365-294X.2005.02506.x
Dimas, A. S., Stranger, B. E., Beazley, C., Finn, R. D., Ingle, C. E., Forrest, M. S., et al. (2008). Modifier effects between regulatory and protein-coding variation. PLoS Genet. 4:e1000244. doi: 10.1371/journal.pgen.1000244
Eissa, N., Kermarrec, L., Hussein, H., Bernstein, C. N., and Ghia, J. E. (2017). Appropriateness of reference genes for normalizing messenger RNA in mouse 2,4-dinitrobenzene sulfonic acid (DNBS)-induced colitis using quantitative real time PCR. Sci. Rep. 7:42427. doi: 10.1038/srep42427
Filipi, K., Marková, S., Searle, J. B., and Kotlík, P. (2015). Mitogenomic phylogenetics of the bank vole Clethrionomys glareolus, a model system for studying end-glacial colonization of Europe. Mol. Phylogenet. Evol. 82, 245–257. doi: 10.1016/j.ympev.2014.10.016
Fraser, H. B. (2013). Gene expression drives local adaptation in humans. Genome Res. 23, 1089–1096. doi: 10.1101/gr.152710.112
Galván, I. (2018). Predation risk determines pigmentation phenotype in nuthatches by melanin-related gene expression effects. J. Evol. Biol. 31, 1760–1771. doi: 10.1111/jeb.13379
Gaudry, M. J., Storz, J. F., Butts, G. T., Campbell, K. L., and Hoffmann, F. G. (2014). Repeated evolution of chimeric fusion genes in the β-globin gene family of Laurasiatherian mammals. Genome Biol. Evol. 6, 1219–1233. doi: 10.1093/gbe/evu097
Glassberg, E. C., Gao, Z., Harpak, A., Lan, X., and Pritchard, J. K. (2019). Evidence for weak selective constraint on human gene expression. Genetics 211, 757–772. doi: 10.1534/genetics.118.301833
Goetz, M. P. (2006). A two-gene expression ratio of homeobox 13 and interleukin-17B receptor for prediction of recurrence and survival in women receiving adjuvant tamoxifen. Clin. Cancer Res. 12, 2080–2087. doi: 10.1158/1078-0432.CCR-05-1263
Hall, S. J. G. (1979). Haemoglobin polymorphism in the Bank vole, Clethrionomys glareolus, in Britain. J. Zool. 187, 153–160. doi: 10.1111/j.1469-7998.1979.tb03939.x
Harrison, P. W., Wright, A. E., and Mank, J. E. (2012). The evolution of gene expression and the transcriptome–phenotype relationship. Semin. Cell Dev. Biol. 23, 222–229. doi: 10.1016/j.semcdb.2011.12.004
Hoekstra, H. E., Drumm, K. E., and Nachman, M. W. (2004). Ecological genetics of adaptive color polymorphism in pocket mice: geographic variation in selected and neutral genes. Evolution 58, 1329–1341. doi: 10.1111/j.0014-3820.2004.tb01711.x
Hoffmann, F. G., Opazo, J. C., and Storz, J. F. (2008). New genes originated via multiple recombinational pathways in the β-globin gene family of rodents. Mol. Biol. Evol. 25, 2589–2600. doi: 10.1093/molbev/msn200
Kotlík, P., Marková, S., Konczal, M., Babik, W., and Searle, J. B. (2018). Genomics of end-Pleistocene population replacement in a small mammal. Proc. R. Soc. B Biol. Sci. 285:20172624. doi: 10.1098/rspb.2017.2624
Kotlík, P., Marková, S., Vojtek, L., Stratil, A., Šlechta, V., Hyršl, P., et al. (2014). Adaptive phylogeography: functional divergence between haemoglobins derived from different glacial refugia in the bank vole. Proc. R. Soc. B Biol. Sci. 281, 20140021–20140021. doi: 10.1098/rspb.2014.0021
Laurie, C. C., Bridgham, J. T., and Choudhary, M. (1991). Associations between DNA sequence variation and variation in expression of the Adh gene in natural populations of Drosophila melanogaster. Genetics 129, 489–499.
Li, M., Wu, X., Guo, X., Bao, P., Ding, X., Chu, M., et al. (2017). Identification of optimal reference genes for examination of gene expression in different tissues of fetal yaks. Czech J. Anim. Sci. 62, 426–434. doi: 10.17221/75/2016-CJAS
Livak, K. J., and Schmittgen, T. D. (2001). Analysis of relative gene expression data using real-time quantitative PCR and the 2–ΔΔCT method. Methods 25, 402–408. doi: 10.1006/meth.2001.1262
Ma, X. J., Wang, Z., Ryan, P. D., Isakoff, S. J., Barmettler, A., Fuller, A., et al. (2004). A two-gene expression ratio predicts clinical outcome in breast cancer patients treated with tamoxifen. Cancer Cell 5, 607–616. doi: 10.1016/j.ccr.2004.05.015
Marková, S., Searle, J. B., and Kotlík, P. (2014). Relaxed functional constraints on triplicate α-globin gene in the bank vole suggest a different evolutionary history from other rodents. Heredity 113, 64–73. doi: 10.1038/hdy.2014.12
McCurdy, R. D., McGrath, J. J., and Mackay-Sim, A. (2008). Validation of the comparative quantification method of real-time PCR analysis and a cautionary tale of housekeeping gene selection. Gene Ther. Mol. Biol. 12, 15–24.
Mitchell-Olds, T., Willis, J. H., and Goldstein, D. B. (2007). Which evolutionary processes influence natural genetic variation for phenotypic traits? Nat. Rev. Genet. 8, 845–856. doi: 10.1038/nrg2207
Morley, M., Molony, C. M., Weber, T. M., Devlin, J. L., Ewens, K. G., Spielman, R. S., et al. (2004). Genetic analysis of genome-wide variation in human gene expression. Nature 430, 743–747. doi: 10.1038/nature02797
Petersen, A. G., Petersen, S. V., Frische, S., Drakulic, S., Golas, M. M., Sander, B., et al. (2017). Hemoglobin polymerization via disulfide bond formation in the hypoxia-tolerant turtle Trachemys scripta: implications for antioxidant defense and O2 transport. Am. J. Physiol. Regul. Integr. Comp. Physiol. 314, R84–R93. doi: 10.1152/ajpregu.00024.2017
Pfaffl, M. W. (2001). A new mathematical model for relative quantification in real-time RT–PCR. Nucleic Acids Res. 29:e45. doi: 10.1093/nar/29.9.e45
Pfaffl, M. W., Tichopad, A., Prgomet, C., and Neuvians, T. P. (2004). Determination of stable housekeeping genes, differentially regulated target genes and sample integrity: BestKeeper – excel-based tool using pair-wise correlations. Biotechnol. Lett. 26, 509–515. doi: 10.1023/B:BILE.0000019559.84305.47
Reischl, E., Dafre, A. L., Franco, J. L., and Wilhelm Filho, D. (2007). Distribution, adaptation and physiological meaning of thiols from vertebrate hemoglobins. Comp. Biochem. Physiol. Part C Toxicol. Pharmacol. 146, 22–53. doi: 10.1016/j.cbpc.2006.07.015
Ren, S., Zhang, F., Li, C., Jia, C., Li, S., Xi, H., et al. (2010). Selection of housekeeping genes for use in quantitative reverse transcription PCR assays on the murine cornea. Mol. Vis. 16, 1076–1086.
Rieu, I., and Powers, S. J. (2009). Real-time quantitative RT-PCR: design, calculations, and statistics. Plant Cell 21, 1031–1033. doi: 10.1105/tpc.109.066001
Romero-Haro, A. A., and Alonso-Alvarez, C. (2015). The level of an intracellular antioxidant during development determines the adult phenotype in a bird species: a potential organizer role for glutathione. Am. Nat. 185, 390–405. doi: 10.1086/679613
Rossi, R., Barra, D., Bellelli, A., Boumis, G., Canofeni, S., Simplicio, P. D., et al. (1998). Fast-reacting thiols in rat hemoglobins can intercept damaging species in erythrocytes more efficiently than glutathione. J. Biol. Chem. 273, 19198–19206. doi: 10.1074/jbc.273.30.19198
Runck, A. M., Moriyama, H., and Storz, J. F. (2009). Evolution of duplicated beta-globin genes and the structural basis of hemoglobin isoform differentiation in Mus. Mol. Biol. Evol. 26, 2521–2532. doi: 10.1093/molbev/msp165
Sandkam, B. A., Young, C. M., and Breden, F. (2015a). Beauty in the eyes of the beholders: colour vision is tuned to mate preference in the Trinidadian guppy (Poecilia reticulata). Mol. Ecol. 24, 596–609. doi: 10.1111/mec.13058
Sandkam, B. A., Young, C. M., Breden, F. M. W., Bourne, G. R., and Breden, F. (2015b). Color vision varies more among populations than among species of live-bearing fish from South America. BMC Evol. Biol. 15:225. doi: 10.1186/s12862-015-0501-3
Signor, S. A., and Nuzhdin, S. V. (2018). The evolution of gene expression in cis and trans. Trends Genet. 34, 532–544. doi: 10.1016/j.tig.2018.03.007
Stankiewicz, A. M., Goscik, J., Swiergiel, A. H., Majewska, A., Wieczorek, M., Juszczak, G. R., et al. (2014). Social stress increases expression of hemoglobin genes in mouse prefrontal cortex. BMC Neurosci. 15:130. doi: 10.1186/s12868-014-0130-6
Staubach, F., Teschke, M., Voolstra, C. R., Wolf, J. B. W., and Tautz, D. (2010). A test of the neutral model of expression change in natural populations of house mouse subspecies. Evolution 64, 549–560. doi: 10.1111/j.1558-5646.2009.00818.x
Steiner, C. C., Weber, J. N., and Hoekstra, H. E. (2007). Adaptive variation in beach mice produced by two interacting pigmentation genes. PLoS Biol. 5:e219. doi: 10.1371/journal.pbio.0050219
Storz, J. F. (2019). Hemoglobin: Insights Into Protein Structure, Function, and Evolution. Oxford: Oxford University Press.
Storz, J. F., Runck, A. M., Moriyama, H., Weber, R. E., and Fago, A. (2010). Genetic differences in hemoglobin function between highland and lowland deer mice. J. Exp. Biol. 213, 2565–2574. doi: 10.1242/jeb.042598
Storz, J. F., Runck, A. M., Sabatino, S. J., Kelly, J. K., Ferrand, N., Moriyama, H., et al. (2009). Evolutionary and functional insights into the mechanism underlying high-altitude adaptation of deer mouse hemoglobin. Proc. Natl. Acad. Sci. U.S.A. 106, 14450–14455. doi: 10.1073/pnas.0905224106
Storz, J. F., Weber, R. E., and Fago, A. (2012). Oxygenation properties and oxidation rates of mouse hemoglobins that differ in reactive cysteine content. Comp. Biochem. Physiol. A. Mol. Integr. Physiol. 161, 265–270. doi: 10.1016/j.cbpa.2011.11.004
Strážnická, M., Marková, S., Searle, J. B., and Kotlík, P. (2018). Playing hide-and-seek in beta-globin genes: gene conversion transferring a beneficial mutation between differentially expressed gene duplicates. Genes 9:492. doi: 10.3390/genes9100492
Stuve, L. L., and Myers, R. M. (1990). A directly repeated sequence in the beta-globin promoter regulates transcription in murine erythroleukemia cells. Mol. Cell. Biol. 10, 972–981. doi: 10.1128/MCB.10.3.972
Swiergosz-Kowalewska, R., Bednarska, A., and Callaghan, A. (2007). Expression of metallothionein genes I and II in bank vole Clethrionomys glareolus populations chronically exposed in situ to heavy metals. Environ. Sci. Technol. 41, 1032–1037. doi: 10.1021/es0616276
Thompson, A., Vo, D., Comfort, C., and Zakon, H. H. (2014). Expression evolution facilitated the convergent neofunctionalization of a sodium channel gene. Mol. Biol. Evol. 31, 1941–1955. doi: 10.1093/molbev/msu145
Weich, N., Marks, P. A., and Rifkind, R. A. (1988). Regulation of murine α-, βmajor-, and βminor-globin gene expression. Biochem. Biophys. Res. Commun. 150, 204–211. doi: 10.1016/0006-291X(88)90506-2
Wheat, C. W., Watt, W. B., Pollock, D. D., and Schulte, P. M. (2006). From DNA to fitness differences: sequences and structures of adaptive variants of colias phosphoglucose isomerase (PGI). Mol. Biol. Evol. 23, 499–512. doi: 10.1093/molbev/msj062
Whitney, J. B. (1977). Differential control of the synthesis of two hemoglobin β chains in normal mice. Cell 12, 863–871. doi: 10.1016/0092-8674(77)90150-7
Yokoyama, S., Tada, T., Zhang, H., and Britt, L. (2008). Elucidation of phenotypic adaptations: Molecular analyses of dim-light vision proteins in vertebrates. Proc. Natl. Acad. Sci. U.S.A. 105, 13480–13485. doi: 10.1073/pnas.0802426105
Zarzycka, M., Gorowska-Wojtowicz, E., Tworzydlo, W., Klak, A., Kozub, K., Hejmej, A., et al. (2016). Are aryl hydrocarbon receptor and G-protein–coupled receptor 30 involved in the regulation of seasonal testis activity in photosensitive rodent—the bank vole (Myodes glareolus)? Theriogenology 86, 674–686.e1. doi: 10.1016/j.theriogenology.2016.02.019
Keywords: cysteine, gene expression, hemoglobin, Clethrionomys glareolus, oxidative stress, regulatory variation
Citation: Dvořáková V, Horníková M, Němcová L, Marková S and Kotlík P (2020) Regulatory Variation in Functionally Polymorphic Globin Genes of the Bank Vole: A Possible Role for Adaptation. Front. Ecol. Evol. 7:514. doi: 10.3389/fevo.2019.00514
Received: 27 August 2019; Accepted: 18 December 2019;
Published: 14 January 2020.
Edited by:
TingFung Chan, The Chinese University of Hong Kong, ChinaReviewed by:
Federico Guillermo Hoffmann, Mississippi State University, United StatesNatalia Martinkova, The Czech Academy of Sciences (ASCR), Czechia
Copyright © 2020 Dvořáková, Horníková, Němcová, Marková and Kotlík. This is an open-access article distributed under the terms of the Creative Commons Attribution License (CC BY). The use, distribution or reproduction in other forums is permitted, provided the original author(s) and the copyright owner(s) are credited and that the original publication in this journal is cited, in accordance with accepted academic practice. No use, distribution or reproduction is permitted which does not comply with these terms.
*Correspondence: Petr Kotlík, kotlik@iapg.cas.cz