Using Google Street View photographs to assess long-term outdoor thermal perception and thermal comfort in the urban environment during heatwaves
 Jan Urban
 Miroslav Pikl
 František Zemek
 Jan Novotný1
- 1Global Change Research Institute, Czech Academy of Sciences, Brno, Czechia
- 2Department of Landscape Management, University of South Bohemia in České Budějovice, České Budějovice, Czechia
The outdoor thermal comfort of urban residents is negatively affected by heatwaves that are becoming more frequent and severe with the ongoing climate crisis. As such, the assessment of outdoor perception and comfort during heatwaves has become an important ingredient of successful urban adaptation strategies. However, systematic assessment of long-term thermal perception across a large number of places and large populations of people is difficult. In this study, we consider an approach to the assessment of long-term thermal perception that combines features of currently used approaches (i.e., use of rating scales of thermal perception, use of surveys, and the use of photographs representing places) and we provide some preliminary validation of this approach. Specifically, across three studies conducted in two Czech cities, we show that long-term thermal perceptions for a large sample of 1,856 urban places can be elicited in a large sample of city residents (total N = 1,812) using rating scales in off-site surveys complemented with visual representations of the target locations. In Studies 1 and 2, we partially validate this approach by showing that such long-term thermal perceptions can be traced back to average surface temperature, sky-view factor, and the presence of blue and green infrastructure, all factors that the literature relates to thermal perception. Moreover, we show evidence that observers can reliably glean these properties from the visual representation of places. In Study 3, we provide additional evidence of the predictive validity of such long-term thermal perceptions by showing that they predict place-related activities (waiting and walking) and the place preference of other people more than one year later. Thus, this approach to the measurement of long-term thermal perception related to heatwaves can be a useful addition to currently used approaches.
1 Introduction
The climate crisis will increase the frequency and severity of heatwave impacts in urban areas resulting in many detrimental effects on residents, including negative impacts on their thermal comfort (Shukla et al., 2019; Aram et al., 2020). For urban adaptations to be effective and efficient, adaptation measures should prioritize those urban areas where the impacts on residents’ thermal comfort are potentially the largest (Aram et al., 2020).
One of the aspects of outdoor thermal comfort that is particularly relevant for policymakers is the long-term (subjective) thermal perception (Lenzholzer, 2010). Long-term thermal perception is essentially a thermal expectation that people associate with a certain place they know but also places that have not yet visited. Long-term thermal perceptions are based on people’s experience with the environment and with similar environments (Nikolopoulou et al., 2001; Lenzholzer, 2010; Eysenck and Brysbaert, 2018). Such long-term thermal expectations are important because they influence how people adapt to thermal conditions by, for instance, adjusting their clothing style or changing their commuting patterns (Langevin et al., 2015; Sun et al., 2018).
In this study, we present an approach to the assessment of long-term thermal perception that combines features of currently used approaches (i.e., use of rating scales of thermal perception, use of surveys, and the use of photographs representing places) and we provide some preliminary validation of this approach. We believe that this approach might be useful for theoretical as well as practical purposes as it offers some methodological benefits, namely that it can cover large representative samples of spatial points and participants and thus allow for valid generalizations.
2 Outdoor thermal perceptions
Early research in thermal perception focused almost exclusively on the physiological aspects of thermal perception. Researchers have developed complex indices to characterize indoor perception such as the Standard Effective Temperature and Predicted Mean Vote (Fanger, 1970) to characterize expected thermal comfort based on micro-climatic characteristics such as air temperature, air movement, relative humidity, radiant temperature, and a host of personal characteristics such as clothing and metabolic level. Similarly, complex indices, such as the Physiological Equivalent Temperature (Mayer and Höppe, 1987) and Outdoor Standard Effective Temperature (Pickup and de Dear, 2000) were later developed to characterize the physiological aspects of outdoor thermal perception based on micro-climatic and personal variables.
Although the physiological aspects of thermal perception are important, some literature points to the limitations of physiological models of thermal perception (Auliciems, 1981) and the importance of psychological aspects of thermal perception and thermal comfort (Nikolopoulou et al., 2001; Thorsson et al., 2004). The literature also shows that subjective thermal perception is important because it is predictive of the use of public spaces (Eliasson et al., 2007; Walton et al., 2007) and outdoor activities (Thorsson et al., 2007).
2.1 Long-term thermal perception
Especially of interest to policymakers is long-term thermal perception, sometimes referred to as thermal expectation (Lenzholzer, 2010). Long-term thermal perception is based on people’s experience with the environment and with similar environments (Nikolopoulou et al., 2001; Lenzholzer, 2010; Eysenck and Brysbaert, 2018). People plan their outdoor activities based on their thermal expectations; long-term thermal expectations also influence how people adapt to thermal conditions by, for instance, adjusting their clothing style or changing their commuting patterns (Langevin et al., 2015; Sun et al., 2018). The long-term thermal perception of places is based on repetitive experiences with these and similar places; these repeated experiences become ingrained in people’s memory (Klemm et al., 2015a).
Some scholars have suggested that people use visual cues available in the environment to infer their thermal perception of that environment (Lenzholzer and van der Wulp, 2010). Such attribution is probably driven by a well-known psychological mechanism whereby people use distal cues to infer probabilistically properties of objects that they cannot directly observe (Brunswik, 1956). For instance, squares that are very wide, open, or decorated with materials considered “cold” (e.g., stone and concrete) are perceived as uncomfortable (Lenzholzer and van der Wulp, 2010). On the other hand, the presence of green infrastructure improves perceived thermal comfort (Klemm et al., 2015b), as we will discuss in some detail later.
3 Approaches to assessment of outdoor thermal perception
3.1 Subjective thermal perception votes
One of the approaches to thermal perception assessment is based on the use of subjective thermal perception scales. For instance, Ahmed (2003) conducted a survey in six locations in the city of Dhaka, Bangladesh, which represented six local climate zones (e.g., street canyons). He then related the personal thermal sensation votes of interviewees with the micro-climatic characteristics of the climate zones to identify which zones were perceived as more ambient and under what conditions. Another study by Katzschner (2004) explored momentary thermal perception in two squares in the city of Kassel, Germany using a five-point Likert scale of thermal perception. The study resulted in maps of perceived thermal comfort of selected localities but did not result in a comparison of subjective thermal perception and objective thermal data. However, the correspondence between the micro-climatic conditions (sky clearness index, wind speed, and air temperature) and subjective thermal perception in four places (square, courtyard, park, waterfront) in the city of Gothenburg, Sweden, was clearly found in a study by Eliasson et al. (2007). A more dynamic and continuous picture of thermal perception can be obtained with the relatively new method of thermal walks whereby micro-climatic data together with subjective data from participant questionnaires can be gathered over the course of a pedestrian route (Vasilikou and Nikolopoulou, 2020). One of the limitations of existing studies using subjective thermal perception scales is that these typically evaluate perceptions related to a very limited number of specific places or spatial points.
3.2 Cognitive maps
As an alternative approach to thermal perception assessment, some researchers have used cognitive thermal perception maps (e.g., Lenzholzer, 2010; Lenzholzer and Koh, 2010; Lehnert et al., 2021) that can potentially cover large areas. In cognitive mapping, participants are typically asked to indicate, using maps, spatial areas where they think they would have certain thermal perceptions (such as feeling too cold or too hot). Such information can be then aggregated across all participants, resulting in a map that displays where most people would have certain thermal perceptions. Such cognitive mapping can be done for selected urban areas (Lenzholzer, 2010; e.g., Lenzholzer and Koh, 2010) or it can span a whole city (Lehnert et al., 2021).
Even though cognitive maps generally match other thermal perception data, they have been often found to overrepresent extreme thermal perceptions (Lenzholzer and Koh, 2010; Lehnert et al., 2021). In other words, participants tend to better recollect areas where they experienced extreme thermal perceptions, such as feeling too windy, too cold, or too hot. This is in line with psychological theorizing that highly negative phenomena (e.g., experiencing an extremely uncomfortable environment) affect human perception more than relatively positive phenomena (e.g., experiencing only a mildly uncomfortable environment; Rozin and Royzman, 2001). Another limitation of studies using cognitive maps (but also most studies using subjective rating scales) is that they are conducted on convenience samples of participants that do not represent any known population.
3.3 Photograph-assisted thermal perception assessment
Yet another but rather rare approach to the assessment of long-term thermal perceptions is based on the use of photographs to assist thermal perception measurement. Photographs can be used as stimuli in landscape analyses, particularly in studies of people’s preferences related to certain features of the landscape (Rodiek and Fried, 2005). Visual representation of places was also used by economists in choice experiments to represent any visually accessible attributes of places before people make decisions related to these places (Patterson et al., 2017). Some scholars have suggested that visual appraisal of photographs could help to get a better understanding of how observable features of the environment affect people’s perception of the microclimate (Lenzholzer and Koh, 2010). As such, photographs could potentially convey visual information upon which people base their long-term thermal perception.
Despite their potential usefulness in assisting the measurement of long-term thermal perception, photographs of places have been rarely used in the assessment of thermal perception in specific places. As far as we are aware, only the study by Cortesão et al. (2020) used photographs to assist thermal perception assessment. These authors used photographs of three different places in Porto, Portugal, and asked their participants to select the most comfortable and most uncomfortable environments among them. They found that these choices matched data from in situ measurements of thermal perceptions and suggested that the decision tasks using visual representations of places can complement conventional in situ assessment of thermal perception.
4 Effect of blue and green infrastructure on thermal perception
Perceived thermal comfort is linked to psychological, physical, psychological factors, and behavioral factors (Chen and Ng, 2012). Among these, naturalness and aesthetics of the place, and experience with the place play an important role as factors of perceived outdoor thermal comfort (Nikolopoulou and Steemers, 2003; Eliasson et al., 2007; Nikolopoulou, 2011).
Given these patterns of perceived thermal comfort, it is not surprising that the presence of green infrastructure improves thermal comfort in outdoor places (Höppe, 2002; Nikolopoulou and Steemers, 2003; Knez and Thorsson, 2006; Lin, 2009; Lenzholzer and van der Wulp, 2010; Klemm et al., 2015a, 2015a; Aram et al., 2019, 2020). There is also some evidence that the presence of blue (i.e., water) infrastructure improves thermal comfort in outdoor places, particularly in places that are exposed to high temperatures (Völker and Kistemann, 2011; Gao et al., 2018). This is, again, not surprising given that the presence of water infrastructure reduces heat load in outdoor spaces (Broadbent et al., 2018).
5 Current study
In this study, we propose an approach to long-term thermal perception assessment that combines previously used methods, namely the use of subjective rating scales of thermal perception, the use of photographs that assist thermal perception assessment, and survey-based elicitation of thermal perceptions. The approach that we propose can be easily scaled up across large samples of spatial points and a large number of participants. There are two potential benefits of this approach: 1) it can be used on a representative and large sample of spatial points representing a certain area (rather than on a set of arbitrarily selected spatial points), and 2) it can be administered to a large sample of participants representing a certain population (rather than convenience samples of participants).
We aim to partially validate this approach by showing that thermal perception ratings thus obtained are related to objective micro-climatic properties of places (average surface temperature) and that these ratings take into account place properties that are known to positively affect perceived thermal comfort (the presence of blue and green infrastructure). In addition, we also examine the predictive validity of long-term thermal perception ratings. Specifically, we are interested in whether average ratings of long-term thermal perceptions associated with places can predict outdoor activities (waiting and walking) in these places and preference for these places one year later.
5.1 Overview of studies
In Study 1, we conducted a survey of long-term thermal perception during summer heatwaves in the Czech city of České Budějovice and we looked at whether such thermal perception can be traced back to surface temperature, the presence of green and blue infrastructure, and the sky-view factor, as they should. Study 2 replicated the methodology in the Czech city of Brno. Finally, in Study 3, we looked at whether the long-term thermal perception measured in Study 2 was predictive of decision making regarding outdoor activities and place preference in the city of Brno one year later.
The case studies have been intentionally conducted in two typologically different cities. These differences concern climate, orography, and land cover. The city of Brno is located at the edge of the Pannonian biogeographical region. Summers are rather dry, with a sum of monthly precipitation of 60–80 mm, and hot, with the daily average temperature ranging between 21–23°C. The territory displays a significant orographic variability (190–385 m asl) and this–together with extended impervious surfaces–causes most of the water from precipitations to be drained away without being absorbed and could potentially impact microclimate by latent heat. The city of České Budějovice has a continental climate, the sum of monthly summer precipitation is 90–100 mm, the summer daily average temperature ranges between 19–21°C. The orography is smooth, with an average altitude of 405 m asl. The most typical features of the city and the whole region are open water bodies, both rivers, and manufactured ponds. Because of extended areas of grasslands, precipitation water can be absorbed and impact the local microclimate. The differences in the land cover of the two experimental sites can be recognized in Figure 1.
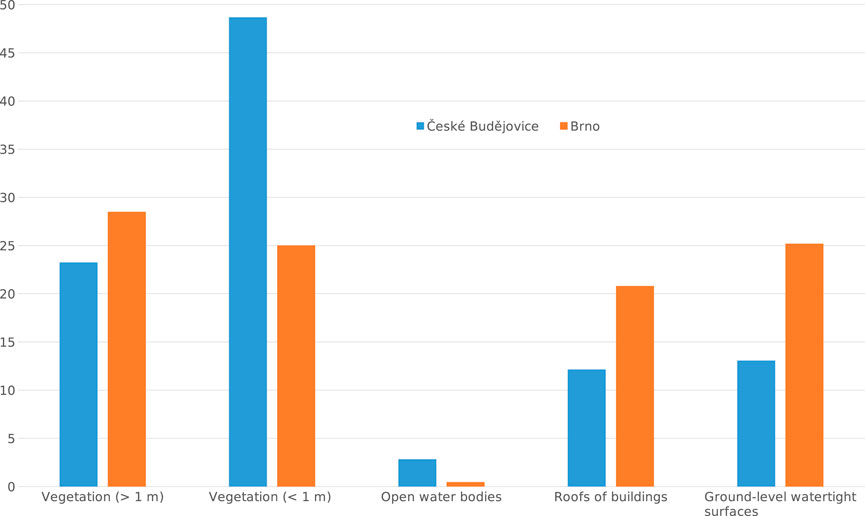
FIGURE 1. Proportion [%] of land cover and land use classes in the two experimental sites. Note. Vegetation (> 1 m) and vegetation (< 1 m) denote vegetation taller and smaller than 1 m. Source: based on remote sensing data from Study 1 and Study 2 (see respective Method sections for details).
6 Study 1: Thermal perception and comfort in the city of České Budějovice
In Study 1 we look at whether a survey-based approach that uses rating scales to measure long-term thermal perception and perceived thermal comfort in combination with photographs of selected localities in the city of České Budějovice can provide measurements of long-term thermal perception and perceived thermal comfort. More specifically, we are interested in whether such measurements can be traced back to surface temperature, the presence of blue and green infrastructure, and the sky-view factor, which should theoretically affect long-term thermal perception and thermal comfort. In addition, we also wanted to know how well city residents can glean information about the presence of blue and green infrastructure from photographs of the places.
6.1 Method and procedure
6.1.1 Participants
A sample of participants with permanent residentship in the city of České Budějovice, recruited from a database of a marketing agency, was invited to participate in an online study; 483 participants entered the study and 336 (69.6%) completed it in July and August 2019. We have removed observations from two participants who received visual stimuli that we could not fully match with remote sensing data on the sampled locations (these 30 m buffers were not fully covered by remote sensing data). The final sample of participants (N = 334) was fairly variable in terms of gender (74.5% were women), age (M = 37, SD = 12.8), and education (4.2% were people with primary education; 21.6% were people with secondary education without a high school diploma; 42.8% were people with a high school diploma; 31.4% were people with a university degree).
6.1.2 Materials
6.1.2.1 Development of visual stimuli
In České Budějovice, we defined a square encompassing a major part of the city; this square was defined by the coordinates E14.4255-14.5352, N48.940-49.0116 (see Figure 2). Note that we chose the square, rather than the administrative boundaries of the city because the square-shaped area was technically easier to sample spatial points from. Given that our aim here was to demonstrate a proof of the concept, rather than to generalize our results to administrative spatial units, this choice did not affect our conclusions.
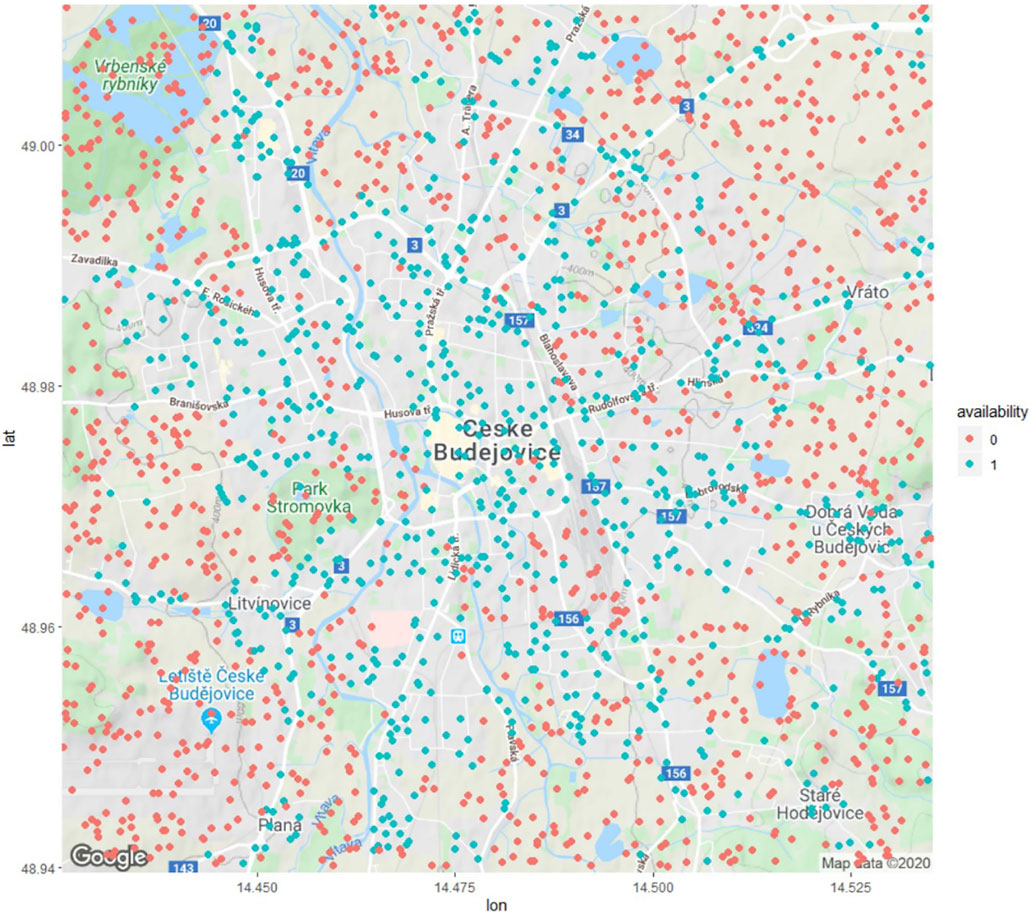
FIGURE 2. Availability of randomly selected locations in the Google Street View database (city of České Budějovice, Study 1). Note. Red and blue dots denote spatial points that were randomly selected within the square. Red dots denote locations that were not available in the database of Google Street View photographs, whereas blue dots denote locations that were available as Google Street View photographs and were used to develop visual stimuli for the current study.
Within this square, we randomly selected 2000 spatial points based on uniform distribution along the x- and y-axes. Using Google Street View Static API (Google Map, 2019b). Next, we searched the database of Google Street View to find the closest location within 20 m distance represented in the database. We found 799 locations that fulfilled these criteria (see Figure 2). For each of these locations, we downloaded, using Google API, four pictures from the Google Street View database showing northward, eastward, southward, and westward views from each location and we collated these pictures into one visual stimulus representing each location (see Figure 3 for an example of the stimuli). We then manually screened the photographs and excluded 58 pictures that depicted interiors of buildings, roads, highways, and overpasses where pedestrians cannot walk or stand nearby. The remaining set of 741 images was selected to be used in data collection. In reality, 739 images were drawn randomly at least once during the survey process by the web-based questionnaire. However, we had to exclude another 13 visual stimuli that could not be correctly matched against the remotely sensed data because the remotely sensed data did not fully cover the 30 m buffer for these locations. The visual stimuli thus represented a fairly representative sample of publicly accessible outdoor places within the selected sub-section of the city of České Budějovice.
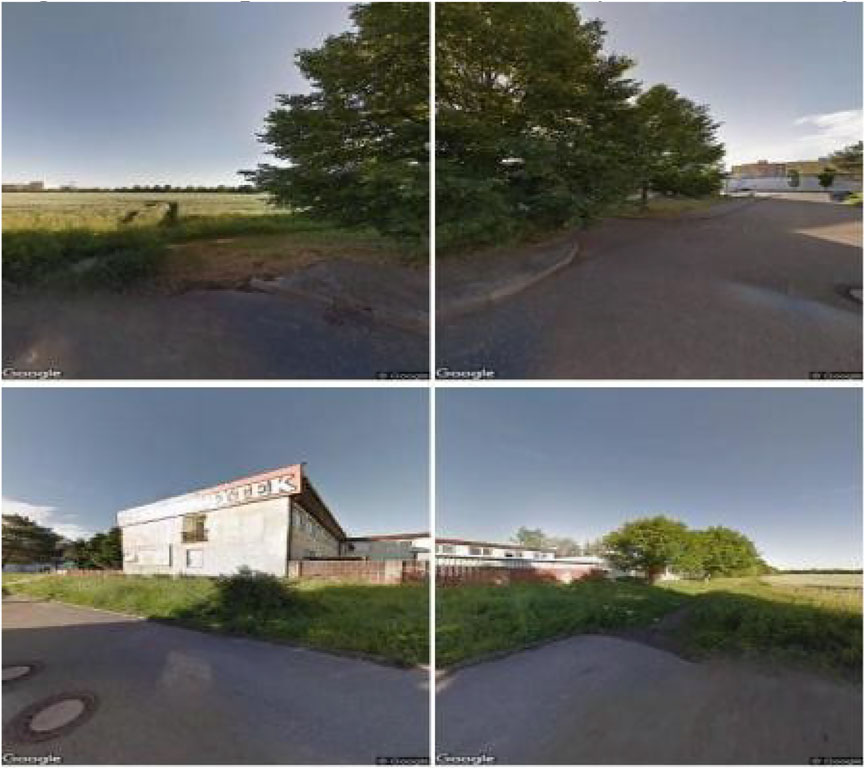
FIGURE 3. Example of visual stimuli (city of České Budějovice, Study 1). Note. The four pictures (from top left to bottom right) capture, respectively, northward, eastward, southward, and westward views from the selected location.
6.1.2.2 Remotely sensed independent variables
6.1.2.2.1 Land cover classes
Two normalized differential vegetation indices (VI) were calculated from reflectance images as inputs to classification:
Where RBx represents reflectance at wavelength Bx. The first VI used B1 = 800 nm and B2 = 670 nm and therefore corresponds to NDVI [23], commonly used to distinguish photosynthetically active vegetation. The second VI used B1 = 1,287 nm and B2 = 1,512 nm and enhanced differences in vegetation water content.
We classified the city’s surface from VIs and normalized Digital Surface Model data into the following five classes: 1) roofs of buildings, 2) vegetation >1 m, 3) vegetation ≤1 m, 4) other impervious surfaces (e.g., roads), and 5) open water bodies. The classification was performed in the eCognition software (Trimble, Inc.) that uses an “object-oriented approach” to analyze images. The process comprises two steps. Firstly, the image is segmented into objects with a defined degree of homogeneity of input parameters. Secondly, the objects are categorized into classes following a programmed decision tree.
Our decision tree used normalized Digital Surface Model to separate high objects (trees, buildings) from objects with low height (low vegetation, roads), then the two vegetation indices enabled distinction between vegetation and other surfaces. The classification accuracy was evaluated on 800 randomly selected points, which were visually validated. Overall classification accuracy reached 84%.
In the current analysis, we used three land cover classes, namely classes of low and high vegetation (capturing presence of green infrastructure), and the open water body class (capturing presence of blue infrastructure). These indicators were computed as the proportion of pixels of respective class within a 30 m buffer. These indicators were standardized prior to analyses. However, we could not match 13 of the selected locations with remotely sensed data due to incomplete coverage of the 30 m buffers at these locations. Unmatched observations (57 out of the total of 5,010 observations given by the combination of 15 trials over 334 participants) were not used in the analysis.
6.1.2.2.2 Land surface temperature
Land surfaces temperature image was obtained from the hyperspectral scanner TASI (8,000–11,000 nm). Data were acquired simultaneously with reflectance HS and LiDAR data. The radiometric and geometric preprocessing of thermal TASI data is identical to that of reflectance HS data. The calculation of land surface temperature (LST) is based on the Temperature and Emissivity Separation algorithm (TES, Pivovarnik et al., 2017). The measured radiance at sensor level (Lm) mainly consists of radiance emitted from the land surface, downwelling atmospheric radiance reflected by the surface (
where B (Ts) is the radiance of the surface at temperature Ts according to Planck’s law, ε is the surface’s emissivity, and τ is the atmospheric transmittance. The atmospheric parameters,
6.1.2.2.3 The sky-view factor
The sky-view factor was computed as a percentage of hemisphere representing the sky in SAGA GIS software (Conrad et al., 2015) from the digital surface model interpolated from the LiDAR data with a very high spatial resolution (0.25 m).
We used zonal statistics to calculate the number of pixels of each land cover class within a buffer zone of diameter 30 m around the target position, the average surface temperature of a zone, and the sky-view factor as the mean value of the sky-view factor from ground pixels (pixels classified as vegetation <1 m, impervious surfaces and water bodies). The sky-view factor was standardized before analyses.
6.1.2.3 Dependent variables based on survey responses
6.1.2.3.1 Rating of thermal perception
Participants assessed sequentially their long-term thermal perception at 15 randomly selected locations shown on visual stimuli. Specifically, participants indicated how they would describe the temperature that they would feel at each location “during a heatwave” using a seven point scale with seven labelled points (cool, slightly cool, neutral, slightly warm, warm, hot, extremely hot). Our scale was derived from the ASHRAE scale of thermal perception. The only difference was that in our scale, we added one point (extremely hot), and we removed one point (cold) from the original scale to allow for better differentiation in the higher thermal perception levels that we expected given that participants estimated their thermal perception during a heatwave. Note that this methodological decision was vindicate by the fact that the lowest category on our scale (cool) was used extremely rarely (0.9% of ratings), whereas the two highest categories were used frequently (hot in 27.0% of cases and extremely hot in 16.4% of cases).
6.1.2.3.2 Rating of thermal comfort
Participants used the same 15 randomly selected stimuli as in the thermal comfort measure but this time they sequentially rated how they would feel overall at the location shown in the stimulus during a heatwave using a seven-point scale (extremely uncomfortable, very uncomfortable, uncomfortable, neutral, pleasant, very pleasant, extremely pleasant).
6.1.2.4 Perceived properties of sampled locations
For the set of photographs of target points from České Budějovice, we performed manual coding of their content. Three coders evaluated six attributes of the photographs (whether the sky in the image is cloudy, whether there are bodies of water in the image, whether there are trees within 30 m distance, whether there are trees within 5 m, whether there is grass or shrubs within 5 m, and whether the location is shaded during the day by an artificial structure). Each attribute was independently rated by two coders, and if they disagreed, we used a third coder’s rating for that photograph. Inter-rater variability (i.e., inter-rater correlation of ratings) was moderate or reduced for all attributes: cloud cover rating, irr = 0.83; presence of water bodies, irr = 0.80; presence of trees, irr = 0.64; presence of nearby trees, irr = 0.63; presence of shrubs, irr = 0.62; presence of artificial shading, irr = 0.25. These results suggest that different people can identify blue and green infrastructure, and shading structures in the pictures rather similarly.
6.1.3 Procedure
After giving informed consent, each participant browsed a set of 15 randomly selected images of sampled locations in České Budějovice taken from Google Street View and indicated for each location whether they had ever been to that location. Subsequently, for the same 15-point images, participants rated the perceived heat they would feel at that location during a heatwave. Subsequently, participants rated, for the same 15 locations, how they would feel overall at that location during a heatwave. At the end of the questionnaire, participants answered two questions assessing subjective attention and concentration and three demographic questions (gender, age, education). Upon completion of the study, participants were directed to the web page of the opinion poll company, and they received a small reward for their participation in the study (20 CZK; equivalent to $0.85).
6.1.4 Analyses
We used correlational analysis to check the match between perceived properties and remotely sensed properties of sampled locations. This analysis shows whether people can glean information about the presence of blue and green infrastructure and exposure to the Sun from our visual stimuli. Further, we used a mixed ordinal logit model to analyze whether subjective ratings of long-term thermal perception and thermal comfort can be related to surface temperature, the presence of blue and green infrastructure, and the sky-view factor, as they theoretically should.
6.2 Results
6.2.1 Relationship between remotely sensed and perceived place attributes
Perceived attributes of each point determined by independent coders from pictures correlated with attributes of those points derived through methods of remote sensing regarding the presence of trees, rpb = 0.46 (point biserial correlation), presence of bush and shrub, rpb = 0.48, presence of water bodies, rpb = 0.70, and presence of obstacles that shade the area (i.e., with remotely-sensed sky-view factor), rpb = −0.50, all ps < 0.001. Expectedly, there was no relationship between sky cloudiness observed by coders on the visual stimuli and the mean direct irradiation recorded for each location by remote sensing, as the two sets of observations were made on different days. rpb = 0.03, p = 0.380. This was the reason why we did not include remotely sensed indicator of cloudiness (i.e., proxied by inverse of the direct irradiation) in our main models reported in the next two sections.
6.2.2 Thermal perception
As theoretically expected, the mixed ordinal logit model revealed that people’s subjective rating of long-term thermal perception at the sampled location was positively affected by land surface temperature based on remote sensing (see estimates of the reduced model in Table 1 for details). Importantly, the effect of surface temperature on long-term thermal perception was completely mediated by the presence of green and blue infrastructure and presence of shading elements (captured by the sky-view factor) as indicated by the fact that when these attributes were introduced in the model, the effect of surface temperature on thermal perception dropped significantly and became statistically insignificant (see estimates of the full model in Table 1 for details). This result suggests that survey participants used the presence of blue and green infrastructure and the presence of shading elements as cues that help them to determine their long-term thermal perception in each of the places. This interpretation is further supported by the fact that the presence of trees and bushes had the expected negative effect on thermal perception, whereas the sky-view factor had a positive effect on thermal perception. The presence of water did not have a statistically significant effect on thermal perception, probably due to the relative scarcity of blue infrastructure in sampled locations (see Supplementary Table SA1 in the Appendix for descriptives of independent variables).
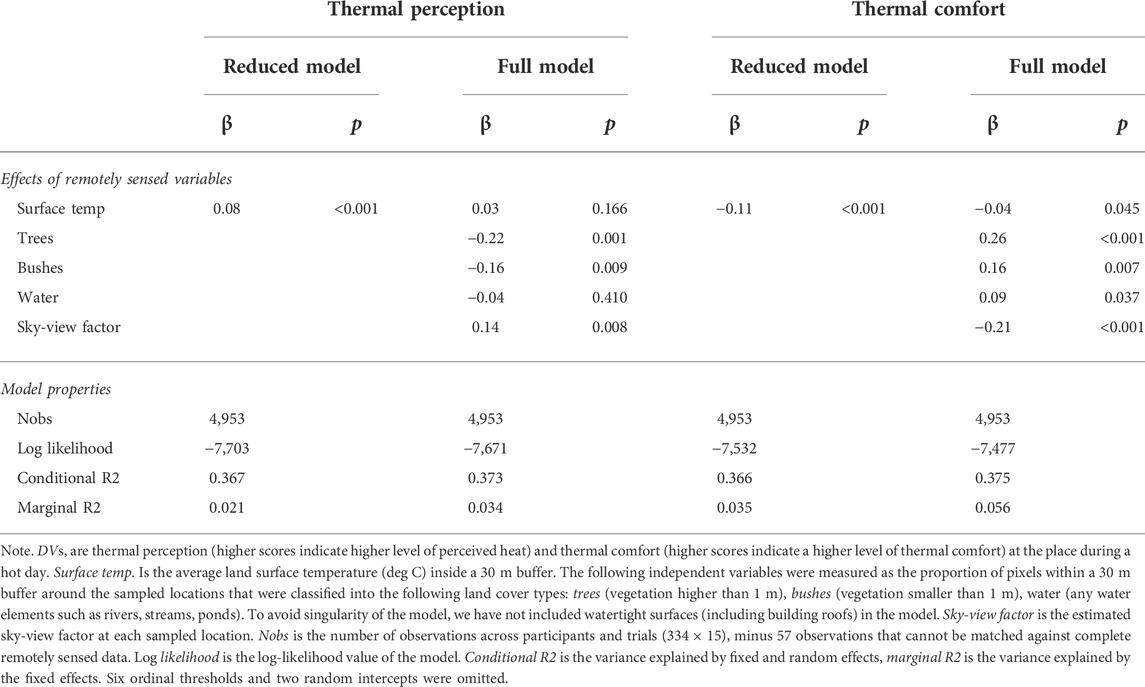
TABLE 1. Models of thermal perception and thermal comfort (mixed ordinal logit Model, city of České Budějovice, Study 1).
Importantly, we were able to partly corroborate the main results on a sub-sample of observations from participants who had little or no prior experience with the sampled locations and who had not visited them in the last year (79.1% of observations). Specifically, even these participants reported long-term thermal perception that matched remotely sensed surface temperature (see the reduced model in Supplementary Table SA2 for details). However, this relationship disappeared once we added remotely sensed indicators of the presence of the green and blue infrastructure and the sky-view factor in the model (see the reduced model in Supplementary Table SA2 for details). Again, this result suggests that people tend to estimate their long-term thermal perception using available visual cues, such as the presence of green and blue infrastructure and the presence of shading elements (inversely related to the sky-view factor). Indeed, the presence of trees had the expected negative effect whereas the sky-view factor had the expected positive effect on long-term thermal perception. The presence of bushes and water elements had no statistically significant effect on long-term thermal perception possibly due to the smaller size of the sub-sample which might have reduced the statistical power of the study.
6.2.3 Thermal comfort
The mixed ordinal logit model also revealed the theoretically expected negative effect of surface temperature (based on remote sensing) on the rating of expected thermal comfort (based on survey data; for details, see the reduced model in Table 1). This effect was partially mediated by the presence of blue and green infrastructure and the presence of shading elements (inversely related to the sky-view factor), suggesting, again, that participants estimated their expected thermal comfort based on visual cues available in the visual stimuli (i.e., presence of blue and green infrastructure and presence of shading elements). This conclusion is further supported by the fact that the presence of trees, bushes, and water and the sky-view factor are all statistically significantly related to the expected thermal comfort expressed by participants (see the full model in Table 1). Note that all these substantial results hold when the model is estimated on a sub-sample of observations from participants who have not visited these locations (for details, see Supplementary Table SA2).
6.3 Discussion of study 1
We corroborated in Study 1 that people use visual cues present in photographs of locations, such as the presence of blue and green infrastructure and the presence of shading elements to determine their long-term thermal perception and expected thermal comfort at each location during a hot day. These subjective judgments match objective properties of these locations (based on remote sensing data) that are known to affect thermal perception and comfort, such as land surface temperature, the presence of blue and green infrastructure, and shading of locations.
7 Study 2: Thermal perception in the city of Brno
Study 1 used a relatively small number of sampled locations and individual participants, potentially decreasing the statistical power of the study. In Study 2 we aimed to replicate the results from Study 1 using data from a larger sample of locations from the city of Brno and a larger sample of participants (Brno residents).
7.1 Method and procedure
7.1.1 Participants
A sample of participants with permanent residentship in the city of Brno, recruited from a database of a marketing agency, was invited to participate in an online study; 925 participants entered the study and 615 (66.5%) completed it in July and August 2019. The final sample of participants was fairly variable in terms of age (M = 37.2; SD = 12.5), gender (71.6% were women), and education (4.1% were people with primary education; 17.3% were people with secondary education without a high school diploma; 47.5% were people with a high school diploma; 31.1% were people with a university degree).
7.1.2 Materials
7.1.2.1 Development of visual stimuli
Similar to Study 1, we defined a square encompassing the wider city center of Brno; this square was defined by the coordinates E 16.552-16.66175, N 49.1592–49.2308 (see Figure 4). Within this square, we randomly selected (without replacement) 2000 spatial points; the uniform distribution of point selection probabilities along the x- and y-axes resulted in each point in the square having the same selection probability. Using Google Street View Static API (Google Map, 2019a), we searched the database of Google Street View pictures to find a picture that would represent this point or a nearest point within 20 m distance. Google Street View was available for 1,272 points. We manually screened the photographs and excluded 142 pictures that depicted interiors of buildings, roads, highways and overpasses where pedestrians cannot walk or stand nearby. The remaining set of 1,130 pictures was used as stimuli in data collection. The stimuli were processed as in Study 1 by collating the four views from each location (see Figure 5 for an example of the stimuli).
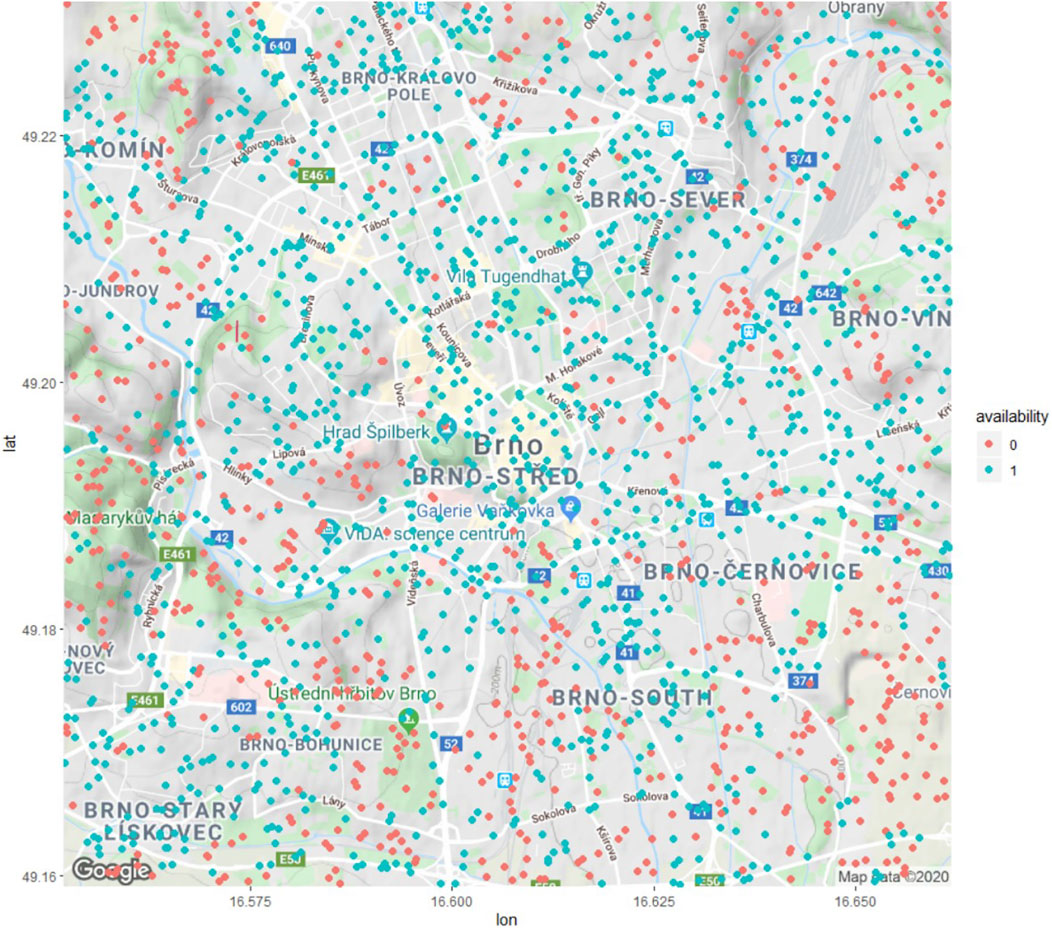
FIGURE 4. Availability of randomly selected locations in Google Street View database (city of Brno, Study 2). Note. Red and blue dots denote spatial points that were randomly selected within the square. Red dots denote locations that were not available in the database of Google Street View photographs, whereas blue dots denote locations that were available as Google Street View photographs and were used to develop visual stimuli for the current study.
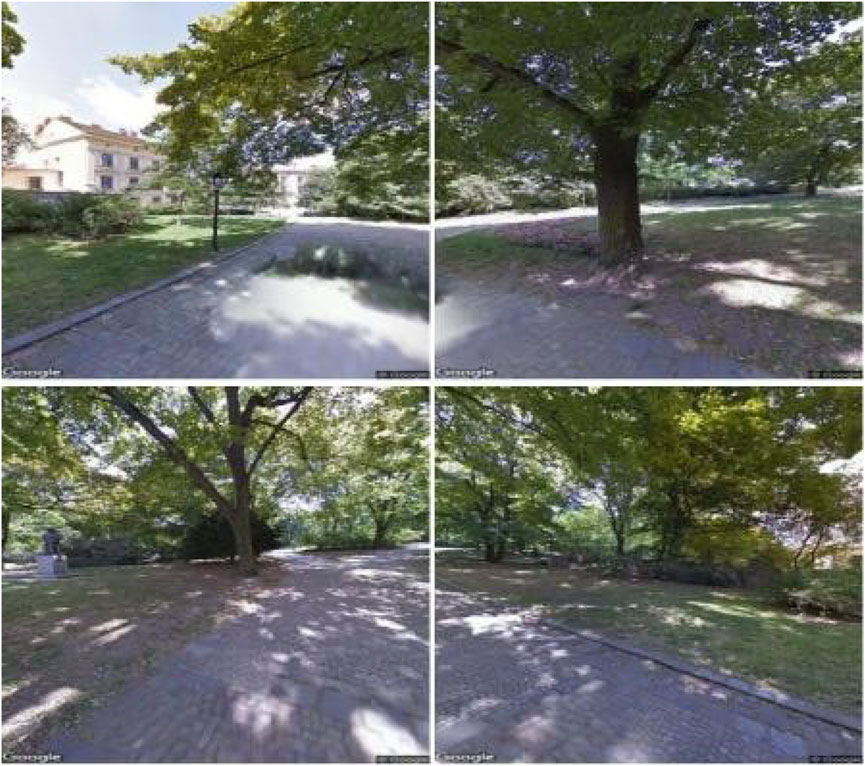
FIGURE 5. Example of visual stimuli (city of Brno, Study 2). Note. The four pictures (from top left to bottom right) capture, respectively, northward, eastward, southward, and westward views from the selected location.
7.1.2.2 Measures
We used the same measures as in Study 1.
7.1.3 Procedure and analyses
We used the same procedure and analyses as in Study 1.
7.2 Results
7.2.1 Relationship between remotely sensed and perceived place attributes
Perceived attributes of each point determined by independent coders from pictures correlated with attributes of those points derived through methods of remote sensing regarding the presence of trees, rpb = 0.47 (point biserial correlation), presence of bush and shrub, rpb = 0.40, presence of water, rpb = 0.46, and presence of obstacles that shade the area (i.e., with remotely-sensed sky-view factor), rpb = −0.52 all ps < 0.001. Expectedly, there was a relatively small match between mean direct irradiation at the moment of taking the remotely sensed data and rating of cloudiness on pictures of locations by raters, rpb = −0.12, p < 0.001, due to the fact that the two measurements capture different moments with different cloudiness. This was the reason why we did not include the remotely sensed indicator of cloudiness (i.e., proportional to the inverse of the direct irradiation) in our main model, similarly to Study 1.
7.2.2 Thermal perception
The results of Study 2 fully corroborated the results of Study 1. Specifically, we observed the theoretically expected positive relationship between (remotely sensed) surface temperature and (subjective survey-based) long-term thermal perception (for details, see the reduced model in Table 2). However, a large part of this relationship was mediated by the presence of blue and green infrastructure and the sky-view factor, suggesting that people used these attributes as visual cues when inspecting the visual stimuli and determining their long-term perceived thermal comfort at each location (for details, see the full model in Table 2). This conclusion is supported also by the fact that all remotely sensed characteristics of locations included in the model (i.e., presence of trees and bushes, presence of water, and sky-view factor) had theoretically expected effects on the subjective long-term thermal perception.
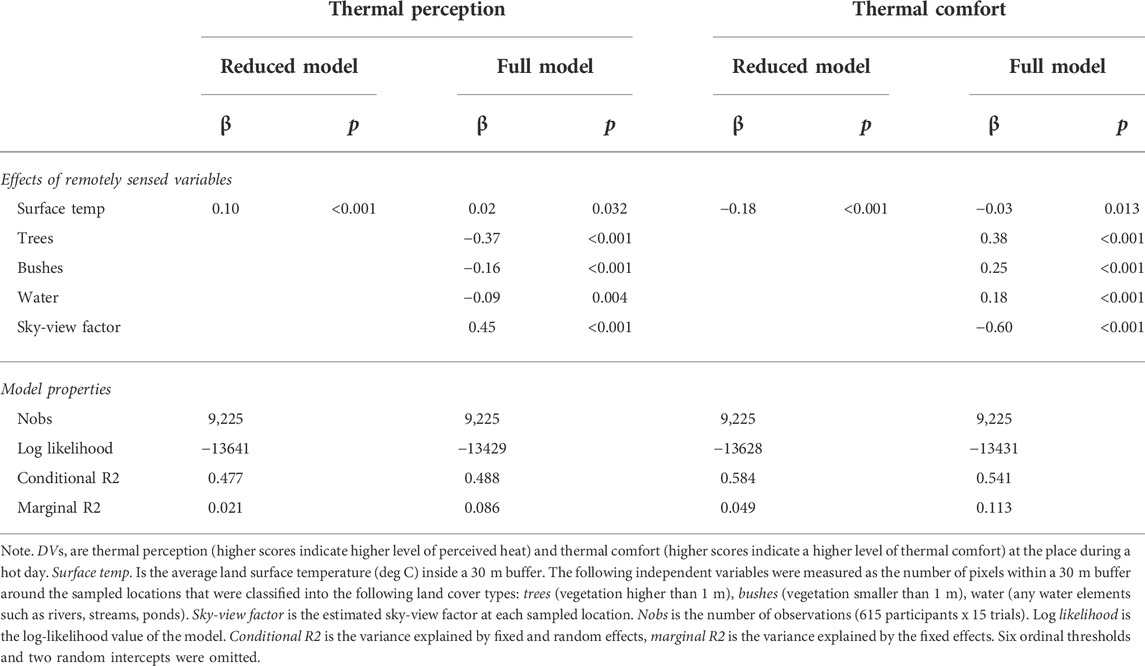
TABLE 2. Models of thermal perception and thermal comfort (mixed ordinal logit Model, city of Brno, Study 2).
Importantly, the model estimated on the sub-sample of participants who had little or no experience with respective locations and did not visit them in the last year (85.5% of observations) revealed essentially the same results (for details, see Supplementary Table SA4). This means that people were able to infer from pictures of locations rather than from their personal experience information that they used to estimate their long-term thermal perception.
Taken together, these results suggest, once again, that visual cues available in photographs of locations allow people to estimate their long-term thermal perception at each sampled location that matches thermal patterns (surface temperature) that we objectively observe at these locations (through remote sensing).
7.2.3 Thermal comfort
We were also able to corroborate the results of Study 1 concerning thermal comfort. Again, we found that the (remotely sensed) surface temperature was negatively related to (subjective survey-based) perceived thermal comfort (for details, see the reduced model in Table 2). This relationship was considerably reduced when (remotely-sensed) indicators capturing the presence of green and blue infrastructure and the sky-view factor were introduced in the model (for details, see the full model in Table 2). This observation suggests that participants based their judgment of perceived thermal comfort on visual cues available in the pictures, namely the presence of blue and green infrastructure and the presence of shading elements. This conjecture is further supported by the fact that (remotely sensed) presence of bushes, trees and water as well as the sky-view factor all had the theoretically expected effect on (subjective survey-based) thermal comfort. Additionally, this conclusion is also supported by the fact that the same substantial results were obtained on a sub-sample of observations from participants who had little or no direct experience with respective locations (for details, see Supplementary Table SA4).
Taken together, these results suggest, once again, that people base their subjective rating of expected perceived thermal comfort on visual cues that are available in photographs of target locations. More importantly, we found that these subjective expectations match objective thermal properties (surface temperature) across the locations.
7.3 Discussion of study 2
In Study 2, we corroborated results from Study 1 using a large dataset of target location and participants from the city of Brno. Specifically, we found, as in Study 1, that people can very well glean from photographs information about the properties of those locations that should theoretically affect their thermal perception and comfort such as exposure to the Sun and the presence of blue and green infrastructure. We also corroborated that people’s subjective rating of long-term thermal perception and comfort at the sampled locations reflects the objective thermal properties of these places (remotely sensed surface temperature).
8 Study 3: Thermal perception and decision making in the city of Brno
In Study 3 we look at whether long-term thermal perceptions associated with certain locations are useful for the prediction of pedestrians’ behavior in those locations. Specifically, we are interested in whether the average long-term thermal perceptions associated with specific spatial points collected in Study 2 can be used to predict the choice of a walking route, choice of a waiting place, and the preference of a place in a new sample of participants more than one year later.
8.1 Method
8.1.1 Participants
The participants of the study were all residents of Brno. Participants were recruited in November and December 2020 based on quota characteristics from a participant panel of an opinion poll company. The study recruited 1,099 participants, of whom 865 completed the study (78.7% completion rate). We excluded 2 participants for whom the data was incomplete due to technical error, resulting in a sample size of N = 863 participants. The sample of participants was fairly variable in terms of age (M = 40.4; SD = 13.4), gender (56.2% were women), and education (6.0% were people with primary education; 22.0% were people with secondary education without a high school diploma; 42.5% were people with a high school diploma; 29.5% were people with a university degree).
8.1.2 Materials
8.1.2.1 Independent variable
Average long-term thermal perception. Based on participants’ rating of their thermal perception in Study 2, we computed the average thermal perception rating of each of the 1,130 spatial points in the city of Brno featured in Study 2.
8.1.2.1 Dependent variables
Place preference for walking. We measured place preference for walking with a choice experiment. The choice experiment had 15 trials. Each trial of the choice experiment consisted of pairs of photographs depicting two randomly selected locations (northward view) from the database of 1,130 locations in the city of Brno used in Study 2. The photographs were arranged side by side (see Figure 6 for an example of the stimuli). In each trial, participants selected one place from the pair where they would “prefer to walk on a very hot day.”
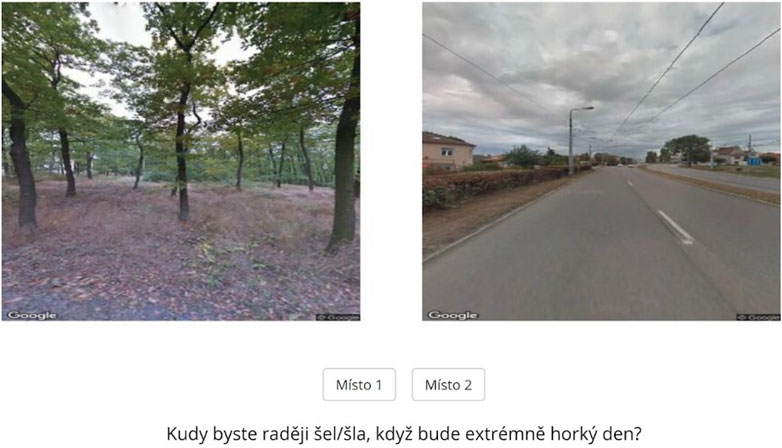
FIGURE 6. Example of the stimuli used in a trial of the choice experiment (place preference for walking in the city of Brno, Study 3)
Place preference for waiting. We measured place preference for waiting with a similar choice experiment (using the same set of randomly chosen photograph pairs) as place preference for walking, except that participants selected in each trial a place where they would “prefer to wait for somebody on a very hot day.”
Thermal comfort preference. We measured the thermal comfort preference using a choice experiment, similar to walking and waiting place preference. The only difference was that participants selected in each trial a place where they would “feel better on a very hot day.”
8.1.3 Procedure
Study participants received a personalized invitation to enter an online study. Before entering the study, prospective participants indicated whether they lived in the Brno district or elsewhere. Only those who indicated the Brno-City district as their place of residence were allowed to enter the study. After providing informed consent, a set of 15 stimuli for the choice experiment was randomly generated for each participant for use in the three choice experiment tasks. Subsequently, participants went through 15 trials of the walking preference task, 15 trials of the place preference task, and 15 trials of the thermal comfort preference task. At the conclusion of the study, participants provided basic demographic information (gender, age, and education), identified their area of residence via zip code, and answered two self-assessment questions (attention to instructions and accuracy of responses). Upon completion of the study, participants were directed to the web page of the opinion poll company and they received a small reward for their participation in the study (20 CZK; equivalent to $0.85).
8.1.4 Analyses
We used mixed binary logit models to analyze each of the three choice experiment tasks. These models had the place preferences as dependent variables and average thermal comfort ratings from Study 2, associated with each location, as their independent variable. The model also included random intercepts that captured idiosyncratic effects of each choice set. Besides estimating the effects of the thermal preference ratings on place preference, we also estimated how well one can predict people’s behavior based on such a model.
8.2 Results
8.2.1 Place preference for walking
Using the mixed logit model, we found that the average thermal perception from Study 2, associated with each place, had the expected negative effect on the choice of the walking route (see Table 3 for details). In other words, the average long-term thermal perceptions associated with each place and captured in Study 2 predicted how different people one year later preferred these places for walking. Importantly, such a model has 69% accuracy. This means that the model can correctly predict 69% of behavioral choices regarding the choice of walking route.
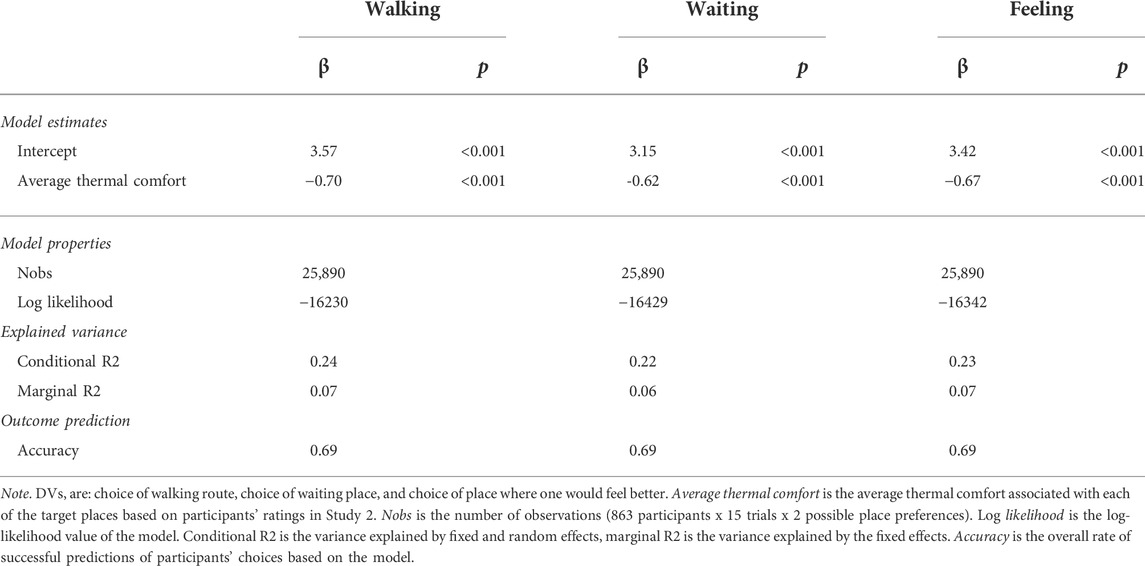
TABLE 3. Model of the preference of walking route, waiting place, and choice of the place where one would feel better (mixed binary logit models, city of Brno, Study 3).
8.2.2 Place preference for waiting
Using a similar model as for walking preference, we found that the average thermal perception also had the expected negative effect on waiting place preference (see Table 3 for details). In other words, the hotter the place was perceived by participants in Study 2, the less likely were participants in Study 3 to choose it as a waiting place. Again, the model correctly predicted about 69% of behavioral choices regarding the choice of waiting place.
8.2.3 Thermal comfort preference
Finally, using a similar model as we used for the waiting and walking tasks, we found that average thermal perception also has the expected negative effect on where people think they would feel better (see Table 3 for details). Again, this means that average long-term perceptions associated with each place were predictive of where people would feel better. The accuracy of such a prediction was 69%.
8.3 Discussion of study 3
In Study 3, we found that long-term thermal perceptions associated with specific places in the city of Brno and estimated on one sample of participants during a heatwave predicted how a different group of people preferred these places one year later for activities such as walking and waiting, and where they would feel better on an extremely hot day. These results suggest that subjective ratings of expected thermal perception are valid predictors of human behavior, as we would theoretically expect them to be.
9 General discussion
This study aimed to present and partially validate an approach to assessment of outdoor long-term thermal perception and comfort in urban environments. This approach combines some techniques previously used in thermal perception assessment, namely subjective rating scales, off-site survey administration, and representation of specific urban locations with photographs.
Across three studies conducted in two Czech cities, we found some preliminary evidence that long-term thermal perception and comfort elicited through a combination of these techniques is theoretically valid and practically useful. Specifically, in two of the studies, we were able to corroborate that photographs of urban locations are sufficient to convey information about the properties of urban locations, such as the sky-view factor and the presence of blue and green infrastructures, upon which people based their long-term thermal perception. More importantly, we saw that long-term thermal perception elicited through this approach is related in a theoretically expected way to objective thermal properties of these places (remotely sensed surface temperature) and to properties of these places that affect local micro-climate (sky-view factor, and the presence of blue and green infrastructure).
Finally, and perhaps most importantly, we also demonstrated that long-term thermal perception is useful practically as it can predict mundane outdoor behavior such as choice of waiting place or preference for a walking route. Specifically, we showed that thermal perception associated with specific places and derived using one sample of participants can be used to predict mundane outdoor activities in the very sample places of a different group of people more than one year later.
9.1 Validity of thermal perception
Obviously, our study could only provide limited evidence of the validity of what we can call a photographic method of long-term thermal perception assessment. It is rather obvious that the task that our participants were accomplishing by trying to rate their thermal expectations associated with specific urban locations “during a heatwave” or “on a very hot day” is cognitively demanding. However, the literature shows that people are skilled in inferring thermal properties from subtle cues that visual inspection of environments can provide (Lenzholzer, 2010). This is not so surprising if we consider that the human ability to predict how one would feel in different environments under different conditions was key to the human ability to adapt to and survive in harsh environments.
We can hypothesize that it is this cognitive ability to predict one’s thermal perceptions that makes long-term thermal expectations so useful in the prediction of human outdoor behavior. As a result, average thermal expectations associated with some locations in one group of people can explain the outdoor behavior of a different group of people more than one year later, as we have seen in one of our studies.
We think that the photographic approach to thermal perception assessment can be used to complement other methods of thermal perception assessment. This can be particularly useful in situations where we want to know how certain (and potentially large) populations of people perceive thermal comfort in a large number of locations. Such tasks are typically addressed with cognitive mapping approaches but these are known to be biassed and tend to oversample locations associated with extreme thermal perceptions (Lehnert et al., 2021).
9.2 Practical implications
Long-term thermal perception is recognized as an important factor that determines people’s outdoor behavior (e.g., Lenzholzer, 2010). One of our studies supports this conclusion by showing that long-term thermal perception predicts how people prefer specific urban locations for walking and waiting. Obviously, these are just two of many examples of outdoor activities that are potentially affected by people’s thermal expectations. As such, knowing long-term thermal expectations regarding different locations under different conditions (e.g., time of the year, occurrence of extreme weather events) can be useful for understanding and predicting human outdoor behavior in urban settings. As such, long-term thermal expectations can provide important input for urban planners.
9.3 Limitations and avenues for future research
One of the challenges for any study that tries to elicit people’s long-term thermal perceptions and thermal comfort associated with specific places is that such studies must ask people to imagine specific conditions that apply to these thermal perceptions and thermal comfort. For instance, in our study, we asked participants to imagine how they would feel at each location on “a very hot summer day”. Arguably, each person has a slightly different idea of what “a very hot day” means. Such idiosyncratic inter-personal differences undoubtedly introduce random error in persons’ responses. However, as our studies show, the ratio of this error to the measured quantity (i.e., rating of thermal perception and rating of thermal comfort) has to be relatively low because we were still able to reveal the theoretically expected relationship between people’s subjective perceptions and objective thermal properties of these places (i.e., remotely sensed surface temperature on a hot day) and the presence of (remotely sensed) blue and green infrastructure and sky-view factor. Thus, even with the measurement error that is necessarily associated with the elicitation of subjective thermal perceptions, such have enough precision to be useful to meaningfully compare specific urban locations.
Given that the present study could only provide limited evidence of the validity of the photographic approach to thermal perception assessment, future studies should seek to provide additional validity checks of this method. For instance, the results from the current approach can be cross-checked with results from in-situ measurements of thermal perception and with cognitive mapping. Further, the temporal stability of long-term thermal perception in persons should be studied.
Another limitation of our study is that we did not explore the mechanism through which people arrive at the thermal perception assessments when observing visual stimuli. While we know that people infer their thermal expectations from visual cues available in locations, experiments that would manipulate these properties can shed more light on how people arrive at their long-term thermal perceptions.
Another limitation of the current study is that it only focused on three behavioral outcomes affected by long-term thermal perception, namely preference of place for walking, waiting, and overall place preference. Future studies may focus on other types of outdoor behavior and use methods, such as experience sampling (Bolger and Laurenceau, 2013) that allow for a study of human behavior in realistic and dynamic settings.
Finally, the current study is also limited in that it covers only two Czech cities. Future studies may explore the generalizability of our approach in different urban, climatic, and cultural contexts. For instance, cultural differences are known to play a significant role in thermal perception (Chen and Ng, 2012). Thus, using the current photographic method in varied cultural contexts can help us to understand the limits of its generalizability.
10 Conclusion
We presented and partially validated a photographic approach to assessment of long-term outdoor thermal perception and comfort related to heatwaves in urban environments. This approach combines subjective rating scales, off-site survey administration, and representation of specific urban locations with photographs. As such, this approach is suitable for the assessment of how a large group of people perceives thermal comfort in a large number of places during heatwaves. Measurements of the long-term thermal perception and comfort based on this approach are related to theoretically known predictors of thermal perception and thermal comfort. Moreover, such measures are also predictive of outdoor activities. This approach to thermal perception and assessment can complement similar existing methods such as cognitive mapping.
Data availability statement
The datasets and analytical scripts used for analyses presented in this study can be found in an online repository at: https://osf.io/qw9fg/.
Ethics statement
Ethical review and approval was not required for the study on human participants in accordance with the local legislation and institutional requirements. The participants provided their implicit informed consent to participate in this study.
Author contributions
JU: Conceptualization, data curation, formal analysis, investigation; methodology, writing–original draft; MP: Data curation, formal analysis, investigation, writing–review and editing. FZ: Funding acquisition, project administration, investigation, formal analysis, writing–review and editing. JN: Investigation, formal analysis, writing–review and editing.
Acknowledgments
We would like to thank the Technology Agency of the Czech Republic (project “Thermal comfort in urban areas: human perception, physics based reality, role of greenery”, grant no. TL02000322) and the Ministry of Education, Youth and Sports of the Czech Republic (CzeCOS program, grant no. LM2018123) for their financial support. We would also like to thank Cliff McLenehan and Siri Jodha Singh Khalsa for their language support and the reviewers for their insightful comments.
Conflict of interest
The authors declare that the research was conducted in the absence of any commercial or financial relationships that could be construed as a potential conflict of interest.
Publisher’s note
All claims expressed in this article are solely those of the authors and do not necessarily represent those of their affiliated organizations, or those of the publisher, the editors and the reviewers. Any product that may be evaluated in this article, or claim that may be made by its manufacturer, is not guaranteed or endorsed by the publisher.
Supplementary material
The Supplementary Material for this article can be found online at: https://www.frontiersin.org/articles/10.3389/fenvs.2022.878341/full#supplementary-material
References
Ahmed, K. S. (2003). Comfort in urban spaces: Defining the boundaries of outdoor thermal comfort for the tropical urban environments. Energy Build. 35, 103–110. doi:10.1016/S0378-7788(02)00085-3
Aram, F., Solgi, E., Garcia, E. H., and Mosavi, A. (2020). Urban heat resilience at the time of global warming: Evaluating the impact of the urban parks on outdoor thermal comfort. Environ. Sci. Eur. 32, 117. doi:10.1186/s12302-020-00393-8
Aram, F., Solgi, E., Higueras García, E., Mosavi, A., and Várkonyi-Kóczy, R. A. (2019). The cooling effect of large-scale urban parks on surrounding area thermal comfort. Energies 12, 3904. doi:10.3390/en12203904
Auliciems, A. (1981). Towards a psycho-physiological model of thermal perception. Int. J. Biometeorol. 25, 109–122. doi:10.1007/BF02184458
Bolger, N., and Laurenceau, J.-P. (2013). Intensive longitudinal methods: An introduction to diary and experience sampling research. New York, NY: Guilford Press.
Broadbent, A. M., Coutts, A. M., Tapper, N. J., Demuzere, M., and Beringer, J. (2018). The microscale cooling effects of water sensitive urban design and irrigation in a suburban environment. Theor. Appl. Climatol. 134, 1–23. doi:10.1007/s00704-017-2241-3
Brunswik, E. (1956). Perception and the representative design of psychological experiments. 2nd ed. Berkeley, CA, US: University of California Press.
Chen, L., and Ng, E. (2012). Outdoor thermal comfort and outdoor activities: A review of research in the past decade. Cities 29, 118–125. doi:10.1016/j.cities.2011.08.006
Conrad, O., Bechtel, B., Bock, M., Dietrich, H., Fischer, E., Gerlitz, L., et al. (2015). System for automated geoscientific analyses (SAGA) v. 2.1.4. Geosci. Model Dev. 8, 1991–2007. doi:10.5194/gmd-8-1991-2015
Cortesão, J., Brandão Alves, F., and Raaphorst, K. (2020). Photographic comparison: A method for qualitative outdoor thermal perception surveys. Int. J. Biometeorol. 64, 173–185. doi:10.1007/s00484-018-1575-6
Eliasson, I., Knez, I., Westerberg, U., Thorsson, S., and Lindberg, F. (2007). Climate and behaviour in a Nordic city. Landsc. Urban Plan. 82, 72–84. doi:10.1016/j.landurbplan.2007.01.020
Eysenck, M. W., and Brysbaert, M. (2018). Fundamentals of cognition. Third Edition. New York: Routledge.
Fanger, P. O. (1970). Thermal comfort. Analysis and applications in environmental engineering. Available at: http://www.cabdirect.org/abstracts/19722700268.html (Accessed November 15, 2012).
Gao, Y., Church, S. P., Peel, S., and Prokopy, L. S. (2018). Public perception towards river and water conservation practices: Opportunities for implementing urban stormwater management practices. J. Environ. Manag. 223, 478–488. doi:10.1016/j.jenvman.2018.06.059
Höppe, P. (2002). Different aspects of assessing indoor and outdoor thermal comfort. Energy Build. 34, 661–665. doi:10.1016/S0378-7788(02)00017-8
Katzschner, L. (2004). “Open space design strategies based on thermal comfort analysis,” in Proceedings PLEA (Eindhoven), 47–52. Available at: https://citeseerx.ist.psu.edu/viewdoc/download?doi=10.1.1.548.2341&rep=rep1&type=pdf (Accessed July 2, 2022).
Klemm, W., Heusinkveld, B. G., Lenzholzer, S., Jacobs, M. H., and Van Hove, B. (2015a). Psychological and physical impact of urban green spaces on outdoor thermal comfort during summertime in The Netherlands. Build. Environ. 83, 120–128. doi:10.1016/j.buildenv.2014.05.013
Klemm, W., Heusinkveld, B. G., Lenzholzer, S., and van Hove, B. (2015b). Street greenery and its physical and psychological impact on thermal comfort. Landsc. Urban Plan. 138, 87–98. doi:10.1016/j.landurbplan.2015.02.009
Knez, I., and Thorsson, S. (2006). Influences of culture and environmental attitude on thermal, emotional and perceptual evaluations of a public square. Int. J. Biometeorol. 50, 258–268. doi:10.1007/s00484-006-0024-0
Langevin, J., Gurian, P. L., and Wen, J. (2015). Tracking the human-building interaction: A longitudinal field study of occupant behavior in air-conditioned offices. J. Environ. Psychol. 42, 94–115. doi:10.1016/j.jenvp.2015.01.007
Lehnert, M., Geletič, J., Kopp, J., Brabec, M., Jurek, M., Pánek, J., et al. (2021). Comparison between mental mapping and land surface temperature in two Czech cities: A new perspective on indication of locations prone to heat stress. Build. Environ. 203, 108090. doi:10.1016/j.buildenv.2021.108090
Lenzholzer, S. (2010). Engrained experience—A comparison of microclimate perception schemata and microclimate measurements in Dutch urban squares. Int. J. Biometeorol. 54, 141–150. doi:10.1007/s00484-009-0262-z
Lenzholzer, S., and Koh, J. (2010). Immersed in microclimatic space: Microclimate experience and perception of spatial configurations in Dutch squares. Landsc. Urban Plan. 95, 1–15. doi:10.1016/j.landurbplan.2009.10.013
Lenzholzer, S., and van der Wulp, N. Y. (2010). Thermal experience and perception of the built environment in Dutch urban squares. J. Urban Des. 15, 375–401. doi:10.1080/13574809.2010.488030
Lin, T.-P. (2009). Thermal perception, adaptation and attendance in a public square in hot and humid regions. Build. Environ. 44, 2017–2026. doi:10.1016/j.buildenv.2009.02.004
Mayer, H., and Höppe, P. (1987). Thermal comfort of man in different urban environments. Theor. Appl. Climatol. 38, 43–49. doi:10.1007/BF00866252
Nikolopoulou, M., Baker, N., and Steemers, K. (2001). Thermal comfort in outdoor urban spaces: Understanding the human parameter. Sol. Energy 70, 227–235. doi:10.1016/S0038-092X(00)00093-1
Nikolopoulou, M., and Steemers, K. (2003). Thermal comfort and psychological adaptation as a guide for designing urban spaces. Energy Build. 35, 95–101. doi:10.1016/S0378-7788(02)00084-1
Patterson, Z., Darbani, J. M., Rezaei, A., Zacharias, J., and Yazdizadeh, A. (2017). Comparing text-only and virtual reality discrete choice experiments of neighbourhood choice. Landsc. Urban Plan. 157, 63–74. doi:10.1016/j.landurbplan.2016.05.024
Pickup, J., and de Dear, R. (2000). “An Outdoor Thermal Comfort Index (OUT_SET*) - Part I - the model and its assumptions,” in Selected papers from the conference ICB-ICUC. Editors R. de Dear, J. Kalma, and A. Auliciems (Geneva, Switzerland: World Meteorological Organization in association with the United Nations Environment Programme and Macquarie University), 279–283.
Pivovarnik, M., Khalsa, S. J. S., Jimenez-Munoz, J. C., and Zemek, F. (2017). Improved temperature and emissivity separation algorithm for multispectral and hyperspectral sensors. IEEE Trans. Geosci. Remote Sens. 55, 1944–1953. doi:10.1109/TGRS.2016.2631508
Rodiek, S. D., and Fried, J. T. (2005). Access to the outdoors: Using photographic comparison to assess preferences of assisted living residents. Landsc. Urban Plan. 73, 184–199. doi:10.1016/j.landurbplan.2004.11.006
Rozin, P., and Royzman, E. B. (2001). Negativity bias, negativity dominance, and contagion. Pers. Soc. Psychol. Rev. 5, 296–320. doi:10.1207/S15327957PSPR0504_2
Shukla, P. R., Skea, J., Calvo Buendia, E., Masson-Delmotte, V., Pörtner, H.-O., Roberts, D. C., et al. (2019). Climate change and land: An IPCC special 659 report on climate change, desertification, land degradation, sustainable land management, food security, and greenhouse gas fluxes in terrestrial ecosystems. Summary for policymakers. Geneva, Switzerland: Intergovernmental Panel on Climate Change.
Sun, C., Zhang, R., Sharples, S., Han, Y., and Zhang, H. (2018). A longitudinal study of summertime occupant behaviour and thermal comfort in office buildings in northern China. Build. Environ. 143, 404–420. doi:10.1016/j.buildenv.2018.07.004
Thorsson, S., Honjo, T., Lindberg, F., Eliasson, I., and Lim, E.-M. (2007). Thermal comfort and outdoor activity in Japanese urban public places. Environ. Behav. 39, 660–684. doi:10.1177/0013916506294937
Thorsson, S., Lindqvist, M., and Lindqvist, S. (2004). Thermal bioclimatic conditions and patterns of behaviour in an urban park in Göteborg, Sweden. Int. J. Biometeorology 48, 149–156. doi:10.1007/s00484-003-0189-8
Vasilikou, C., and Nikolopoulou, M. (2020). Outdoor thermal comfort for pedestrians in movement: Thermal walks in complex urban morphology. Int. J. Biometeorol. 64, 277–291. doi:10.1007/s00484-019-01782-2
Völker, S., and Kistemann, T. (2011). The impact of blue space on human health and well-being – salutogenetic health effects of inland surface waters: A review. Int. J. Hyg. Environ. Health 214, 449–460. doi:10.1016/j.ijheh.2011.05.001
Keywords: long-term thermal perception, expected thermal comfort, heatwave, climate adaptation, urban planning–social aspects, urban greenery, remote sensing
Citation: Urban J, Pikl M, Zemek F and Novotný J (2022) Using Google Street View photographs to assess long-term outdoor thermal perception and thermal comfort in the urban environment during heatwaves. Front. Environ. Sci. 10:878341. doi: 10.3389/fenvs.2022.878341
Received: 17 February 2022; Accepted: 05 July 2022;
Published: 16 August 2022.
Edited by:
Honglei Wang, Nanjing University of Information Science and Technology, ChinaReviewed by:
Lisette Klok, Amsterdam University of Applied Sciences, NetherlandsHideki Takebayashi, Kobe University, Japan
Copyright © 2022 Urban, Pikl, Zemek and Novotný. This is an open-access article distributed under the terms of the Creative Commons Attribution License (CC BY). The use, distribution or reproduction in other forums is permitted, provided the original author(s) and the copyright owner(s) are credited and that the original publication in this journal is cited, in accordance with accepted academic practice. No use, distribution or reproduction is permitted which does not comply with these terms.
*Correspondence: Jan Urban, urban.j@czechglobe.cz