The crust-mantle transition beneath Northeast China from P–wave receiver functions
 Nita Sebastian1*†
  Hrvoje Tkalčić1†
  Christian Sippl1,2†
  Seongryong Kim1,3
  Anya M. Reading4
  Youlin Chen5 Fabrice R. Fontaine6,7
- 1Research School of Earth Sciences, The Australian National University, Canberra, ACT, Australia
- 2Institute of Geophysics, Czech Academy of Sciences, Prague, Czechia
- 3Department of Earth and Environmental Sciences, Korea University, Seoul, Republic of Korea, United States
- 4School of Physical Sciences (Earth Sciences), University of Tasmania, Hobart, TAS, Australia
- 5Array Information Technology, Greenbelt, MD, United States
- 6Institut de Physique du Globe de Paris, Centre National de la Recherche Scientifique (CNRS), Université de Paris, Paris, France
- 7Laboratoire GéoSciences Réunion, Université de La Réunion, Saint Denis, France
Introduction: The continental lithosphere of the Northeast China Plain (NECP) is probed using P–wave receiver function analysis of passive seismic data. The NECP is much–discussed as it includes different geological provinces of varying tecto–magmatic origin and dates back from Archean to Holocene. Quantifying the tectonic and magmatic influences on the structure and composition of the lithosphere puts important constraints on evolution of NECP. For this, we explore 75 sites across NECP using receiver function analysis.
Methods: A recently developed technique of inverting for 1–D S–wave velocity profiles beneath seismic stations that is based on the principles of Bayesian statistics (hierarchical transdimensional Bayesian Inversion; HTBI) is applied to receiver functions from the NECP. In addition, an improved crustal thickness–compressional to shear wave velocity ratio (H–κ) analysis was conducted to retrieve the crustal thickness and Vp/Vs ratio of the region. These estimated point measurements are integrated and systematically studied for a regional view of the current crustal architecture.
Results and Discussion: We observe a laterally varying and highly complex lithosphere beneath the NECP. A shallower crust–mantle transition (≤32 km) characterises the Precambrian North China craton and Late Mesozoic–Cenozoic Songliao Basin from the adjacent Central Asian Orogenic Belt and the Changbaishan Volcanic field (35–40 km). Beneath the latter, low Vp/Vs ratios (∼1.65) are obtained, whereas all other regions feature ratios in excess of 1.75. Multiple velocity gradients are observed at crustal depths within the craton, in contrast to the adjacent orogen, which indicates a higher degree of crustal complexity of the former. The width of the crust–mantle transition across the NECP is found to be mainly intermediate (2–7 km) and occasionally sharp (≤2 km). From our observations, we infer that there is a substantial difference between the eastern North China Craton’s lithospheric architecture and the rest of the NECP, with most of the NECP exhibiting more complexity than previously reported.
1 Introduction
Over the last century, a wide range of passive seismic techniques has been employed to determine the depth and properties of the crust-mantle transition zone across the globe (Prodehl et al., 2013). The current properties of the crust-mantle transition zones result from major or multiple tectonic, magmatic, and metamorphic processes and influences. Profiling using receiver functions (RFs) has been an effective passive-seismic method to retrieve detailed information on crustal and upper-mantle architecture, particularly sensitive to the gradients in elastic parameters. In China, the majority of receiver-function studies focused on the estimation of crustal thickness and Poisson’s ratio, which are valuable parameters to constrain processes that created the current crustal architecture across the globe and in China (Chevrot and Van der Hilst, 2000; Zhu and Kanamori, 2000; Li, 2006; Zhang et al., 2014; He et al., 2014a and references therein). Most of these studies have obtained a consistent pattern of crustal thickness, but there are some inconsistencies between different studies with the same data source.
On the one hand, the inconsistencies could be due to the use of different filters, weighting factors for converted phases, differences in prior assumptions (e.g., the value of compressional velocity, Vp, from surface to the Moho), and/or differences in the quantity and quality of analyzed RFs. On the other hand, such discrepancies might also arise from a high level of compositional and structural complexity of the crust-mantle transition zone. According to some studies (e.g., Tkalčić et al., 2006; Assumpção et al., 2013), the crustal thickness from RFs should always be estimated using different methods and, if possible, diverse datasets since the discrepancies between results yield an estimate of uncertainty and are thus critical in understanding the tectonic evolution of the region.
With a growing volume of seismic data collected from multiple stations in China, a detailed analysis of the crust-mantle transition zone will thus help reveal the continental lithospheric evolution of the regions such as the Northeast China Plain (NECP). To address the inconsistencies mentioned above in the case of Northeastern China and to provide an enhanced estimate of the crustal thickness (also referred to as H) and the compressional to shear wave-velocity ratio (also referred to as Vp/Vs or κ), we combine H-κ stacking of the RFs with a transdimensional Bayesian inversion method (Bodin et al., 2012) to retrieve 1-D shear-wave velocity (Vs) profiles beneath recording stations. The number of Earth layers in the inversion is treated as a free parameter in the trans dimensional framework we utilize. In addition, uncertainty is a hyper parameter, i.e., a free parameter in the inversions, which helps avoid subjective choices that could bias the results and interpretation. These profiles and their uncertainties can provide critical information about the complexity of the subsurface architecture. For instance, a second-order velocity gradient in the mantle beneath the Moho in a 1-D Vs profile could result from magmatic underplating or similar geological processes.
Our study aims to calibrate and constrain the properties of the crust and the crust–mantle transition from an estimate of seismic velocity gradients, H, and Vp/Vs beneath the NECP. Utilizing modern inversion methods, a large number of seismic stations as well as combining two different approaches, we can provide well-calibrated results that also contain information about parameter uncertainties. Since precise knowledge of the present-day crustal configuration is a crucial ingredient for any efforts of modelling processes that have created it, our results are a contribution towards elucidating the origins of the complex present-day tectonic patchwork of Northeastern China. Our results are summarized in a series of maps showing lateral variations in crustal thickness along with uncertainties from two independent methods and the Vp/Vs for the crust. Finally, we interpret the regional variations in crustal thicknesses with geological provinces and related tectonic processes.
2 Tectonic setting
The NECP comprises three major structural units, those of Archean, Proterozoic, and Cenozoic eras: from south to north, the eastern North China Craton (eastern NCC), the Songliao Basin (SLB), and the Chinese part of the Central Asian Orogenic Belt (CAOB; see Figure 1). Two recently active volcanic areas, the Changbaishan and the Wudalianchi Volcanic Fields are of particular interest in this study and will thus also be introduced in detail.
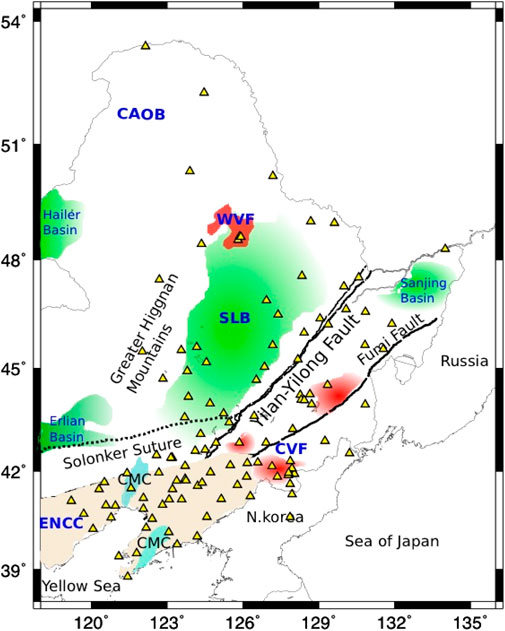
FIGURE 1. A simplified schematic map of major tectonic domains within the Northeast China block modified from Pirajno et al. (2009). Volcanic fields are shown as red patches; major basins are shown in green. Yellow triangles represent seismic stations utilized in this study spread across the provinces of LiaoNing, JiLin, and HeiLongJiang. Abbreviations ENCC, Archean Eastern North China Craton; CAOB, Central Asian Orogenic Belt; CVF, Changbaishan Volcanic field; WVF, Wudalianchi volcanic field; SLB, Songliao Basin; CMC, Ultra metamorphic complex of ENCC.
The by far oldest among the tectonic blocks is the eastern North China Craton in the southwest of our study area (Figure 1). The NCC has been interpreted as an amalgamation of micro-continent blocks, the oldest of which are Archean age (Yang et al., 2016; Santosh, M., 2010 and references therein). Geochemical, geochronological, and structural evidence, as well as metamorphic pressure-temperature paths, suggest that the basement of the NCC can be subdivided into an eastern and a western block, separated by the late Archean to Paleoproterozoic Trans-North China Orogen (Zhao et al., 2001). According to that study, the NCC was a “continental sliver” inside the supercontinent Gondwana, from which it detached in the Devonian (Hawkesworth et al., 2013). Our study focuses on the northeastern flank of the eastern NCC, which is part of the North China Block (also known as the Sino-Korean Block) and is bounded by the Yellow sea to the south and the Solonker suture to the north (Figure 1). It features an ancient basement comprising metamorphic basement rocks as old as 3.8 Ga and several late Archean nuclei surrounded by Paleoproterozoic orogenic belts of about 1.8 Ga age (Jahn and Ernst, 1990; Liu et al., 1992; Wu et al., 2008). Geophysical and petrological evidence suggests that the eastern NCC lost a large proportion of its mantle lithosphere since the Mesozoic. The presence of lower crustal material in some of the volcanic melts from the eastern NCC (Gao et al., 2004), and a thinner crust than expected for other Archean Cratons, has led to the proposal that the eastern NCC’s lower crust has foundered into the mantle together with the mantle lithospheric keel material, possibly as a consequence of eclogitization and thus densification. That would imply that detailed crustal-thickness mapping in the NCC can reveal the spatial extent of mantle lithospheric foundering. It should be noted that magmatic underplating since the foundering event(s) might have locally overprinted this signature (Zhai et al., 2007; He et al., 2022). Today, large parts of the eastern NCC are covered by a thick sedimentary succession of 2–12 km thickness (Zhang et al., 2014).
The non–marine Songliao Basin is located north of the eastern NCC and east of the CAOB (Figure 1). The basin has an extent of ∼700 km * 330 km within the North China block and possesses a Paleozoic basement of metamorphic and granitic composition (He et al., 2014a; Zhi–qiang et al., 2010). Upper Jurassic to Late Cretaceous volcano-sedimentary sequences, as well as Cretaceous and younger mudstones and sandstones, overlain this hard rock basement and is among the largest oil-bearing formations of China (Feng et al., 2010). Its formation has been associated with rifting due to a mantle upwelling, followed by post-rift conductive cooling of the mantle, which caused lithospheric thinning and crustal shortening at the Great Higgnan Mountain range that led to a structural inversion of the sedimentary basin to an anticlinal body (Liu and Niu, 2011). Geophysical studies have shown that the lower crust beneath Songliao Basin exhibits a mafic to ultramafic composition, inferred based on Vp/Vs ratios larger than 1.80 (He C. et al., 2014).
The accretionary margins between the NCC and the Siberian Craton make up the eastern part of the CAOB (Jahn, 2004; Xiao et al., 2003; Li, J.Y., 2006). This belt is commonly regarded as one of the largest known accretionary orogens (Şengör et al., 1993), with its evolution spanning a period of ∼720 million years from about 1,000 Ma to about 280 Ma (Kröner et al., 2007; Windley et al., 2007). A series of subduction and collision processes during the early to late Palaeozoic formed this accretionary collage that comprises multiple continental and oceanic fragments.
Besides the aforementioned major blocks, our study area also contains two areas of vigorous Holocene intraplate volcanism. The Changbaishan Volcanic Field, located at the eastern edge of the NCC, has shown six major eruptive events since BC 1120 (Simkin and Seibert, 1994) and has been interpreted as related to the subducting Pacific slab beneath, as well as to a hotspot or back-arc source (Kim et al., 2016). It is characterized by distinct anomalies of lower seismic wavespeeds in the crust and upper mantle (Tang et al., 1997; Tang et al., 2001; Kim et al., 2017).
The Wudalianchi Volcanic Field, located in the Songliao Basin’s north, comprises 14 monogenetic volcanoes from the Cenozoic era. Although its geophysical and seismological signature is very similar to that of the Changbaishan Volcanic Field (Wei et al., 2003), geochemical evidence suggests a different initial magma source dominated by the melting of lithospheric clinopyroxenite followed by a later phase with asthenosphere peridotite melting (Rasskazov et al., 2011; Fan et al., 2021). A process of subduction–induced delamination has been proposed to form Wudalianchi volcanism (Wei et al., 2012).
3 Data and methods
We utilized seismic waveform data from 75 stations in the HeiLongJiang, JiLin, and LiaoNing provinces, recorded in 2007–2011. The waveforms from earthquakes with magnitudes mb > 5.8 and epicentral distances within 30°–95° were used as a source for this study. The dataset includes stations from the Chinese provincial and national networks and temporary broadband deployments operated in the above time window. The distance between stations varies between 50 km and 450 km, with station density decreasing towards the north of the study area. We performed a multi-step quality control procedure to ensure an enhanced signal-to-noise ratio to improve the accuracy of inherent structural signatures. From an extensive database of raw seismograms, after a preliminary quality observation based on P-arrivals, a total of 28,240 teleseismic P–wave RFs (Langston, 1979) are computed. For the same, the deconvolution of radial and vertical components was performed iteratively in the time domain (200 iterations) by applying the algorithm of Ligorria and Ammon (1999). The obtained time series were filtered with Gaussian filter widths (a). Based on sensitivity to crustal-scale features and the crust-mantle transition, we chose radial P receiver functions of Gaussian filter parameters a = 1.0 and a = 2.5 (corresponding to low-pass filtering with corner frequencies of 0.2 and 0.5 Hz) in this study.
These data sets were analyzed and exploited for each station using multiple techniques.
A visual examination of the RFs for each station was performed to exclude noisy and/or non–representative data. The same was identified based on the amplitude of the P arrival (positive and less than 0.8) and the location of the maximum amplitude peak (within 0.5–2 s of the theoretical P- wave estimate). Subsequently, an empirical data selection is performed to select the coherent waveforms based on the cross-correlation matrix method from Tkalčić et al. (2011). This method computes the cross-correlation coefficient-χ for each pair of P-wave RFs, from which the RFs are selected based on their coherency percentage (τ) for a chosen minimum of χ value. From our data, we included the RFs with χ ≥ 80%. On average, ∼100 individual RFs from different earthquakes were obtained for the stations. Another criterion we imposed was to exclude stations that yielded less than 20 RFs after the quality control measures from further analysis (H58 and SUZ), as they might not be an ideal representation of the crustal structure.
In addition, we adopted the ray-parameter–based stacking method (Chen and Niu, 2013) to compute representative RFs for inversion. In this method, a “four-pin” moveout correction is applied to direct P-wave to S-wave converted phases (0p1s) and the reverberating phases (2p1s and 1p2s). This minimizes the waveform distortion that could arise from direct stacking of all events from the teleseismic distance range. We thus obtain stacked RFs with corrections applied for the distances and back azimuth. Multiple stacks of RFs are computed with different reference ray parameters ranging from 0.045 to 0.085 s/km.
These accepted RFs, after multiple quality control measures, are exploited further with two independent methods to determine crustal thickness, the presence of intra-crustal seismic discontinuities, the nature of the crust-mantle transition area, and the Vp/Vs ratio.
3.1 Hierarchical transdimensional Bayesian inversion of RFs (HTBI)
We analyze the 1-D shear-wave velocity profiles obtained from HTBI to infer the depth to the Moho and the depth to other second-order interfaces in the crust and mantle and the character of these interfaces. The HTBI approach is based on the principles of Bayesian statistics. Unlike conventional algorithms for RF inversion, it treats the data noise (σ) and the number of subsurface layers (k) as free parameters that are also inverted. In short, the HTBI approach aims to overcome the restrictive assumptions on parameterization and data noise involved in the geophysical inversion of RFs. In addition, this sampling-based approach generates an ensemble of representative solutions, which are used to infer the constraints of the unknown spatial model. For more details about this approach, the reader is referred to Bodin et al. (2012). We follow the procedure described therein to retrieve a 1-D S-wave velocity structure beneath the stations of northeast China.
We first perform a series of trial runs to test the retrieval of simple synthetic layered structures and to calibrate the necessary parameter choices. We then run the algorithm in production mode, inverting for Vs velocity down to 60 km depth using 107 iterations on 36 CPUs. The unknown spatial model is sampled with a reversible jump Markov chain Monte Carlo approach to obtain a transdimensional inference (Geyer and Møller, 1994; Green et al., 2003; Gallagher et al., 2009; Bodin et al., 2012; Gallagher, 2012). This is a computationally expensive procedure, with every run (corresponding to a single station) taking 36–48 h. Examples of input receiver function, the posterior distribution of noise and number of layers along with posterior ensembles of 1-D Vs velocity profiles are shown in Figures 2A–D. The posterior density of models (Figures 2B, 4, 5) is collected every 20,000 iterations from 36 Markov chains; the first 3 × 10⁶ iterations were the burn-in period (pre-production mode when models are not collected) necessary to stabilize the search in the model space and thus not used. For all inversions, the crustal Vp/Vs ratio is fixed at 1.73 after confirming that the results are not strongly dependent on this value. The algorithm samples the model space for the number of layers, which is allowed to vary between 2 and 20; the maximum likelihood solutions are shown as histograms in Figure 2E.
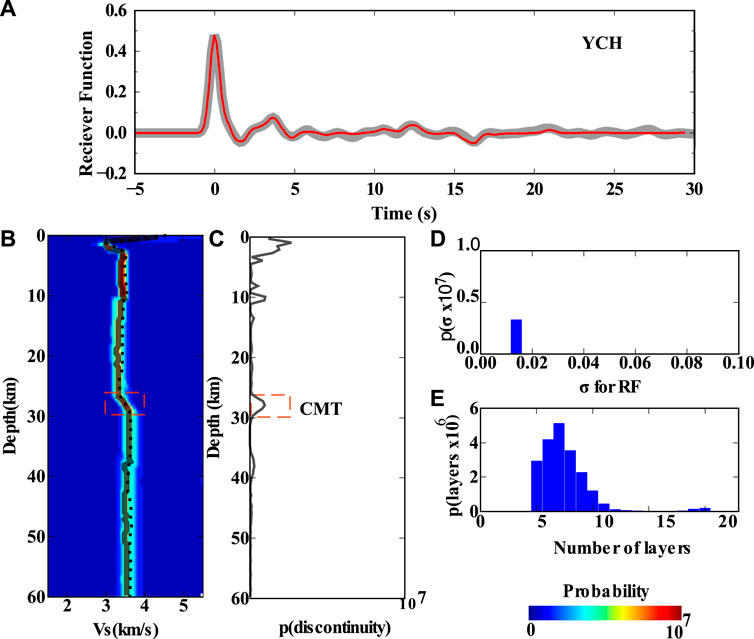
FIGURE 2. (A) The stack of the RFs at station YCH is shown as a thick grey line. The solid red line indicates the maximum likelihood solution from HTBI. (B) The distribution of the posterior ensemble of models collected during the post–burn-in period of the inversion. The solid black line represents the best model from the ensemble, and the black dotted line represents the average of the model ensemble. The red box shows the position of the crust-mantle transition zone beneath this station. (C) The posterior probability of discontinuity obtained for station YCH is shown, which indicates a maximum probability for around 25–30 km (the red dashed box). (D, E) Histograms represent the posterior distribution of the noise parameter and the number of layers.
In addition to the posterior distributions shown in Figure 2, we also obtain a distribution for the probability of a velocity discontinuity (see Supplementary Information). We use the resulting curves to estimate the crustal thickness and its uncertainty by fitting a Gaussian curve to the posterior density function as outlined in the Supplementary Information. The uncertainty estimates (see Figure 6B) yield uncertainty values significantly higher than estimated by the H-κ approach. That can be explained by the assertion that not all of this uncertainty is computation uncertainty; a large part of it likely derives from the physical extent of the transition from crust to mantle.
3.2 H–κ stacking analysis for crustal thickness and average crustal properties
To retrieve spatial distributions of crustal thickness and Vp/Vs ratio, we conducted an H-κ domain search (Chevrot and Van Der Hilst, 2000; Zhu and Kanamori, 2000). We applied a modified scheme (Niu et al., 2007; Chen et al., 2010), where the coherence between the converted and reverberated phases for varying Vp/Vs and H values are calculated. A semblance computed for this correlated search yields an H-κ estimate at each recording station. This approach minimizes the intrinsic trade-off in the H-κ parameter space and thus increases the precision of the grid-search analysis (e.g., Tkalčić et al., 2011). The grid search is conducted for H ranging 15–60 km (with an H increment of 0.050) and Vp/Vs ranging 1.5–2.2 (with a Vp/Vs increment of 0.001) on RFs of the Gaussian filter widths a = 1.0 and a = 2.5. We here focus on results derived using the Gaussian filter width a = 1.0, equivalent to approximately a low pass filter with a corner period of 0.5 s. We set Vp for the crust to 6.45 km/s, which is the global crustal Vp average for continents (Christensen and Mooney, 1995), after conducting tests that showed that this parameter had a relatively small influence on the retrieved results. For the relative weighting between converted and reverberated phases, we applied the weighting factors 0.70, 0.15, and 0.15 for Ps, Ppps, and Ppss, respectively. Runs using the relative weight distributions applied by Chevrot and Van der Hilst (2000) and Zhu and Kanamori (2000) yielded comparable results. Examples of H–κ results for several example stations are shown in Figure 3.
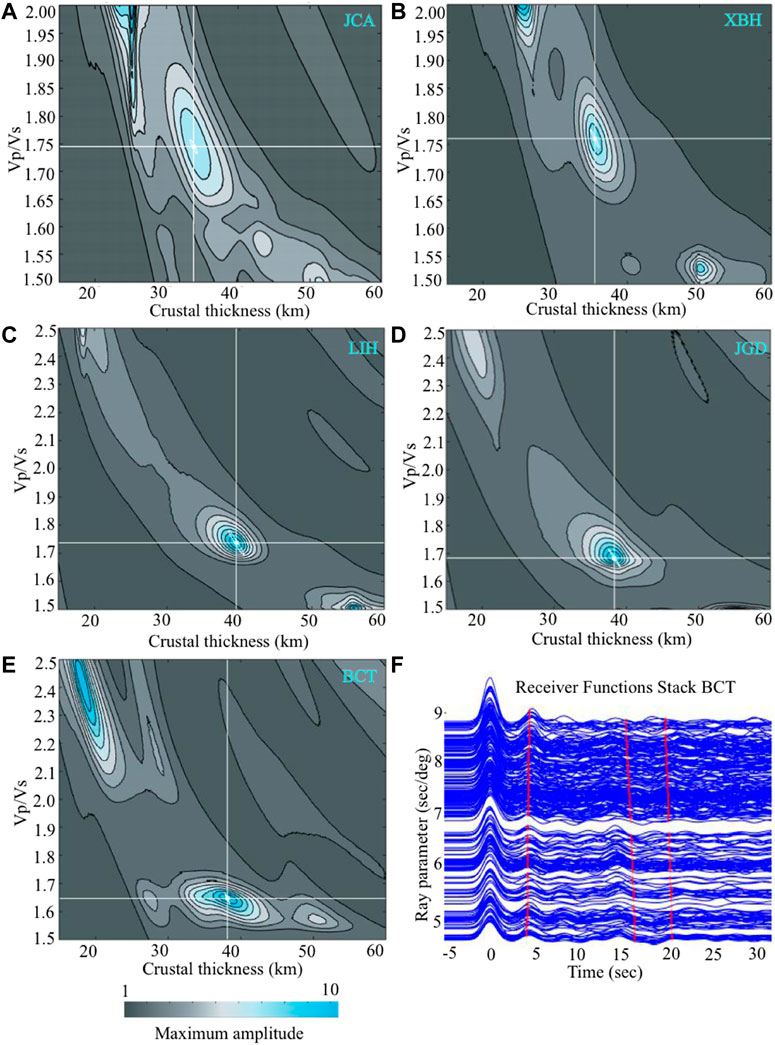
FIGURE 3. H-κ grid search analysis results for stations JCA, JGD, JYT, LIH, and BCT (A–E). The color shows the summed amplitude as a function of crustal thickness and Vp/Vs. White open ellipses indicate the errors. The white horizontal and vertical lines represent the best-fit crustal thickness and Vp/Vs. (F) The stack of RFs for the maximum amplitude in the H-κ domain for station BCT is shown in blue. The red dashed lines indicate the predicted arrival times of reverberated phases, calculated using the retrieved optimal crustal thickness and Vp/Vs.
4 Results
We use the computed RFs and 1-D Vs profiles to retrieve several properties that will eventually be used to interpret the underlying tectonic structure. These are the crustal thickness pattern, the character or sharpness of the crust-mantle transition (Supplementary Table SA; Column f), the bulk crustal Vp/Vs, and, if present, the depth and strength of the second-order discontinuities inside the crust or uppermost mantle. Since the overall crustal thickness pattern is retrieved from both employed methods independently, it offers a means of checking the consistency of results across the methods. Stations that showed unrealistic or bimodal posterior distributions in the HTBI approach, or for which an insufficient number of RFs was obtained and/or which suffered from too poor azimuthal coverage, were excluded from further analysis and interpretation. Figures 4, 5 show examples of obtained RFs fits and velocity models. The NCC has been reported to have a low crustal average velocity of around 6.14 km/s (Xia et al., 2017) in the uppermost 20 km. These low velocities of the middle crust seemed to have influenced the posterior ensembles in the RFs inversions. Since RFs are not efficient at constraining absolute Vs velocities, these should be regarded as less constrained than the depth to discontinuities.
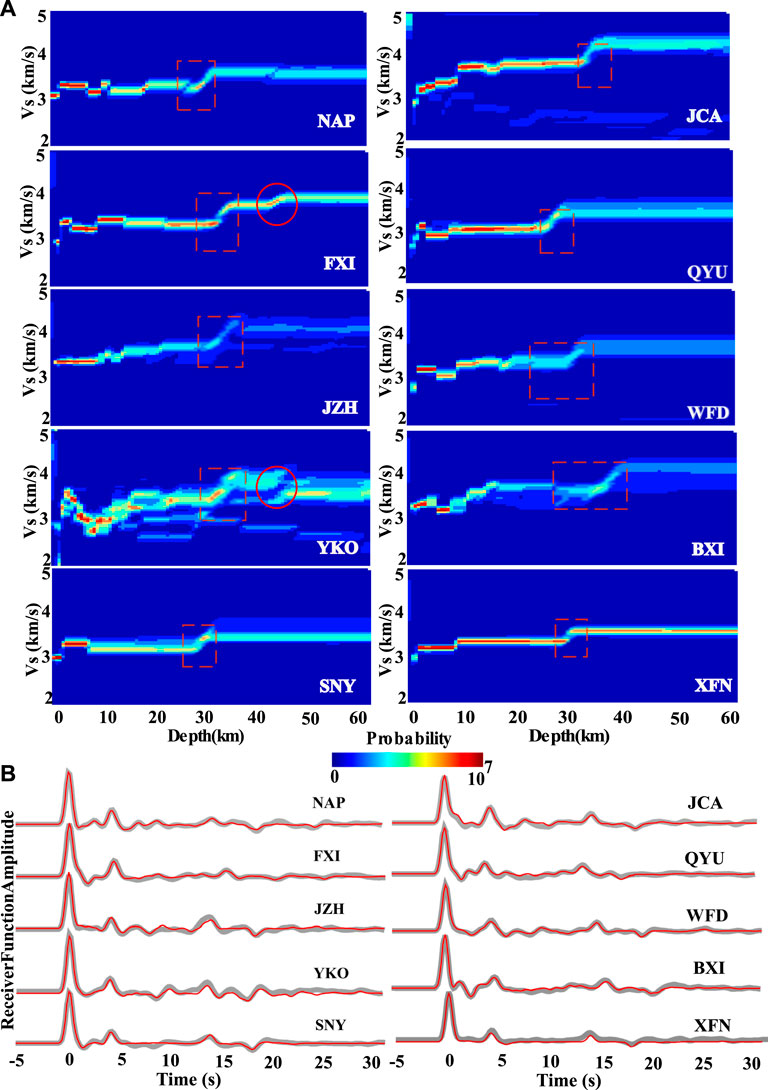
FIGURE 4. The 1–D shear–wave velocity model ensembles and their corresponding observed RFs for ten stations in the Liaoning province (A) The posterior ensemble of models for the ten stations. The ensemble solution of models is represented with a color density plot. This yields an estimate of the posterior probability distribution for Vs at each depth for each station. The red dashed box represents the location of the crust-mantle transition for each station. The red circles at stations FXI and YKO highlight the presence of an interface in the velocity model below the Moho. (B) The observed RFs for each station are shown as thick grey curves. The red curves show the synthetic RFs calculated with the best-fitting model to the observed RFs in the ensemble solution.
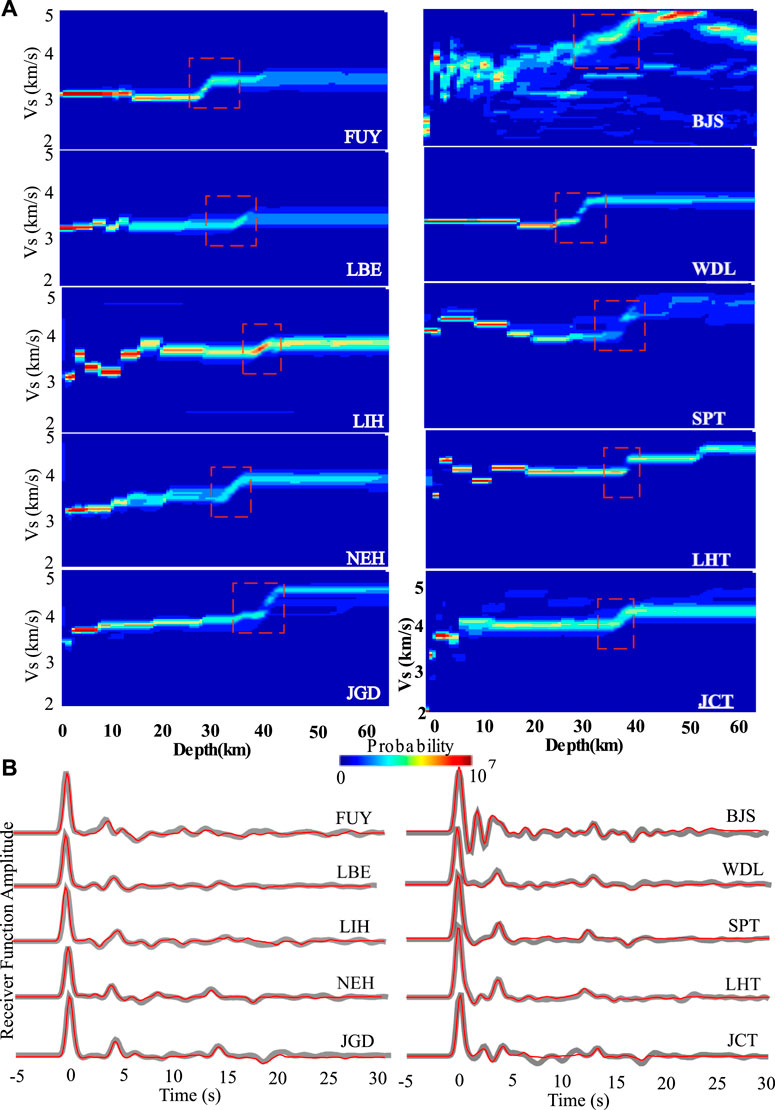
FIGURE 5. The 1–D shear–wave velocity model ensembles and their corresponding observed RFs for ten stations in the JiLin and HeiLongJiang provinces. (A) The posterior ensemble of models for the ten stations. The ensemble solution of models is represented with a color density plot. This yields an estimate of the posterior probability distribution for Vs at each depth for each station. The red dashed box represents the location of the crust-mantle transition for each station. (B) The observed RFs for each station are shown as thick grey curves. The red curves show the synthetic RFs calculated with the best-fitting model to the observed RFs in the ensemble solution.
The results of RF analysis from HTBI for all stations used in this study are summarized in Supplementary Table SA, Supplementary Figure S1 and Figure 6A, whereas Figure 6C and Supplementary Table SB summarize the results obtained from the H-κ analysis. Interpolating the single-station crustal-thickness values obtained from the two methods described above leads to maps. The crustal thickness difference between the two methods is listed as a separate column (g) in Supplementary Table SA. Its maximum value is 7 km for station XYN; in most cases, this value is significantly smaller (on the order of 2–4 km). It is evident that most crustal thickness estimates from H-κ analysis fall within the inferred crust–mantle transition zone from the HTBI method. Figures 6B, D show the accompanying uncertainty measurements retrieved from HTBI and H-κ analysis, respectively. Vp/Vs obtained in the H-κ analysis is shown in Figure 7A, while Figure 7B shows the corresponding standard deviation.
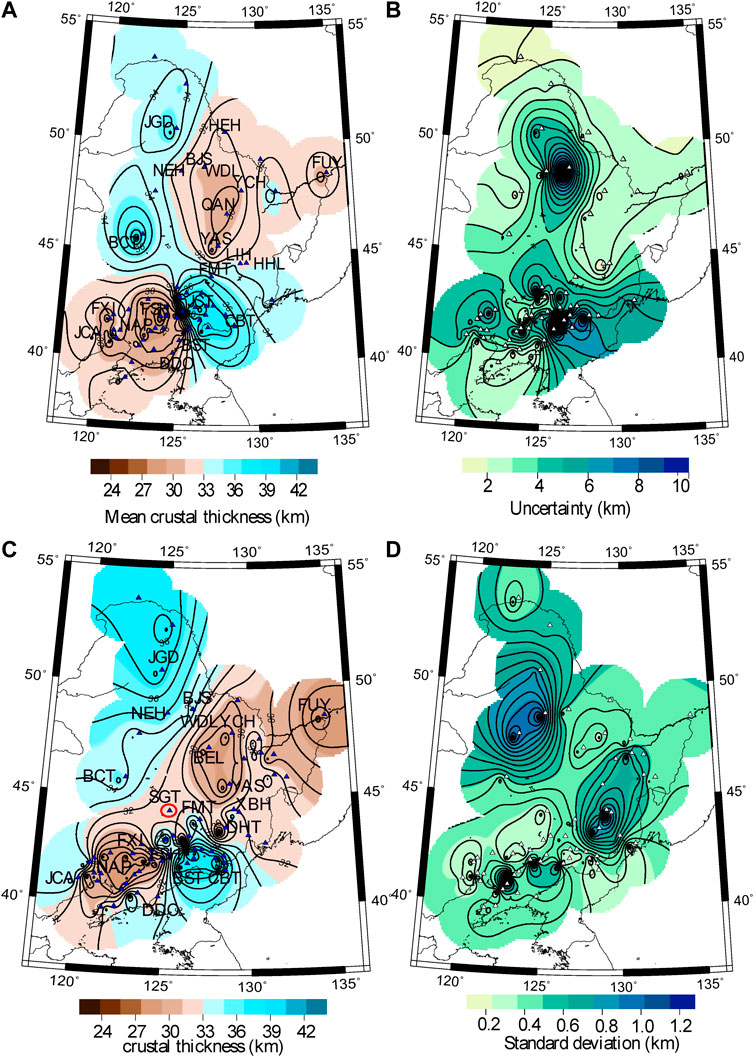
FIGURE 6. (A) Map view of crustal thickness from RFs inversion via the HTBI method. The blue triangles represent the seismic stations, i.e., the data points through which the interpolation was conducted. The utilized values were computed averages from the 1–D shear wave velocity posterior probability curves. (B) Distribution of uncertainty calculated from the posterior probability of models. (C) Map view of crustal thickness from H-κ stacking analysis. Again, the blue triangles represent the seismic stations at which measurements were obtained. (D) Standard deviation estimates obtained from H-κ measurements. The red triangles represent the station locations.
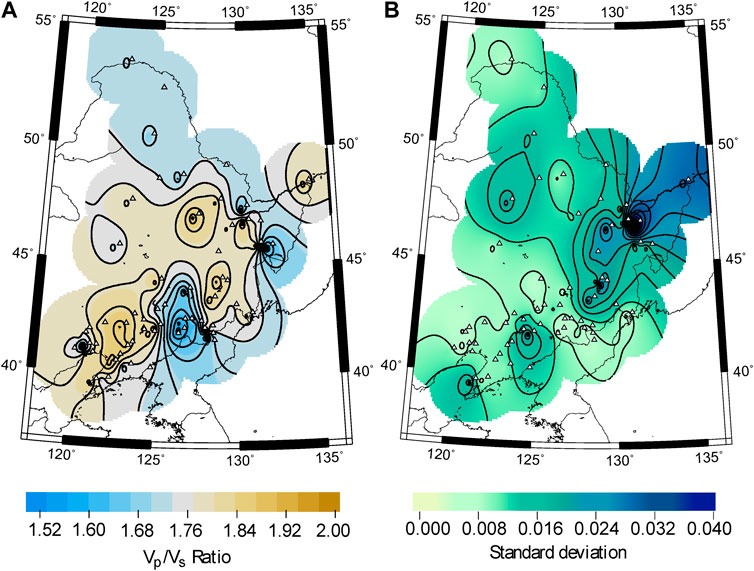
FIGURE 7. (A) Map view of the bulk velocity ratio (Vp/Vs) across the NECP as computed from the H-κ analysis. The blue triangles represent the points where estimates were made. (B) The standard deviation estimates were obtained for Vp/Vs values from the H-κ analysis. The corresponding color schemes are shown below each map.
We carry out a grid-search of the estimated depth of the Moho and the uncertainty (standard deviation) to fit a Gaussian curve to the observed probability of discontinuity (see Supplementary Information). We observe that for a few stations, the uncertainties are larger than 10 km and note that these show high-frequency receiver functions from volcanic terrains (e.g., BJS in Supplementary Table SA). We disregard a couple of these stations from standard deviation interpolation maps to exclude their high uncertainty influence.
We observe a relatively thin crust of 27–32 km in thickness in the eastern NCC that extends to the southern boundary of the Songliao Basin (Figure 6). Whereas a corridor of thinner crust appears to connect the eastern NCC to the Songliao Basin in Figure 6C, the two regions are separated by higher crustal thickness values in Figure 6A. This is due to station SGT (shown in a red circle), which is the only available station in this area and did not yield a meaningful Vs profile in the HTBI analysis. A thicker crust of 34 km up to 40 km is retrieved in the vicinity of the two volcanic fields (e.g., stations WDL and CVF) as well as for the CAOB in the northwest. A recent study by Zhang et al., 2020 suggested a complicated magma system in the crust and suggested a crustal thickness of 40 km beneath CVF.
A consistent pattern of high Vp/Vs ratio across the eastern NCC and Songliao Basin is evident from Figure 7A. The obtained values in this area lie around or slightly above 1.8 (see Supplementary Table SB). In the rest of the NECP, the estimated Vp/Vs values are rather low, between 1.57 and 1.72, i.e., below the global average for the continental crust of 1.73 (Christensen, N.I., 1996). We obtained the highest Vp/Vs ratio of 1.92 for station BEL (Supplementary Table SB and Figure 7B) located in the Songliao Basin, where a previous study (He C. et al., 2014) has pointed out elevated Vp/Vs as well. On the other hand, we obtained a slightly lower Vp/Vs estimate of 1.72 for station BCT (Supplementary Table SB), where He et al. (2014a) got around 1.8. Such inconsistency for the exact values obtained for the same station is common in previous work on the region. Several interpretations for the crust-mantle interface have been previously reported for northeast China (Li et al., 2014). For example, the crustal thickness beneath station SYS of the HeLongJiang province was estimated at 26.9 km (Vp/Vs=1.74) by Liu and Niu (2011) and 38.1 km (Vp/Vs=1.75) by Zhang et al. (2011). For the same station, we estimated the crustal thickness H of 28.6 and the ratio Vp/Vs of 1.78, as shown in Supplementary Table SB.
Besides providing crustal thickness maps, we also explore the character or sharpness of the crust–mantle transition by exploiting additional information obtained from the HTBI inversion (Details are given in the Supplementary Material). Based on the width of the best–fit Gaussian, we characterize the crust–mantle transition as sharp (≤2 km), intermediate (2–7 km), or gradational ( ≥ 7 km) (Shibutani et al., 1996). Based on Moho’s nature, most stations within NECP fall under the intermediate character (39 out of 66). For example, in Figure 4, the velocity profiles for stations FXI (eastern NCC) and NEH (CAOB) show a different pattern in the velocity profiles at the crust–mantle transition depth. The observed RFs for the stations NEH and FXI (Figures 4, 5, bottom panels) show a distinct difference in that the P–to S–waves converted phase is clear and narrow in the former and broad in the latter. This information is then translated into the 1–D profiles either as a smooth or a sharp Moho. In Supplementary Table SA (column-d), we list the character or sharpness of the crust–mantle transition observed beneath each station included in this study. Supplementary Figure S1 illustrates these differences. Generally, the crust-mantle boundary is intermediate beneath 39 locations and sharp beneath 14 locations. This implies that, across the NECP, the crust-mantle transition mostly has an intermediate nature.
We observe some second-order discontinuities at crustal depths (e.g., station LIH) and upper mantle depths (e.g., LHT and FXI) in the 1-D Vs velocity profiles. We note that for most stations, the resolution beneath the Moho is low (e.g., FUY, LBE), and for others, such as BJS, only some indistinct structural features may be inferred from 1–D profiles. We exclude them from further discussion because they may be the effect of reverberations in the corresponding observed RFs. In the following sections, we compare our results to other studies and suggest some possible conclusions regarding the continental region of the NECP.
5 Discussion
The crustal thickness of Mainland China, including the NECP region, has been derived in a number of previous studies (e.g., Huang et al., 2009; Tang et al., 2013; He et al., 2014a; Li et al., 2014; Zhang et al., 2014; Chen and Niu, 2016). In these studies, the crustal thickness was estimated to vary between 27.6 km and 38.1 km in the NECP. In the present study, the ranges of obtained values from two independent methods are between 24.5 and 41 km and are accompanied by uncertainty. The HTBI scheme allows retrieving a range for crust-mantle transition at most stations. This elucidates the cause of discrepancies and provides a better understanding of the varying values of previous RFs studies in the region (Liu and Niu, 2011; Zhang et al., 2011).
We observe the thinnest crust beneath the Archean eastern NCC and the Cenozoic extended Songliao Basin, which appears to negate a correlation between the crustal thickness and the age of the different parts of the NECP (Drummond, B.J., 1988). We find that the Archean crust of the eastern NCC has a thickness that, for most stations, is lower than what is considered standard for a stable Archean Craton. This is most likely a consequence of the region’s tectonic history.
Archean Cratons, the continental nuclei around which most of today’s landmasses were formed, are commonly thought of as nearly indestructible. Their thick mantle lithospheric keels, reaching depths of 200 km and more, are buoyant relative to the surrounding asthenosphere mantle (e.g., Djomani et al., 2001) and thus prevent subduction and/or recycling of these cratonic regions into the mantle. The North China Craton, however, is a prominent example that, despite its buoyancy, the continental root underlying a craton can be destroyed. Low seismic-wave speeds at depths of only 60–70 km beneath the eastern NCC (e.g., Gao et al., 2004) indicate that the lithospheric keel in the mantle beneath this part of the craton has been nearly completely removed. Several models have been proposed to explain this loss of craton [see summaries in Zhao et al. (2005) and Santosh (2010)], invoking processes related to subduction of the Pacific plate (see Introduction), intracrustal extensional deformation or the effect of a mantle upwelling (e.g., Zhao et al., 2001; Wang et al., 2005; Nutman et al., 2011; Zhai and Santosh, 2011; Zhao et al., 2011; Peng et al., 2012). Whatever its cause, the event that removed the region’s mantle lithospheric keel is also thought to have detached at least parts of the lower crust from the eastern NCC, which would explain the observed crustal thickness atypically low for a cratonic area.
A sharp crust–mantle transition is another hallmark feature of stable Archean cratons. Thus, finding a diffused Moho in an Archean craton stabilized before 2.8 Ga could be taken to indicate later deformation (Abbott et al., 2013) or reworking. We find that the character of the crust–mantle transition beneath the eastern NCC falls into the categories intermediate (2–7 km) and occasionally sharp (<2 km, e.g., station DDO), not systematically different from adjacent areas. This is surprising, considering that the CAOB is regarded as a highly complex accretionary orogen that has accumulated over a long-time span and should thus feature a significantly higher degree of crustal complexity. It thus appears likely that the lack of a decidedly sharp Moho in the eastern NCC implies the area has undergone major tectonic reworking, at least in most areas. This could be related to its early amalgamation from different microcontinents or much more recent reworking due to the aforementioned delamination event. Another scenario could be that the process that initiated the Cenozoic extensional evolution of the Songliao Basin also influenced the eastern NCC. In summary, the nature of the Moho falling into the intermediate category points to an uneven reworking of the whole NECP.
We showed that the Songliao Basin, located north of the eastern NCC, likewise features thinner–than–the average continental crust (Figure 6). Its crustal thickness, however, compares well to the estimated global thickness average of extended crust, which is ∼30 km with an error of 5 km (Christensen and Mooney, 1995). We observe different crustal thickness expressions for the two active intraplate volcanic regions (Changbaishan and Wudalianchi). The Wudalianchi Volcanic Field (VF) possesses a comparatively thin crust (∼30 km), in contrast to the Changbaishan area (∼38 km). A study by He et al. (2003) suggested an unclear Moho interface beneath Wudalianchi VF, which corresponds to the broadest crust-mantle transition of around 10 km width we obtained in this area (Figure 4; volcanic station BJS). In contrast to the highly gradational Moho beneath Wudalianchi VF, in the Changbaishan area, we observed both sharp and gradational transitions. We observe that regions with thinner crust (NCC, Songliao Basin, WVF) show up as positive anomalies in the Bouguer gravity anomaly map [Supplementary Figure S4 modified from Bonvalot et al. (2012)], whereas Bouguer gravity anomalies close to 0 are retrieved for regions with thicker crust (Changbaishan region, CAOB). A gravity high where the crust is thinner should be a direct consequence of more dense mantle material in the lithospheric column at shallower depth, thus the observed correlation between the Bouguer gravity anomaly map and our crustal thickness map confirms the observed general trends. No obvious systematic correlation to Free Air gravity anomalies (Supplementary Figure S4) is observed.
The combination of the Vp/Vs ratio and crustal thickness is often correlated with the tectonic provenance of a region, thus diagnostic of the processes and modification events that have occurred in that area (Christensen and Mooney, 1995). The Vp/Vs value within the crust increases with a higher proportion of mafic rocks (Zandt and Ammon, 1995). It should be noted that multiple factors, including the abundance of plagioclase feldspar and quartz, influence (decrease) the average crustal Poisson’s ratio (Christensen, 1996; Chevrot and Van der Hilst, 2000.). The Vp/Vs values from RFs are averages over the entire crustal column; thus, they must be interpreted cautiously.
Several studies have suggested an interdependence of the Vp/Vs and crustal thickness beneath the Songliao Basin based on its elevated Vp/Vs for a thin crust (Gao and Liu, 2014 and references therein). A study by Egorkin (1998), based on a regression analysis, suggested that Vp/Vs and crustal thickness are proportional in Precambrian terrains and inversely proportional in Paleozoic and Cenozoic terrains. That, however, appears not to hold in our results. We observe a coincidence of thin crust and high Vp/Vs in the eastern NCC and the Songliao Basin, which should imply an enrichment of mafic to ultramafic material beneath these areas. At least for a cratonic fragment, this is an unusual result. A likely explanation is magmatic underplating and/or a highly mafic lower crust. In the case of the Songliao Basin, it is straightforward to associate the presence of a mafic magmatic underplate with the process of rifting in the Cenozoic. The high Vp/Vs value beneath stations of the eastern NCC could be explained by magmatic addition to and, thus, thickening of the lower crust in the aftermath of the delamination mentioned above, which supposedly removed most of the lower crust together with the mantle lithosphere. This would imply that the crust in this region must have been even thinner in the direct aftermath of said event. We also speculate that Pacific slab under the area not have been the only factor for craton destruction event, which is commonly assumed to have occurred in Jurassic to Cretaceous time (e.g., Menzies et al., 2007; Tang et al., 2013; Kusky et al., 2014), it may still have caused the magmatic addition later. Tomographic imaging shows that this slab is stagnant in the mantle transition zone (e.g., Zhao and Ohtani, 2009) and advances horizontally westwards, thereby likely releasing fluids that lead to melting in the above mantle material. These processes could contribute to the observed volcanism in the region and provide the material that is added to the underside of the crust and invokes the high Vp/Vs values.
For stations beneath the CAOB, we observe low bulk Vp/Vs estimates (<1.68) for relatively thick crustal areas. A thickening of the felsic upper crust is a likely reason behind the deeper Moho and observed low Vp/Vs (Yu et al., 2017).
Finally, we observed several second–order discontinuities in the 1–D shear wave velocity profiles, both above and below the crust–mantle transition zone. Some examples are depicted in Figure 4 (FXI, NAP, and JCA). However, we do not observe these discontinuities consistently over several adjacent stations, which implies they are local complexity in the crust or uppermost mantle or simply not resolved elsewhere.
6 Conclusion
In this study, we utilize a hierarchical trans-dimensional Bayesian framework for analysing RFs, which do not require any a priori assumptions. As a case study, we apply this technique along with an H–κ stacking analysis to evaluate the robustness of crustal measurements conducted in the past. Our focus is on systematically elucidating Moho’s character and robustly estimating the uncertainties of the obtained measurements.
The main conclusions we have obtained can be summarized as follows:
1. We find that the crustal thickness beneath the NECP varies between 24 and 41.5 km, and we accompany all our estimates with uncertainties.
2. We do not observe any correlation between the age of the continental crust and crustal thickness beneath the NECP. The Archean craton’s crust is thin (<32 km) and similar to the Cenozoic Songliao Basin.
3. The Moho beneath the NECP is a zone of gradual transition from the crust to the mantle rather than a sharp boundary. The velocity profiles at 39 stations suggest that the crust-mantle transition zone is intermediate (2–7 km wide). The thinnest crust-mantle transition zone is <2 km, and the broadest is about 10 km in thickness. We suggest that this diffuse nature of the crust-mantle interface zone has contributed to the discrepancy in crustal thickness estimates in previous studies.
4. The crustal structure beneath the volcanic provinces differs between both areas, with the Changbaishan Volcanic Field showing a thicker crust and a more clearly defined Moho than the Wudalianchi Field. Moreover, we find that both of these areas feature Vp/Vs values lower than the eastern NCC and the Songliao Basin.
5. In terms of Vp/Vs, it is evident that the Songliao Basin is not homogeneous but features multiple structural pockets of elevated Vp/Vs. The elevated Vp/Vs and the lowest crustal thickness value (∼24 km) beneath this region support the hypothesis of mantle upwelling and corresponding crustal doming in the region that eventually led to crustal root loss, which has been suggested earlier for the region.
6. We obtain a higher Vp/Vs than the global average of 1.73 for most stations inside the Archean craton. An enrichment of mafic or ultramafic material at lower crustal depths is a likely reason for such high estimates of Vp/Vs. That supports the previous suggestions for lithospheric foundering beneath the eastern NCC.
7. We observe a consistent pattern of thicker crust and lower Vp/Vs beneath the CAOB. This resembles the signature of other orogenic belts around the world. The Vp/Vs value for stations beneath CAOB is ∼1.68, lower than the global average of 1.73, implying an enriched felsic crust, possibly due to the thickening of the upper crust during numerous collision accretion events that formed this region.
The influences of metasomatic changes, hydrothermal fluids, and other episodic events of lithosphere extensions and Cenozoic granitoid volcanism all might have contributed to the high heterogeneity across NECP (Vasanthi and Santosh, 2021; Sun et al., 2021 and references therein). The nature of the Moho, the deeper crust beneath orogens, the varying Vp/Vs, and their disconnected distribution indicate signatures of multi-source and episodic deformation across NECP and these are not restricted to NCC. We suggest that the NECP still has the potential for extensive studies with high-density coverage to obtain better rheological and thermal evolution constraints. The scope of employing multiple techniques and independent seismic data will be advantageous as well. In addition, we propose using HTBI techniques as a robust method to infer Moho beneath the world’s diffused and reworked tectonic regimes.
Data availability statement
The raw data supporting the conclusion of this article will be made available by the authors, without undue reservation.
Author contributions
NS performed the data analysis as part of her PhD research under the supervision of HT and the advice and guidance of CS. The first three authors equally contributed to the conceptualization and validation of the results. NS wrote the first draft of the manuscript and produced the figures with main inputs from HT and CS. All authors contributed to the final form of the manuscript. SK and YC provided software and guidance on various aspects of the waveform inversion and H-κ stacking technique. AR and FF contributed expertise and advice with receiver functions’ application and interpretation. All authors contributed to the discussions and interpretation. HT, YC, and SK contributed to the project administration and funding acquisition.
Funding
Inversions were performed on the Terrawulf III computational facility supported through AuScope Australian Geophysical observing system. AuScope is funded under the National Collaborative Research Infrastructure Strategy, and the Education Investment fund (EIF3), both Australian Commonwealth Government Programs. This research is supported by the USA BAA solicitation under Grant No. FA9453–13–C–0268.
Acknowledgments
We would like to acknowledge the scientific discussions and suggestions Thomas Bodin and Malcolm Sambridge have provided regarding the HTBI scheme of inversion. In addition, we are grateful to Thanh–Son Pham for his insights on calculating probability distributions.
Conflict of interest
The authors declare that the research was conducted in the absence of any commercial or financial relationships that could be construed as a potential conflict of interest.
Publisher’s note
All claims expressed in this article are solely those of the authors and do not necessarily represent those of their affiliated organizations, or those of the publisher, the editors and the reviewers. Any product that may be evaluated in this article, or claim that may be made by its manufacturer, is not guaranteed or endorsed by the publisher.
Supplementary material
The Supplementary Material for this article can be found online at: https://www.frontiersin.org/articles/10.3389/feart.2023.1144819/full#supplementary-material
References
Abbott, D. H., Mooney, W. D., and Vantongeren, J. A. (2013). The character of the Moho and lower crust within Archean cratons and the tectonic implications. Tectonophysics 609, 690–705. doi:10.1016/j.tecto.2013.09.014
Assumpção, M., Feng, M., Tassara, A., and Julià, J. (2013). Models of crustal thickness for South America from seismic refraction, receiver functions and surface wave tomography. Tectonophysics 609, 82–96. doi:10.1016/j.tecto.2012.11.014
Bodin, T., Sambridge, M., Tkalčić, H., Arroucau, P., Gallagher, K., and Rawlinson, N. (2012). Transdimensional inversion of receiver functions and surface wave dispersion. J. Geophys. Res. 117, B2301. doi:10.1029/2011jb008560
Bonvalot, S., Balmino, G., Briais, A., Kuhn, M., Peyrefitte, A., ValesBiancale, R., et al. (2012). World gravity map, 1:50000000 map. Paris: BGI-CGMW-CNES-IRD.
Chen, Y., and Niu, F. (2013). Ray-parameter based stacking and enhanced pre-conditioning for stable inversion of receiver function data. Geophys. J. Int. 194, 1682–1700. doi:10.1093/gji/ggt179
Chen, Y., and Niu, F. (2016). Joint inversion of receiver functions and surface waves with enhanced preconditioning on densely distributed CNDSN stations: Crustal and upper mantle structure beneath China. J. Geophys. Res. 121, 743–766. doi:10.1002/2015JB012450
Chen, Y., Niu, F., Liu, R., Huang, Z., Tkalčić, H., Sun, L., et al. (2010). Crustal structure beneath China from receiver function analysis. J. Geophys. Res. 115, B03307. doi:10.1029/2009jb006386
Chevrot, S., and Van Der Hilst, R. D. (2000). The Poisson ratio of the Australian crust: Geological and geophysical implications. Earth Planet. Sci. Lett. 183, 121–132. doi:10.1016/s0012-821x(00)00264-8
Christensen, N. I., and Mooney, W. D. (1995). Seismic velocity structure and composition of the continental crust: A global view. J. Geophys. Res. 100, 9761–9788. doi:10.1029/95JB00259
Christensen, N. I. (1996). Poisson’s ratio and crustal seismology. J. Geophys. Res. 101, 3139–3156. doi:10.1029/95jb03446
Djomani, Y. H. P., O’Reilly, S. Y., Griffin, W. L., and Morgan, P. (2001). The density structure of subcontinental lithosphere through time. Earth Planet. Sci. Lett. 184, 605–621. doi:10.1016/s0012-821x(00)00362-9
Drummond, B. J. (1988). A review of crust/upper mantle structure in the Precambrian areas of Australia and implications for Precambrian crustal evolution. Precambrian Res. 40 (41), 101–116. doi:10.1016/0301-9268(88)90063-0
Egorkin, A. V. (1998). Velocity structure, composition, and discrimination of crustal provinces in the former Soviet Union. Tectonophysics 298, 395–404. doi:10.1016/s0040-1951(98)00192-9
Fan, X., Chen, Q., Ai, Y., Chen, L., Jiang, M., Wu, M., et al. (2021). Quaternary sodic and potassic intraplate volcanism in northeast China controlled by the underlying heterogeneous lithospheric structures. Geology 49, 1260–1264. doi:10.1130/G48932.1
Feng, Z. Q., Jia, C. Z., Xie, X. N., Shun, Z., Zi–hui, F., and Cross, T. A. (2010). Tectonostratigraphic units and stratigraphic sequences of the nonmarine Songliao Basin, northeast China. Basin Res. 22, 79–95. doi:10.1111/j.13652117.2009.00445.x
Gallagher, K., Charvin, K., Nielsen, S., Sambridge, M., and Stephenson, J. (2009). Markov chain Monte Carlo (MCMC) sampling methods to determine optimal models, model resolution and model choice for Earth Science problems. Mar. Pet. Geol. 26, 525–535.
Gallagher, K. (2012). Transdimensional inverse thermal history modeling for quantitative thermochronology. Geophys. J. Int. 117, B02408. doi:10.1029/2011JB008825
Gao, Y. G., and Liu, Y. H. (2014). Crustal thickness and V p/V s in the Northeast China–north China region and its geological implication. Chin. J. Geophys. 57, 166–176. doi:10.1002/cjg2.20094
Gao, S., Rudnick, R. L., Yu, H. L., Liu, X. M., Liu, Y. S., Xu, W. L., et al. (2004). Recycling lower continental crust in the North China craton. Nature 432, 892–897. doi:10.1038/nature03162
Geyer, C. J., and Møller, J. (1994). Simulation procedures and likelihood inference for spatial point processes. Scand. J. Stat., 359–373.
Green, A., Green, R., Holliger, K., Horstmeyer, H., and Baldwin, J. (2003). Results of 3-D georadar surveying and trenching the San Andreas fault near its northern landward limit. Tectonophysics 368, 7–23.
Hawkesworth, C., Cawood, P., and Dhuime, B. (2013). Continental growth and the crustal record. Tectonophysics 609, 651–660. doi:10.1016/j.tecto.2013.08.013
He, C. S., Wang, C. Y., and Wu, J. P. (2003). The velocity structure of crust and upper mantle in the Wudalianchi volcano area inferred from the receiver function. Acta Seismol. Sin. 16, 140–147. doi:10.1007/s11589-003-0016-7
He, R., Shang, X., Yu, C., Zhang, H., and Van der Hilst, R. D. (2014a). A unified map of Moho depth and Vp/Vs ratio of continental China by receiver function analysis. Geophys. J. Int. 199, 1910–1918. doi:10.1093/gji/ggu365
He, C., Dong, S., Chen, X., Santosh, M., and Niu, S. (2014b). Seismic evidence for plume–induced rifting in the Songliao Basin of Northeast China. Tectonophysics 627, 171–181. doi:10.1016/j.tecto.2013.07.015
He, Y., Chen, Q. F., Chen, L., Wang, X., Guo, G., Li, T., et al. (2022). Distinct lithospheric structure in the xing'an-Mongolian orogenic belt. Geophys. Res. Lett. 49, e2021GL097283. doi:10.1029/2021GL097283
Huang, Z., Li, H., Zheng, Y., and Peng, Y. (2009). The lithosphere of North China Craton from surface wave tomography. Earth Planet. Sci. Lett. 288, 164–173. doi:10.1016/j.epsl.2009.09.019
Jahn, B. M., and Ernst, W. G. (1990). Late archean Sm-Nd isochron age for mafic-ultramafic supracrustal amphibolites from the northeastern Sino-Korean craton, China. Precambrian Res. 46, 295–306. doi:10.1016/0301-9268(90)90017-k
Jahn, B. M. (2004). The central asian orogenic belt and growth of the continental crust in the phanerozoic, 226. London: Geological Society, Special Publications, 73–100.
Kim, S., Tkalčić, H., Rhie, J., and Chen, Y. (2016). Intraplate volcanism controlled by back–arc and continental structures in NE Asia inferred from transdimensional Bayesian ambient noise tomography. Geophys. Res. Lett. 43, 8390–8398. doi:10.1002/2016gl069483
Kim, S., Tkalčić, H., and Rhie, J. (2017). Seismic constraints on magma evolution beneath Mount Baekdu (Changbai) volcano from transdimensional Bayesian inversion of ambient noise data. J. Geophys. Res. 122, 5452–5473. doi:10.1002/2017jb014105
Kröner, A., Windley, B. F., Badarch, G., Tomurtogoo, O., Hegner, E., Jahn, B. M., et al. (2007). Accretionary growth and crust formation in the central asian orogenic belt and comparison with the arabian nubian shield. Geol. Soc. Am. Memoirs 200, 181–209. doi:10.1130/2007.1200(11)
Kusky, T. M., Windley, B. F., Wang, L., Wang, Z., Li, X., and Zhu, P. (2014). Flat slab subduction, trench suction, and craton destruction: Comparison of the North China, Wyoming, and Brazilian cratons. Tectonophysics 630, 208–221.
Langston, C. A. (1979). Structure under Mount Rainier, Washington, inferred from teleseismic body waves. J. Geophys. Res. 84, 4749–4760. doi:10.1029/jb084ib09p04749
Li, Y., Gao, M., and Wu, Q. (2014). Crustal thickness map of the Chinese mainland from teleseismic receiver functions. Tectonophysics 611, 51–60. doi:10.1016/j.tecto.2013.11.019
Li, J. Y. (2006). Permian geodynamic setting of northeast China and adjacent regions: Closure of the paleo–asian ocean and subduction of the paleo–pacific plate. J. Asian Earth Sci. 26, 207–224. doi:10.1016/j.jseaes.2005.09.001
Ligorría, J. P., and Ammon, C. J. (1999). Iterative deconvolution and receiver–function estimation. Bull. Seismol. Soc. Am. 89, 1395–1400. doi:10.1785/bssa0890051395
Liu, H., and Niu, F. (2011). Receiver function study of the crustal structure of Northeast China: Seismic evidence for a mantle upwelling beneath the eastern flank of the Songliao Basin and the Changbaishan region. Earthq. Sci. 24, 27–33. doi:10.1007/s11589–011–0766–6
Liu, D. Y., Nutman, A. P., Compston, W., Wu, J. S., and Shen, Q. H. (1992). Remnants of ≥ 3800Ma crust in the Chinese part of the Sino–Korean craton. Geology 20, 339–342. doi:10.1130/0091-7613(1992)020<0339:romcit>2.3.co;2
Menzies, M., Xu, Y., Zhang, H., and Fan, W. (2007). Integration of geology geophysics and geochemistry: A key to understanding the North China craton. Lithos 96, 1–21. doi:10.1016/j.lithos.2006.09.008
Niu, F., Bravo, T., Pavlis, G., Vernon, F., Rendon, H., Bezada, M., et al. (2007). Receiver function study of the crustal structure of the southeastern Caribbean plate boundary and Venezuela. J. Geophys. Res. 112, B11308. doi:10.1029/2006JB004802
Nutman, A. P., Wan, Y., Du, L., Friend, C. R., Dong, C., Xie, H., et al. (2011). Multistage late neoarchaean crustal evolution of the North China craton, eastern hebei. Precambrian Res. 189, 43–65. doi:10.1016/j.precamres.2011.04.005
Peng, P., Guo, J., Zhai, M., Windley, B. F., Li, T., and Liu, F. (2012). Genesis of the hengling magmatic belt in the North China craton: Implications for paleoproterozoic tectonics. Lithos 148, 27–44. doi:10.1016/j.lithos.2012.05.021
Pirajno, F., Ernst, R. E., Borisenko, A. S., Fedoseev, G., and Naumov, E. A. (2009). Intraplate magmatism in Central Asia and China and associated metallogeny. Ore Geol. Rev. 35, 114–136. doi:10.1016/j.oregeorev.2008.10.003
Prodehl, C., Kennett, B., Artemieva, I. M., and Thybo, H. (2013). 100years of seismic research on the Moho. Tectonophysics 609, 9–44. doi:10.1016/j.tecto.2013.05.036
Rasskazov, S. V., Chuvashova, I. S., Liu, Y., Meng, F., Yasnygina, T. A., Fefelov, N. N., et al. (2011). Proportions of lithospheric and asthenospheric components in late cenozoic K and K–Na lavas in heilongjiang province, northeastern China. Petrology 19, 568–600. doi:10.1134/s0869591111050031
Santosh, M. (2010). Assembling North China craton within the columbia supercontinent: The role of double–sided subduction. Precambrian Res. 178, 149–167. doi:10.1016/j.precamres.2010.02.003
Şengör, A. M. C., Natal'In, B. A., and Burtman, V. S. (1993). Evolution of the Altaid tectonic collage and Palaeozoic crustal growth in Eurasia. Nature 364, 299–307. doi:10.1038/364299a0
Shibutani, T., Sambridge, M., and Kennett, B. L. N. (1996). Genetic algorithm inversion for receiver functions with application to crust and uppermost mantle structure beneath eastern Australia. Geophys. Res. Lett. 23, 1829–1832. doi:10.1029/96gl01671
Simkin, T., and Seibert, L. (1994). Volcanoes of the world. 2nd. Arizona: Smithsonian Institution, Geoscience Press, 349.
Sun, P., Guo, P., and Niu, Y. (2021). Eastern China continental lithosphere thinning is a consequence of paleo-pacific plate subduction: A review and new perspectives. Earth-Science Rev. 218, 103680. doi:10.1016/j.earscirev.2021.103680
Tang, J., Liu, T. S., Jiang, Z., Zhao, G. Z., Wang, J. J., and Zhan, Y. (1997). Preliminary observations of the Tianchi Volcano area in Changbaishan Mountain by MT method. Seismol. Geol. 19 (2), 164–170.
Tang, J., Deng, Q. H., Zhao, G. Z., Bai, D., Jin, G., Li, W., et al. (2001). Electric conductivity and magma chamber at the Tianchi volcano area in Changbaishan Mountain. Seismol. Geol. 23 (2), 191–200.
Tang, Y. J., Zhang, H. F., Ying, J. F., and Su, B. X. (2013). Widespread refertilization of cratonic and circum-cratonic lithospheric mantle. Earth-Science Rev. 118, 45–68. doi:10.1016/j.earscirev.2013.01.004
Tkalčić, H., Pasyanos, M., Rodgers, A., Gok, R., Walter, W., and Al-Amri, A. (2006). A multistep approach for joint modeling of surface wave dispersion and teleseismic receiver functions: Implications for lithospheric structure of the arabian peninsula: Multistep modeling of arabian lithosphere. J. Geophys. Res. 111, B111. doi:10.1029/2005JB004130
Tkalčić, H., Chen, Y., Liu, R., Zhibin, H., Sun, L., and Chan, W. (2011). Multistep modelling of teleseismic receiver functions combined with constraints from seismic tomography: Crustal structure beneath southeast China. Geophys. J. Int. 187, 303–326. doi:10.1111/j.1365-246X.2011.05132.x
Vasanthi, A., and Santosh, M. (2021). Overview of regional gravity field computation models and application of a novel method in imaging the lithospheric architecture and destruction of the North China Craton. Earth-Science Rev. 215, 103548. doi:10.1016/j.earscirev.2021.103548
Wang, Y., Houseman, G. A., Lin, G., Guo, F., Wang, Y. J., Fan, W. M., et al. (2005). Mesozoic lithospheric deformation in the North China block: Numerical simulation of evolution from orogenic belt to extensional basin system. Tectonophysics 405, 47–63. doi:10.1016/j.tecto.2005.05.012
Wei, H., Sparks, R. S. J., Liu, R., Fan, Q., Wang, Y., Hong, H., et al. (2003). Three active volcanoes in China and their hazards. J. Asian Earth Sci. 21, 515–526. doi:10.1016/s1367-9120(02)00081-0
Wei, W., Xu, J., Zhao, D., and Shi, Y. (2012). East Asia mantle tomography: New insight into plate subduction and intraplate volcanism. J. Asian Earth Sci. 60, 88–103. doi:10.1016/j.jseaes.2012.08.001
Windley, B. F., Alexeiev, D., Xiao, W., Kröner, A., and Badarch, G. (2007). Tectonic models for accretion of the central asian orogenic belt. J. Geol. Soc. 164, 31–47. doi:10.1144/0016-76492006-022
Wu, F. Y., Zhang, Y. B., Yang, J. H., Xie, L. W., and Yang, Y. H. (2008). Zircon U–Pb and Hf isotopic constraints on the early archean crustal evolution in anshan of the North China craton. Precambrian Res. 167, 339–362. doi:10.1016/j.precamres.2008.10.002
Xia, B., Thybo, H., and Artemieva, I. M. (2017). Seismic crustal structure of the North China Craton and surrounding area: Synthesis and analysis. J. Geophys. Res. 122, 5181–5207. doi:10.1002/2016JB013848
Xiao, W., Windley, B. F., Hao, J., and Zhai, M. (2003). Accretion leading to collision and the Permian Solonker suture, Inner Mongolia, China: Termination of the central Asian orogenic belt. Tectonics 22, 1069. doi:10.1029/2002tc001484
Yang, Q. Y., Santosh, M., Collins, A. S., and Teng, X. M. (2016). Microblock amalgamation in the North China craton: Evidence from neoarchaean magmatic suite in the Western margin of the jiaoliao block. Gondwana Res. 31, 96–123. doi:10.1016/j.gr.2015.04.002
Yu, Y., Sun, M., Huang, X. L., Zhao, G., Li, P., Long, X., et al. (2017). Sr-Nd-Hf-Pb isotopic evidence for modification of the Devonian lithospheric mantle beneath the Chinese Altai. Lithos 284, 207–221.
Zandt, G., and Ammon, C. J. (1995). Continental crust composition constrained by measurements of crustal Poisson's ratio. Nature 374, 152–154. doi:10.1038/374152a0
Zhai, M. G., and Santosh, M. (2011). The early precambrian odyssey of the North China craton: A synoptic overview. Gondwana Res. 20, 6–25. doi:10.1016/j.gr.2011.02.005
Zhai, M., Fan, Q., Zhang, H., Sui, J., and Shao, J. A. (2007). Lower crustal processes leading to mesozoic lithospheric thinning beneath eastern North China: Underplating, replacement and delamination. Lithos 96, 36–54. doi:10.1016/j.lithos.2006.09.016
Zhang, B., Lei, J., Yuan, X., Zhang, G., He, J., and Xu, Q. (2020). Detailed Moho variations under Northeast China inferred from receiver function analyses and their tectonic implications. Phys. Earth Planet. Interiors 300, 106448. doi:10.1016/j.pepi.2020.106448
Zhang, Z., Yang, L., Teng, J., and Badal, J. (2011). An overview of the Earth crust under China. Earth–Science Rev. 104, 143–166. doi:10.1016/j.earscirev.2010.10.003X
Zhang, R., Wu, Q., Sun, L., He, J., and Gao, Z. (2014). Crustal and lithospheric structure of Northeast China from S–wave receiver functions. Earth Planet. Sci. Lett. 401, 196–205. doi:10.1016/j.epsl.2014.06.017
Zhao, D., and Ohtani, E. (2009). Deep slab subduction and dehydration and their geodynamic consequences: Evidence from seismology and mineral physics. GondwanaResearch 16, 401–413. doi:10.1016/j.gr.2009.01.005
Zhao, G., Wilde, S. A., Cawood, P. A., and Sun, M. (2001). Archean blocks and their boundaries in the North China craton: Lithological, geochemical, structural and P–T path constraints and tectonic evolution. Precambrian Res. 107, 45–73. doi:10.1016/s0301-9268(00)00154-6
Zhao, G., Sun, M., Wilde, S. A., and Sanzhong, L. (2005). Late archean to paleoproterozoic evolution of the North China craton: Key issues revisited. Precambrian Res. 136, 177–202. doi:10.1016/j.precamres.2004.10.002
Zhao, D., Yu, S., and Ohtani, E. (2011). East asia: Seismotectonics, magmatism and mantle dynamics. J. Asian Earth Sci. 40, 689–709. doi:10.1016/j.jseaes.2010.11.013
Zhi–qiang, F., Cheng–zao, J., Xi–nong, X., Shun, Z., Zi–hui, F., and Cross, T. A. (2010). Tectonostratigraphic units and stratigraphic sequences of the nonmarine Songliao Basin, northeast China. Basin Res. 22, 79–95. doi:10.1111/j.13652117.2009.00445.x
Keywords: receiver functions, Hierarchical Transdimensional Bayesian Inversion, crust-mantle transition, H-κ stacking analysis, Northeast China Plain
Citation: Sebastian N, Tkalčić H, Sippl C, Kim S, Reading AM, Chen Y and Fontaine FR (2023) The crust-mantle transition beneath Northeast China from P–wave receiver functions. Front. Earth Sci. 11:1144819. doi: 10.3389/feart.2023.1144819
Received: 15 January 2023; Accepted: 24 April 2023;
Published: 11 May 2023.
Edited by:
Mourad Bezzeghoud, Universidade de Évora, PortugalReviewed by:
Dhananjai K. Pandey, National Centre for Polar and Ocean Research (NCPOR), IndiaYosuke Aoki, The University of Tokyo, Japan
Copyright © 2023 Sebastian, Tkalčić, Sippl, Kim, Reading, Chen and Fontaine. This is an open-access article distributed under the terms of the Creative Commons Attribution License (CC BY). The use, distribution or reproduction in other forums is permitted, provided the original author(s) and the copyright owner(s) are credited and that the original publication in this journal is cited, in accordance with accepted academic practice. No use, distribution or reproduction is permitted which does not comply with these terms.
*Correspondence: Nita Sebastian, nitasebastian@gmail.com
†These authors have contributed equally to this work