
Abstract
Monel® alloy 400 has excellent corrosion resistance and finds applications in marine industries. The processing of marine components requires high processing efficiency and a quality finish. Hence, this research aims to investigate the effects of the laser processing parameters such as laser fluence, scanning velocity, hatching distance, and the scanning pass on the ablation rates and efficiency, chemistry, and nanomechanical properties of the Monel® alloy 400 after pulsed picosecond (ps) laser ablation. From the experimental findings, the ablation depth increases as the laser fluence increases while decreasing as the scanning velocity increases. Surface roughness was noted to increase as the laser fluence increased. The findings demonstrated that the ablation rate increases as laser fluence increases while ablation efficiency decreases. Energy dispersive x-ray spectroscopy (EDX) showed that the elemental composition of laser-ablated zones is almost similar to that of the polished sample. X-ray spectroscopy (XPS) shows that the outer layer on the surface of Monel® alloy 400 is composed of NiO and CuO. The hardness and Young's modulus of the laser-processed alloy were found to be less than those of the bulk material. This study can be used to establish optimal processing parameters for the ultrafast ps laser processing of materials to achieve high ablation efficiency with a high-quality surface finish for industrial applications.
Export citation and abstract BibTeX RIS

Original content from this work may be used under the terms of the Creative Commons Attribution 4.0 licence. Any further distribution of this work must maintain attribution to the author(s) and the title of the work, journal citation and DOI.
1. Introduction
Monel® alloy 400, an alloy of Ni-Cu, is a widely researched material because of its numerous and diverse applications in industries such as aerospace, high steam generators, nuclear, chemical, gas and oil, and food processing [1]. Additionally, due to its unique properties of excellent corrosion resistance to a wide range of corrosive environments and its resistance to a ductile-to-brittle phase transition even at below-zero temperatures, Monel® alloy 400 is used in marine industries [2]. It is mostly used in the manufacture of marine fixtures, pumps, heat exchangers, valves, shafts, pressure vessels, and piping systems for seawater applications [3]. It has excellent corrosion resistance to salty seawater, caustic alkaline solutions, hydrofluoride, and fluorine-containing media due to passive thin films on the surface [2]. Monel® alloy 400 may suffer pitting corrosion from chloride-containing media [4] and stress-cracking corrosion in an alkaline environment [5]. Hence, their surfaces can be modified through surface modification techniques to improve the surface characteristics and mechanical properties in a cavitation/corrosion environment. Over the past few decades, the advantages of ultrashort laser processing of materials have been established, and many potential applications have been tested, including surface micromachining, nanotechnology, welding, thin film deposition, and MEMS among others. Some of the laser surface treatments applied to Monel® alloy 400 and other metallic materials include ablation, hardening, melting, shocking, texturing, alloying, cladding, and deposition [6].
Many researchers have performed metal laser processing experiments to understand the interaction between ultrashort pulsed lasers and different metals. Kukliński et al [7] investigate the impact of laser treatment of the Monel® alloy 400 on the surface roughness and microhardness. The findings show that surface roughness remained low at low scanning velocities, while higher velocities had no significant impact on surface roughness. It was noted that there was a small increase in microhardness with an increase in laser beam velocity. Kukliński et al [8] reported improvement in micro-hardness and changes in the microstructure following laser alloying of the Monel® alloy 400 with boron. Rajčić et al [9] reported improvement in the resilience to deformation and micro-hardness on the surface of the Nimonic 263 following heat treatment using pulsed picosecond (ps) and nanosecond (ns) Nd:YAG laser. Bartkowska et al [6] reported that a diffusion-borided layer of Monel® alloy 400 processed by diode laser had better corrosion resistance, hardness, and wear resistance properties than the substrate material. Bartkowski et al [10] reported that there is a possibility to deposit ZrC composite coatings on a Ni-Cu alloy through laser melting.
Other studies on laser micromachining of different materials with ultrashort laser pulses have also been carried out to understand the influence of laser parameters on ablation performance. Chen et al [11] examined the effects of varied pulse separations and fluences on the ablation of Ni-based superalloys using a double-pulse femtosecond laser. They noted that an ablation area obtained with about 2 ps pulse-separation was enhanced by approximately 1.5 times that achieved by single-pulse ablation. Zhang et al [12] demonstrated that ablation rates improve as laser fluences and scanning speed increase while ablation efficiency reduces as laser fluence increases. They also establish that as scanning width reduces, ablation rates and ablation efficiency improve. Wu et al [13] established that ablation rates increase as laser fluence increases when laser ablating Cr12MoV mould steel using a picosecond laser. Schille et al [14] established that laser fluence and volume ablation rates are logarithmically related, where ablation rates increase as fluence increases in femtosecond laser processing of stainless steel and copper. In a laser drilling of stainless steel and copper using picosecond laser beams using 6 ps and 100 kHz repetition rate, Ancona et al [15], noted that ablation efficiency increases as pulse energies increase. Other researchers have carried out research using the burst mode of ultrafast laser processing of different targets and made a comparison to normal pulsed mode and have established that burst mode performs better in ablation efficiency [16–19].
It has been noted that several studies on the laser processing of materials using ultrafast lasers have been reported. However, studies on applying ultrashort lasers to process Monel® alloy 400 are still limited. Research work to understand the laser ablation mechanism on Monel® alloy 400 as far as ablation efficiency and surface finish of ultrashort pulsed laser processing are concerned is still missing. Hence, the research's objective was to understand the effects of the laser fluences, scanning velocities, hatching distances and number of scanning pass(es) on the evolution of the surface topography, ablation rates and efficiency, surface quality, surface, and bulk chemistry, and nanomechanical properties of the processed surfaces of Monel® alloy 400. The results reported in the paper are important in the field of picosecond laser ablation as far as the ablation efficiency and properties of Monel® alloy 400 are concerned after the ultrashort laser ablation process.
2. Experimental methodology
2.1. Material and its preparation
The research material used in this study is Monel® alloy 400. The Monel® alloy 400 (UNS N04400) alloy sample supplied was cut into small pieces with dimensions measuring 10 ×10 × 1 mm. The nominal percentage chemical composition of Monel® alloy 400 according to the manufacturer's material data sheet is given in table 1 [20].
Table 1. Chemical composition of the commercial Monel® alloy 400 (wt%).
| Ni | Cu | Fe | Mn | Si | C | S |
|---|---|---|---|---|---|---|
| Remainder | 28.0–34.0 | 2.5 max. | 2.0 max. | 0.5 max. | 0.3 max. | 0.024 max |
The physio-mechanical properties of the Monel® alloy 400 are tabulated in table 2.
Table 2. Physio-Mechanical properties of the Monel® alloy 400.
| Properties | Tensile strength (Annealed) (MPa) | Yield strength (MPa) | Mean Young's modulus (GPa) | Elongation at break | Poisson's ratio | Density (kg/m3) | Mean hardness (HV) | Mean melting point (°C) |
|---|---|---|---|---|---|---|---|---|
| Quantity | 517–620 | 172–345 | 182 | 48% | 0.32 | 8800 | 330 | 1320 |
Before laser processing, the Monel® alloy 400 samples were ground (using SiC foil #1200 and #2000) and polished (3 μm and 1 μm polycrystalline diamond suspensions) using a grinding-polishing machine (TEGRAMIN 30, Struers, Denmark) to a mirror-like surface finish with a surface roughness of 64.19 nm. The polished samples were then cleaned ultrasonically with acetone and ethanol for 10 min each; and afterwards dried using compressed air. The aim was to remove any surface impurities and reduce oxide layers on the polished samples.
2.2. Experimental set-up, processing parameters and procedure
The experimental setup used in the picosecond laser processing of the Monel® alloy 400 was the Perla®100 (Hilase, Czech Republic) laser system. The schematic diagram of the Perla®100 picosecond laser system and its other details have been described previously in our publication [21]. The Perla®100 with a 1 ps pulse length, 1030 nm wavelength, 1 mJ maximum achievable pulse energy, 60 kHz repetition frequency and 60 W average power was used to process the Monel® alloy 400 sample. The laser beam was focused using a 100 mm focal length telecentric F-Theta lens (Linos, Qioptiq) at normal incidence to the Monel® alloy 400 surface. The linearly polarised laser beam of Gaussian profile (M2 ≤ 1.3) was focused to a spot size diameter (D = 2ω0) of approximately 25 μm at the focal plane, where ω0 is the Gaussian beam waist 1/e2-radius of the focused laser beam. This spot diameter (D) is used for all laser parameter calculations. Laser structuring was performed in ambient air and the gases and other particulates produced during laser irradiation were extracted using an air suction device.
The laser ablation was carried out under a variety of laser processing parameters as shown in table 3: laser fluences, scanning velocities, hatching distances, and number of scanning pass(es). These parameters have a significant influence on the laser processing of materials. The limits chosen for the parameters were based on some existing publications i.e., for laser fluence [12], scanning velocity [8], hatching distances [22] and the number of scanning pass(es) [23].
Table 3. Experimental design.
| Regions | A1 | A2 | A3 | A4 | B1 | B2 | B3 | B4 | C1 | C2 | C3 | C4 | D1 | D2 | D3 | D4 |
|---|---|---|---|---|---|---|---|---|---|---|---|---|---|---|---|---|
| Laser Fluence, LF [J/cm2] | 1 | 1 | 1 | 1 | 4 | 4 | 4 | 4 | 8 | 8 | 8 | 8 | 15 | 15 | 15 | 15 |
| Scanning Velocity, V [mm/s] | 100 | 200 | 400 | 800 | 100 | 200 | 400 | 800 | 100 | 200 | 400 | 800 | 100 | 200 | 400 | 800 |
| Hatching Distance, HD [μm] | 5 | 20 | 50 | 100 | 20 | 5 | 100 | 50 | 50 | 100 | 5 | 20 | 100 | 50 | 20 | 5 |
| Number of Scanning Pass(es), n | 1 | 2 | 4 | 8 | 4 | 8 | 1 | 2 | 8 | 4 | 2 | 1 | 2 | 1 | 8 | 4 |
An area of 2.0 × 2.0 mm2 with different depths was laser-processed using the scanning patterns generated by the software (Direct Machining Control (DMC), Lithuania). Laser scanning of the samples was done using two mutually perpendicular directions (i.e., horizontal (0°) and vertical (90°)) to create a square-ablated cavity or grid pattern [24]. The first layer of the material was ablated horizontally, and the second layer was ablated vertically [12] in bidirectional scan trajectories [25]. During the raster scanning mode type of laser processing, the laser beam was moved relative to the sample at a scanning velocity by using a scanning head (intelliSCAN 14, Scanlab GmbH), resulting in the processing of a single line.
The number of laser tracts made in each of the horizontal (or vertical) scanning directions for each of regions 1, 2, 3, and 4, depending on the hatching distance, was based on equation (1):

For hatching distances of 5, 20, 50, and 100 μm, the number of laser tracts made in each of regions 1, 2, 3, and 4 was 399, 99, 39, and 19 tracts, respectively, on the horizontal (or vertical) scanning directions. From this, the whole surfaces of each of regions 3 and 4 were not fully ablated, but square grid patterns were made where there were untreated surfaces left. The total laser processing times for each of the regions 1, 2, 3, and 4 were 16, 4, 1.6, and 0.8 s, respectively.
The spot pulse overlap depends on the scanning velocity V, the laser pulse repetition rate f, and the focused laser spot diameter D. The calculated pulse overlap (PO) in the scanning direction in the current study was based on equation (2) [26];

Because the laser spot size and repetition are fixed, the PO can be altered by changing the scanning velocity [27]. Hence, PO = 0% is obtained when the distance between two sequential pulses along the scanning line is 2ω0 (i.e., scanning velocity = 1500 mm s−1), while PO = 100% when the two pulses along the scanning line fully overlap (scanning velocity = 0 mm s−1) [28]. The calculated POs in the scanning direction were 93, 87, 73, and 47%. In this scenario, the next pulse along the scanning line will always interact with the hot surface due to the previous pulse.
The hatching distance between two laser tracts affects the scanning line overlap (LO). The LO was calculated according to equation (3) [29];

where  is the hatching distance in scanning line arrangement along the horizontal (or vertical) direction. Because the laser spot size is fixed, the LO was changed by changing the hatching distance. Hence, LO = 0% is obtained when the distance between two neighbouring pulses (i.e., Δy = 25 μm) is 2ω0 while LO = 100% when the one pulse fully overlaps the pulse on the neighbouring line pulses (i.e., Δy = 0 μm) [29]. The calculated LOs were 80, 20, −100, and −300%. In the scenario, when the hatching distances are 5 and 20 μm, the first laser tract will interact with the subsequent laser tract, whereas when the hatching distances are 50 and 100 μm, the first laser tract will not interact with the subsequent laser tract.
2.3. Characterisation of the samples
The Monel® alloy 400 samples were characterized after laser irradiation to investigate the effect of the ps laser treatment on the evolution of the surface topography, ablation rates and efficiency, surface and bulk chemistry, and nanomechanical properties of the Monel® alloy 400.
2.3.1. Topographical analysis
The topography of the polished and laser-structured surfaces was analysed. The samples were examined before and after laser processing for comparison purposes. The topographies of the laser-structured surfaces were analysed using a contact 3D profilometer (Dektak XT, Bruker, Billerica, MA) with a vertical and lateral resolution of up to 0.1 nm and 0.5 μm respectively. A profilometer tip radius of 2 μm was used for the measurement. For each measurement on each laser-processed region, a total area of 300 × 300 μm was analysed, covering the width of at least 300 scanning lines. The surface roughness parameters obtained from both equipment were evaluated using the free and open-source software, Gwyddion software (http://gwyddion.net/). The surface-based parameters of the laser-structured surfaces were studied according to definitions in ISO 25178.
The dimensions of the square-shaped ablated cavity for fully ablated regions, i.e., length lx, width ly, and ablated depth lz, were measured by the profilometer. This enables the calculation of the ablation rate (AR), ablation efficiency (AE), and ablation depth per pulse (d) of ultrashort pulsed laser ablation. The overall ablated depth is approximated to be made up of the ablated depths from the active area's pulses [30]. In calculations, the ablation depth lz for fully ablated regions (regions 1 and 2) is the average ablation depth obtained from measurements from top surface to bottom (where the average reference line is drawn on it) on the ablated cavity. For regions not fully ablated (regions 3 and 4), the ablation depth lz is obtained from cross-section profiles of the V-shaped cavity [31]. In this case, the maximum depth at the centre of the V-shaped profile is used as the ablation depth lz . The shape of micro-grooves was assumed to be perfectly V-shaped [31] for the sake of simplification in the calculation.
In this study, the AR is expressed as ablation volume per pulse number or unit time and is used to describe the rate of removal of materials by an ultrashort pulsed laser [12, 25]. In the calculation of AR, it is assumed that the same volume of material is removed by each laser pulse [25]. The AR for fully ablated regions with square cavities is calculated according to equation (4) [12];

where N is the total pulse number, and  where f is the repetition frequency, and Ttotal is the total scanning time [15]. The surface roughness of the ablated cavity bottom is associated with ablation depth measuring errors [30].
The AR for not-fully ablated regions with V-shaped profiles is calculated according to equation (5);

Where lx , wy , lz , n and N are the length of the ablated V-shaped cavity, mean width of the top part of the V-shaped cavity, maximum ablated depth of the ablated V-shaped cavity, number of laser tracts made and total pulse number, respectively.
The ablation efficiency (AE) is expressed as the ablation volume per unit pulse energy [12, 25]. The AE describes the energy consumption ratio of ultrashort pulsed laser ablation. The AE for fully ablated regions is calculated according to equation (6) [12];

where Epulse is the energy of a single pulse.
The AE for not-fully ablated regions is calculated according to equation (7);

where Epulse is the energy of a single pulse.
The calculated ablation rates and efficiencies have some experimental measurement errors due to the nature of the Gaussian shape of the laser beam which can't be avoided. It is assumed that they have negligible effects on the calculations.
The average ablated depth per pulse (d) of ultrashort pulsed laser ablation was also determined. The d is calculated according to equation (8) [13];

These equations don't take into consideration the heat accumulation [25] or particle and plasma shielding in ultra-short laser processing cases because the repetition rate of the laser used is less than 100 kHz [15, 16, 18].
2.3.2. Energy dispersive x-ray spectroscopy (EDX)
The elemental quantification of the bulk and lased processed Monel® alloy 400 was achieved using an in-built energy dispersive X-ray spectrometer (Oxford Instruments, UK) attached to a scanning electron microscope (MIRA3-XMU, Tescan). A dedicated Aztec Energy Live Standard software was used for processing the measurement. The samples were examined using the PointID method using a 20 keV accelerating voltage, which corresponds to a penetration depth of approximately 1 μm. The beam intensity (BI) index of 16.5–17.5 was selected for the analysis to give higher signals. For compositional characterizations, at least 10 independent measurements at different points of interest were conducted for average computations.
2.3.3. X-ray photoelectron spectroscopy (XPS)
The XPS was used to characterize the elemental composition and chemical bonding state of the elements on the surfaces of the polished and laser-treated samples. The XPS spectra were obtained using an X-ray photoelectron spectrometer (Axis Supra, Kratos Analytical Ltd, UK) with monochromatic Al Kα radiation (energy of 1486.6 eV, emission current: 15 mA). The procedure and other details involved have been discussed in our previous publication [32]. The binding energy scale was not calibrated, as the value of the binding energy of the C 1 s energy level of the C–C/C–H signal was 285.00 eV for all samples.
2.3.4. Nanoindentation measurements
Nanoindentation measurements were carried out on the polished and laser-treated surfaces of the Monel® alloy 400. Quasistatic nanoindentation tests were carried out to measure selected mechanical properties (hardness, modulus of elasticity, and maximum displacement) of the Monel® alloy 400 samples under load-controlled indentation measurements. The local mechanical properties are important engineering parameters because they are used for the evaluation of the performance of the material in different applications [33]. Nanoindentation is based on the ability of the material to resist permanent plastic deformation due to applied force [34].
A nanoindenter (Hysitron TI 950 TriboIndenter, Bruker) with a Berkovich diamond tip (indenter) (BER_6304) was used for nanomechanical testing. The indenter has a tip radius, angle, dimensionless correlation factor, Poisson's ratio, and Young's modulus of 50 nm, 140.6°, 1.034, 0.07, and 1141 GPa, respectively [33]. When measuring, an indenter was placed into the Monel® alloy 400 sample's areas and held there until bulk plastic deformation occurred [35]. The equipment continually measures and records the applied load and the indenter's position in relation to the specimen's surface throughout the indentation process. By measuring the penetration depth for an indenter with specified geometry, the contact area at full load may be calculated [34]. The load-displacement curve has a loading section (5 s), a load holding part (dwell time) (4 s) at maximum load to minimize the creep effects, and an unloading section (5 s) [36]. Prior to the experiment, an accurate tip area calibration in open-loop load mode was carried out [36].
The tests were made under a peak indentation load of 1 mN, and for each region, at least 5 indentations were taken, and the average values of Young's modulus, hardness, and maximum displacement. Both single indentation and multi-indentation (with a matrix of  ) methods were performed. During measurements, special attention was given to regions processed with 50 and 100 μm hatching distances, where measurements were taken at the centre of the ablation microgrooves. This was done to ensure that the mechanical properties were measured only on laser-ablated surfaces.
The generated load-displacement curve data were assessed using the Oliver and Pharr method [37]. The reduced modulus Er is defined by equation (9) [36];

where E and ν and  and
and  are the Young's modulus and Poisson's ratio of sample and the indenter, respectively. Equation (9) shows that Er depends on Young's modulus and Poisson's ratio [38].
The contact stiffness S, that is, the rate of change of load and depth, show that Er is related to the projected contact area, A(hc), is defined as per equation (10) [37],

The contact depth  between the indenter and specimen
  is calculated using equation (11) [36],

Where,  is the maximum displacement,
  is a constant that depends on the indenter geometry (wherein the
  was 0.75 for the Berkovich indenter [36]) and
  is a peak indentation load.
The indentation hardness is defined by equation (12) [35].

3. Results and discussion
3.1. The pulsed ps laser ablation process
Laser ablation of metals with ultrashort laser pulses is a complex process and is affected by many laser and scanning parameters, such as laser fluence, scanning velocity, hatching distance, and the number of scanning pass(es) [39]. The process involves laser pulse-solid material interaction happening on a picosecond time scale, vapour and plasma formation and expansion, liquid expulsion and material evaporation, and laser-plasma interaction [39]. Ablation with picosecond pulses is associated with equilibrium vaporization and phase explosion [40]. During the ps laser processing of Monel® alloy 400, the removal of materials originated from a single pulse, with pulse energy Epulse, which facilitates the ablation process. The peak fluence, Fo, of the Gaussian laser beam is related to pulse energy, Epulse and the spot radius,  and given by equation (13) [26];

where P is the average power, A is the area of the focus by the laser beam, f is the repetition rate, ω0 is the beam radius at the waist.
The laser processing of the material, constrained by the focus diameter, is executed in scanning mode. As a result, laser ablation is affected by laser fluence, scanning velocity, hatching distance, and scanning pass(es). The PO can be used to describe how scanning velocity affects laser ablation, as shown in equation (2) [12].
3.2. Topographical observations of laser-treated surfaces
In this study, a polished sample (shown as an optical image in figure 1(a)) was laser ablated under laser processing parameters i.e., laser fluence, scanning velocity, hatching distance and scanning pass. The surface areas of 2 ×2 mm2 of Monel® alloy 400 (shown as an optical image in figure 1(b)) were processed in raster scanning mode, where the laser beam was irradiated line by line and each region was processed under different combinations of the four laser and scanning parameters as was presented in table 3.
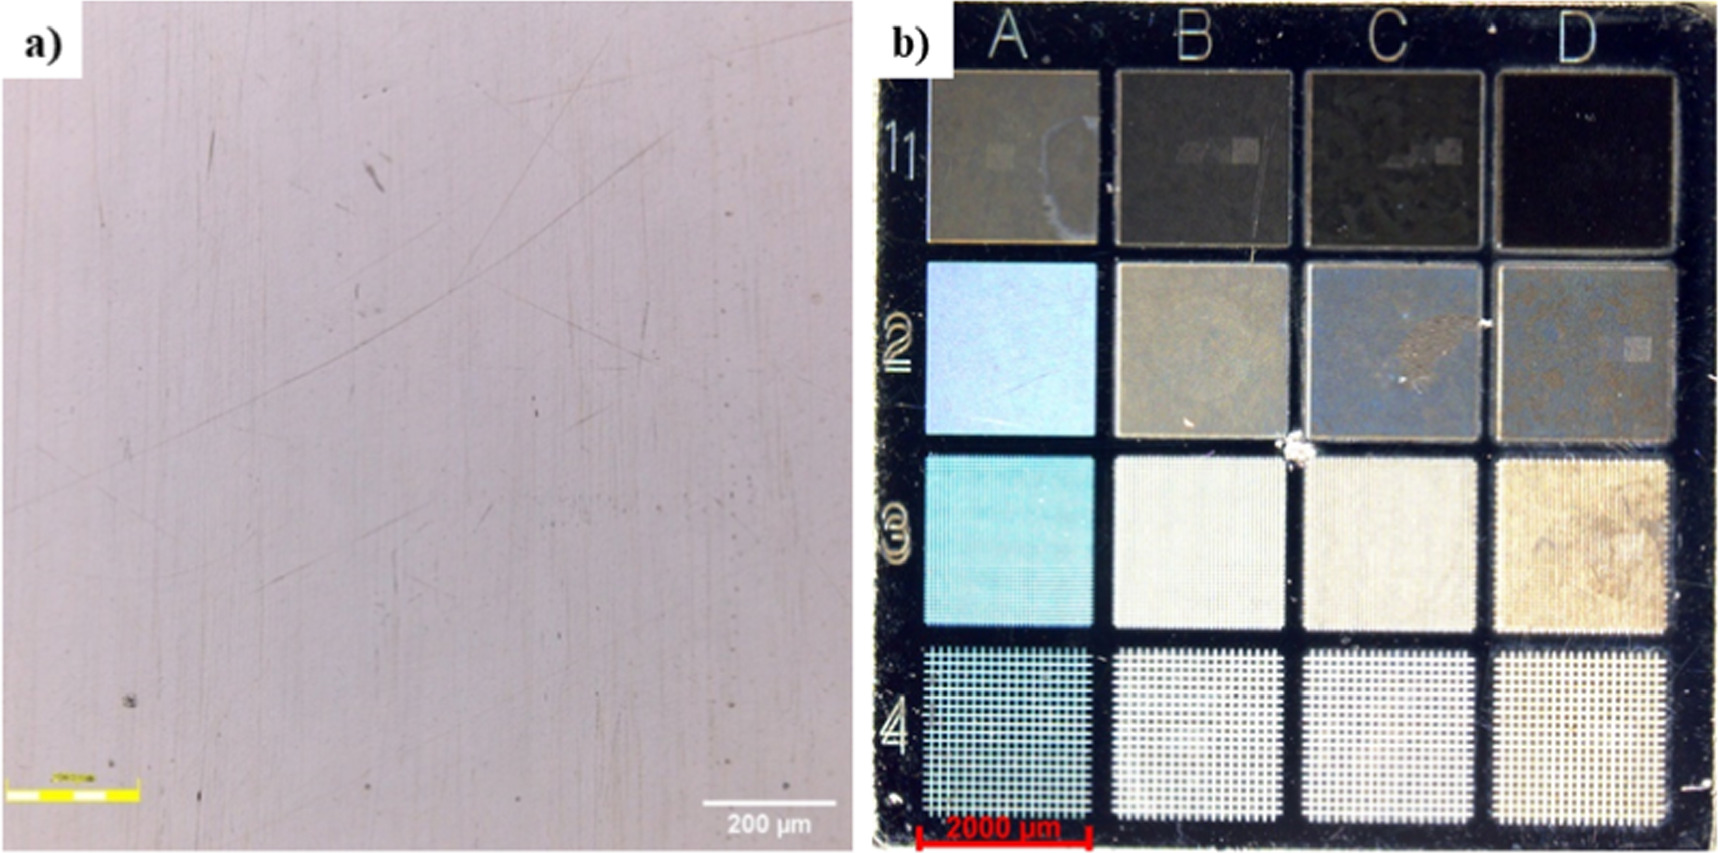
Figure 1. Optical images showing (a) the polished surface, and (b) the laser-structured surfaces (A1, A2, A3,...., D3 and D4) of the Monel® alloy 400 sample processed under different combinations of the four laser and scanning parameters as was presented in table 3.
Download figure:
Standard image High-resolution imageThe coloured regions signify the presence of different topographical features on the laser-ablated surfaces [41].
Figure 2 shows a part of the depth profiles on B1, B2, B3, and B4 regions of the ps laser ablated Monel® alloy 400 surfaces processed using laser fluence of 4 J cm−2. As seen in figure 2, the four regions are ablated differently, with surfaces on regions B1 and B2 ablated to form square-shaped ablation cavities, while surfaces on regions B3 and B4 form V-shaped microgrooves. These topographies are replicated in other regions on Monel® alloy 400 as per the experimental method, where square-shaped ablation cavities are created in regions 1 and 2, while V-shaped micro-grooves are formed in regions 3 and 4. These topographies resulted because hatching distance has an influence on the scanning line overlap (LO) [29].
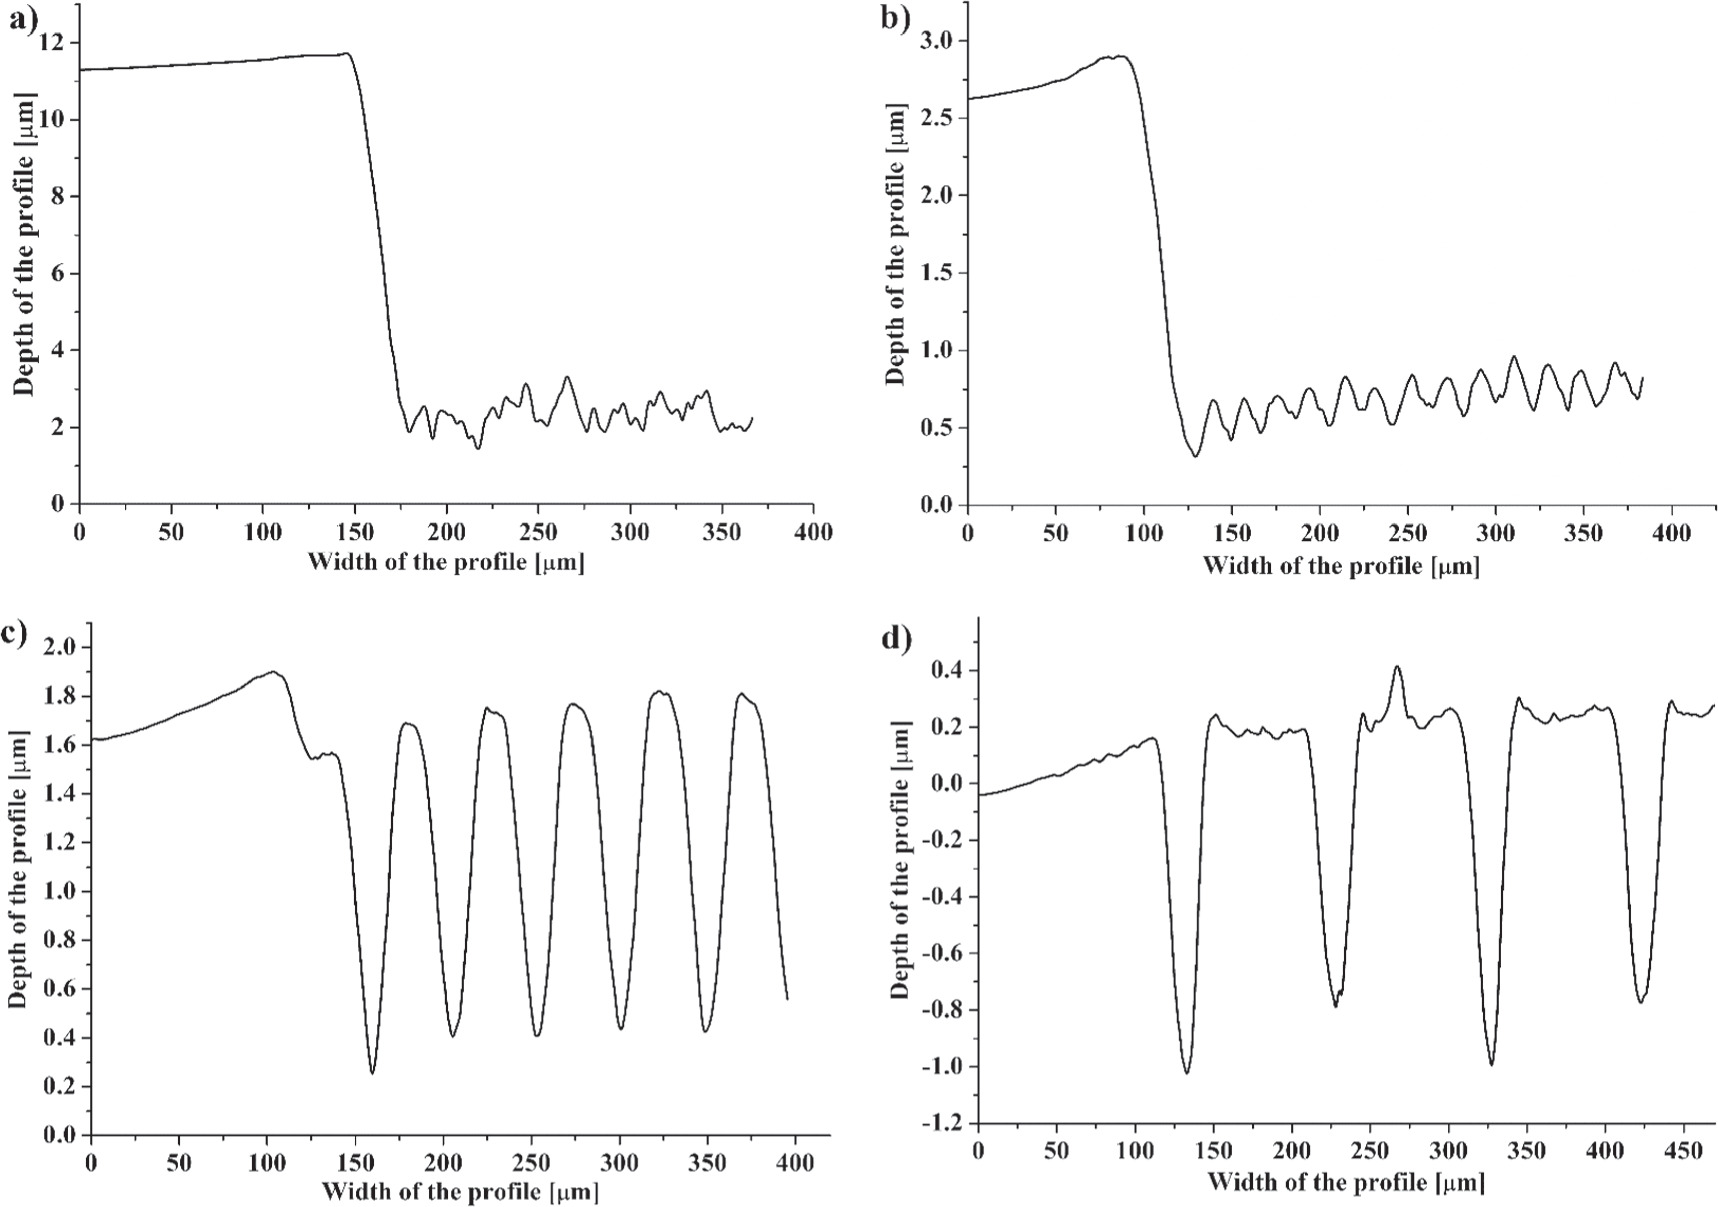
Figure 2. A section of depth profiles on (a) B1, (b) B2, (c) B3, and (d) B4 regions of the ps laser-ablated Monel® alloy 400 surfaces using laser fluence of 4 J cm−2.
Download figure:
Standard image High-resolution imageRegions B1 and B2 formed the cavities during the ablation process because the LOs used there were 80 and 20% respectively, which ensures that the next laser line along the scanning direction will always interact with the area of the previous laser line [27]. As a result, the area between two neighbouring laser tracts is fully ablated. The base of the B1 cavity has a surface roughness of 0.50 μm while the B2 cavity shows undulations with a pitch of 19.5 μm, which are probably due to the hatching distance used during ablation. The wall angles of the ablated cavities, however, were low, ∼16° and ∼6° for B1 and B2 cavities, respectively, probably related to the Gaussian laser intensity distribution [42].
On the B3 (figures 2(c)) and B4 (figure 2(d)) regions, periodic micro-grooves are formed on the surface of Monel® alloy 400. This is where the laser beam (laser tracts) passes through and forms almost V-shaped micro-grooves due to the Gaussian-shaped laser beam. The B3 and B4 regions have LOs of −100 and −200% respectively, and in this case, the area between two neighbouring laser tracts is not fully ablated [27]. The untreated region on the B3 region has a conical-shaped top surface, while the B4 region has a roughly square top flat surface, because of the different hatching distances used and the left-right and top-down scanning directions of the laser beam.
3.2.1. Effects of laser fluence and scanning velocities on ablation depth
The efficiency of the ultrashort pulsed laser ablation process is characterized by the ablation rate, which in turn determines the maximum depth of the layer ablated by a laser pulse [43]. Since ultrafast lasers are used for precision machining, a minimal ablated depth dimension is desirable. The ablation depth value is the average value of the depth of a cavity/micro-groove. The influences of laser fluence and scanning velocities on the ablation depth are shown in figures 3(a) and (b) respectively. They are comparative graphs where all four parameters have been plotted for comparison.
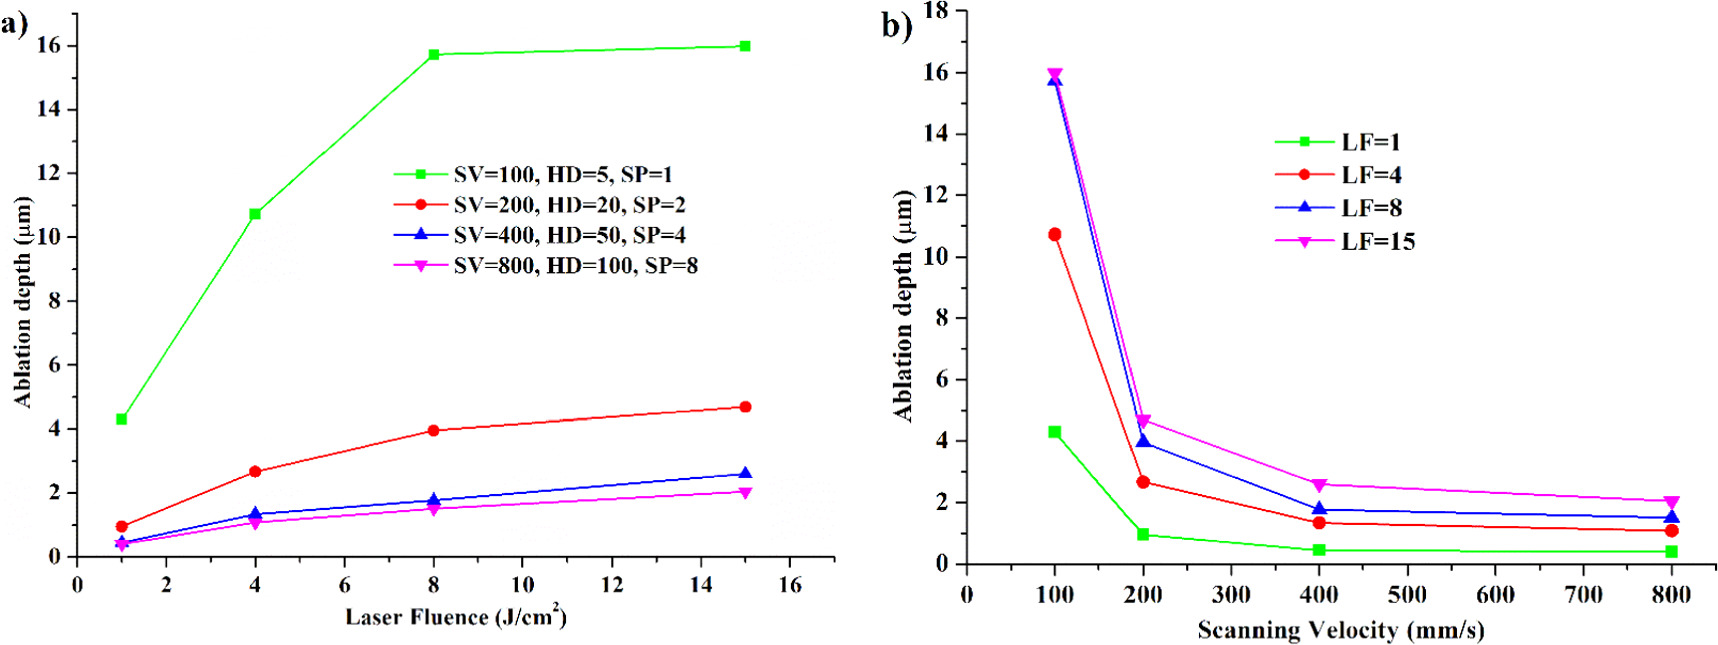
Figure 3. Effects of (a) laser fluence under different scanning velocity (SV), hatching distance (HD) and scanning pass(es) (SP) parameters; and (b) scanning velocity under different laser fluences (LF) on ablation depth of the ps ablated surfaces.
Download figure:
Standard image High-resolution imageThe experimental results from figure 3(a) showed that the ablation depth outcome exhibited similar behaviours at four laser fluences. Under different scanning velocities, hatching distances, and scanning pass(es), the ablation depths increase in a logarithmic manner as the laser fluences increase. This is because the ablating depth per pulse, d, for low peak laser fluence regime, is roughly calculated as  where α−1 is the optical penetration depth, F0 is peak laser fluence and Fth,g is the gentle ablation threshold fluence [44, 45] while for the high peak laser fluence, it is roughly calculated as
  where δ is the effective energy penetration depth, F is the high peak laser fluence and Fth,s is the strong ablation threshold fluence [25]. As pulse energy increases, the energy deposited on the substrate increases. As more energy is deposited, laser threshold fluence will be overcome and laser heating generated beneath the surface causes an increase in temperature. As temperature increases, more material will undergo a thermodynamic phase change and will be ablated, which will increase the ablation depth. For the case of 100 mm s−1 scanning velocity, 5 μm hatching distance, and one scanning pass, the ablation depth is highest in comparison to the other three, and it increases as laser fluence increases but eventually saturates at higher fluence. This means that the ablation depth has an optimum fluence beyond which any increase in laser fluence is no longer advantageous in terms of energy [25]. It can be stated that the ablation depth is highest at all laser fluences when the values of the scanning velocity, hatching distance, and scanning passes are lowest, and vice versa.
The saturation trend of the ablation depth at the higher laser fluence is due to high fluences irradiating the surface and the high pulse and line overlap [26]. At region D1, high fluences will generate high temperatures that will facilitate the melting and evaporation of the material in a complex ablation mechanism. There will be a mixture of liquid droplets and vapours under high pressure and expansion, but some of the molten material does not leave the surface and resolidifies/recast within the ablated square cavity [40]. The recast layer formed can be considered as incomplete expulsion of the material under strong ablation [40] and this will finally cause saturation in ablation depth.
Figure 3(b) shows the relationship between scanning velocity and the ablation depth of the laser-ablated surfaces under different laser fluences. The experimental results from figure 3(b) showed that the four curves were similar for the laser ablation at four scanning velocities. Under the same laser fluence, the ablation depths decrease in an almost logarithmic manner as the scanning velocities increase. The ablation depth is lowest at a laser fluence of 1 J cm−2 and highest at a laser fluence of 15 J cm−2 at four scanning velocities.
The difference between the results of the four scanning velocities is due to the values of the laser pulse spot overlap (PO) rate and number of pulses [23]. When the scanning velocity is low, such as 100 μm s−1, the laser pulse spot overlap rate and the number of laser pulses irradiated during a single scan are greatest. Therefore, the interaction time between the beam and the material and the number of laser irradiation pulses per unit time and unit distance will be the highest, and this will ablate the material deeply [46]. As scanning velocity increases, the laser spot pulse overlap rate and the number of laser pulses decreases. The interaction time and the number of laser irradiation pulses per unit time and unit distance will reduce, and the depth of the ablation will also reduce [46]. The importance of these parameters for ablation depths is that they can be controlled so that the feed rate for the ablation rate can be adjusted during laser processing, to improve the precision of the ultrafast pulsed laser processing of the materials.
3.2.2. Effects of laser fluence and scanning passes on ablation depth per pulse
The ablated depth per pulse (in μm/pulse) was also calculated, and the experimental values were plotted. The influences of laser fluences and scanning passes on the ablation depth per pulse are shown in figures S1(a) and S1(b) respectively, in Supplementary Information. Under different scanning velocities, hatching distances, and scanning pass(es), the ablation depth per pulse increases as laser fluences increase in a logarithmic manner, as observed in figure S1(a). This is a result of the increase in pulse energy, which leads to deeper depth, thereby increasing the rate of material removal [39]. It can also be noted that a scanning velocity of 800 mm s−1, a hatching distance of 100 μm, and eight scanning passes give the highest ablation depth per pulse.
Figure S1(b) shows the relationship between scanning passes and the ablation depth per pulse of the laser-ablated surfaces under different laser fluences. Under the same laser fluence, the ablation depth per pulse increases as the scanning passes increase. The results show that the ablation depth per pulse significantly increases with a higher number of scanning passes owing to the higher number of laser pulses per area (higher laser energy per area) [39]. It can also be observed that a laser fluence of 15 J cm−2 gives the highest ablation depth per pulse, while a laser fluence of 1 J cm−2 gives the lowest ablation depth per pulse.
3.2.3. Effects of laser fluence on aspect ratios and surface roughness
Usually, ultrafast lasers are used for precision machining, and hence low surface roughness and aspect ratio are desired [28]. Therefore, a good understanding of how laser processing parameters affect the quality of the resulting surface structures is important. The quality of the ablated surface is described by the surface roughness [43]. The surface roughness (Sa) of polished Monel® alloy 400 was 64.19 nm and it is noted that surface roughness is increased during laser ablation.
Figure 4(a) shows the relationship between laser fluence and surface roughness under different scanning velocities, hatching distances, and scanning passes. It was observed that the lowest surface roughness is 0.0936 μm when the laser fluence, scanning velocity, hatching distance, and scanning passes are 1 J cm−2, 200 mm s−1, 20 μm, and 2, respectively. It was also noted that the surface roughness increases as the laser fluence increases. The surface roughness is lowest at all laser fluences when the scanning velocity, hatching distance, and scanning passes are 200 mm s−1, 20 μm and 2 passes, respectively. However, the ablation quality obtained is extremely poor (Sa = 3.995 μm) when using the highest laser fluence at the scanning velocity of 100 mm s−1, hatching distance of 5 μm, and one scanning pass as observed in figure 4(a).
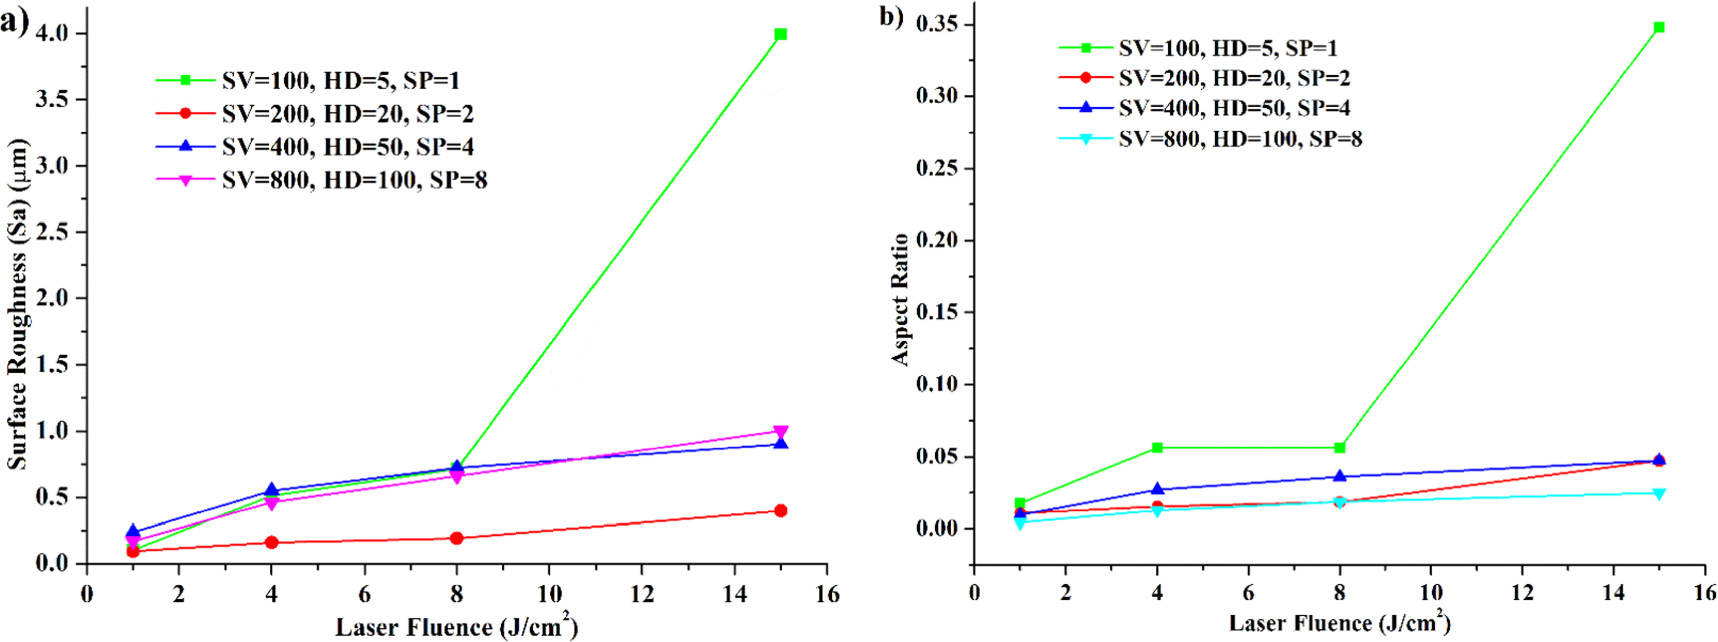
Figure 4. Effects of laser fluences on the (a) mean surface roughness and (b) aspect ratios under SV, HD and SP on the different regions of the ps laser irradiated Monel® alloy 400 surfaces.
Download figure:
Standard image High-resolution imageFigure 4(b) shows the development of the average aspect ratios of the structural depths at the bottom of the ablated cavity for different values of scanning velocity, hatching distance, and scanning passes as a function of the laser fluences. The aspect ratios are calculated as the quotient of the average structure depth and the corresponding pitch or width of the cross-sectional profile on the laser-treated surfaces. In figure 4(b), the aspect ratios are less than one for all the regions and range from 0.0044 to 0.3484. It can be observed in figure 4(b) that as laser fluences increase, the aspect ratio increases too. It was also established that the lower the scanning velocity, hatching distance, and number of scanning passes, the higher the aspect ratios, and vice versa. For the regions processed by the scanning velocity of 100 mm s−1, the aspect ratios vary for all the laser fluences used in the experiment. The worst case is when the laser fluence is 15 J cm−2 where the aspect ratio is 0.3484, and it is the highest value.
The increase in surface roughness and aspect ratio is a result of pulse energy per unit area. Higher laser fluences result in higher pulse energy per unit area, which has more thermal effects on the surface of the material [39]. This will lead to the development of deeper and rougher surfaces [42]. The aspect ratios and surface roughness results demonstrated that the ps laser processing of material at low scanning velocity, small hatching distance, and few scanning passes at the different laser fluences can obtain better ablation quality.
3.2.4. Effects of laser fluence and scanning velocities on ablation rate and efficiency
The efficiency of the ultrashort pulsed laser ablation process is characterized by the ablation rate. The influence of laser fluences on the ablation rate under the same scanning velocity, hatching distance, and scanning pass(es) is displayed in figure 5(a). It can be noted in figure 5(a) that the ablation rate increases as laser fluence increases. At the largest laser fluence of 15 J cm−2, the ablation rate is about 4–10 times that of the smallest laser fluence of 1 J cm−2 under different values of the scanning velocity, hatching distance, and the scanning pass(es). Particularly for a scanning velocity of 100 mm s−1, a hatching distance of 5 μm, one scanning pass, and 15 J cm−2 laser fluence, the ablation rate can get to its maximum value of 66.625 μm3 pulse−1, as seen in figure 5(a). For the cases of scanning velocities of 100 and 200 mm s−1, hatching distances of 5 and 20 μm, and one and two scanning passes, the ablation rates increase as laser fluences increase but eventually saturate at higher fluence. This means that the ablation rate has an optimum fluence beyond which any increase in laser fluence is no longer advantageous in terms of energy [25]. Theoretically, the ablation rate is always increasing with fluence [25, 43].
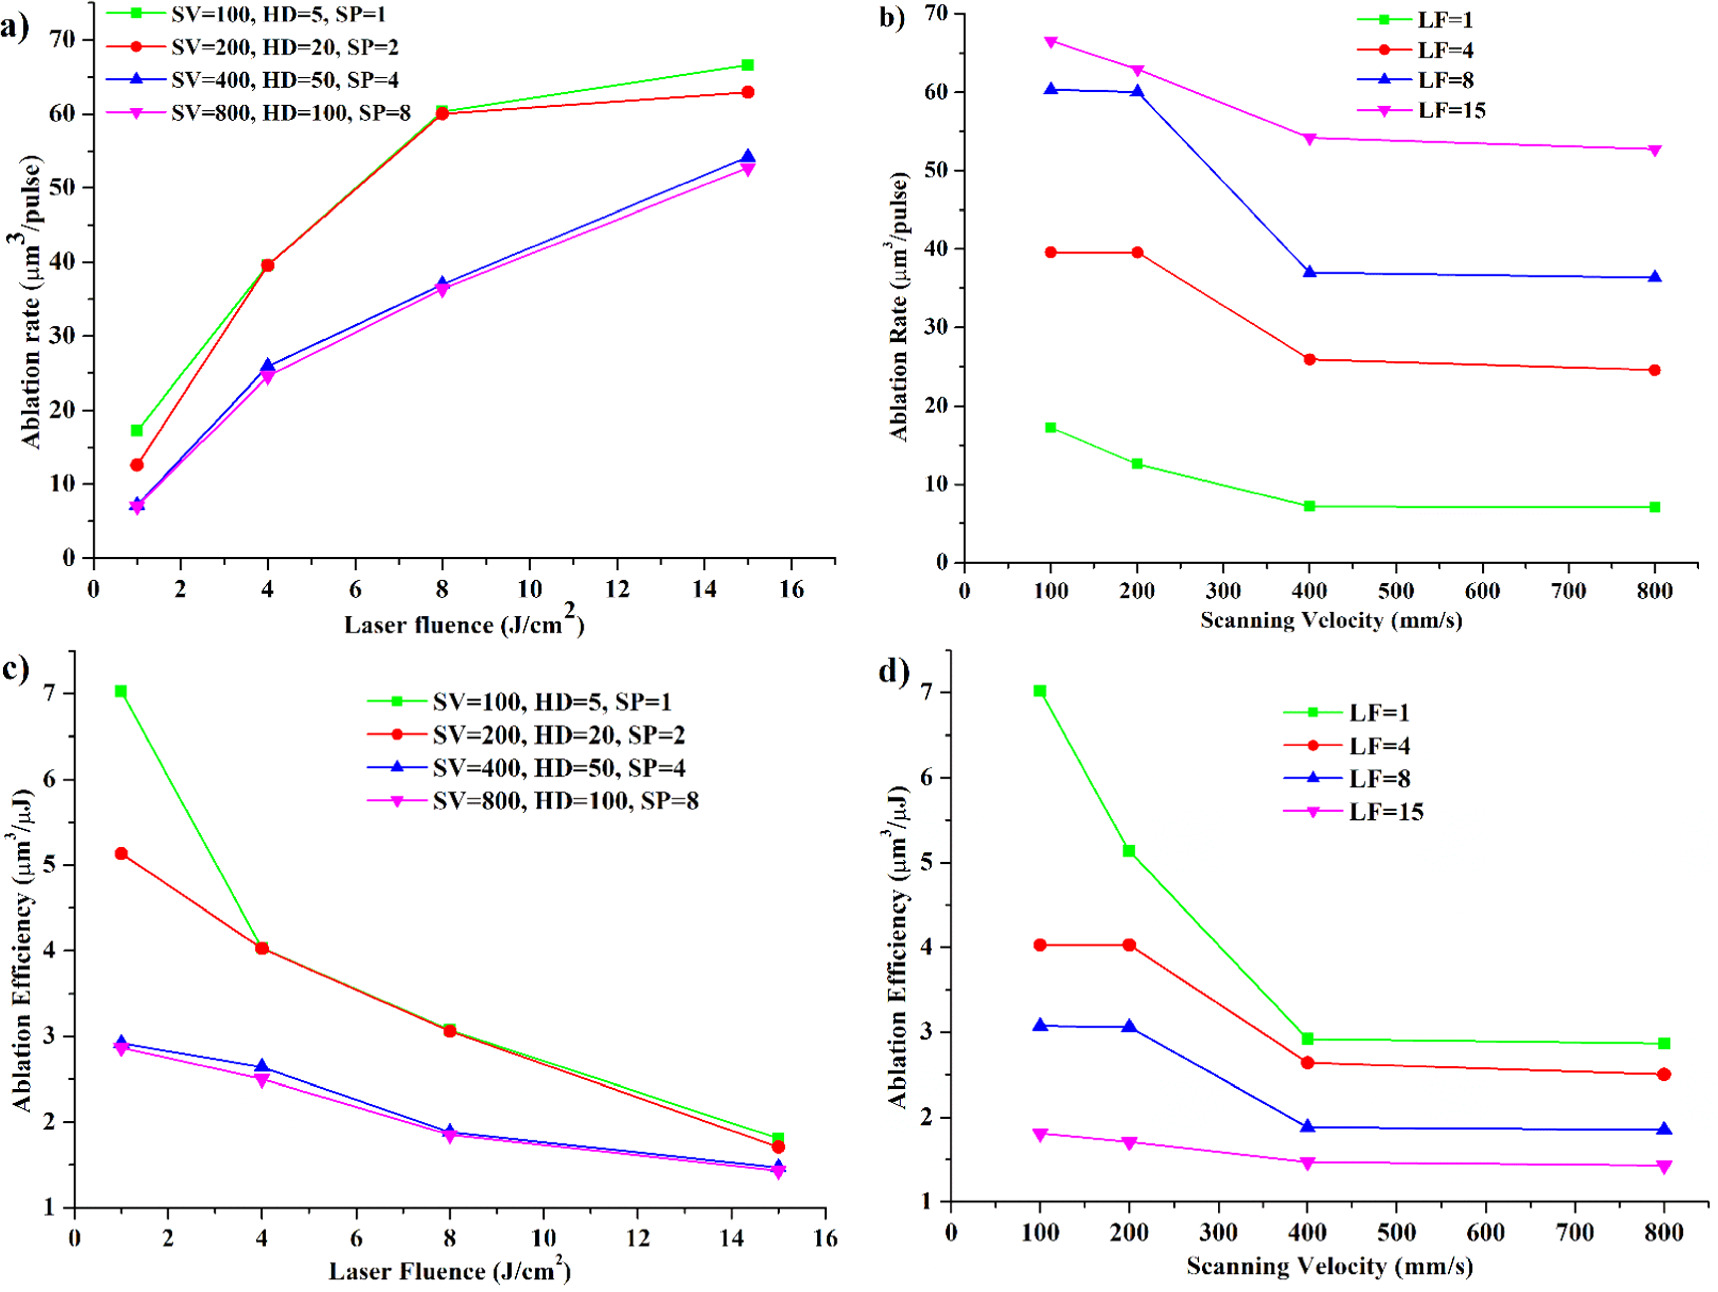
Figure 5. Effects of laser fluence on (a) ablation rate, and (c) ablation efficiency under the SV, HD and SP; Effects of the scanning velocity on (b) ablation rate, and (d) ablation efficiency under different LF during ps laser ablation of the Monel® alloy 400.
Download figure:
Standard image High-resolution imageFigure 5(c) presents the influence of laser fluence on ablation efficiency under the same scanning velocity, hatching distance, and scanning pass(es). It can be observed that the influence of laser fluence on ablation efficiency is contradictory to that of ablation rates. Figure 5(c) shows that the ablation efficiency decreases as laser fluence increases. In addition, the ablation efficiency using 100 mm s−1 scanning velocity, a 5 μm hatching distance, and one scanning pass is higher than that utilizing the higher scanning velocities and larger hatching distances. This trend is similar to that of the ablation rate in figure 5(a). This finding indicates that the laser ablation process in scanning mode using the lowest scanning velocity, lowest hatching distance, and one pass can give better processing efficiency.
The ablation rates and efficiency results showed that while ablation rates increased with increasing laser fluence, ablation efficiency decreased as laser fluence reduced. It is possible to attribute the enhancement in ablation rate to the increment in material removal rate. As pulse energy increases, laser fluence increases and this generates a lot of heat on the material which will initiate thermodynamic phase explosion [15] and which will lead to increases in the ablation depth of the material. Also, as pulse energy increases, the laser ablation diameter increases, which will expand the width of the laser ablation. This will also improve the material removal rate, and with both increases in ablation depth and width, the ablation rate will eventually increase [12].
The saturation trend of the ablation rates at the higher laser fluence is due to high fluences irradiating the surface and the high pulse and line overlap [26]. High fluences will generate high temperatures that will facilitate the melting and evaporation of the material in a complex ablation mechanism. There will be a mixture of liquid droplets and vapours under high pressure and expansion, but some of the molten material does not leave the surface and resolidifies/recast within the ablated square cavity [40]. The recast layer formed can be considered as incomplete expulsion of the material under strong ablation [40] and this will finally cause saturation in ablation depth, leading to saturated ablation rates. However, when the pulse energy increases, the heat accumulation effect gets worse, allowing a lot of laser energy to diffuse into the environment and then get absorbed by the substrate, which ultimately results in decreased ablation efficiency [12].
The scanning velocity plays a significant role in the ablation rate, and its influence is displayed in figure 5(b). It can be noted in figure 5(b) that the ablation rate decreases as scanning velocity increases under the same laser fluence. The ablation rate is higher at lower scanning velocities than at higher scanning velocities under the same fluence. Under all fluences, the ablation rate is highest at the lowest scanning velocity. Under all four scanning velocities, the ablation rate is highest at the highest laser fluence, and vice versa.
The scanning velocity influences ablation efficiency significantly. Figure 5(d) presents the influence of scanning velocity on ablation efficiency under laser fluence. It can be noted in figure 5(d), that the ablation efficiency decreases as scanning velocity increases under the same laser fluence. The ablation efficiency is higher at lower scanning velocities than at higher scanning velocities under the same fluence. Under all fluences, ablation efficiency is highest at the lowest scanning velocity. Under all four scanning velocities, ablation efficiency is highest at the lowest laser fluence, and vice versa. Theoretically, scanning velocity does not affect ablation rate and efficiency directly. However, it has been determined that both ablation rate and efficiency decrease as scanning velocity increases.
The difference between the results of the four scanning velocities is due to the values of the laser pulse spot overlap (PO) rate, which depends on the number of pulses [23] and the equivalent ablation time [12]. The effective pulse number per focus diameter, Neff is given by  where D, f and V are focussed diameter, repetition rates and scanning velocity respectively [12]. When the scanning velocity is low, such as 100 mm s−1, the laser pulse spot overlap rate during a single scan is greatest. Higher PO means that more pulses are incident at one laser spot, which leads to reduced threshold fluence and thus higher ablation rates and efficiency. This is because the ablating depth per pulse, d, for laser fluence above 1 J cm−2 [45] is roughly calculated as
  where δ is the effective energy penetration depth, F is the laser fluence, and Fth is the strong ablation threshold fluence [25]. Therefore, if the ablation threshold fluence is lowered by pulse stacking, then the ablation depth per pulse will increase. Equivalent ablation time is defined as the duration of laser pulses per focus diameter and is given by
  [12]. So, when the scanning velocity is 100 mm s−1, the equivalent ablation time by the beam on the material will be the highest, and this will result in heat accumulation hence the threshold fluence is lowered. Because of reduced threshold fluence, the laser beam will ablate the material deeply [46]. As a result, material removal will be the highest, which translates to high ablation rates and efficiency. As the scanning velocity increases under the same laser fluence, the laser spot pulse overlap rate and equivalent ablation time decrease. This will lead to a reduction in material removal, which translates to low ablation rates and efficiencies.
It can be stated from this section that it is advantageous to use low laser fluences and low scanning velocities during laser processing to get reasonable ablation rates and efficiency. This will have a significant effect on reducing surface roughness for a given ablation depth and potentially minimizing the heat-affected zone (HAZ).
3.3. Energy dispersive x-ray spectroscopy (EDX)
To analyse the influence of the laser ablation on the composition of the bulk laser-treated Monel® alloy 400, the treated regions were examined with energy-dispersive x-ray spectroscopy (EDX). Point-type EDX measurements were carried out at laser-ablated regions or tracts and on the polished sample for comparison. The average compositions of all elements of the Monel® alloy 400 were compared among the regions after laser beam treatment, and a comparison was made with that of the polished sample. The sample EDX spectra of laser-irradiated surfaces on regions A2 and A4 are shown in figure 6, where the A2 region is a fully ablated surface while the A4 region is not fully ablated. The A2 and A4 regions were used for comparison purposes so that elemental composition on the fully ablated and not fully ablated surfaces can be made. Figures 6(a) and (c) are SEM images obtained from the surfaces of A2 and A4 regions, respectively, while figures 6(b) and (d) are the EDX spectra obtained from A2 and A4 regions, respectively. The EDX spectra of these two regions demonstrated that the chemical composition of the laser-ablated Monel® alloy 400 consisted of nickel, copper, carbon, iron, manganese and some small amounts of oxygen, silicon, and sulphur elements.
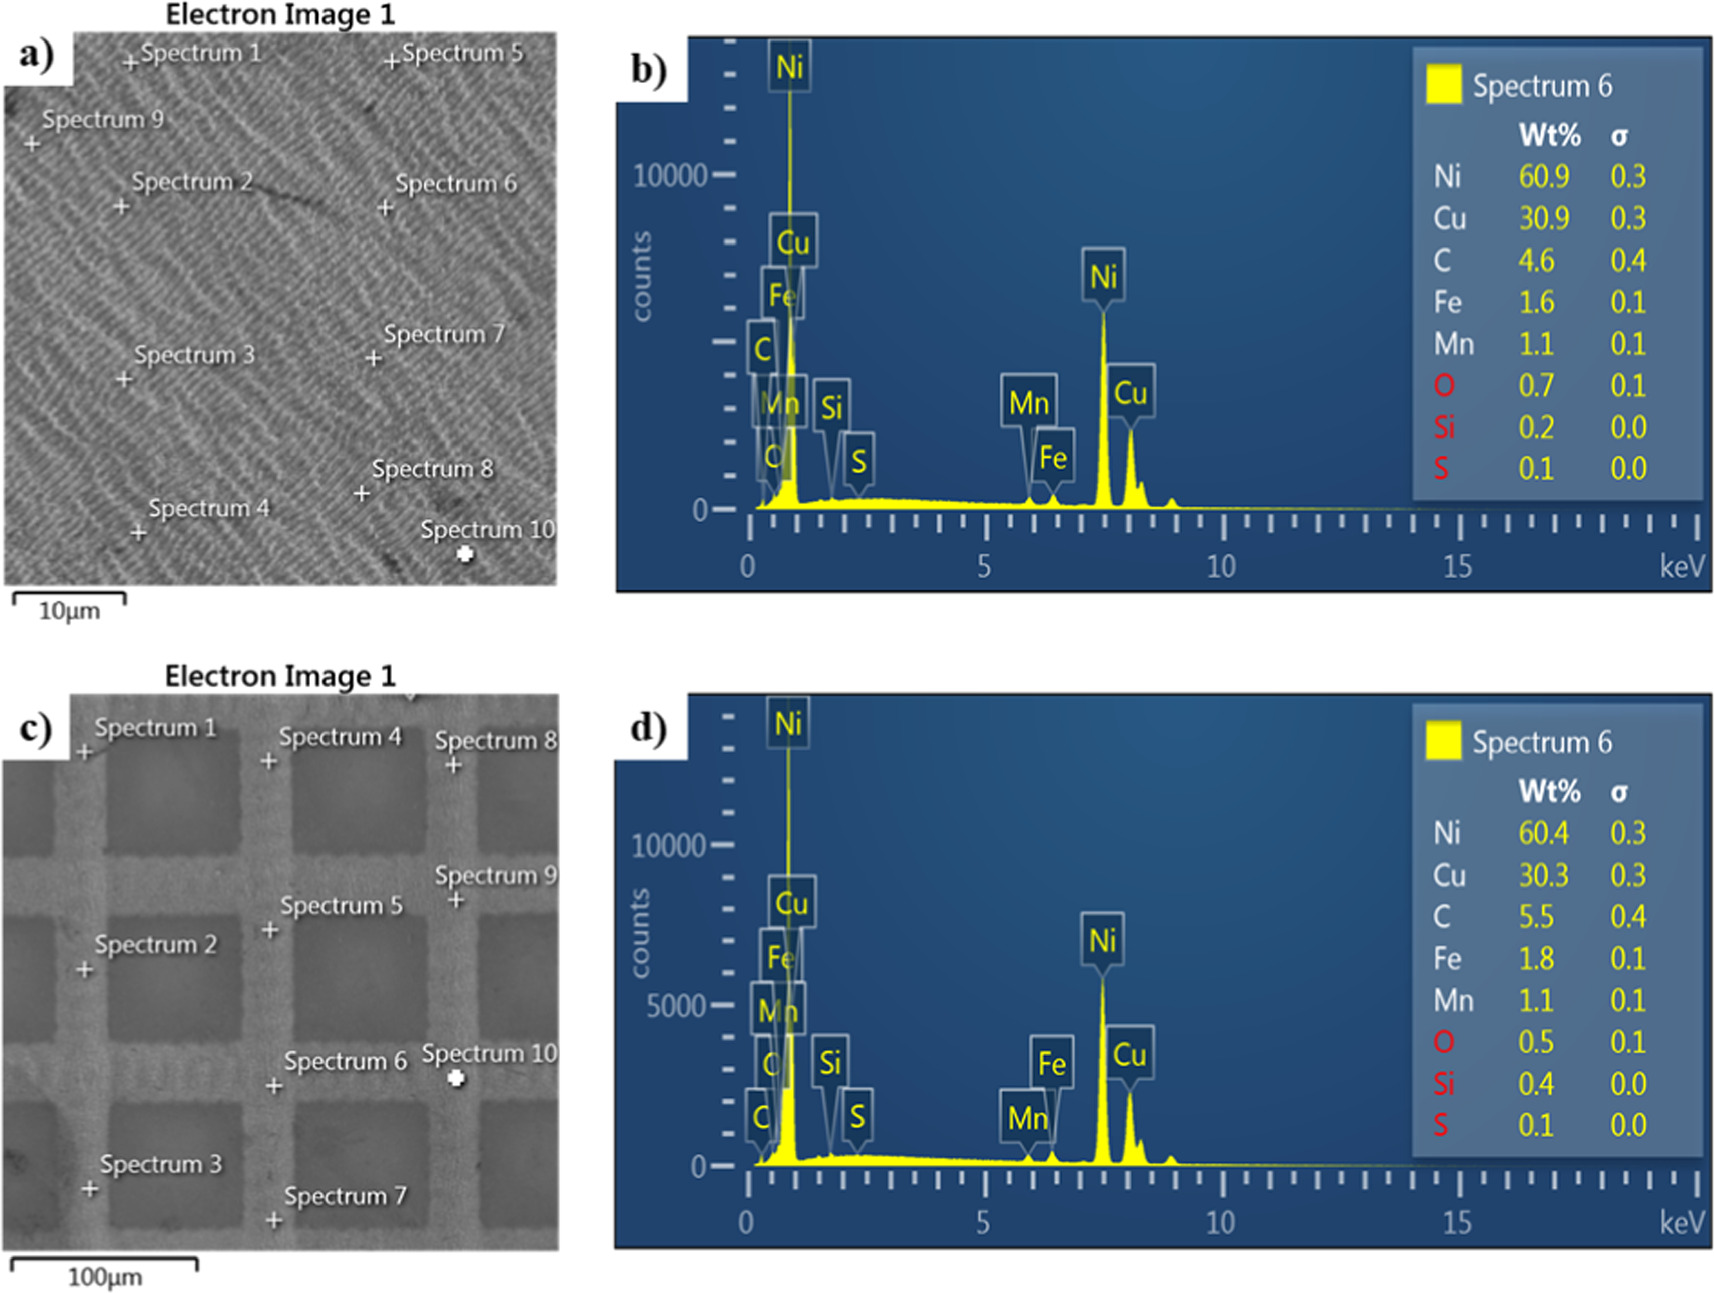
Figure 6. (a) and (c) are SEM images; (b) and (d) are EDX spectra of the irradiated Monel® alloy 400 surfaces of A2 and A4 regions respectively.
Download figure:
Standard image High-resolution imageThe EDX data also highlights the dominant presence of Ni as the main alloying element on Monel® alloy 400. The EDX data on the elemental composition of the bulk polished and laser-structured Monel® alloy 400 is tabulated in tables 4 and S1 in the supplementary information. Table S1 also shows the percentage change in the composition of the elements after laser processing in comparison to the polished sample. It can be noted from tables 4 and S1 that the average elemental composition of the laser-ablated zones exhibits almost similar data to that of the polished sample.
Table 4. Average composition (wt. %) of the elements in the sample's regions as per EDX.
| Elements (%) | ||||||||
|---|---|---|---|---|---|---|---|---|
| Sample/Regions | C | O | Si | S | Mn | Fe | Ni | Cu |
| Polished | 3.34 | 0.37 | 0.31 | 0.02 | 1.09 | 2.10 | 64.37 | 28.40 |
| A1 | 2.39 | 1.60 | 0.31 | 0.02 | 1.09 | 1.93 | 62.15 | 30.51 |
| B1 | 3.25 | 3.32 | 0.27 | 0.02 | 1.15 | 1.85 | 58.74 | 31.40 |
| C1 | 1.23 | 1.91 | 0.13 | 0.02 | 1.13 | 2.01 | 62.26 | 31.31 |
| D1 | 3.33 | 5.64 | 0.19 | 0.02 | 1.02 | 1.82 | 58.18 | 29.80 |
From table 4, it is noted that the nickel element in laser-treated regions has slightly decreased in comparison with that of the polished sample. This change in composition shows that the Ni element might have undergone a reduction reaction on the surface during laser ablation. The copper element in laser-treated regions has slightly increased in comparison with that of the polished sample. This might have been because more copper has been exposed due to laser ablation or has migrated up to the surface from the underlying layers after laser ablation. The carbon element in laser-treated regions has been noticeably reduced in comparison with that of the polished sample. During laser processing, the laser beam destroyed organic molecules such as adsorbed carbon on the substrate [22]. That is the reason for the decrease in the amount of adsorbed carbon in the laser-processed regions.
The oxygen elements in the laser-treated regions have significantly increased in comparison with those in the polished sample. This is because, during laser processing, the elements present on the Monel® alloy 400 and ambient air react to form a thin metal oxide layer on the processed surface [22]. The formation of the oxide layer increased the amount of oxygen content in the laser-processed regions [47]. The Si, S, Mn, and Fe elements in the laser-treated regions have altered slightly in comparison with those in the polished sample. However, their composition remained relatively the same after laser ablation.
It can also be noticed from table S1 that the amount of oxygen in the A1, B1, C1 and D1 regions is among the highest among all other regions. This shows that the lowest scanning velocity, smallest hatching distance, and one scanning pass under different laser fluences generate rougher surfaces with higher Sa values, as can be confirmed by figure 4(a). Rougher surfaces have undergone more oxidation during the ablation process due to higher pulse energy per unit area, hence forming thicker oxides. The increase in those regions could also be attributed to the presence of more pockets of air. Rajab et al [48] establish the same findings in their case of laser structuring 316 L stainless steel.
It can be summarized that the elements on both polished and laser-ablated Monel® alloy 400 were mostly Ni and Cu, with small amounts of C, Fe, Mn, O, Si, and S elements. The EDS data demonstrated that the chemical composition of the Monel® alloy 400 before and after laser ablation remained relatively the same. Specifically, C and Ni reduce, while Cu and O increase by small margins.
3.4. X-ray spectroscopy (XPS)
XPS is another crucial test method for determining the chemical composition of the laser-processed products on the surface of the samples under different conditions. The XPS analysis was performed on the polished and laser-treated surfaces of Monel® alloy 400. Theoretically, XPS analysis is a surface-sensitive technique, and signals are collected from a depth of approximately 10 nm from the surface [49].
Figure 7 presents the sample XPS spectra obtained from the survey XPS analysis on polished and A1 region of the laser-treated samples of Monel® alloy 400. The two spectra were compared to check if there are some changes in the chemical states on the surfaces of the polished and laser-ablated samples, quantify those changes and check the shapes of the peaks. The spectra exhibited main photoelectron peaks from Ni 2p, Cu 2p, O 1 s, C 1 s, Mn 2p, and Fe 2p, and the A1 region of the laser-processed sample show F 1 s. Also, the presence of O KLL and Cu LMM Auger peaks was established. Ni LMM Auger peak overlaps with Mn 2p peak and wasn't established. The spectra in figure 7 established that the chemical composition of the surfaces consisted of predominately nickel, copper, carbon, and oxygen, with some small amounts of manganese and iron.
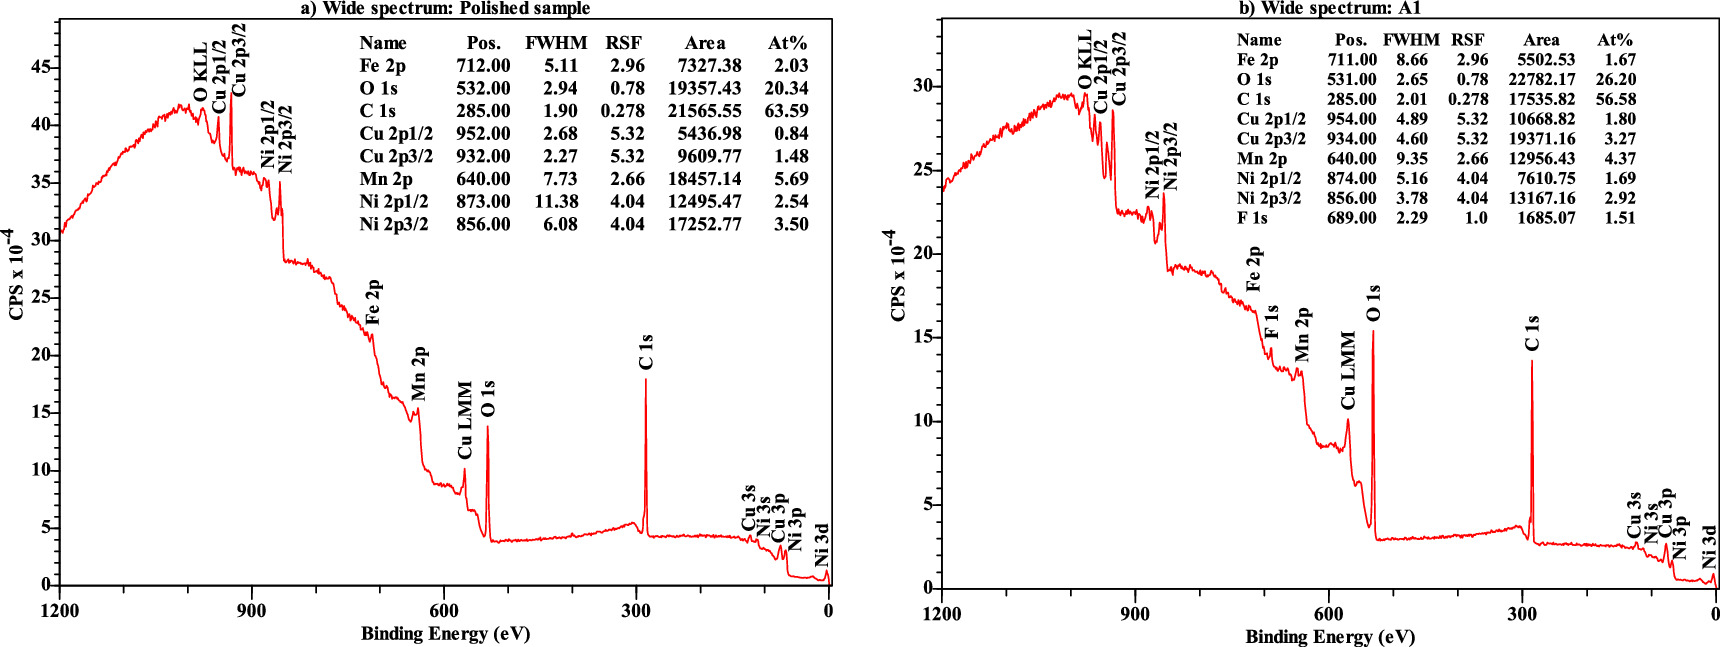
Figure 7. Survey XPS spectra for the (a) polished sample and (b) A1 regions of the laser-ablated surfaces of the Monel® alloy 400.
Download figure:
Standard image High-resolution imageFrom the spectra, it is noted that the C 1 s peaks appear at the same binding energy of 285.00 eV, and this gives an indication that all the C 1 s peaks originated from the same contribution or source [50]. It could be from the alloy itself or adventitious carbon from organic pollutants in the environment [50]. The oxygen on the surface of the polished and laser-processed samples could be oxides and/or organic oxygen from the environment. The fluorine (F 1 s) seen in the spectra of the laser-processed portions is thought to have come from environmental contamination [32].
Table S2 in the Supplementary Information shows XPS data on the surfaces of the samples about the percentage of the chemical composition before and after laser processing. From table S2, it can be noted that the amount of carbon content on the laser-processed samples is lower than on the bulk polished Monel® alloy 400, except in the A2, A3, and A4 regions, where it is slightly higher than bulk material. This increment is because, during laser processing, the laser beam destroyed the organic molecules, such as adsorbed carbon, on the substrate [22]. The carbon material and the oxygen react in the presence of hot plasma above the surface during ablation to form carbon oxides, which escape to the environment. It can also be observed in table S2 that the amount of oxygen on the surface of the laser-processed samples is higher than on the polished bulk Monel® alloy 400. This is because of the oxidation process during laser processing, where the molten material, vaporized particles, and ambient air react to form a thin metal oxide layer on the laser-processed surfaces [51]. The formation of the oxide layer increased the amount of oxygen on the laser-processed surfaces.
Table 5 summarizes the relationship between the laser fluence, and nickel, copper, carbon, and oxygen contents of the laser-treated samples. From table 5, it can be noted that the amount of carbon on the laser-treated samples decreases as the laser fluence increases. This is because, during laser processing, the hot plasma facilitates a reaction between carbon and oxygen to form carbon oxides. As laser fluence increases, the amount of plasma produced increases, and this increases the rate of reaction between carbon and oxygen. This will lead to a decrease in the amount of carbon in the laser-processed regions as laser fluences increase. Li et al [50] made the same observations when the Al surface was irradiated by femtosecond laser pulses.
Table 5. Percentage composition of the elements on the laser-ablated surfaces.
| Atomic concentration (ca %) | ||||||||
|---|---|---|---|---|---|---|---|---|
| Regions | Laser fluence (J/cm2) | Ni | Cu | C | O | Mn | Fe | F |
| A1 | 1 | 4.61 | 5.07 | 56.58 | 26.2 | 4.36 | 1.67 | 1.51 |
| B1 | 4 | 5.95 | 7.25 | 42.94 | 32.78 | 6.01 | 3.61 | 1.46 |
| C1 | 8 | 7.28 | 8.37 | 39.2 | 34.62 | 7.08 | 2.79 | 0.66 |
| D1 | 15 | 10.43 | 7.56 | 35.94 | 33.49 | 8.25 | 2.75 | 1.58 |
The oxygen in the samples increases as the laser fluence increases, as noted in table 5. This is because surface oxidation occurs due to the diffusion of atmospheric oxygen into molten materials and the reaction between atmospheric oxygen and hot vaporized materials during laser ablation [52]. As laser fluence increases, the amount of molten, vaporized, and redeposited materials increases. The diffused oxygen on the molten materials and the oxidized vaporized materials that will be redeposited on the surfaces results in a final highly oxidized surface, hence leading to an increase in oxygen content [51]. There is also the increase of Ni, Cu, Fe and Mn as laser fluence increases. This could be a case where more elements on the laser-ablated surfaces have been exposed to the x-rays or more elements have migrated to the surface during the laser ablation process.
Figure 8 presents the selected three high-resolution XPS spectra of Ni 2p3/2, and Cu 2p3/2 of the Monel® alloy 400 at the polished state and after the laser processing. The three spectra were selected to show a comparison among them in terms of the chemical states of their surfaces considering the influence of laser fluence. The peak position, assignment, and quantification are shown in figure 8. In the Ni 2p3/2 spectra for polished Monel® alloy 400, regions A1 and C2 of the laser-processed Monel® alloy 400, it was observed that the Ni species were the same. In figure 8(a), the peak detected at binding energy (BE) of 852.36 eV was assigned to elemental Ni, and the peaks located at BE at 855.95 eV and 860.89 eV were assigned to NiO and its satellite peak, respectively [53, 54]. In figures 8(b) and (c), the three peaks were assigned to elemental Ni, NiO, and NiO satellite peaks, respectively [53, 54].
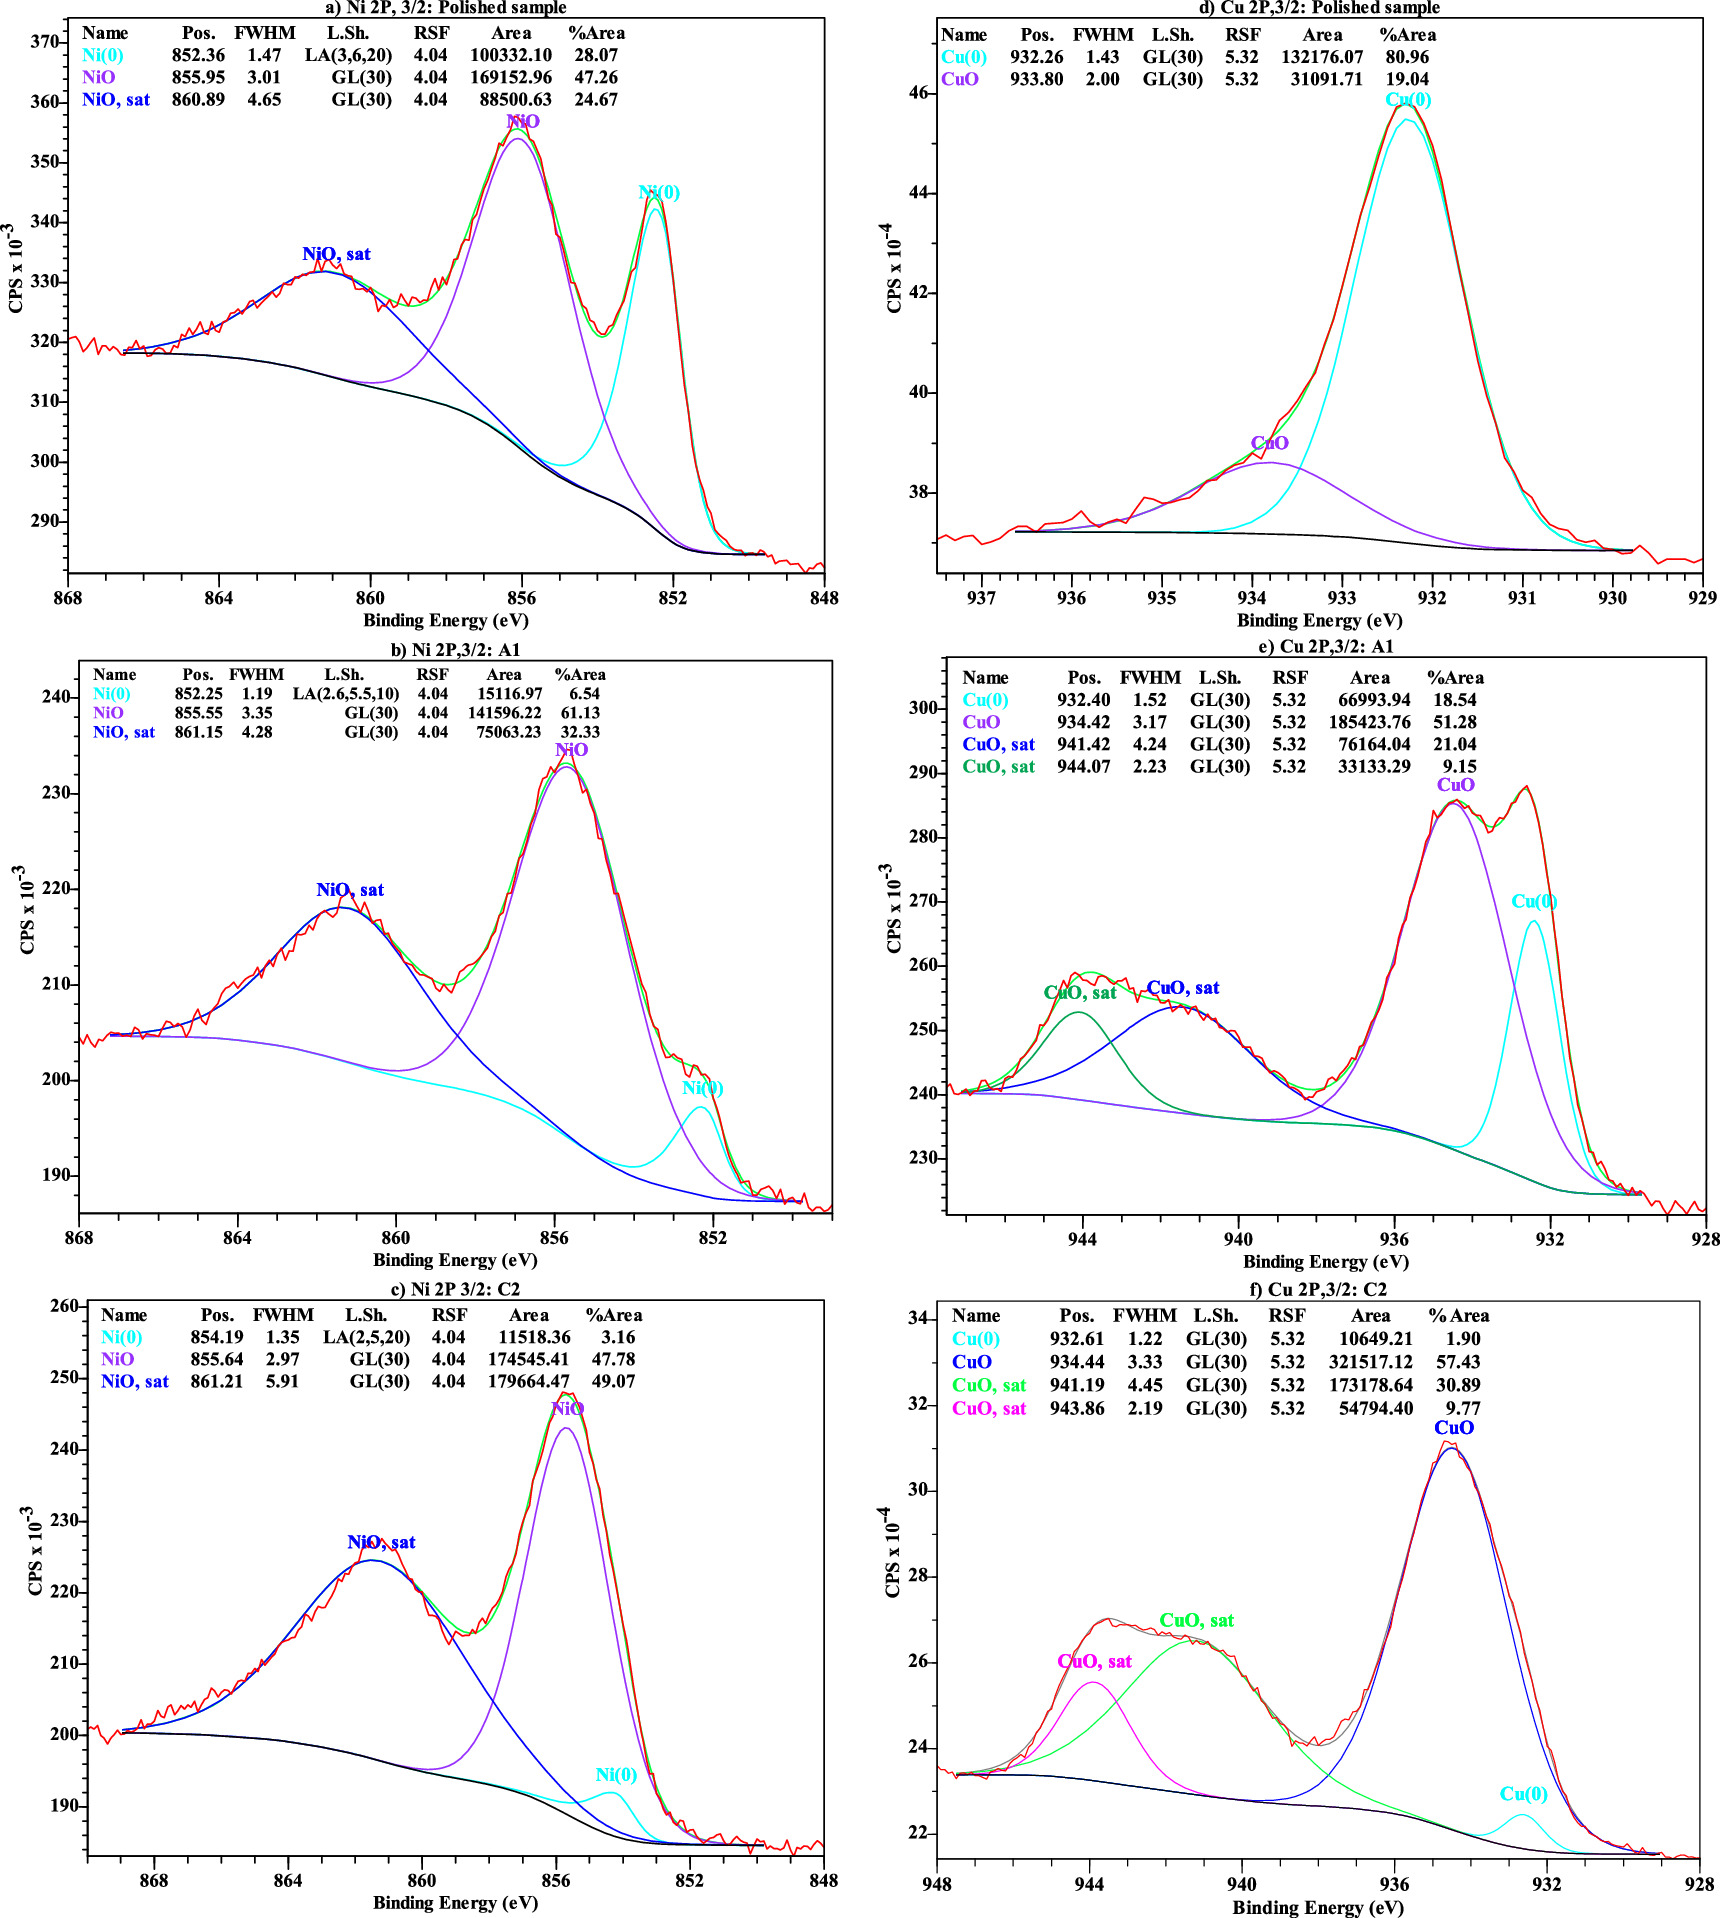
Figure 8. A high-resolution Ni 2p3/2 spectra of (a) polished sample, (b) region A1 and (c) region C2; A high-resolution Cu 2p3/2 spectra of (d) polished sample, (e) region A1 and (f) region C2.
Download figure:
Standard image High-resolution imageThrough comparison of the high-resolution spectra in figures 8(a)–(c), it can noted that the percentage content of the Ni(0) in the polished sample is higher than in laser-ablated regions. This is because laser ablation facilitates oxidation of the available elemental Ni at the surface of the sample to NiO and this reduces the amount of elemental Ni. Through comparison of the high-resolution spectra in figures 8(b) and (c), it can noted that the percentage content of the Ni(0) reduces as laser fluence increases. This shows that the higher the laser fluence, the higher the oxidation rate of the elemental Ni to NiO. Accordingly, in figures 8(a)–(c), the polished and laser-ablated Monel® alloy 400 has a lot of NiO and very little metallic Ni on its surface. This demonstrates that the passive film's surface outer layer is primarily made of NiO, whereas the inside layer is primarily made of Ni [55].
In the Cu 2p3/2 spectrum (figure 8(d)) for the polished sample, it was observed that the two Cu species existed on the surface. These peaks at 932.26 and 933.80 eV were assigned to elemental Cu, or Cu2O, and CuO, respectively [53]. After checking the kinetic energy of the Cu L3M45M45 auger peak (918.69 eV) as well as an inspection of the auger peak shape (figure 7(a)), it was deduced that the peak at 932.26 eV was for metallic Cu [56]. According to figure 8(d), the polished Monel® alloy 400 has a significant amount of Cu (80.96%) and a negligibly small amount of CuO (19.04%). This shows that the outer layer on the surface of the polished Monel® alloy 400 is a passive film, which is composed mainly of Cu metal and a small amount of CuO. In the Cu 2p3/2 spectrum (figure 8(e)) for region A1, the spectrum obtained is for CuO, based on its appearance and has been fitted with four Cu species [57]. By checking the kinetic energy of the Cu L3M45M45 auger peak (917.69 eV), it can also be deduced that the dominant peak at 934.42 eV was for CuO [57].
From the same figure 8(e), the peak at 932.40 eV has been assigned to Cu metal [58], while peaks at 941.42 and 944.07 eV were both assigned to CuO satellites from a shakeup process due to the open 3d9 shell of Cu(II) [57]. In figure 8(e), it can be noted that the surface of the A1 region of the Monel® alloy 400 is primarily composed of CuO (51.28%) and a small quantity of Cu metal (18.54%). In figure 8(f), the four Cu peaks at 932.61, 934.44, 941.19 and 943.86 eV were assigned to Cu metal, CuO, CuO satellite, and CuO satellite, respectively. In figure 8(f), the surface of the laser-ablated C2 region of the Monel® alloy 400 is primarily composed of CuO (57.43%) and just a trace quantity of Cu metal (1.90%).
The higher percentage of CuO in figures 8(e), (f) demonstrates that the outer layers on the laser-ablated surfaces are primarily composed of CuO, whereas the interior layers are composed primarily of Cu [55].
A fitted high-resolution C 1 s spectrum on region A1 of Monel® alloy 400 is shown in figure 9(a). As can be seen in figure 9(a), there were peaks at 284.82, 286.24, 287.98, and 288.92 eV. The peak at 284.82 eV indicates the presence of aliphatic carbons (C-H, C-C); the characteristic peak at 286.24 eV relates to the C-O (C-OH, C-O-C) bond of alcohols, hydroxyls, and ethers groups [32]; the peak at 287.98 eV shows the presence of the C=O bond of carbonyl and ketones groups; and the peak at 288.92 eV indicates the presence of the O-C=O bond of carboxyl groups [59]. As can be seen in figures S2(a) and (b) in Supplementary Information, some peaks are similar to the peaks shown in figure 9(a). These peaks have been given the same assignments as for region A1 of the Monel® alloy 400.

Figure 9. (a) A high-resolution C 1 s spectrum on region A1; (b) A high-resolution O 1 s spectrum on region A1.
Download figure:
Standard image High-resolution image
The spectrum of O 1 s obtained from the A1 region of the Monel® alloy 400 is shown in figure 9(b) and was fitted into three peaks. As shown in figure 9(b) for the A1 region on Monel® alloy 400, the peak at 529.51 eV indicates the presence of lattice oxide bonds (NiO [53] or CuO [57]). The peak at 531.44 eV is associated with the presence of organic oxygen bound to carbon [carboxyl group –COO– (532.1 ± 0.3 eV)] [60], hydroxyl groups, or defective oxides on the outer layer of the laser-ablated surfaces of Monel® alloy 400 [57]. The peak at 533.15 eV indicates the presence of the hydrogen bond due to water molecules adsorbed on the surface [53] or organic oxygen with the O–C=O bond [60]. In figures S2(c) and (d) on Supplementary Information, peaks similar to the ones in figure 9(b) can be noted, and thus they have been given the same assignments as for region A1 of the Monel® alloy 400.
In this section, it can be stated that the surfaces of both polished and laser-ablated Monel® alloy 400 have mainly Ni, Cu, O, and C elements. The XPS spectra demonstrated that the surface of the Monel® alloy 400 has a thin passive protective film, mostly made up of NiO and CuO films.
3.5. Nanoindentation measurements
Nanoindentation measurements were carried out on the polished and laser-processed surfaces. Nanoindentation is one of the most common and preferred methods for the evaluation of mechanical properties [34]. In the measurements, the loading time of a load of 1 mN was five seconds, the dwelling time was four seconds, and the unloading time was five seconds. The nanoindentation data obtained from the experiments is tabulated in table 6 when a peak indentation load of 1 mN was applied.
Table 6. Nanoindentation data obtained from the surfaces of Monel® alloy 400 samples.
| Data file | Mean contact depth, hc (nm) | Mean hardness, H (GPa) | Young's modulus, E (GPa) |
|---|---|---|---|
| Polished | 46.98 | 3.29 | 192.51 |
| A1 | 213.16 | 0.58 | 76.43 |
| A2 | 124.75 | 1.14 | 108.89 |
| A3 | 119.25 | 1.16 | 94.54 |
| A4 | 116.57 | 1.19 | 77.23 |
| B1 | 281.79 | 0.33 | 52.77 |
| B2 | 109.10 | 1.30 | 146.75 |
| B3 | 152.28 | 0.80 | 99.52 |
| B4 | 134.15 | 1.28 | 100.18 |
| C1 | 457.93 | 0.36 | 19.63 |
| C2 | 108.17 | 1.23 | 131.67 |
| C3 | 122.01 | 1.11 | 116.86 |
| C4 | 141.61 | 1.12 | 95.11 |
| D1 | 373.68 | 0.22 | 17.13 |
| D2 | 249.21 | 0.53 | 45.20 |
| D3 | 215.71 | 0.53 | 50.71 |
| D4 | 167.97 | 0.76 | 62.72 |
Considering table 6, it was noted that the means of the indentation depth (hc), hardness (H) and Young's modulus (E) values of the polished sample were 46.98 nm, 3.29 GPa, and 192.51 GPa, respectively. Theoretically, Monel® alloy 400 has a hardness and Young's modulus of approximately 335 HV (= ∼3.3 GPa) and 182 GPa, as given in table 2. This shows that the theoretical and experimental values of the hardness and Young's modulus are in agreement as per this nanoindentation test. When Monel® alloy 400 is laser-ablated, its surface is modified by the laser beam. The surface will undergo some morphological and microstructural changes, and its mechanical properties will be altered. After ps laser ablation, the results of nanoindentation tests, as observed in table 6, show that the hc at different regions has higher values than those of the polished sample, while the H and E values are less than those of the polished sample.
Considering the results in table 6, it is seen that the means of the hc, H, and E values of the laser-ablated regions are in the ranges of 108.17–457.93 nm, 0.22–1.30 GPa, and 17.13–146.75 GPa, respectively. At a peak load, the indentation depth is increased by more than two times in laser-ablated regions than in polished sample, which suggests that resistance to elastic-plastic deformation is reduced after ps-laser processing. The reason for the reduction in hc is the change in the physical microstructures of the Monel® alloy 400 due to ps-laser irradiation [13]. The larger hc in laser-ablated regions shows that plastic deformation is larger under the same load in comparison to a polished sample. The lower values of H and E obtained in ps laser-ablated regions can be attributed to microstructural changes on the surface of the Monel® alloy 400 after ps laser irradiation. After irradiation, the surface becomes softer and there is a small heat-affected zone (HAZ) [13], and consequently, the H and Er values reduce in comparison to those of a polished sample under the same load. Similar observations on the changes in hc, H, and E values after laser ablation of single-crystalline SiC were made by Chen et al [61].
It was noted from figure S3(a) on Supplementary Information that hc values at A1, B1, C1, and D1 regions, processed using the same scanning velocity, hatching distance, and scanning pass but different laser fluences, are highest in comparison to those of other regions. For H and E values shown in figures S3(b) and (c), respectively, the A1, B1, C1, and D1 regions have the smallest values in comparison to those of other regions. This indicates that as laser fluence increases, the hc increases while H and E reduce. This is because as laser fluence increases, the laser energy deposited per unit area increases, and hence, more microstructural changes on the surface of the Monel® alloy 400 will happen. It was also noted from figure S3 that a scanning velocity of 200 mm s−1, a hatching distance of 20 μm, and two scanning passes give the lowest values of hc and the highest values of H and E.
It is also worth mentioning that the values of the nanoindentation data obtained in ps laser-ablated regions can be attributed to other factors such as surface roughness, and surface topography, and indenter geometry [33]. It has been stated that surface roughness, particularly at low indentation depths, has a considerable impact on the nanoindentation outcomes [34]. The topography of the surface has a considerable impact on near-surface mechanical characteristics, and the values in comparison to real values can be exaggerated [35]. Hence, the nanoindentation results obtained from laser-ablated regions may differ from the real values because of the topography of the ps laser-ablated regions and their surface roughness.
4. Conclusion
Monel® alloy 400 surfaces were irradiated by scanning picosecond laser pulses to study the effects of the laser processing parameters on the ablation rate and efficiency, surface finish, the chemistry of the material, and nanomechanical properties. The regions were irradiated at the normal incidence in atmospheric environments using the Perla PS laser under different laser fluences, scanning velocities, hatching distances, and scanning passes. It was established that the ablation depth increases with an increase in laser fluence but reduces as the scanning velocity increases. This indicates that the processing parameters can be regulated to achieve a precise laser ablation depth. It was observed that ablation rates increase as laser fluence increases while decreasing as scanning velocity increases. In the case of ablation efficiency, the ablation efficiency decreases as laser fluence and scanning velocity increase. It can be concluded that it is advantageous to use low laser fluences and low scanning velocities during laser processing to get reasonable ablation rates and efficiency. This will have a significant effect on reducing surface roughness for a given ablation depth and potentially minimizing the heat-affected zone. The EDS data demonstrated that the elements on both polished and laser-ablated Monel® alloy 400 were mostly Ni and Cu, with small amounts of C, Fe, Mn, O, Si, and S elements. The EDX data analysis shows that the chemical composition of the polished sample and the laser-ablated sample had almost the same percentage of elements. XPS data showed that the surfaces of both polished and laser-ablated Monel® alloy 400 are composed mainly of Ni, Cu, O, and C elements. The high-resolution XPS spectra demonstrated that the surface of the Monel® alloy 400 has a thin passive protective film, mostly made up of NiO and CuO films. The indentation depths of laser-ablated regions are higher than those of polished sample, while hardness and Young's modulus values are lower than those of polished sample. The hardness and Young's modulus of the laser-ablated surfaces reduce as laser fluences increase, and nanoindentation results can be affected by surface roughness.
This research work established that the laser processing conditions for fabricating the desired surface structures and components are determined by regulating the fluence, scanning velocity, and hatching distance so that good ablation efficiency and a quality finish can be realized. It also provided the possibilities of using a ps laser for processing materials under laser and scanning parameters for different applications, such as in marine equipment for corrosion control. Further studies on the corrosion behaviour of the laser-structured Monel® alloy 400 will be undertaken.
Acknowledgments
We acknowledge CzechNanoLab Research Infrastructure supported by MEYS CR (LM2018110). The research was supported by the Czech Academy of Sciences (RVO: 68081731).
Data availability statement
The data cannot be made publicly available as it is part of on-going studies. Available upon reasonable request from the authors. The data that support the findings of this study are available upon reasonable request from the authors.
Supplementary data (0.4 MB DOCX)