

Abstract
Existing global mean surface temperature reconstructions for the Holocene lack high-frequency variability that is essential for contextualising recent trends and extremes in the Earth's climate system. Here, we isolate and recombine archive-specific climate signals to generate a frequency-optimised record of interannual to multi-millennial temperature changes for the past 12 000 years. Average temperatures before ∼8000 years BP and after ∼4000 years BP were 0.26 (±2.84) °C and 0.07 (±2.11) °C cooler than the long-term mean (0–12 000 years BP), while the Holocene Climate Optimum ∼7000–4000 years BP was 0.40 (±1.86) °C warmer. Biased towards Northern Hemisphere summer temperatures, our multi-proxy record captures the spectral properties of transient Earth system model simulations for the same spatial and season domain. The new frequency-optimised trajectory emphasises the importance and complex interplay of natural climate forcing factors throughout the Holocene, with an approximation of the full range of past temperature changes providing novel insights for policymakers addressing the risks of recent anthropogenic warming.
Export citation and abstract BibTeX RIS

Original content from this work may be used under the terms of the Creative Commons Attribution 4.0 license. Any further distribution of this work must maintain attribution to the author(s) and the title of the work, journal citation and DOI.
1. Introduction
The pace of recent anthropogenic climate change is regarded as 'unprecedented' in at least the past 2000 years [1], implying irreversible ecological and societal consequences [2–4]. A meaningful evaluation of ongoing changes in the Earth's climate system hinges on our understanding of past climate variations [5] and our capacity to disentangle the relative contributions of anthropogenic and natural climate forcing factors [6]. Both tasks are challenged by the limitations of instrumental observations, proxy reconstructions, and model simulations [7, 8]. Decreasing quality (e.g., dating precision, sample resolution and signal strength) and quantity (e.g., spatial and seasonal coverage) of proxy records back in time reduce the fidelity of climate reconstructions, compromising efforts to contextualise current climate dynamics [9].
To date, four multi-proxy reconstructions have attempted to describe the course of global mean surface temperatures during the Holocene [10–13], whose onset defines the beginning of the present interglacial period ∼11 700 years before 1950 CE [14]. Without seasonal adjustments, the existing records depict long-term warming out of the Late Glacial period until ∼7000 years BP, followed by moderate pre-industrial cooling [10–13]. While all reconstructions lack information about interannual to centennial scale temperature variability that is characteristic of the Earth's climate system [15, 16], they are widely used to frame the intensity and severity of anthropogenic climate change, thus influencing public and political discourse [1, 17]. However, incomplete frequency preservation back in time has problematic implications for contextualising recent annual and decadal extremes, as they reflect different aspects and amplitudes of the Earth's climate system to past longer-term means.
Here, we isolate and recombine archive-specific climate signals to generate a new multi-proxy record that approximates the interannual to multi-millennial behaviour of large-scale surface temperatures over the past 12 000 years. We then compare our findings with transient Earth system model simulations and discuss the relevance of our findings for policymakers.
2. Data and methods
Our frequency-optimised record utilises a subset of 814 temperature-sensitive proxy timeseries (figure S1; table S1; supplementary data 2) drawn from 1319 records in the Temperature 12k database [18]. Marine and terrestrial proxies from 679 sites were included to maximise the number of contributing archives. Preference was given to annual mean temperature estimates, and seasonal information was only included in absence of an annual mean from a given site, to remain comparable to previous studies. Proxy timeseries from lacustrine (n = 367), marine (n = 317), ice (n = 28), peat (n = 76), speleothem (n = 13), midden (n = 10), and wood (n = 3) sources were first differentiated and binned by averaging measurements within intervals corresponding to the associated archive's mean sampling resolution over the Holocene (table S1). This step moderates the impacts of dating uncertainty and places timeseries on a common timescale. In absence of a common reference period, we normalised each record against its own Holocene mean (Materials and Methods; figure S2). Statistical infilling procedures that would increase a record's length to facilitate a common reference period were deemed inappropriate as this step would likely introduce artificial signals that would distort the climate information we sought to identify and isolate. We demonstrate suitability of this normalisation approach by assessing the distribution of normalised temperature anomalies in each bin interval for each archive type (Materials and Methods; figure S2).
We employed a bootstrap procedure to generate archive-specific Holocene temperature histories from the seven different proxy archive types (figure S3). No spatial gridding was applied in this procedure as no archive type is globally distributed (figure S1(a)). We acknowledge this creates a spatial bias in our record towards the Northern Hemisphere from where most of the proxy archives derive [18]. We then used multi-taper spectral analysis to identify the predominant signals in each timeseries [19]. Consistent with the greatest number of significant periodicities at the 95% confidence interval, interannual signals (<10 years) are best captured by tree-ring chronologies (wood), multi-decadal variability (10–150 years) by speleothems, multi-centennial variations (150–1000 years) by ice and midden archives, multi-millennial changes (1000–6000 years) by peat and marine archives, and ultra-long trends (>6000 years) by lacustrine archives (figure S4).
Bandpass filtering was employed to isolate proxy-specific information from the respective temperature histories [20], with an exception for the tree-ring proxies. From 7450–0 BP, the linearly detrended wood temperature history is taken to reflect interannual variability due to the bandwidth limits of the dendrochronological records [21, 22]. To extend high-frequency signal of this record beyond 7450 years BP, we built a synthetic series reflecting the autoregressive properties of the tree-ring temperature history in the pre-industrial Common Era. Although different boundary conditions may have prevailed in the early Holocene influencing the high-frequency characteristics of climate fluctuations [23], model simulations used in this study suggest that high-frequency temperature variability during the early Holocene was comparable with the pre-industrial Common Era (Materials and Methods), justifing our approach to present, for the first time, temperature variability on interannual timescales over the past 12 000 years.
Our final record was produced by combining signals from different frequency domains that were isolated by bandpass filtering (figures 1 and 2). For variability on multi-centennial and multi-millennial timescales that are best represented by multiple archive types, we weighted the contribution of each band-passed signal by the number of contributing records. Confidence intervals are deliberately permissive to account for non-climate variability preserved in proxy archives, methodological uncertainties, and year-to-year uncertainty associated with annually resolved climate records [24], and thus are reported as the sum of 95% confidence intervals of the archive-specific temperature histories. For the tree-ring data for which we cannot calculate confidence intervals beyond 7450 years BP, we report two standard deviations from the mean of the simulated interannual variability (Materials and Methods), and as such uncertainty estimates of our final trajectory widen prior to 7450 years BP due to the experimental nature of the interannual signal in this period. See Materials and Methods for further information on the production of our frequency-optimised record.

Figure 1. Frequency-optimised record of interannual to multi-millennial temperature changes for the period 12 000–0 years BP reported as anomalies with respect to the Holocene mean (°C). The light green shading represents uncertainty based on the sum of 95% confidence intervals of the archive-specific temperature histories from which our record is derived, along with two standard deviations from the mean of the simulated interannual variability when confidence intervals were absent.
Download figure:
Standard image High-resolution image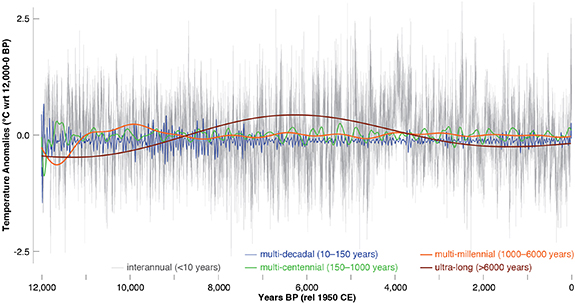
Figure 2. Experimentally derived proxy signals combined to produce our frequency-optimised Holocene temperature record given their demonstrated suitability in preserving variability in their five respective frequency bands. Signals were isolated by bandpass filtering, except for the interannual signal before 7450 years BP that is synthetically derived from the autoregressive properties of the wood temperature history in the pre-industrial Common Era. Units are reported as anomalies with respect to the Holocene (12 000–0 years BP) mean (°C).
Download figure:
Standard image High-resolution imageFor model comparison, we selected outputs from three state-of-the-art transient Earth system models: CCSM3-TraCE-21k [25], MPI-ESM1.2 slo0050 [26, 27], and IPSL-TR6AV-Sr02 [28, 29]. All simulations are driven by greenhouse gas concentrations and orbital forcing. The MPI-ESM1.2 simulation further accounts for volcanic, solar, and land-cover forcing, while the CCSM3-TraCE-21k simulation also includes ice sheet and meltwater forcing mechanisms. Proxy-model comparison focuses on Northern Hemisphere summer temperatures due to a bias in the underlying proxy timeseries towards warm-season sensitive proxies from Europe and North America (figure S1). However, we also compared our frequency-optimised record separately against simulated global annual and Northern Hemisphere annual temperatures (figures S6 and S7) to assess spectral properties across different seasonal and spatial domains (Materials and Methods). Comparisons were evaluated by computing Morlet wavelets [30] and performing multi-taper spectral analysis [19].
3. Results
Our frequency-optimised Holocene temperature history reveals a long-term trend of rising temperatures through the early and mid Holocene until ∼4000 years BP when cooling sets in until the recent anthropogenic warming (figure 1). The early Holocene is the coldest period of the record, with temperatures up to ∼8000 years BP averaging 0.26 (±2.84) °C cooler than the long-term mean (12 000–0 years BP). Gradual warming during this time led into a relatively warm Holocene Climate Optimum from ∼7000 to 4000 years BP (figure 1), with temperatures averaging 0.40 (±1.86) °C warmer than the Holocene mean. Late Holocene temperatures after ∼4000 years BP average 0.07 (±2.11) °C cooler than the long-term mean. This pre-industrial cooling trend culminates in the Little Ice Age in the early-19th century CE, after which recent warming commenced. Temperatures from 1850 to 1950 CE average 0.25 (±2.46) °C above the Holocene mean, and significantly differ from the magnitude of past natural variability (p < 0.05 in t-test).
We consider a complex interplay of diverse natural climate forcing factors responsible for the observed Holocene temperature changes (figure 2). Abrupt warming that brought an end to the Younger Dryas can be attributed to a combination of multi-decadal and multi-centennial forcing prior to ∼11 500 years BP (figure 2). Multi-millennial forcing until ∼10 000 years BP and ultra-long forcing until ∼7000 years BP can be regarded as the main cause for gradually increasing temperatures during the early Holocene. The Holocene Climate Optimum correlates with a maximum in ultra-long forcing factors, while late Holocene cooling relates to its subsequent decline. Multi-decadal and multi-centennial variability from ∼4000 years BP together explain short lived anomalies and warming since ∼1850 CE.
Prevalent in our record is interannual variability throughout the Holocene (figures 1 and 2). The coldest extremes of the record occur at the end of the Younger Dryas; all but six of the fifty coldest years in our record occur during the early Holocene. Additionally, the coldest 10 year, 25 year, 50 year and 100 year intervals centre around 11 795 years BP, 11 971 years BP, 11 974 years BP and 11 945 years BP, respectively, which roughly coincides with the termination of the last glacial period (figure 1). The frequency and intensity of cold extremes appears diminished since ∼1850 CE (figure 2). The warmest 10 year, 25 year, 50 year and 100 year intervals centre on 4896 years BP, 4895 years BP, 3939 years BP and 3914 years BP, respectively, all falling into the Holocene Climate Optimum.
The long-term trend of our frequency-optimised temperature history for the Holocene is not only comparable with those of existing multi-proxy reconstructions prior to any seasonal adjustments [10–13] (figures 3 and 4), but also with those simulated by transient Earth system models when using mean Northern Hemisphere summer temperatures (see section 4 for details).
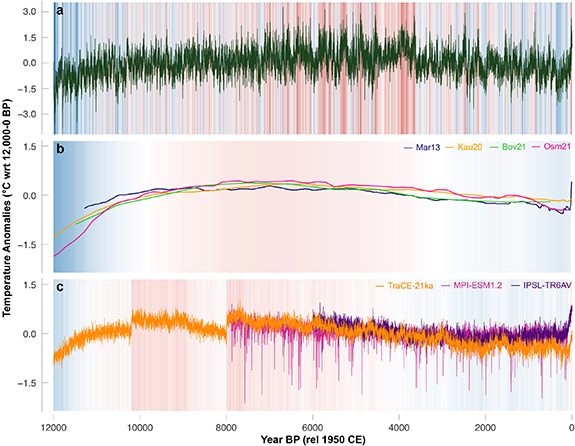
Figure 3. Proxy-model comparison. (a) Interannual to multi-millennial changes in surface temperature for the Holocene (12 000–0 years BP) produced using our frequency-optimised approach. (b) Multi-proxy reconstructions of presumed global mean surface temperature without seasonal adjustments (10–13). (c) Northern Hemisphere summer mean temperatures generated by three transient Earth system model simulations (24–28). Background temperature stripes reflect our frequency-optimised record (a), the mean of the four seasonally unadjusted multi-proxy timeseries (b), and the mean of the three Earth system model simulations (c). All units are reported as anomalies with respect to the Holocene mean (°C).
Download figure:
Standard image High-resolution image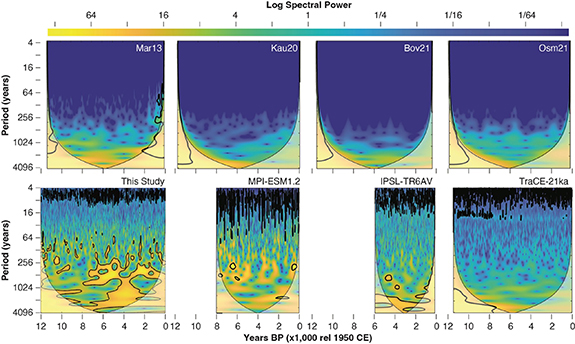
Figure 4. Spectral properties. Wavelet power spectra of four seasonally unadjusted multi-proxy reconstructions of global mean surface temperature for the Holocene (10–13) (upper row), of our frequency-optimised record (this study), and Northern Hemisphere summer mean temperatures simulated by three transient Earth system models (24–28) (lower row). Spectral signatures were calculated over the individual record lengths, contours enclose significant periodicities at the 95% confidence interval, shadings represent cones of influence, and units reflect log spectral power.
Download figure:
Standard image High-resolution image
4. Discussion
Our study reveals a complex interplay of different climate forcing factors and emphasises the importance of multi-proxy compilations in providing a more complete understanding of Holocene climate dynamics on interannual to multimillennial timescales. Relatively cool phases at the end of the Younger Dryas and ∼10 000 years BP were likely driven by the presence and later collapse of Northern Hemisphere ice masses [31]. The Holocene Climate Optimum and subsequent long-term cooling are best explained by summer insolation changes around 65° N [32, 33]. Pronounced decadal to multi-centennial variability since ∼4000 years BP likely reflects diminished ice sheet forcing together with prevalent volcanism [15, 34, 35].
In presenting a similar long-term trend to simulated Northern Hemisphere summer, as opposed to global annual mean temperatures (figures 3(c), 4 and S6), we regard our frequency-optimised record, as well as existing multi-proxy reconstructions prior to seasonal adjustment, to predominantly reflect a Northern Hemisphere summer signal. Although we use a global network of proxy records, 455 of the 814 of these are located between 40° and 70° N in a circumpolar belt across Eurasia and North America, and most of the biogeochemical archives are active in, or sensitive to warm season conditions [18]. This not only produces spatial and seasonal biases, but also explains why our frequency-optimised record mainly reflects Northern Hemisphere summer temperatures (figures 3(c) and 4). Such understanding feeds into the debate about a 'Holocene temperature conundrum', a discrepancy between proxy-based pre-industrial cooling after the Holocene Climate Optimum and transient model simulations that indicate a relatively warm late Holocene during which temperatures steadily increase [32, 33, 36]. This trend offset has been suggested to reflect several factors: spatial variation in the modes of temperature variability [26, 37], seasonal biases of biotic proxy archives [32], greater spatial co-variance in models compared to proxies [38], and uncertainties in model parametrisations [39–42]. Our results, however, suggest that the 'conundrum' simply from misinterpretation of the seasonal and spatial domains multi-proxy reconstructions predominantly reproduce. Hence, if the existing Holocene records would have been interpreted as a reflection of northern latitude warm season temperatures, model simulations used for comparison would have been selected to represent the same season and region, and the 'Holocene temperature conundrum' would not have emerged.
The high-frequency variability of our record contributes to a more complete picture of Holocene climatology than previous reconstructions achieved [10–13]. Our findings may therefore inform scientific debate about the relative contributions of natural and anthropogenic climate forcing factors as recent extremes can be placed in the context of the full range of past natural changes, rather than being compared to smoothed long-term means. Such discourse underpins the concept of a natural baseline temperature used to set warming thresholds for policy interventions [1]. Our frequency-optimised approach also stresses the sensitivity of the Earth's pre-industrial climate system to natural forcing factors that operate on interannual and decadal timescales. Since cold extremes are less prevalent after ∼1850 CE, we conclude that sustained anthropogenic greenhouse gas emissions will continue to mask the occurrence of interannual cooling events, thereby intensifying the frequency and magnitude of warm anomalies, superimposed on an 'unprecedented' recent warming trend [1]. This reinforces the need for interventions to limit further global warming if its associated risks are to be curtailed [2–4].
Furthermore, we remain critical of the interpretation of the smooth trajectories of existing Holocene temperature reconstructions [10–13], which have influenced policy debate. For instance, the Sixth Assessment Report of the Intergovernmental Panel on Climate Change (IPCC) [1], and its 'Summary for Policy Makers' and 'Technical Summary' compared recent annual extremes against past centennial averages [1]. Such unequal comparison has the potential to mislead portrayal of the threat of global warming as low- and high-frequency records reflect different aspects and amplitudes of the Earth's climate system (figure 2).
5. Conclusion
The importance of existing multi-proxy reconstructions in broadening our understanding of past climate dynamics is undeniable. We maintain, however, that the full range of naturally forced high- to low-frequency variability should be presented in temperature reconstructions used to contextualise recent, and in turn future, climate changes. In achieving this, attention must be paid to the spectral properties of individual climate archives when evaluating recent anthropogenic climate change in the context of the Holocene record.
Acknowledgments
U B and J E were supported by the Czech Science Foundation Grant HYDRO8 (23-08049S), and the ERC Advanced Grant MONOSTAR (AdG 882727). Much of the scientific discussion was stimulated by the Cooperation Group 'Volcanoes, Climate and History (VCH) at ZiF, Bielefeld, Germany (www.uni-bielefeld.de/(en)/ZiF/KG/2021Volcanoes/).
Data availability statements
All data used in this study are freely available or provided in the online supplementary material of this article.
Author contributions
U B conceived the study. H E, P J K and F M processed data and performed the analyses. S W, J J and P B provided Earth system model simulations. H E and U B wrote the paper with input from P J K, C O and J E. All authors contributed to discussion and revision.
Conflict of interest
The authors declare no competing interests.
Supplementary data 1 Data (2.4 MB XLSX)
Supplementary data 2 Proxy inventory (<0.1 MB XLSX)
Materials and Methods (12.5 MB PDF)