


Abstract
Using newly developed spectroscopic models to measure the divertor concentration of Ne and Ar, it is shown that the experimental detachment threshold on ASDEX Upgrade with Ar-only and mixtures of Ar+N or Ne+N scales as expected in comparison with an analytical equation derived by Kallenbach et al (2016 Plasma Phys. Control. Fusion58 045013). However, it is found that Ar radiates more efficiently and Ne less efficiently in the scrape-off layer than the model predicts. By separately increasing the neutral beam injection power and cutting the impurity gas flow, it is shown that the partially detached and strongly detached X-point radiator scenarios reattach in ≈100 ms and ≈250 ms, respectively. The former timescale is set by the core energy confinement time, whereas the latter has an additional delay caused by the time required for the ionisation front to move from the X-point to the target. A simple equation with scalable geometric terms to predict the ionisation front movement time in future machines is proposed.
Export citation and abstract BibTeX RIS

Original content from this work may be used under the terms of the Creative Commons Attribution 4.0 license. Any further distribution of this work must maintain attribution to the author(s) and the title of the work, journal citation and DOI.
1. Introduction
Gigawatt-scale fusion power plants will likely have to radiate most of the alpha heating power from the edge plasma on closed field lines and the remaining fraction in the scrape-off layer (SOL). A mixture of impurities with radiation efficiencies tailored to the distinct plasma regions in the tokamak will likely be injected to achieve this level of radiation [1–4]. It is known that, for reactor relevant conditions, N radiates mostly in the SOL in the divertor region, Ne and Ar radiate between the SOL and pedestal, and Kr and Xe radiate mostly in the outer layers of the plasma core [5]. Ar and Ne are more efficient SOL radiators than N [6] but in current tokamaks can only be puffed in lower amounts to avoid strong pedestal radiation resulting in degraded core confinement. In ITER and DEMO, a higher temperature gradient is expected in the pedestal, thus screening the core from impurities [7, 8] and making Ar and Ne potential leading choices as SOL radiators [1, 9, 10].
While there has been experimental assessment of the detachment threshold with N across data from JET and AUG [11], there has been no equivalent assessment with reactor relevant Ne and Ar impurities or investigation of the threshold scaling with impurity mixtures. Furthermore, there is also debate around the choice of Ne or Ar in a reactor. Experiments have previously compared detachment with both impurities, however the SOL radiation efficiency is typically masked by its impact on the pedestal radiation and is therefore not directly evident. There is also usually a strong focus on the core plasma properties in seeded impurity scenarios. For example, achieving detachment with Ne-only was only possible in JET ITER-like wall scenarios with high heating powers  29 MW; below this heating level the scenario oscillated between H-mode and L-mode [12]. Moreover, scenarios with Ne-only seeding on ASDEX Upgrade (AUG) were shown to be unstable before detachment could be observed due to an enhanced influx of W driven by changes in pedestal transport and ELM frequency [5]. On the other hand, results from EAST concluded that the compatibility of detachment and core confinement with Ne seeding is actually better than that with Ar seeding [13]. In this paper, focus is given primarily to the impurity radiation efficiency in the SOL, given that their impact on the core conditions varies in different machines. The results in this paper also demonstrate how the simple analytical formula for detachment scaling proposed by Kallenbach et al [6] can be extended for impurity mixtures through linear summation of their divertor concentrations.
Finally, this paper examines the divertor reattachment timescale following increases of the neutral beam injection (NBI) power and cuts to the impurity seeding gas flow. A reactor will almost certainly have a feedback control system monitoring the plasma state. Although the choice of sensors and actuators are still highly unclear in a reactor, it is likely that the heat loads and temperature at the divertor will be controlled by gas injection. However, the timescale on which a gas puff needs to actuate in a reactor is not clear and better understanding is needed from current experiments. Results in this paper demonstrate that scenarios with fully detached divertors and a region of intense radiation at the X-point, otherwise known as the X-point radiator (XPR) scenario [14], appear to provide a buffer of the power transient leading to significantly longer reattachment timescales compared to both the weakly detached divertor scenario and the core energy confinement time.
The paper is organised to firstly discuss the topic of detachment scaling and impurity radiation efficiency in section 2, then followed by a discussion of the transient reattachment timescales in section 3. Conclusions are given in section 4.
2. Detachment scaling with mixed impurities
The experiments described in this paper show that pronounced divertor detachment with Ar-only seeding can be obtained on AUG; although operation with Ar-only still often led to issues with scenario stability, similar to Ne-only seeding scenarios. Combining the Ar or Ne seeding with low levels of N seeding improved the scenario stability and facilitated detached scenarios with adequate core performance. The beneficial effect of combining Ar or Ne seeding with N
 seeding is also found on JET [15].
The experimental database of measurements used in this analysis were taken from ELMy H-mode plasma scenarios with a plasma current  MA. An example of key plasma traces are shown in figure 1. The auxiliary heating power comprised of electron and ion cyclotron heating (ECRH, ICRF) with each system delivering ≈2 MW, and the remaining power injected by 3–5 NBIs, each with ≈2.5 MW. The confinement relative to the ITER physics base
  scaling was between 0.8–1.2 (see figure 3(b) discussed in section 2.2) and the core Zeff was typically between 1.5–2.5. The plasma scenarios all had similar geometry with a vertical inner and outer divertor as shown in figure 2, an elongation and triangularity of κ ≈ 1.7 and δ ≈ 0.23, and a toroidal magnetic field and major radius of
  T and
T and  m, respectively.
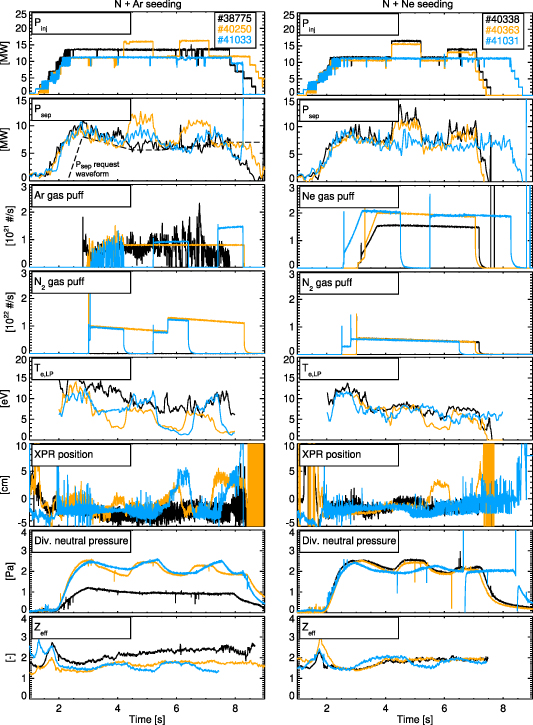
Figure 1. Examples of 1 MA ELMy H-mode plasma scenarios on AUG with mixed impurity seeding. From the top, the panels show the power injected and crossing the separatrix, the impurity seeding gas valve fluxes, the temperature at the target measured by probes, the position of the XPR above the X-point, the divertor neutral pressure measured by baratrons, and the Zeff. The left and right panels show scenarios with N and Ar and with N
 and Ne seeding, respectively.
Download figure:
Standard image High-resolution image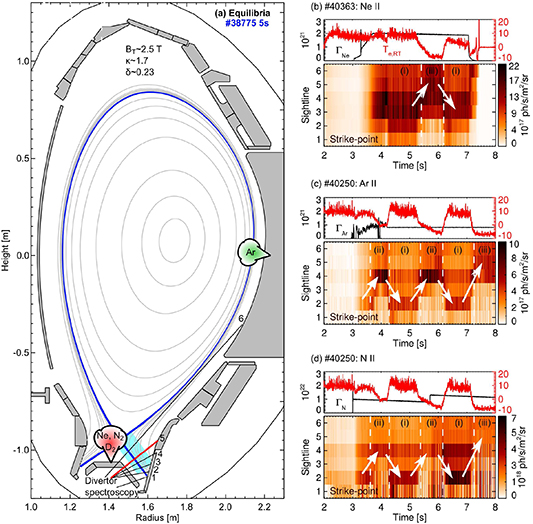
Figure 2. The magnetic equilibrium and the location of the gas valve injection location are shown in (a). The line intensities measured through the red LOS are used to calculate the impurity concentrations. The blue shaded region in the outer divertor corresponds to a poloidal area of 0.04 m−2 used to estimate the volume of neutrals in fully detached scenarios. (b)–(d) show the time traces of the real-time divertor temperature, impurity gas valve flux, and contours of the inter-ELM Ne II, Ar II, and N II line intensities measured through the line of sight (LOS) numbered in (a). The phases of attachment (i), pronounced detachment (ii), and X-point radiation (iii) are indicated by the dashed lines, with arrows illustrating the movement of peak intensity.
Download figure:
Standard image High-resolution image
Figure 3. Comparison of (a) probe target temperature measurements and (b) the  factor as a function of the real-time divertor temperature derived from the inter ELM shunt current measured on the outer divertor. The inter ELM shunt current exhibits an approximate scaling relationship with the probe temperature above ≈3 eV.
Download figure:
Standard image High-resolution imageThe reference plasma scenario, shown by the black traces for AUG #38775 in figure 1(left column), had constant heating and D fuelling, while Ar was injected using a feedback control system actuating on the power crossing the separatrix derived from heating power and radiation from bolometry in real-time. Without this feedback control, the scenario would typically become unstable due to a loss of ELM frequency resulting in a build up of density (AUG #37481 demonstrates this effect with feedforward Ar-only seeding). Note that the Ar seeding scenarios with NBI power increases and impurity gas cuts (i.e. the blue and orange curves in the left column of figure 1) use the real-time control to set the Ar puffing rate up until the first NBI increase or impurity gas cut, after which the Ar seeding rate is fixed or set manually. The N
 and Ne seeding gas was added with feedforward flow waveforms. In future, based on this experience, it would be worth testing Ne injection using the same control system as used for Ar injection. The gas valve injection locations for each species is indicated in figure 2(a).
To assess the detachment threshold, the reference scenario was repeated with different D fuelling rates ranging from
  elec s−1 providing a scan of the divertor neutral pressure from
  Pa, injected powers ranging from
  MW, and with powers crossing the separatrix ranging from
  MW remaining at least a factor of 2 above the LH power threshold scaling. Scenarios with NBI power increase or impurity gas cuts during the pulse were primarily used to assess the divertor reattachment timescale (as discussed in section 3) but were also programmed to remain stable for at least 1 s to provide data for the steady state database. The evolution of the singly ionised impurity line intensity (i.e. Ne II, Ar II, and N II) during a scenario with power increases is demonstrated in figures 2(b)–(d). The N II and Ar II line intensities are localised near the strike-point in attached phases and peak in line of sight (LOS) 4 (see LOS numbering in figure 2(a)) during the phases of XPR. Due to the N II and Ar II line intensities tending to peak at ≈5 eV they are a good indicators for the poloidal location of the deuterium ionisation front. The Ne II line intensity is peaked further away from the strike-point in LOS 3–4 during the attached phases, and then peaks in LOS 5–6 during the phases of XPR. As discussed in section 2.2, it is thought that the Ne II line intensity peaks further away from the target due to its larger first ionisation potential (FIP).
2.1. Detachment qualifier
While there have been a number of published scaling laws for the detachment threshold [16–20] and comparisons to high fidelity SOL models [21, 22], they typically depend on the electron separatrix density,  , which is hard to measure due to uncertainty in the separatrix position. This paper focuses on a parameter, called the detachment qualifier qdet, which indicates the likelihood of the outer divertor reaching partially detached conditions. Pronounced detachment is predicted at
  , while partial detachment occurs at
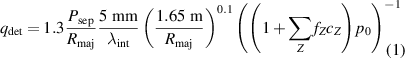
  . The equation for qdet was derived by comparing a 1D SOL model with an experimental scaling of the detachment threshold for N-seeded plasmas on AUG. For more details, refer to equation (9) in the study by Kallenbach et al [6]. The equation for qdet is as follows:
This equation replaces the dependency of  with the divertor neutral pressure,
  , which is directly measured on AUG. Psep is the difference between the absorbed heating power and the main chamber radiation.
  is the broadened SOL power width due to the effect of power spreading. Since equation (1) was derived based on measurements from 1 MA scenarios, the same as used in the scenarios presented here, it is assumed that 5 mm
 .
.  is the product of the radiation efficiency and impurity concentration, respectively. Note the inclusion of the summation over all impurities is introduced in this paper and is not part of the original model. It is noted that this simple detachment threshold formula assumes the effect of the divertor pressure and the impurities to be linear or independent. In reality, there may be second order cross terms, for example concerning the effect of charge exchange on the impurity radiation, and this is not addressed in this paper.
The radiation efficiency, fZ
, for the different impurities is a parameter representing the stronger radiation capability of the impurity in comparison to D. In principle, this parameter can be derived from atomic data. However, a non-coronal parameter  is usually needed to represent the enhancement to the radiation caused by impurity transport in the SOL. A smaller value of
  tends to enhance the ion abundance towards hotter temperatures, effectively increasing the impurity radiation efficiency. Since
  is difficult to predict, fZ
is effectively used as a fitting parameter between model and experiment. A value of
is difficult to predict, fZ
is effectively used as a fitting parameter between model and experiment. A value of  was gauged experimentally [23] and the 1D model reproduced this result using
  ms m−3 [6]. The same
  was then used for other impurities to show that partial detachment could be achieved with
  more C,
  less Ne, and
  less Ar, respectively, compared with N implying that
  ,
,  , and
, and  . If
. If  is different for each impurity or the fundamental atomic data is wrong, then these estimated radiation efficiency coefficients will also be wrong. The next subsections detail how fNe and fAr are gauged experimentally, with the results indicating values higher for Ar and lower for Ne.
2.2. Relevant measurements
The power crossing the separatrix is calculated using  , where Pin is the total input power (including Ohmic power),
  is the core radiation measured using bolometry [24], and W is the core plasma stored energy. The divertor pressure is measured by a baratron connected by a pipe below the high field side divertor (for a simplified CAD view see figure 3 of [25]).
The inter ELM measurements from the Langmuir probes operated as triple probes [26] were used to assess the detachment state, providing the target electron temperature,  , parallel heat flux,
  , and electron density,
  . Strike-point sweeps were not performed in this database, and therefore the target quantities were derived by averaging all available data points measuring within 4 cm of the strike-point (typically consisting of two probes).
The probe measurements are also used in the next section to determine the momentum loss factor,  , providing an additional assessment of the divertor conditions. The upstream separatrix electron temperature,
  , and density,
  , are estimated under the assumption of Spitzer–Härm electron conduction and with a scaling of the divertor neutral pressure [25].
The real-time outer divertor target temperature,  , is derived from the measurement of the inter ELM shunt current, Ishunt, obtained on the outer divertor tile [27]. When the inner divertor is fully detached and the outer divertor is hotter than ≈3 eV, Ishunt is dominated by the thermocurrent and exhibits an approximate scaling relationship with the outer divertor temperature, as
  [23, 26]. However, when the outer divertor becomes detached, this assumption no longer holds valid, and other residual currents that may flow in the opposite direction (or connect with a hot main chamber wall) become dominant in the shunt current measurement. While it is clear that negative values of
  are non-physical as a temperature, experimental observations demonstrate that
  becomes more negative as the degree of detachment increases or as the XPR position moves further above the X-point. Therefore, negative values of
  still serve as a valuable measurement for assessing the level of detachment or extent of an XPR. Figure 3(a) presents a comparison between
  and
and  from this study.
Confinement  scaling factors are shown in figure 3(b) as a function of
  . The analysed seeded scenarios typically show
  when
when  eV. As
  drops to negative values associated with pronounced detachment, the confinement tends to drop to
  which is consistent with recent results from JET [28]. A more significant drop to
  was found in an Ar seeded scenario with 16.5 MW of heating power and ≈2% Ar concentration (AUG #37493) which resulted in an XPR. The database also shows that the mixed Ar+N scenarios typically had higher
  compared to Ar-only scenarios.
Impurity concentrations, cZ
, are determined using divertor spectroscopy, using the line intensity measured through the red LOS indicated in figure 2(a) (i.e. LOS 5). The spectroscopic model for cN has already been developed [11, 29, 30] and the equivalent models for cNe and cAr are described in  where Γ is the valve flux in elec s−1) are shown in figure 4, though the latter is only valid after at least ≈0.5 s of constant seeding. However, to avoid this transient phase in the analysis, steady state averaging windows were chosen at least 0.5 s after the seeding begins. Generally, there is agreement within ≈20% between the two measurements during the steady state inter-ELM phases. The cNe inter-ELM measurement is considerably lower than the intra-ELM signal driven mainly by the increase in Ne II line intensity. For this to occur, there needs to be a significant population of neutrals in the vicinity of the sightline that are ionised during the ELM. Conversely, cAr
shows little difference between intra-ELM and inter-ELM measurements. Previous AUG measurements showed a stronger difference between the inter-ELM and intra-ELM measurements for cN measured through a sightline viewing closer to the target (e.g. figure 4 of [29]). This result is consistent with Ne neutrals having a longer ionisation mean free path in comparison to N or Ar due to the FIP effect. The neutral atom ground state ionisation energies taken from NIST [31] are ≈15 eV for N and Ar and ≈22 eV for Ne. Collisional-radiative effects may alter the effective ionisation rate for each impurity, however high quality data to assess this does not yet exist for Ar (although work towards this is underway [32]).
where Γ is the valve flux in elec s−1) are shown in figure 4, though the latter is only valid after at least ≈0.5 s of constant seeding. However, to avoid this transient phase in the analysis, steady state averaging windows were chosen at least 0.5 s after the seeding begins. Generally, there is agreement within ≈20% between the two measurements during the steady state inter-ELM phases. The cNe inter-ELM measurement is considerably lower than the intra-ELM signal driven mainly by the increase in Ne II line intensity. For this to occur, there needs to be a significant population of neutrals in the vicinity of the sightline that are ionised during the ELM. Conversely, cAr
shows little difference between intra-ELM and inter-ELM measurements. Previous AUG measurements showed a stronger difference between the inter-ELM and intra-ELM measurements for cN measured through a sightline viewing closer to the target (e.g. figure 4 of [29]). This result is consistent with Ne neutrals having a longer ionisation mean free path in comparison to N or Ar due to the FIP effect. The neutral atom ground state ionisation energies taken from NIST [31] are ≈15 eV for N and Ar and ≈22 eV for Ne. Collisional-radiative effects may alter the effective ionisation rate for each impurity, however high quality data to assess this does not yet exist for Ar (although work towards this is underway [32]).
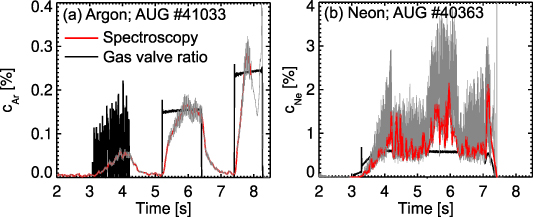
Figure 4. Impurity concentrations measured using spectroscopy are shown in grey, with the red lines showing the inter ELM values. The black lines show the equivalent estimation of the impurity concentration using the ratio of gas valve fluxes.
Download figure:
Standard image High-resolution imageFinally, it is noted that cNe increases by a factor 2 compared to the estimated value from the gas valve flux ratio in phases of deep detachment which is due to the assumption of constant electron temperature in the model becoming less accurate (see
2.3. Spectroscopy results
The experimental qdet is inferred from measurements described in the previous section averaged over 300 ms in steady state phases of each pulse. The results are shown as a function of  and
and  in figures 5(a) and (b), respectively. Although there is no prior evidence to suggest that these quantities should vary linearly with qdet, a best-fit dashed line with linear dependence is shown for reference and shows reasonable agreement to the data, more so for
  . Figures 5(e) and (f) show a roll-over in
  and sudden drop in fmom once the divertor temperature falls below ≈6 eV.

Figure 5. The detachment qualifier for different impurity mixtures (including non-seeding phases for comparison) are plotted against the inter-ELM probe measurements at the target of (a) parallel heat flux and (b) electron temperature. (c) and (d) show the values when using the updated the radiation efficiencies for Ne and Ar. A best-fit line with linear dependence and statistical R2 values are shown for comparison in each case. To assess the detachment state, the target electron density and moment loss factor are plotted against target temperature in (e) and (f), respectively.
Download figure:
Standard image High-resolution imageThe experimental data in figures 5(a) and (b) show that the estimated values of  and
and  tend to marginally under-predict the cNe and over-predict the cAr required to reach partial detachment compared to a best-fit line with linear dependence combining data from all impurity mixtures. The data is now used to find values of fNe and fAr that provide better consistency between the different impurity mixtures. This is done by finding values of fNe and fAr which satisfy a criteria gauged on the N-only data:


Values of fNe and fAr satisfying the criteria were  and
and  . The results using the average value of the acceptable ranges are shown in figures 5(c) and (d). These values improve the goodness of fit R2 between the data and the best-fit line, and moves the best-fit prediction closer to unity at
  eV. Notably, this also opens the possibility of using qdet more generally to predict the target temperature and heat loads. However, such a model would have some uncertainty due to the probe measurements below 2–3 eV being typically unreliable.
The most probable solution to achieve the detachment point at  in Ne-seeded cases mixed with N is by lowering the Ne radiation efficiency. However, there is an alternative solution involving lower radiation efficiency for N instead of Ne. On the other hand, this alternative solution would contradict the observed N radiation efficiency in both the N-only seeding database presented in this paper and the previous study by Kallenbach et al [1]. Therefore, this alternative solution is not considered likely. Furthermore, the model in equation (1) assumes a constant impurity concentration in the SOL and therefore, since the upstream SOL impurity concentration is not available, it is assumed that the divertor impurity concentration is equal to the average SOL concentration. This assumption could impact the analysis of the radiation efficiency, but it is not expected to change the overall conclusion.
2.4. Bolometry results
Another approach to measuring the radiation efficiency is to assess the total radiation in the SOL (including divertor, XPR, and main chamber SOL) measured using bolometry. For clarity, the measured  is defined as
  , using the same nomenclature as shown in figure 5 of [24]. A simple model is proposed to assess the SOL radiation:
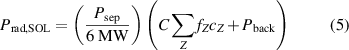
where C is a free parameter with units in MW and Pback is the background radiation estimated using the radiation measured before seeding occurs. The normalised Psep is included to account for the relatively linear dependence with  . The spectroscopic cZ
measurements described previously are again used in this model.
. The spectroscopic cZ
measurements described previously are again used in this model.
The model first assumes a set of fZ
and then tunes C to achieve the best fit to the data from one shot. This value of C is then used consistently among other shots. In this example, the model is tuned on AUG #39520 which has Ar+N seeding and then compared to an Ar-only (AUG #39519) and Ne+N (AUG #41033) scenario. To simplify the analysis, these discharges were chosen due to their similar Psep. The results from the model are shown in figure 6. The red and green lines show the results using  and
and  , respectively. The red curves give worse agreement overall, and values of fZ
similar to those found in the analysis of qdet agree better with the bolometer data proving that the new parameters for fZ
provide better consistency overall with experimental data than previous estimates.
, respectively. The red curves give worse agreement overall, and values of fZ
similar to those found in the analysis of qdet agree better with the bolometer data proving that the new parameters for fZ
provide better consistency overall with experimental data than previous estimates.
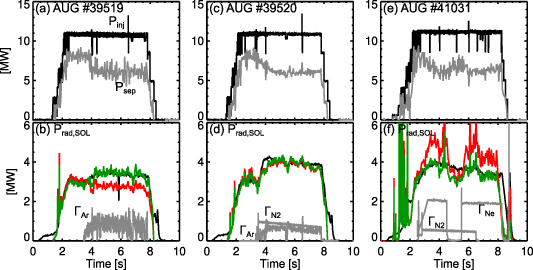
Figure 6. The injected power and separatrix powers are shown for three shots in the top panels. The total power radiated in the SOL is shown by the black lines in the bottom panels. Modelled values are shown by the red lines, using  , and the green lines, using
  . For reference, the impurity gas valve fluxes are shown by the grey lines.
Download figure:
Standard image High-resolution image3. Reattachment timescales
Scenarios with increases to the NBI power and cuts to the impurity gas were run to test the transient reattachment timescales. An example of both scenarios is shown in figure 1 by the blue and orange traces. Note that the scenarios with NBI power increases use real-time control to set the Ar puffing rate up until the first NBI increase, after which the Ar seeding rate is fixed. The Ne and N seeding waveforms are input manually.
3.1. NBI power increase
The NBI power was increased during phases with partial divertor detachment and full divertor detachment (XPR). Figures 7(a)–(d) shows the resulting power crossing the separatrix, real-time divertor temperature, probe divertor temperature, and XPR position for the cases with ≈2.5 MW increase (orange and green lines) and ≈5 MW increase (black and blue lines) in power. The position of the localised intense radiation front above the X-point is measured by AXUV diodes [14] and is shown in figure 7(d) to indicate the evolution of the radiation front following the power transient. In the analysis below, the XPR position is used as a proxy for the ionisation front. The partially detached divertor cases where an XPR is not present (black and green lines) show an immediate rise in temperature and take ≈100 ms to reach peak temperature. For comparison, the core confinement time in these plasmas is ≈60 ms. The fully detached divertor cases with XPR (blue and orange lines) show an immediate change in the XPR position, taking ≈100 ms before the XPR reaches a location where the radiation peak is in the inner divertor and not representing an XPR anymore. This is consistent with the temperature only showing a rise ≈100 ms after the power increase. Overall, the fully detached scenario takes ≈250 ms to reach peak temperature—significantly longer than the partially detached scenario. Since the power is kept at a higher level for a timescale longer than that required for reattachment, the peak divertor temperature reaches the steady state value expected for the associated value of qdet.

Figure 7. Transient response times of divertor measurements shown as a function of the time normalised to (a)–(d) the NBI increase and (e)–(h) the impurity gas cuts. An Ar+N mixture was used in AUG #40250, #40251 and #41033, and an Ne+N mixture was used AUG #40363.
Download figure:
Standard image High-resolution imageThere are published models describing the threshold and stability of the XPR [33, 34] but these do not directly predict the location of the XPR inside the confined region. To complement these studies, a simple scalable model is proposed to predict the time required to move the ionisation front from the X-point back to the target following a change in power entering the SOL. While the XPR position represents the extent of the radiation front within the confined plasma, rather than the location of the ionisation front between the X-point and target in the SOL, the movements of both are closely coupled. Furthermore, as shown in figure 7, the target temperature generally increases once the XPR position measurement reaches the noise level. Therefore, the XPR position serves as a useful proxy for the ionisation front position. To match the functional form of the measured XPR position decay after the power increase, an exponential form is selected for the model. The model assumes that the timescale is driven by the evolution of the power over time, which spans tens or hundreds of milliseconds, coupled with the timescales of ionisation and recombination particle reservoirs, which are several milliseconds. The chosen form of the model is as follows:
V is the volume of neutrals extending from the target to the X-point,  eV is the effective ionisation energy loss for deuterium including radiative losses [35] (assuming burn-through of impurities is not significant),
  is the average neutral atom density, τresid is the residence time of an ion, and τionis is the ionisation timescale. A crude approximation is made to estimate the volume of neutrals as
  m−3, where
  m−2 is the estimated poloidal area of the neutrals (see blue shaded region in figure 2) and R is the average radius of the neutral volume.
  m−3 assuming a molecular flux at T = 300 K at the baratron located underneath the high field side divertor. The inclusion of
  means that the temporal evolution of the power rise (i.e. mainly driven by the core energy confinement time) is accounted for. A lower limit for τresid is calculated assuming the ion velocity to be the ionic sound speed giving:
 m is the approximate connection length between the X-point and the target, and
  m3 s−1 is the hydrogenic ionisation rate coefficient at
  eV. Stark broadening measurements show that
  m−3 which gives
  . This ratio
  is also used by Janev and Reiter [36] to define the number of recombination cycles that a hydrogenic plasma ion can make during its residence time in the divertor.
The red dashed line in figure 7(d) represents the predicted decay of  due to the power increase in #40250, indicated by the blue lines. Surprisingly, considering the simplicity of the model, there is remarkably good agreement with the measured decay of
  . To provide a clearer understanding of the uncertainty, the parameters in equations (6) and (7) with the highest degree of error are divided into two groups:
  and
and  . It is assumed that the remaining parameters are reasonably well constrained by measurements. Seff effectively acts as a fitting parameter, providing that Te falls within the likely range of 2–3 eV, given the significant variation of SCD with Te. By varying N by a factor ×5 and
  , respectively, the same predicted decay of
  as shown in figure 7(d) can be achieved within the limits of Te between 2 eV and 3 eV. Although a previous study [37] suggests approximate agreement between the fluxes measured in the outer divertor and sub-divertor under detached conditions, providing some confidence in the prediction of
  , it is important to consider the crude estimation of V and the remaining uncertainties in the other parameters. In light of these uncertainties, it is expected that the specified range of N reasonably encompasses the overall uncertainty.
Despite the uncertainties described above, the advantage of this model is that it provides a simple method for scaling the reattachment time in a reactor. If  is used as an arbitrary threshold for the ionisation front having reached the target, then the time taken is
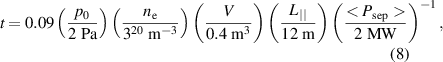
where  is the average rise in power. An interesting application of the model can be made to the JET pulse #89244 documented by Field et al [38]. This had similar injected power of 8 MW and an XPR induced by N
 -seeding. The heating was increased to 15 MW over ≈2 s resulting in a ≈5 MW rise in Psep. Using a simple upscaling of the above parameters to JET, namely
  m ≈ 7,
  m ≈ 1.75, and
  MW, equation (8) predicts that the ionisation front moves back to the target within ≈1 s. While there is no measurement of the XPR position, there is a significant increase in the target Langmuir probe saturation current and N II emissivity near the target ≈1 s after the power increase (see figure 24 in [38]) consistent with the model prediction.
3.2. Impurity gas cuts
Reattachment could also be achieved by a cut of the impurity seeding instead of an increase in power. This was done by replacing the increases in NBI power in the scenario with cuts in the impurity gas to test the reattachment timescales. As shown in figure 7(e), cutting both impurity (Ar+N) gas flows causes Psep to rise by ≈3 MW and the resulting evolution of the divertor temperature and XPR position are shown in figures 7(f)–(h). The divertor reaches its peak temperature at ≈200 ms after the gas cut. In figure 7(h), the red dashed line depicts the corresponding XPRpos using the Psep displayed in figure 7(e). The model successfully captures the temporal behaviour starting from 100 ms after the gas cut, but it does not account for the immediate movement of the XPR, which occurs around ≈30 ms after the gas cut. This is because there are two additional time scales to consider in this scenario: the delay between the gas valve switching off and the impurity concentration beginning to drop, and the residence time of each impurity. The former timescale is ≈30 ms indicated by the vertical dashed line in figures 7(e)–(h).
The impurity residence times for each impurity in figure 8 show that N decays fastest of the three impurities with an exponential decay rate of ≈40 ms, followed by Ar at ≈100 ms, and finally by Ne at ≈200 ms. The wall storage is likely the dominant factor influencing the decay rate of N in these plasmas, while the entrainment in the D2 flow to the pump is believed to be the primary mechanism responsible for the decay rate of Ne and Ar. A lower impurity enrichment would result in reduced entrainment, indicating that Ar has a higher enrichment compared to Ne. This observation is consistent with the findings discussed in the previous Sections, which showed that the Ne II line intensities peak further from the target compared to N II and Ar II.
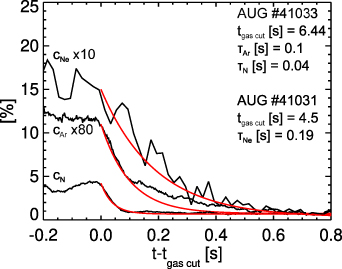
Figure 8. Measured divertor impurity residence times.
Download figure:
Standard image High-resolution imageWhile the XPR position is sensitive to the power crossing the separatrix, it is also affected by the power radiated in the SOL. Ar primarily influences Psep, while N mainly impacts  . Despite both gases being cut off simultaneously, N decays at a faster rate, resulting in a change in
  within ≈40 ms, whereas the change in Psep becomes noticeable after ≈100 ms according to the decay rate of Ar. The current formulation of equation (6) does not account for variations in
  . Quantifying the drop in
  is challenging because, overall, the divertor radiation marginally increases due to the rise in Psep. In summary, despite the absence of physics concerning the impurity pumping timescales, the current model still predicts the timescales for reattachment caused by changes in the power crossing the separatrix and may be applicable to larger devices as well.
4. Conclusions
This paper presents measurements indicating that the detachment threshold predictions are recovered in experiments when using reactor relevant Ne and Ar impurities. The measurements consistently show that Ar is more efficient and Ne less efficient at radiating in the SOL than the model predicts. The results indicate that, for analytical derivations of the parameters, different values of the non-coronal parameter  for each impurity or improved atomic data may be needed to reproduce the measurements. Also the charge exchange reactions with neutrals and the FIP may have an influence on the radiation efficiency.
A higher than expected radiation efficiency results in a lower impurity concentration to reach partial detachment, which is desirable to minimise the dilution of the core fuel ions. Therefore, these results would favour Ar over Ne as a potential SOL radiator in future machines. Focus should be given to expanding the database for Ne seeding on AUG using low level N puffs to keep the scenario stable. Data from other tokamaks should also be compared where possible, although this analysis relies on measurements of the divertor pressure and impurity spectroscopy.
Finally, the strongly detached XPR scenario leads to a significant time delay before the divertor reattaches following a power increase, in comparison to a partially detached divertor which reattaches on a timescale equivalent to the core energy confinement. Operating with fully detached divertors in future fusion reactors may therefore lower the risk of a transient power increase reattaching the divertor before the control system can react. A simple model predicting the time for the ionisation front to move back to the target is shown to produce adequate agreement to measurements on AUG and published data from JET.
Acknowledgments
This work has been carried out within the framework of the EUROfusion Consortium, funded by the European Union via the Euratom Research and Training Programme (Grant Agreement No. 101052200 - EUROfusion) and from the EPSRC (Grant Number EP/W006839/1). The Swiss contribution to this work has been funded by the Swiss State Secretariat for Education, Research and Innovation (SERI). To obtain further information on the data and models underlying this paper please contact PublicationsManager@ukaea.uk. Views and opinions expressed are however those of the author(s) only and do not necessarily reflect those of the European Union, the European Commission, or SERI. Neither the European Union nor the European commission nor SERI can be held responsible for them.
Appendix: Ne and Ar concentrations
The singly ionised impurity ion typically emits in a narrow region near the outer divertor separatrix in H-mode plasmas with vertical divertor geometry [29]. In typical ASDEX Upgrade divertor geometries, this plasma region is directly influenced by the target recycling flux and provides a good proxy of the target plasma conditions. Line radiance measurements from Ne II and Ar II are therefore used to calculate the line-averaged divertor impurity concentration, cZ , using
where I is the radiance in ph/s/m2/steradian,  is the total emission coefficient,
  are excitation and recombination photon emissivity coefficients in m3 s−1, fZ
is the fractional ion abundance of the ion,
are excitation and recombination photon emissivity coefficients in m3 s−1, fZ
is the fractional ion abundance of the ion,  is the length of the emission region through the LOS, and ne is the average electron density associated with
  .
.  is set at ≈5.5 cm and ≈7 cm for Ar II and Ne II, respectively. This value is not well known, although a coarse inversion of the N II intensity measured by divertor spectroscopy suggested a value of ≈4 cm. The lengths for Ar II and Ne II are scaled to this value by using the TECs shown in figure 9(d), integrated as a function of temperature, normalised to the equivalent N II TEC integral.
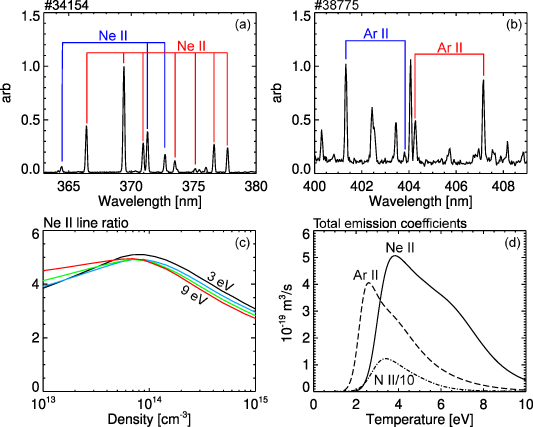
Figure 9. Experimental spectrum of identifying key (a) Ne II and (b) Ar II line intensities measured on ASDEX Upgrade. The modelled (c) Ne II line ratio and (d) total emission coefficients corresponding to the Ne II multiplet line (4P P), Ar II singlet line at 401.3 nm, and N II singlet line (scaled by a factor ×0.1) at 399.5 nm, all calculated at
  m−3.
m−3.
Download figure:
Standard image High-resolution image
For Ne II, the collisional excitation data and A-values used to calculate the excitation rate coefficients in LS resolution are taken from [39]. New level resolved excitation rate coefficients are used for Ar [32]. In ADAS notation, the year 96 and 89 data are used to calculate the ionisation balance for Ne and Ar, respectively.
Spectra from AUG show that there exist two intense Ne II multiplet lines in the wavelength range λ = 360–385 nm as shown in figure 9(a). In the same spectral region used to measure the N II lines (λ ≈ 404 nm) there also exist two strong Ar II lines as shown in figure 9(b). Although these lines belong to two separate multiplets, there is no need to measure the remaining multiplet lines as the Ar II atomic data is level resolved. The TEC coefficients for Ne II and Ar II are shown in figure 9(c). Since the Ar II TEC is peaked at similar densities to deuterium atoms, it is reasonable to assume that the electron density measured by Stark broadening is representative of the density where the Ar II is emitting. However, for Ne II the ratios of the two multiplet lines are used to infer the electron density. This model assumes a fixed temperature of 2.6 eV and 3.7 eV, corresponding to the temperature associated with the peak TEC coefficient to infer the density for Ar II and Ne II, respectively. When the temperature is significantly lower than the model expectation (i.e. in deep detachment) then the model will under-estimate the electron density for Ne II leading to unphysically high concentrations (i.e.  ). This increase is not evident for cAr because that model uses the electron density measured with Stark broadening.