


Abstract
The presented work shows a systematic study of the temporal characteristics of ELM events on the COMPASS divertor obtained with high temporal resolution probe measurements (∼1 μs). The resulting temporal evolution of the total ELM power on the outer target provides the values of rise (τrise) and decay (τdecay) times for each single ELM event. It has been found that τrise values are in the range of about 50 μs–100 μs. These values are comparable to the time of the ELM parallel propagation (τ||) given by the sound speed and the connection length between the outer midplane and the outboard divertor. This comparison indicates that the magnetic field lines in the SOL region are not significantly ergodized during the pedestal crash on COMPASS. It also implies that the peak ELM energy fluence on the outboard divertor is dominated by the ELM parallel transport, which is confirmed by a good agreement with model prediction. In addition, the values of the ratio of τdecay and τrise for each ELM event fit very well to the boundaries 1.5 < τdecay/τrise < 4, as already shown on JET as well as on the HL-2A tokamak, using IR measurements. The ratio does not show any clear dependence on the relative ELM energy or line averaged electron density. It was also found that the ELM energy fluence decay length (λ mid) is clearly linked to this ratio.
Export citation and abstract BibTeX RIS

Original content from this work may be used under the terms of the Creative Commons Attribution 4.0 license. Any further distribution of this work must maintain attribution to the author(s) and the title of the work, journal citation and DOI.
1. Introduction and motivation
The divertor heat loads during ELMy H-mode scenarios have been studied at different tokamaks [1–4] and also predicted by different models [2]. All these studies are essential for the lifetime or damage prediction of the plasma facing components for ITER [5, 6] and other large fusion reactors including liquid metal divertor concept [7–9]. However, further study of individual edge localised mode (ELM) temporal characteristics is important because the total power delivered by each ELM must be absorbed by the material of the plasma facing components during the ELM duration (τELM). This time is of critical importance since the maximum surface target temperature rise caused by an ELM (which should not exceed the melting point of the divertor plasma-facing components) is approximately proportional to 1/ [10–13]. In previous works [4, 14], the ELM temporal evolution is typically described by two characteristic times, rise (τrise) and decay (τdecay) times. The value of τrise is defined as the time duration for the divertor heat load to increase from 10% to 100% of its maximum and the τdecay represents the characteristic exponential decay time after its maximum as shown by figure 2 in section 3. The recent work from HL-2A tokamak [15] shows that the values of τrise is nearly equal to the time of ELM parallel propagation (τ||) defined as τ|| = L||/cs, where cs and L|| represent the sound speed and the connection length between the upstream and corresponding divertor location, respectively. In [15] the connection length was obtained using a simple formula L|| = 2πq95
Rsep (with Rsep as outer midplane separatrix position and q95 as a safety factor at the 95% poloidal flux surface), corresponding to its inter-ELM value. Previous studies on JET, AUG, JT-60U, MAST tokamaks (figure 4 in [14], figure 4 in [4], figure 12 in [16]) show that the values of τrise are mostly above the ones of τ||, but still well correlated with τ||.
[10–13]. In previous works [4, 14], the ELM temporal evolution is typically described by two characteristic times, rise (τrise) and decay (τdecay) times. The value of τrise is defined as the time duration for the divertor heat load to increase from 10% to 100% of its maximum and the τdecay represents the characteristic exponential decay time after its maximum as shown by figure 2 in section 3. The recent work from HL-2A tokamak [15] shows that the values of τrise is nearly equal to the time of ELM parallel propagation (τ||) defined as τ|| = L||/cs, where cs and L|| represent the sound speed and the connection length between the upstream and corresponding divertor location, respectively. In [15] the connection length was obtained using a simple formula L|| = 2πq95
Rsep (with Rsep as outer midplane separatrix position and q95 as a safety factor at the 95% poloidal flux surface), corresponding to its inter-ELM value. Previous studies on JET, AUG, JT-60U, MAST tokamaks (figure 4 in [14], figure 4 in [4], figure 12 in [16]) show that the values of τrise are mostly above the ones of τ||, but still well correlated with τ||.
However, the MHD modelling of the ELM crash indicates formation of the ergodic magnetic fields and islands leading to a strong enhancement of the parallel connection length inside the (pre-ELM) separatrix up to tens of kms in case of ITER [17, 18]. Other simulation within the SOL region demonstrate that the connection length is actually not enhanced significantly and τ|| seems to be still correlated with the unperturbed connections length (L||); e.g. in [19] effective connection length was found ∼5 × L||. All the above-mentioned experimental results are based on the conditionally averaged ELM analysis using infrared (IR) measurements with relatively low temporal resolution in order of few kHz. The conditionally averaged ELM technique is also affected by irregular ELM filamentary structures [20, 21] and thus can provide only averaged values of the ELM temporal characteristics.
However, on the COMPASS tokamak divertor, the fast probe diagnostic system [3] was used to study these ELM temporal characteristics with high temporal resolution (∼1 μs). It allows us to provide ELM temporal characteristics based on a single ELM analysis without conditionally averaging. Such a high resolution is also necessary assuming small τrise values due to a short connection length (L|| ∼ 5 m on the low field side (LFS)) on COMPASS.
2. Experimental arrangement and divertor heat loads
The COMPASS tokamak with graphite plasma facing components is one of few devices with an ITER-like plasma shape [22] with major radius R = 0.56 m, minor radius a = 0.23 m, toroidal magnetic field BT = 0.9–1.7 T, plasma current up to IP = 350 kA, pulse duration <500 ms and with line averaged electron density up to ne = 1.2 × 10²⁰ m−3. On COMPASS, a system of probes, combination of ball-pen (56 probes) and roof-top shaped Langmuir probes (two arrays of 55 probes each) [3] has been installed in the divertor region to systematically investigate the electron temperature as well as parallel heat flux during L-modes [23] and ELMy H-modes [3, 24, 25] plasmas with high temporal (∼1 μs) and good poloidal spatial (∼3.5 mm) resolutions.
The Langmuir probes are made of graphite protruding 1.5 mm into the plasma and provide floating potential or ion saturation current measurements. The ball-pen probes provide plasma potential measurements and in combination with floating Langmuir probes (LPs) also the electron temperature. The LPs have a 20° chamfer with a total exposed area above the divertor target of 22 mm2 and projected area (on one side) of SLP⊥ = 2.8 mm2. First achieved results on the analysis of the ELM energy fluence (||) were published in [3, 15] and compared with Eich's model prediction [2]
for the corresponding values of pedestal density ne,ped in [1020 m−3], temperature Te,ped in [keV], plasma elongation κ and minor radius ageo [m]. The values Btor and Bpol in [T] on the outer midplane as well as geometry factor Δequi ∼ 1.5 for COMPASS are obtained using the magnetic equilibrium reconstruction.
On the other hand, the experimental ELM energy fluence || is the time integral of the parallel heat flux (q||) over the duration of an ELM (τELM),  . This comparison has demonstrated that the fast probe measurements based on a single ELM analysis are in good agreement with the model prediction, as well as with previous IR measurements based on conditionally averaged ELM analysis from AUG, JET and MAST tokamaks. During the years 2019–2020, an extended analysis of the || using COMPASS measurements on the LFS was performed and the resulting maximum values of || (new 23 points from LFS probes (2019), 6 new points from IR (2019), 7 points of nitrogen seeding experiments (2020)) are shown in figure 1, together with AUG, JET and MAST results [2]. This latest analysis also includes probe measurements of || during impurity seeding experiments, in which nitrogen was introduced at variable rates (1.5–3 × 10²⁰ s−1) in the vicinity of the outer strike point (for more details of impurity injection at COMPASS see [26]). The impurity seeding was capable of influencing the plasma scenario (e.g. enforcing termination of ELMy H-mode) but did not produce clear signs of ELM buffering (power dissipation during ELM transport in the SOL) and also did not result in inter-ELM detachment at the outer target. Note that the parallel heat flux (q|| = γ·Te·Isat
+/SLP⊥), which is calculated by using the electron temperature (Te in eV), ion saturation current of the Langmuir probe (Isat
+) and heat transmission coefficient (γ), is newly calculating using γ = 11. The value γ = 11 was achieved by comparing divertor probes and IR camera measurements in L- and H-mode plasmas [23, 27] and from theoretical prediction [28] for non-ambipolar conditions (grounded tiles, Ti/Te = 1, no secondary electron emission). Moreover, the first COMPASS IR measurements of || on LFS are also included in figure 1. Fast infrared thermography system measurements were performed using the Telops FAST-IR 2K camera equipped with an InSb detector sensitive to medium wavelength IR radiation (3–5 μm) [29]. This system provided time evolution of the full radial profile of the divertor temperature with a temporal resolution of 33 kHz and a spatial resolution of 0.6 mm px−1 at the divertor surface for the studied discharge #18240. Incident plasma heat flux was evaluated using the THEODOR code [30].
. This comparison has demonstrated that the fast probe measurements based on a single ELM analysis are in good agreement with the model prediction, as well as with previous IR measurements based on conditionally averaged ELM analysis from AUG, JET and MAST tokamaks. During the years 2019–2020, an extended analysis of the || using COMPASS measurements on the LFS was performed and the resulting maximum values of || (new 23 points from LFS probes (2019), 6 new points from IR (2019), 7 points of nitrogen seeding experiments (2020)) are shown in figure 1, together with AUG, JET and MAST results [2]. This latest analysis also includes probe measurements of || during impurity seeding experiments, in which nitrogen was introduced at variable rates (1.5–3 × 10²⁰ s−1) in the vicinity of the outer strike point (for more details of impurity injection at COMPASS see [26]). The impurity seeding was capable of influencing the plasma scenario (e.g. enforcing termination of ELMy H-mode) but did not produce clear signs of ELM buffering (power dissipation during ELM transport in the SOL) and also did not result in inter-ELM detachment at the outer target. Note that the parallel heat flux (q|| = γ·Te·Isat
+/SLP⊥), which is calculated by using the electron temperature (Te in eV), ion saturation current of the Langmuir probe (Isat
+) and heat transmission coefficient (γ), is newly calculating using γ = 11. The value γ = 11 was achieved by comparing divertor probes and IR camera measurements in L- and H-mode plasmas [23, 27] and from theoretical prediction [28] for non-ambipolar conditions (grounded tiles, Ti/Te = 1, no secondary electron emission). Moreover, the first COMPASS IR measurements of || on LFS are also included in figure 1. Fast infrared thermography system measurements were performed using the Telops FAST-IR 2K camera equipped with an InSb detector sensitive to medium wavelength IR radiation (3–5 μm) [29]. This system provided time evolution of the full radial profile of the divertor temperature with a temporal resolution of 33 kHz and a spatial resolution of 0.6 mm px−1 at the divertor surface for the studied discharge #18240. Incident plasma heat flux was evaluated using the THEODOR code [30].
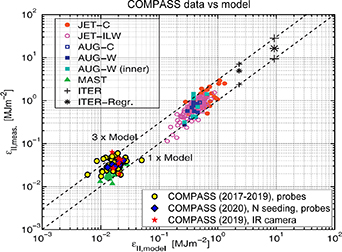
Figure 1. The maximum of || on LFS of COMPASS obtained by divertor probes in attached condition (yellow circles) and nitrogen seeding experiments (blue diamond) and using IR camera (red stars) in comparison to the Eich model and previous measurements obtained on JET, AUG and MAST, see figure 3 (Reproduced with permission from [2]. © 2017 The Authors. Published by Elsevier Ltd. CC BY-NC-ND 4.0.
Download figure:
Standard image High-resolution imageIn general, all COMPASS results shown in figure 1 are in good agreement, within the (3:1–1:1) boundaries, with the model prediction, as well as with the previous measurements from AUG, JET, MAST and recently also from the HL-2A tokamak [15]. Note that these COMPASS points at low energy fluence make the (linear) extrapolation towards ITER more reliable. In addition, they seem to indicate that the hypothesis of the Eich's model is valid, i.e. collisionless plasma and ELM transport dominated along magnetic field lines. However, the limitations of H-mode scenarios and heating systems do not allow us for precise determination of ELM Types at COMPASS, e.g. by observing changes of ELM frequency with changes of input power.
3. Temporal characteristics of ELMs—rise and decay times
The above mentioned results are important to improve the predictions of the ELM heat loads for ITER and other fusion facilities. However, it is also crucial to understand the temporal evolution and the time scales of the ELM heat load patterns on the divertor to estimate the material limit and lifetime of the plasma facing components. For this purpose, we used an extensive ELMy H-mode database (including ELMs shown in figure 1) to analyze the rise and decay times of the total ELM power incoming to the outboard divertor. The database consists of 142 single ELM events within 29H-mode discharges with single null configuration and deuterium plasma. The major parameters were Ip ∼ 220 kA, BT = 1.15 or 1.5 T, 2 < n [1019 m−3] < 9, q95 ∼ 3 with/without neutral beam injector (NBI) heating. Figure 2 shows an example of the temporal evolution of the total (perpendicular) ELM power (PELM = 2π∫q||sin(α)RdR, α—magnetic field line incident angle) integrated within the outboard area (all LFS probes) during a single ELM event (starting at t0 ∼ 1097 ms) in shot # 18447 (BT = 1.15 T, IP = 200 kA, ne = 5 × 10¹⁹m−3, q95 = 2.9 with PNBI = 0.2 MW). The blue line shows the ELM power PELM with high temporal resolution (∼1 μs). Its values are strongly fluctuating with clear evidence of the inner filamentary structure highlighted by the smoothed red line. This filamentary structure is not visible when the ELM conditionally averaged technique is applied typically for IR measurements over many ELM events. Then, we use a formula (equation (5)) in [31] based on the vacuum free-streaming model [32] to fit the whole temporal evolution of PELM and to define a representative maximum, which is otherwise difficult to estimate from the fluctuating values. This technique might still underestimate or overestimate the peak values of PELM, but it provides a reasonable value less affected by the presence of the fluctuations and ELM filamentary structures. The value of τrise is then defined as the time duration for PELM to go from 10% to 100% of its maximum (subtracting the pre-ELM power value), as is done similarly in [14, 15]. The second part of the temporal evolution of PELM, after it reaches its maximum, is fitted by an exponential decay function (see the orange line in figure 2) with characteristic decay time τdecay also used in [14, 15]. The error bars of both quantities are based on the fitting of the PELM by the free-streaming model (FSM) function (error of the maxima values) or the exponential decay (error on the characteristic decay time parameter).

Figure 2. The ELM power during a single ELM event (# 18447, t ∼ 1097 ms)obtained from all LFS probes. The rise time is τrise = 58 μs (time duration for PELM to increase from 10% to 100% of its maximum), and the decay time τdecay = 149 μs is obtained by an exponential fitting.
Download figure:
Standard image High-resolution imageThen, the rise time values can be compared with τ|| in order to study the connection length L|| during the ELM propagation phase. The value of τ|| is given by τ|| = L||/cs with the sound speed cs calculated for equal electron and ion pedestal temperatures, Te ped = Ti ped. The values of Te ped were obtained from Te profiles measured by high resolution Thomson scattering (HRTS) system [33] using the so-called two-line fitting technique [24, 34]. Note that the measurements of the HRTS system with a constant repetition frequency allowed us to get reasonable measurements of the Te ped in the last 30% of the previous ELM cycle (corresponding to fully developed H-mode pedestal) only in a few cases. In total, we have obtained 20 ELMs with corresponding Te ped and for which τ|| can be calculated. The final comparison of τrise and τ|| values is plotted in figure 3. Here, we have used two different methods to obtain the corresponding L|| on the LFS before the ELM (inter-ELM phase). First, we have calculated L|| using a field line tracing software (Pleque [35]) and the EFIT magnetic reconstruction during the inter-ELM period. In this case, the L|| calculation starts at 1 mm outside the last closed flux surface at the outer midplane until the outboard divertor. Second, the value L|| (appr.) is found by using a simple formula L|| (appr.) = 2πq95 Rsep/3. This is again for the case when the ELM energy released location is at the outer midplane and propagates to the outboard divertor [36]. It is seen in figure 3 that the resulting values τrise are slightly higher than τ|| values. The similar trend was observed also during previous measurements on JET, AUG, JT-60U, MAST, HL-2A tokamak [4, 14, 15] using IR measurements or simulations [37–39, 40]. It is also clear that both methods of L|| calculation lead to a similar resulting τ|| values.
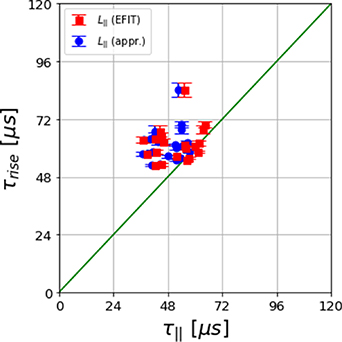
Figure 3. Comparison of τrise and τ|| times during 20 different single ELM events in shots #18232—#18611. The values τ|| are obtained by using sound speed with Te ped = Ti ped and the connection length L|| from field line tracing (red squares) or the simple formula 2πq95 Rsep/3 (blue circles).
Download figure:
Standard image High-resolution imageThe similarity of both τrise and τ|| can lead to the conclusion that the L|| during ELM, or at least at the beginning of the ELM event, is similar to the inter-ELM value. Thus, the magnetic field lines might be only weakly ergodized during ELMs in the SOL region on COMPASS. Indeed, it was shown that the time rises of the electron temperature in 1D3V kinetic simulations of ELM propagation through the SOL on COMPASS with no ergodization are in very good agreement with fast ELM Te measurements on divertor and the results of the free-streaming (vacuum) model [24]. However, it is also shown in [36] that the free-streaming model approach would define the relation between the empirical value τrise and the theoretical τFSP as τrise = 0.39 × τFSP. The theoretical value τFSP is the expected time between the beginning of the ELM event on midplane and the observed maximum of the heat flux on the outboard divertor. In this case, we would need to apply a correction of our calculated connection length L||/0.39 during ELM to agree with the free-streaming model prediction. Nevertheless, even the value ∼L||/0.39 (∼factor two longer connection length) leads to the similar conclusion that magnetic field lines are not significantly ergodized in the SOL region on COMPASS during ELMs.
Because the total ELM power is deposited during both periods, τrise and τdecay, it is of interest to know if any relation between these two temporal characteristics exists. Both characteristic times of all 142 single ELM events are plotted in figure 4 versus each other. The two boundary lines represent the variation of the ratio τdecay/τrise within the interval 1.5 up to 4, as also used in [15]. We clearly see that τdecay and τrise values fit well to these borders. A similar behavior was observed, not only on HL-2A [15], but also on JET [4]. This agreement found across different devices can provide general and useful upper and lower limits of the ELM duration on divertor. Note, it is visible in figure 4 that these τrise appear to be only above roughly 50 μs. This is of course not a physical limit, but the analysis of the τrise values on COMPASS has some diagnostic limitation. Very small τrise values are typically expected for high cs values (due to the large Te ped) and therefore the ELM Te peak values on the divertor are overloading the ion saturation current measurements of the negatively biased Langmuir probes. Although we do not see any clear dependence between τdecay and τrise in figure 4 within the range of our results, it might be possible that some ELM or general plasma parameters affect the ratio τdecay/τrise. In our case, this could not be checked with the major plasma parameters, like plasma current or the toroidal magnetic field, as they are nearly constant during a given discharge and even very similar within our 29H-mode shot database. On the other hand, the line averaged density is varying significantly within the range 2 < n [1019 m−3] < 9. Nevertheless, it is seen in figure 5 that the resulting ratio has no clear dependence on this parameter. We have found the same behavior of the ratio also with respect to the relative ELM energy ΔW/W (W is the total pre-ELM plasma energy), as seen in figure 6. The ratio was compared also to values of the turbulence parameter αt = 3 × 10⁻¹⁸ R q2 n Zeff T−2 (with major radii R [m], cylindrical safety factor q, electron density n[m−3], effective charge Zeff and the electron temperature T [eV]), introduced in [41], with no clear dependence within the range 0.07 < αt < 0.17. However, in this case we have used only ELM data plotted in figure 3 with Thomson scattering measurements at the separatrix position, which limits our statistics.

Figure 4. The ELM decay (τdecay) and rise (τrise) characteristic times for 142 single ELM events within 29 H-mode discharges. The boundary lines represent the ratio τdecay/τrise (4:1 and 1.5:1).
Download figure:
Standard image High-resolution image
Figure 5. The ratio τdecay/τrise with respect to the line averaged electron density n.
Download figure:
Standard image High-resolution image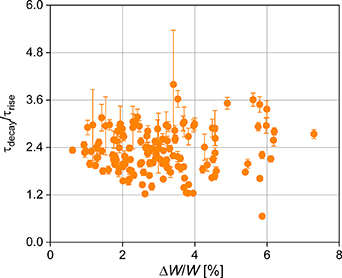
Figure 6. The ratio τdecay/τrise with respect to the relative ELM energy ΔW/W.
Download figure:
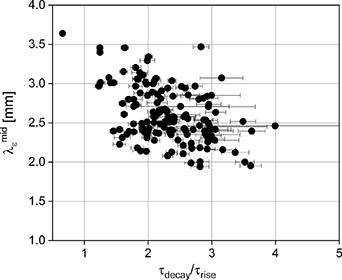
Standard image High-resolution imageIt was shown that the temporal characteristic, ratio τdecay/τrise, is changing significantly, which might affect the final temperature evolution of the divertor components during ELM. In general, you might find that the material surface temperature is peaking during τrise as seen on JET [12]. However, if the τdecay ≫ τrise then τdecay period, when the major part of || will be delivered, must play also an important role in the temperature increase. The average temperature increase during ELM depends on the material property like heat conductivity etc and is proportional to 1/ [10], τELM = τrise + 3 × τdecay. Of course, the final impact on the temperature increase during ELM is also given by the maximum of || and the wetted area [4]. The wetted area is commonly defined as a toroidally and radially integrated q|| profile divided by the peak value of q||. However, our fast divertor probe measurements have shown that the peak values of q|| are strongly influenced by the ELM filamentary structure, with no well-defined maximum. Therefore, we will further use only || and its radial profile (see example, figure 7 in [3]). The radial integration of || along the outboard divertor surface (with distance s) divided by the maximum of || provides the integral || decay length λ
= ∫||ds/max(||) or its value mapped to the midplane, λ
mid. A similar definition is used in previous work for integral power decay length [4]. It is shown in figure 7 that these ELM space characteristic values (λ
mid) are clearly linked to the ratio of the ELM temporal characteristic values (τdecay/τrise). In principal, the ELM event with very sharp transition in time (τdecay/τrise ∼ 1) will cause larger footprint on the divertor surface and vice versa. This actually helps to better distribute the ELM energy along the divertor for the short ELM duration (τELM). It might be beneficial for the fusion devices if a similar trend is also found. Note, the typical values of the divertor power decay length mapped on the midplane (λq
mid) on COMPASS during the inter-ELM period is within the range 0.5 < λq
mid [mm] < 1.0 as shown in figure 8.17 [27].
[10], τELM = τrise + 3 × τdecay. Of course, the final impact on the temperature increase during ELM is also given by the maximum of || and the wetted area [4]. The wetted area is commonly defined as a toroidally and radially integrated q|| profile divided by the peak value of q||. However, our fast divertor probe measurements have shown that the peak values of q|| are strongly influenced by the ELM filamentary structure, with no well-defined maximum. Therefore, we will further use only || and its radial profile (see example, figure 7 in [3]). The radial integration of || along the outboard divertor surface (with distance s) divided by the maximum of || provides the integral || decay length λ
= ∫||ds/max(||) or its value mapped to the midplane, λ
mid. A similar definition is used in previous work for integral power decay length [4]. It is shown in figure 7 that these ELM space characteristic values (λ
mid) are clearly linked to the ratio of the ELM temporal characteristic values (τdecay/τrise). In principal, the ELM event with very sharp transition in time (τdecay/τrise ∼ 1) will cause larger footprint on the divertor surface and vice versa. This actually helps to better distribute the ELM energy along the divertor for the short ELM duration (τELM). It might be beneficial for the fusion devices if a similar trend is also found. Note, the typical values of the divertor power decay length mapped on the midplane (λq
mid) on COMPASS during the inter-ELM period is within the range 0.5 < λq
mid [mm] < 1.0 as shown in figure 8.17 [27].
Figure 7. The integral || decay length of the outboard divertor mapped on the midplane with respect to the ratio τdecay/τrise.
Download figure:
Standard image High-resolution image
4. Conclusions
The first systematic study of the temporal characteristics of ELM events on the COMPASS outboard divertor with high temporal resolution probe measurements (∼1 μs) provides large statistics of rise (τrise) and decay (τdecay) time values. The results are based on individual ELM analysis using divertor probe measurements. It was found that τrise values are in the range of about 50 μs–100 μs and comparable to the characteristic time of the ELM parallel propagation τ|| = L||/cs. The values L|| were obtained either by field line tracing software (Pleque) or by a simple approximation of the midplane—outboard connection length L|| = 2πq95
Rsep/3. We have also discussed the free-streaming model (FSM) prediction that τrise = 0.39 × τFSM. We might conclude that the magnetic field lines are only weakly ergodized during ELMs in the SOL region on COMPASS. This also implies that the peak ELM energy fluence (max (||)) on the outboard divertor is dominated by the ELM parallel transport, which is confirmed by a reasonable agreement with model prediction. The values of the ratio of τdecay and τrise for each ELM event fit very well to the boundaries 1.5 < τdecay/τrise < 4, as already shown on JET [4] as well as on the HL-2A tokamak [15]. The general limits of the ratio across different tokamaks bring a reasonable prediction of the maximum and minimum ELM duration τELM = τrise + 3 × τdecay, which is associated with the increase of the temperature of the divertor material as ∼1/ .
.
It was shown that the ratio has no clear dependence on the relative ELM energy or line averaged electron density. Moreover, we have found that values of the integral || decay length (mapped on midplane λ
mid) are clearly linked to this ratio. It is for the first time shown on COMPASS data that the ELM events with a very sharp transition in time (τdecay/τrise ∼ 1) will cause larger footprint on the divertor surface and vice versa. This mutual dependence actually helps to better distribute the ELM energy along the divertor for a short ELM duration (τELM).
Acknowledgments
The authors would like to thank R. Pitts, T. Eich and J. Horacek for the valuable discussion on the ELM characteristic times. Part of the work presented in this article was realized in the frame of summer and winter schools (SUMTRAIC and EMTRAIC) held at the IPP Prague [42]. This work was supported by MYES Projects# LM2023045 and CZ.02.1.01/0.0/0.0/16_013/0001551 and IAEA CRP F13019—Research Contract No. 22727/R0 and the Czech Science Foundation within the project GACR 20-28161S.