


Abstract
This paper presents a multi-machine, multi-parameter scaling law for the n = 2 core resonant error field threshold that leads to field penetration, locked modes, and disruptions. Here, n is the toroidal harmonic of the non-axisymmetric error field (EF). While density scalings have been reported by individual tokamaks in the past, this work performs a regression across a comprehensive range of densities, toroidal fields, and pressures accessible across three devices using a common metric to quantify the EF in each device. The metric used is the amount of overlap between an EF and the spectrum that drives the largest linear ideal MHD resonance, known as the "dominant mode overlap". This metric, which takes into account both the external field and plasma response, is scaled against experimental parameters known to be important for the inner layer physics. These scalings validate non-linear MHD simulation scalings, which are used to elucidate the dominant inner layer physics. Both experiments and simulations show that core penetration thresholds for EFs with toroidal mode number n = 2 are of the same order as the n = 1 thresholds that are considered most dangerous on current devices. Both n = 1 and n = 2 thresholds scale to values within the ITER design tolerances, but data from additional devices with a range of sizes are needed in order to increase confidence in quantitative extrapolations of n = 2 thresholds to ITER.
Export citation and abstract BibTeX RIS
1. Background and motivation
Non-axisymmetric magnetic fields (δB) smaller than the axisymmetric field (B) by many orders of magnitude (δB/B ≈ 10−4) can impact tokamak performance by driving reconnection and locking the resulting island, causing a disruptive loss of energy, momentum, and particle confinement. Small asymmetries in the design and construction of tokamaks can readily produce intrinsic error fields (EFs) of this order and significantly inhibit tokamak performance. Thus it is that error field correction (EFC) coil sets are commonly used to mitigate the intrinsic EF. As these EFC coil geometries will never exactly match the intrinsic EF source geometries, their design must sufficiently mitigate the spectra that drive these so called EF penetration events. To provide metrics for the design and optimization of such coils, one must answer first what the harmful components of the field are and second what level of said components is tolerable.
The first question has been answered through years of experience with EFC on existing machines. One can cleanly separate and prioritize EFs based on toroidal harmonic n, due to the toroidal symmetry of the tokamak (the non-axisymmetry is small and toroidal mode coupling enters only through second-order non-linearities). This report focuses on the low n EFs, which are commonly held to be the most dangerous for their association with locking and disruptions. Although early work concentrated only on the lowest n = 1 EFs [1–12], recent work showed that the n = 2 EF has a similar density scaling and even similar thresholds in current machines [13]. The choice of poloidal mode (m) spectrum for compensation is more complicated, since the poloidal modes are strongly coupled due to toroidicity and shaping in the poloidal plane. The perturbed field's dependence on the poloidal coordinate system makes any single harmonic of the vacuum field a poor metric [14]. Vacuum field metrics also fail to account for the natural modes of the plasma response to external EFs, which amplify or shield the external perturbation [15]. This plasma response must be taken into account since the total (external and plasma response) non-axisymmetric field drives the reconnection process at resonant surfaces. The tokamak community has thus moved beyond early work using a vacuum field criteria known as the "3-mode criterion" [2, 16–20] and now uses a more sophisticated EFC criterion developed for identifying the most important poloidal components of the EF of a given n using linear, ideal MHD modeling [13, 15, 21].
What magnitude of these most-harmful EF components is tolerable is a more difficult question to answer, as it depends on complex resonant-layer physics. The many n = 1 EF penetration threshold studies have scaled empirical thresholds against macroscopic scenario-defining parameters and previous n = 2 work investigated a simple density dependence [13]. This work expands previous single-machine n = 2 studies to form a multi-machine, multi-parameter n = 2 EF scaling and compares this with an equivalent n = 1 EF scaling at present to set a basis of future development on a unified low-n resonant EF threshold scaling.
The remainder of this paper is structured as follows. Section 2 reviews the ideal MHD resonant coupling criterion widely used for EFC optimization and section 3 briefly details a n = 1 threshold scaling across 7 devices. Section 4 then introduces a 3-machine n = 2 scaling and details experimental scans of individual parametric dependence. The implications of these scalings for ITER are presented in Section 5 and remaining challenges are discussed in Section 6.
2. Linear external  criterion

As stated above, EFs drive natural modes of the plasma response that amplify or shield the external perturbations and an effective EF metric for avoidance of core tearing modes should incorporate this plasma response. However, a broadly validated model of the detailed non-linear response and penetration has proven difficult due to the complexity of this physics. Instead, we use ideal MHD plasma response to represent the ideal "outer layer" away from the resonant surfaces and empirical scalings to represent the more complex "inner layer" dynamics at the rational surface. This approach aims to provide a rule for EFC in the form of,

for a given toroidal harmonic n. The left-hand side (LHS) of this inequality, δres, is a metric quantifying the strength of the core resonant field, which can penetrate through the resonant magnetic surface if the value is large enough to hit the threshold given by the right-hand side (RHS). The RHS threshold, δpen, is determined through empirical scalings with macroscopic operating parameters. Only widely available 0D plasma parameters are used in this empirical scaling to maximize the utility of the RHS for design of future tokamaks for which accurate knowledge of detailed profiles may not be available. The parameters used in this paper include: the line integrated density (ne), the major radius (R0), the toroidal field on axis (BT), and the normalized plasma pressure divided by the internal inductance ( ). This parametric scaling originated from experimental observations of impactful parameters and engineering design requests for early n = 1 studies. It is grounded in solid physics and control practices however, and does encompass the theoretical parametric dependencies for penetration physics.
The form of the equation (1) is designed to separate physics of different time and spatial scales. The magnetic field quantity δres is established by the 3D equilibrium on a fast ideal MHD time scale (on the order of microseconds), whereas δpen represents local dynamics and transport that determines the field penetration on slower resistive MHD time scales (on the order of milliseconds). This fast δres is the result of outer-layer ideal MHD equation providing initial boundary conditions for the inner-layer and δpen is determined by the non-linear, resistive evolution inside that layer [16, 22–24]. This separation is essential in practice for developing EFC strategies, since otherwise one must solve the complete time-dependent dynamics for all possible combinations of EF sources and all equilibrium of interest. This is impossible, as there are millions of possibly significant combinations of the many dimensional EF source and equilibrium spaces expected in future machines like ITER for which we would like to predict the necessary EFC [17].
The potential of external EFs to drive magnetic islands can be described by the so-called external  [22–24]. This external
  is a parameterization of the physical parallel current screening the resonant field on the fast ideal MHD time scale prior to penetration. This resonant screening current can be quickly and reliably calculated by linear, ideal modeling by codes such as MARS [25–27] and the Generalized Perturbed Equilibrium Code (GPEC, previously known as IPEC) [15, 21, 28, 29]. The EF threshold in this metric will henceforth be referred to as the linear external
  criterion.
Within the ideal MHD framework of GPEC, the resonant current on each rational surface in the computation domain is linearly related to the external energy-normalized flux such that,

Here  is a R × 1 matrix vector of the square-root area weighted resonant current at each rational surface and R is the number of rational surfaces in the computational domain within the plasma. The vector
  is an energy normalized M × 1 external flux vector of poloidal Fourier harmonics
  , M is the number of harmonics included in the spectra computation, and
  is a R × M coupling matrix. The energy normalization, described in detail in references [30, 31], uses a square-root area weighted field vector
  such that the L1 norm is proportional to the line energy of the applied external field. This normalization alone marks a critical advancement over previous 3-mode criteria, as it provides a coordinate-invariant metric for consistent, multi-machine scaling studies.
The elements  give the coupling between each applied poloidal harmonic m and rational surface r. The coupling matrix is, in general, not square and not Hermitian. It is positive definite however, and decomposing the matrix using singular value decomposition gives R positive singular values cr. These singular values rank the corresponding unit right singular vectors (RSVs) of external flux by the power of induced resonant currents
  . These RSVs form a unit basis of the flux spanning the full space for which there is any resonant current drive from external fields [31]. The first of these modes usually has a singular value much larger than the others and dominates the total resonant drive in tokamak scenarios of interest for fusion energy [14]. This mode has been called the dominant external field [14, 30], dominant mode [32, 33] or just SVD1 [34] and the amount of the external flux aligned with this mode is often referred simply as the "overlap".
This dominant mode overlap metric has been used extensively in EFC efforts in active machines [10, 30, 32, 33], as well as for the prediction of EF thresholds for devices under construction such as NSTX-U [35] and ITER [14]. For EFC threshold scaling purposes, the main concern is core island penetration. Thus, a truncated coupling matrix  is used where only rows corresponding to rational surfaces within the plasma contained within 90% of the poloidal flux are kept prior to the SVD. Calling the first RSV of this truncated matrix
  , the corresponding equation (1) LHS metric is,
where BT has been used to normalize the EF to the scale of the axisymmetric equilibrium field for a unitless metric. Note that the dominant mode contains information about the ideal MHD coupling, which accounts for the q95 and shaping dependencies of the outer layer response. The magnitude of the plasma pressure clearly impacts the corresponding eigenvalue or magnitude of response [36, 37]. This, however, is removed from the LHS metric in favor of experimental pressure scaling. This is in part because this is closely coupled to the most robustly available scalar quantity related to temperature and rotation. It is also because the eigenmode shape is a more robust feature of experimental equilibria than the exact eigenvalue, and the metric has been chosen to be as robust to experimental uncertainty as possible.
Thus, RHS scalings included in equation (1) are limited here to parameters expected to be important in the inner layer physics. From this point on in the manuscript, this dominant mode overlap metric will be referred used as the overlap metric.
3. n = 1 scaling
The critical field level for triggering core n = 1 islands has been extensively documented [2, 4, 12, 16, 38, 39], and has used the GPEC overlap metric for more than a decade [10, 13, 30, 32, 33]. Individual parametric dependencies of the GPEC overlap metric have been recently reported in [13]. The data reported there and in this manuscript come from a joint experiment (MDC-19) in the International Tokamak Physics Activity (ITPA) MHD Topical Group. The ITPA database includes data from the COMPASS, DIII-D, EAST, CMOD, JET, KSTAR, and NSTX tokamaks. Scalings using the 2012 database were reported in [40]. Differences between the database used then and the one used here include the addition of a new machine (EAST) and new data from two machines (DIII-D and COMPASS). In addition, cases with obviously significant non-resonant EF effects have been excluded in this paper (these include density ramp-downs in DIII-D with experimentally optimal EFC, Test Blanket Module cases in DIII-D with large n > 1 EFs, and large n = 3 EF braking cases in NSTX) in order to better focus the scaling on the physics it is reportedly trying to capture.
The 177 discharge database used here spans a large range of parameter space, as shown in figure 1. The line integrated density spans two orders of magnitude from 3.3 × 10¹⁸ to  and the normalized pressure βN spans nearly two orders of magnitude from 0.06 to 4.0. Toroidal field data has been collected between 0.3 and 7.6 Tesla, while the major radius of the plasmas has spanned 0.56 to 2.94. This database spans 15MA ITER "baseline scenario" specifications (
 , BT≈ 5.3T, R0≈ 6.2m, βN≈ 1.8,
  from [41]) in every parameter other than major radius. This feature is robust to alternative predictions of ITER scenarios, which include a 15MA H-mode scenario (
 ,
,  ) and L-mode (
 ,
,  ) [42, 43].

Figure 1. Distribution of the n = 1 external  threshold database across scaling parameters for each machine. Within a machine bin (color), points are distributed horizontally for visualization of the density at y-axis different values. The projected ITER baseline scenario value for each parameter is designated by a dashed horizontal line.
Download figure:
Standard image High-resolution imageThe corresponding power law scaling fit for these parametric dependencies is,
In this combined scaling, the line integrated density ne has units of  , the on axis toroidal field BT has units of Tesla and the major radius R0 has units of meters. Note that the normalized pressure scaling connects low power and/or Ohmically heated discharges reported in previous published and ITPA work [13, 40, 44] and higher power H-mode data available on select machines. The negative exponent can be interpreted as the detrimental impact of higher plasma amplification in H-mode. Performing the same regression analysis on only the Ohmic and L-mode data gives,

This limited database scaling is very similar to the full database scaling for all terms other than  , for which the sign of the exponent is switched. The impact of including specific experimental regimes is an important subject that will be discussed in detail in a devoted n = 1 scaling paper. Our purpose here is to simply state the current status of a generalized n = 1 EF scaling most appropriate for comparison to our n = 2 scaling, which is the true focus of this paper.
The exponents of this scaling law were calculated using a least squares fit weighted by the inverse of a smoothed distribution function (calculated using a multivariate Gaussian kernel density estimation, as in reference [45]) of an ITER-normalized data set to compensate for unevenly distributed data. This weights unique points (where the sampling density is sparse) more heavily than repeated measurements where the sampling is dense. It was done to utilize the full database while avoiding over-fitting of single machines that may have a larger set of devoted penetration threshold scans or over-fitting multi-machine database clustering around, for example, R0 1.6m or BT 1.8T. This means the fits more accurately describe the extrema of the parametric ranges where data is often sparse and thus represent the best possible wide-ranging projection to new scenarios.
Figure 2 compares the predictions of this scaling law to the actual experimentally determined thresholds. The vast majority of experimental observations fall within a factor of 2 (designated by dashed lines) of the simple scaling law. The EAST discrepancies stem from systematic differences between thresholds observed in EAST and those observed DIII-D and KSTAR at very similar scaling parameters. The details of these differences, and of local deviations from the broad scaling law are left to separate publications by the respective device institutions [12]. For the purposes of this manuscript, the broadest possible cross-regime cross-machine scaling is presented. This follows the tradition of multi-machine confinement scalings, which sacrifice accuracy of non-linear behavior in individual machines in favor of a 0th order description of a metric across many machines [46]. These broad scalings have proven incredibly useful within the tokamak and fusion energy science communities and this threshold scaling provides a critical prediction of the design tolerances and EFC requirements for future machine designs. This particular model projects a value of (1.37 ± 0.36)× 10−4 for the threshold in ITER, which is comparable to the thresholds observed in modern machines and well above the expected EF given the tight fabrication and construction tolerances [18, 44, 47].
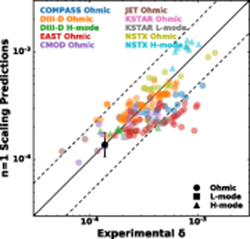
Figure 2. Power law scaling (4) predictions compared to the experimental threshold for every shot in the n = 1 experimental database. The solid line denotes perfect correspondence while the dashed lines delineate factor of 2 and 0.5 discrepancies. The black circular marker on the solid line shows the projected threshold for the ITER baseline scenario shown in figure 1.
Download figure:
Standard image High-resolution imageThe strict adherence to robustly available, global 0D parameters in this scaling is not intended to replace the more detailed physics studies within individual machines which are rightfully compared to the theoretical scalings specific to individual regimes [16, 22–24]. An important insight in comparing this scaling to the theoretical scalings, however, is to note that the theory predicts a strong (linear) scaling with plasma rotation across all relevant regimes while the rotation does not appear directly in the experimental scaling. Rotation effects are hidden in the pressure scaling of powered plasmas, as the vast majority of the non-Ohmic experiments scanned power using only co-current neutral beam injection. It is hidden in a combination of all four parameters in the Ohmic plasmas, as the intrinsic rotation changes with size and collisionality [48]. These Ohmic experiments have not had the measurements necessary to accurately constrain the rotation profile at the time of penetration. The current database contains 138 of such Ohmic discharges together with a mere 4 L-mode and 35 H-mode discharges. The lack of rotation measurements in such a larger portion of the data has prevented explicit inclusion of rotation scaling in this work. Additional experiments gathering consistent rotation data in L- and H-mode plasmas across a wide range of devices would enable the inclusion of a rotation dependence that could improve the accuracy of the overall scaling. The utility of such improvement is diminished, however, by the uncertainties in accurately and robustly predicting the rotation in future devices [48].
4. n = 2 threshold scaling
Recent studies reported that plasmas in existing devices are "no less sensitive to n = 2 fields relative to n = 1 fields" [13]. In that work, magnitude and the density scaling of the n = 2 overlap threshold was found to be the same as for n = 1 experiments in DIII-D and EAST. Since that time, additional experiments have been performed to determine the n = 2 threshold scaling across a wider range of equilibrium parameters. This database includes thresholds from 92 discharges in COMPASS, DIII-D, and EAST and covers a parametric space shown in figure 3. All discharges in the database are Ohmic or L-mode plasmas. They span factors of 6, 10, 2, and 3 in ne,  , BT and R0 respectively. Unlike the n = 1 database, this database does not encompass any of the ITER baseline scenario values designated by dashed lines. It does, however, span the standard 15MA L-mode scenario ne and
  .
.

Figure 3. Distribution of the n = 2 external  threshold database across scaling parameters for each machine. Within a machine bin (color), points are distributed horizontally for visualization of the density at y-axis different values. The projected ITER baseline scenario value for each parameter is designated by a dashed horizontal line.
Download figure:
Standard image High-resolution imageAll three machines used Low Field Side (LFS) 3D coil arrays to apply artificial EFs to their standard EFC target plasma scenarios shown in figure 4. These scenarios vary in shaping from upper single null (DIII-D and EAST) to lower single null (COMPASS). The coil geometries also vary widely across the three devices with relatively large coils external to the COMPASS vacuum vessel surrounding the full LFS, relatively localized EAST coils near the top and bottom of the LFS internal to the vacuum vessel, and in-between sized internal and external DIII-D coils. As expected, the GPEC dominant mode shown in figure 5 for all three machines looks very similar for discharges with q95≈ 3.2 despite the differences in shaping. The robustness of this dominant mode spectrum is a major reason for the reliability of the overlap metric. The spectra applied in each machine varies widely, however. Much of this variance comes from the difference in coil geometries. Each machine has also varied the applied n = 2 poloidal spectrum by combining multiple coil sets with different relative toroidal phasing. The poloidal spectra of the external flux on the plasma surface for the most commonly applied coil configurations are shown in figure 5.
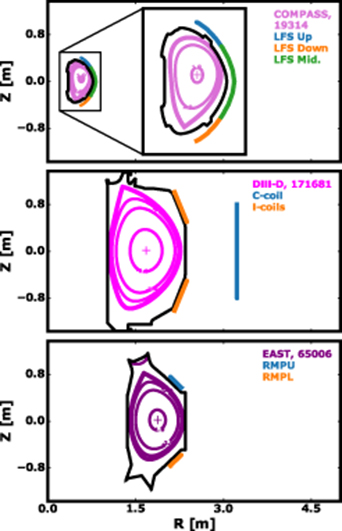
Figure 4. Plasma and coil geometries for typical n = 2 EF threshold scaling experiments in COMPASS (top), DIII-D (middle) and EAST (bottom). Integer safety factor surfaces are shown in magenta contours, while limiter walls are in black.
Download figure:
Standard image High-resolution image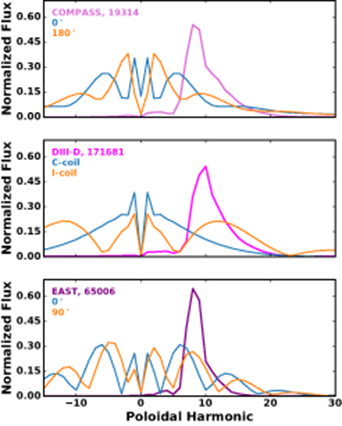
Figure 5. Poloidal spectra of the dominant resonant coupling RSV for three representative shots 19314 (COMPASS), 171681 (DIII-D) and 65006 (EAST) from the n = 2 EFC database. Also shown are the external spectra from common coil configurations in each machine. Phasing labels denote the difference between the upper and lower LFS coil phases.
Download figure:
Standard image High-resolution imageAs reported in reference [13], ramping n = 2 distributions of current in EFC coil sets lead to n = 2 mode penetration, followed quickly by a large n = 1 mode (likely destabilized due to rotation braking from the n = 2 penetration event). An example of the observed behavior is shown in figure 6. Here, an outboard mid-plane array of poloidal field probes is used to decompose the measured 3D field from the plasma into its dominant toroidal mode components [49, 50]. Although the n = 1 mode may be directly responsible for the majority of the loss in confinement in these plasmas, the n = 2 penetration is decisively the triggering event.

Figure 6. The evolution of the non-axisymmetric plasma field on the outboard mid-plane of DIII-D shows a typical n = 2 penetration prior to n = 1 growth.
Download figure:
Standard image High-resolution imageIn practice, the threshold is identified using a combination of the available magnetic, density, and rotation data depending on the machine and scenario. An example of the penetration signatures in a DIII-D L-mode is shown in figure 7.

Figure 7. The mode penetration threshold in a DIII-D L-mode discharge, identified by the sudden rise in line integrated density and fall in core rotation highlighted in grey.
Download figure:
Standard image High-resolution imageAlthough the database is not as large as in the case of n = 1 thresholds, there is sufficient data to fit an initial scaling with all the same parametric dependencies. This full n = 2 parametric scaling for is,
A comparison of experimental and projected thresholds for every shot in the database is shown in figure 8. The overall quality for this n = 2 scaling line is a R2 value of 0.81, which is better than the 0.73 obtained in the n = 1 scaling. There are few significant outliers in figure 8, with all but two of the experimental points lying within a factor of two of the scaling (as designated by the dashed lines). This high quality of fit is likely due to the smaller database covering the operating regimes of only Ohmic and L-modes in three machines, two of which are comparably sized machines.
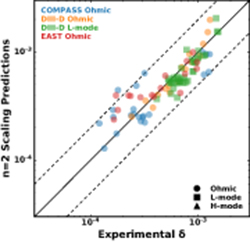
Figure 8. Power law scaling (6) predictions compared to the experimental threshold for every shot in the n = 2 experimental database. The solid line denotes perfect correspondence while the dashed lines delineate factor of 2 and 0.5 discrepancies.
Download figure:
Standard image High-resolution imageThe first major result to note from the n = 2 scaling is that the leading coefficient is comparable to that of the n = 1 scaling. The cloud of experimental thresholds is located at a similar order of magnitude as the n = 1 data, confirming the reference [13] warning that plasmas are sensitive to n = 2 EFs if they are on the same order as the n = 1 EF. Experience, however, has shown that n = 1 EFs are far more prevalent from tilts and shifts in the nominally axisymmetric coils than n = 2 shaping errors. In addition, localized sources of EFs tend to create larger low wavelength EFs at the plasma due to the faster radial decay of the higher harmonics. Thus, it is important to note that n = 2 EFs must be kept comparably low as n = 1 but to continue treating n = 1 as the most dangerous EF that must be corrected when constructing a new device.
Next, we note that the strong density and toroidal field scalings are quite similar to early n = 1 database scalings in low powered plasmas [16, 40]. This is reasonable and consistent with the theory that there is no fundamentally different inner layer physics at play for n = 2 penetration. The differences in size and pressure scalings, on the other hand, are more puzzling. The density and field scaling exponents are expected to determine the size scaling exponent  under Connor-Taylor invariance in quasi-neutral, high-beta, Fokker-Planck, Ohmically heated plasmas [51, 52]. Given the density and toroidal field scaling in equation (6), the Connor-Taylor invariant size scaling of 0.24 ± 0.30 is much smaller and more consistent with the n = 1 scaling. It is still above the −0.25 predicted by the analytical scalings in the linear density scaling polarization regime [24] however, signaling that more data may be important to better understand this particular dependence. The strong fit scalings for size and pressure from the database are a result of relatively small n = 2 thresholds found on COMPASS (DIII-D and EAST being of comparable size and pressure) and additional experiments on machines of intermediate or larger sizes would be a valuable test for this discrepancy.
The following sections detail devoted n = 2 threshold dependency scans done in the DIII-D tokamak. They show small changes to the configuration can often have a large impact on the parametric scaling observed in any one scan, and contrast the individual scans to the broader database scalings.
Nonlinear modeling is used to increase our confidence in the database scalings in these specific DIII-D scenarios. Although a robust non-linear model incorporating all the outer-layer and inner-layer physics thought to be important in diverted tokamaks is not yet available, a reduced non-linear MHD model known as TM1 [53, 54] is employed to investigate the basic dependencies of core EF penetration in these scenarios. In this paper, the code is used to calculate the non-linear, resistive, single-fluid MHD evolution in a cylindrical plasma. Single-fluid modeling is use to explore dominant dependencies, avoiding parametric coupling in the two-fluid model that can have a complicate but relatively small impact on the scalings. Providing experimental density, temperature, and rotation profiles as input, the amplitude of a fixed boundary perturbation of mode numbers  is scanned until the penetration threshold is reached [55, 56]. To provide a fine resolution scan in each case, the input profiles are interpolated from those of the experimental scans.
4.1. Density scaling
Density scaling experiments were performed on DIII-D and EAST and initial single-parameter scaling of the EF threshold for each machine was presented in [13]. Since then, the database has been expanded to include density scans at two toroidal fields in Ohmic discharges in EAST, as well as two toroidal field values in both Ohmic and L-mode DIII-D plasmas. In each DIII-D case, the EF was produced by currents in the two arrays of internal "I-coils" with 240° phasing (where the toroidal phase of the upper array n = 2 current distribution is 240 degrees larger than that of the lower array). Power law exponents for each of the individual scans have been fit using the overlap metric from equation (3). The experimental thresholds and scaling fits are shown together in figure 9.
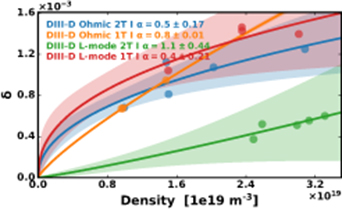
Figure 9. Density scans from DIII-D showing the experimentally determined EF thresholds (points) with associated single-parameter scaling fits (bands).
Download figure:
Standard image High-resolution imageThe large spread in fit exponents (from 0.4 to 1.1) spans the range of previously reported high 1.0 [1–7] and low 0.5 [8–12] scalings in single machine experiments, illustrating the danger of scalings of a single parameter in one machine and/or discharge condition. The spread in the magnitude of the thresholds suggests that these plasmas have hidden differences, and indeed the changes in both power and toroidal field cause significant changes to the  in these scenarios. Figure 10 shows the same data normalized by the equation (6) constant and size, toroidal field, and pressure scalings. Normalizing these dependencies enables a fit through the entire dataset of DIII-D devoted density scans and that fit exponent aligns more closely with the multi-machine database scaling.
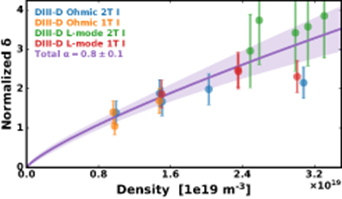
Figure 10. Density scans from DIII-D showing the experimentally determined EF thresholds (points) normalized by the equation (6) constant and size, toroidal field, and pressure scalings.
Download figure:
Standard image High-resolution imageTo elucidate the physics at work in these results, the cylindrical, non-linear, single fluid simulations using the TM1 code modeled the penetration threshold across an artificially extended density scan in L-mode 1 T conditions. The equilibrium safety factor and density profiles from DIII-D L-mode discharge 171672 were used in the TM1 modeling. Rotation profile measurements for this shot where sparsely populated, and better constrained profiles were taken from a comparable q95 L-mode shot 173147 from reference [57] after confirming the profiles were consistent with the available data from older shot.
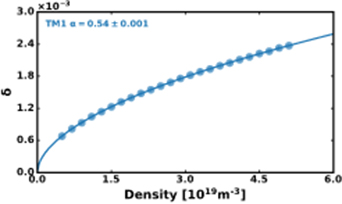
Figure 11. Resonant n = 2 EF threshold as a pure function of density at q = 3/2 surface in the TM1 model with corresponding least-squares fit to a single-parameter scaling power law scaling  .
.
Download figure:
Standard image High-resolution imageFixing the temperature profile to obtain a pure density scaling reveals a clean power law scaling of the TM1 calculated n = 2 EF threshold as shown in figure 16. Fitting the modeled thresholds using  gives a density scaling exponent of 0.54, which is closer to the analytic Rutherford Regime scaling exponent of 0.6 than it is to the linear scaling of the experimental scaling or the polarization regime derived to explain linear scaling observations [24, 58]. This low scaling lands within the range of the individual DIII-D density scan experimental scalings shown in figure 9 while falling below the density exponents from the normalized DIII-D and multi-machine scalings. The TM1 scaling also agrees well with reported n = 1 threshold scalings measured and modeled in J-TEXT experiments [11] and EAST [12], as well as the multi-machine n = 1 scaling fit using the select database and weighting discussed above.
The DIII-D only experimental and modeling analysis illuminates how the COMPASS data is boosting the equation (6) density exponent in addition to its impact on the size and pressure scalings. With more data from additional machines, we may reasonably expect the multi-machine database exponent to decrease, becoming even more aligned with the spread of n = 1 exponents fit here and reported in various individual machines. It is not expected to fall very far however, as the relevant regime for current tokamaks all predict values greater than or equal to 0.5 [12].
4.2. Toroidal field scaling
The strong toroidal field scaling experienced for n = 1 EF thresholds motivated devoted experimental scans to determine the n = 2 threshold behavior with changes in the toroidal field in DIII-D. The field on axis was scanned from 1 to 2.1 T and the scan repeated for the nominal Ohmic and L-mode plasma targets. These plasmas had a mean density of  with a standard deviation of
  .
.
Two 3D field spectra where applied to each of the targets at each toroidal field. One spectrum was produced by 240° phasing I-coils as in the density scans. The other was produced by an n = 2 current distribution in an array of 6 "C" coils external to the vessel mid-plane. As shown in figure 5, the I-coil configuration is more aligned with the dominant mode. The I-coil shots in these scans have "overlap" ( ) values of 0.5 ± 0.04, which is much more resonant than the C coil spectrum overlap of 0.33 ± 0.01 (here the errors correspond to the standard deviation). Still, it is clear that both coil configurations are a mix of resonant and resonant and non-resonant magnetic perturbations (RMP and NRMP).
The experimental thresholds and power law scalings fit to each individual scan are shown in figure 12 and their normalized values are consolidated for single fit in figure 13. Two major results are apparent from these figures. First, the individual scans of 3–6 shots each again give a wide variety of fit exponents. These span from −1.6 to −0.7, encompassing the full database regression exponent of −1.5. Note that the near inverse dependence shown in all these scans is consistent with the lack of strong toroidal field dependence reported in the unnormalized overlap criterion [13]. The spread however, again emphasizes the need for large, broad database regression in order to provide a robust scaling for projection to new machines or scenarios.

Figure 12. Devoted toroidal field scans from DIII-D showing the experimentally determined EF thresholds (points) with associated single-parameter scaling fits (bands).
Download figure:
Standard image High-resolution image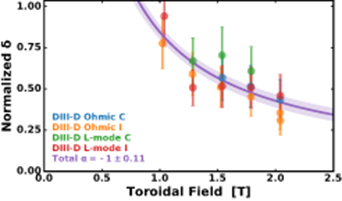
Figure 13. Toroidal field scans from DIII-D showing the experimentally determined EF thresholds (points) normalized by the equation (6) constant, density, size, and pressure scalings.
Download figure:
Standard image High-resolution imageAnother significant aspect of the DIII-D results is that the C-coil and I-coil thresholds overlay one another despite a factor of approximately 2 difference in the coil currents run through the different coil sets. This is an illustrative example of how our overlap criterion unites the disparate coil geometries of many machines. We note here that in addition to different coils producing different poloidal spectra, the coils were also sometimes ramped in different toroidal phases. An intrinsic error field equivalent to approximately 1.03kA in 0° phasing (or "even parity") I-coils has been taken into account in all the DIII-D data. This approximation of the error field is consistent with previous measurements of the n = 2 DIII-D EF and confirmed using 2-point scans at fixed phase in these devoted experiments [59] . Uncertainties in the DIII-D n = 2 EF however, may still be on the order of the slight offset between the scans shown here.
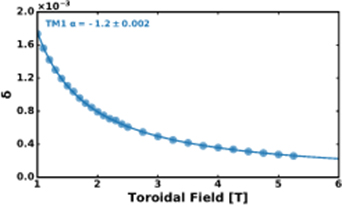
Figure 14. Resonant n = 2 EF threshold as a pure function of toroidal field in the TM1 model with corresponding least-squares fit to a single-parameter scaling power law scaling  .
.
Download figure:
Standard image High-resolution imageThe TM1 modeled penetration threshold across an artificially extended scan reproduces the full database scaling for the toroidal field. In this synthetic experiment, density, temperature, and safety factor profiles from the L-mode BT = 1T,  shot 171672 were used. Again, the rotation profile was taken from a similar shot (173147) with better charge exchange diagnostic coverage [57]. The modeling synthetically scaled the toroidal field, keeping all these profiles fixed, and found the threshold
  boundary condition amplitude that resulted in non-linear mode penetration. This threshold (converted to overlap assuming a constant dominant mode structure) scales inversely with the toroidal field to the power of 1.2. This exponent is slightly weaker than the -1.8 scaling reported in the Ohmic ion polarization regime [24] and the exponent of -1.5 in the full n = 2 database regression, but is close to the single DIII-D only fit. It is slightly stronger than the values of -1.0 originally reported for the n = 1 scaling in DIII-D and the -1.1 exponent in the particular multi-machine n = 1 scaling provided in section 3 [2]. All these values are close to one another, with the modeling providing a sound physical check on the experimental regressions and setting the expectation that as more n = 2 data is collected the multi-machine regression exponent may decrease slightly as the errorbars decrease. The use of modeling also enables extension of the scan to the high toroidal field value that will be used in ITER and shows no surprises there, lending confidence to our ability to extend the lessons learned in current devices to larger future ones.
4.3. Pressure scaling
It is important to note that the n = 2 scaling reported in equation (6) includes a positive dependence on the normalized plasma pressure  . This is in stark contrast to the full n = 1 regression's inverse dependence on the same variable, but consistent with the large Ohmic and L-mode n = 1 database fit. The positive n = 2 power scaling is also directly confirmed by devoted experimental scans in DIII-D L-mode plasmas with
  and BT≈ 1.8T, shown in figure 15.
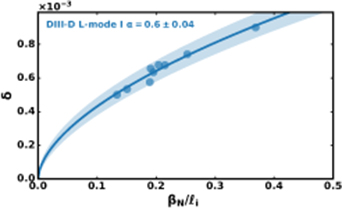
Figure 15. Devoted NBI power scan from DIII-D and showing the experimentally determined EF thresholds (points) with associated single-parameter scaling fit (band).
Download figure:
Standard image High-resolution image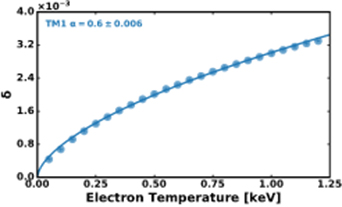
Figure 16. Resonant n = 2 EF threshold as a pure function of density in the TM1 model with corresponding least-squares fit to a single-parameter scaling power law scaling  .
.
Download figure:
Standard image High-resolution imageThe fundamental difference between this n = 2 result and the full n = 1 scaling is the inclusion of H-mode data in the n = 1 database. The higher βN H-mode plasmas amplify external error field, increasing the drive for islands relative to the external EF at the plasma boundary [31, 37, 60]. The negative pressure scaling in the n = 1 thus links the Ohmic and L-mode threshold to the amplification-reduced H-mode thresholds. As far as the n = 2 L-mode and Ohmic plasmas are from the n = 2 no-wall limit, the external  is dominated by the vacuum EF rather than the plasma amplification.
The positive pressure scaling shown in figure figure 15 is obtained experimentally by varying the neutral beam injected (NBI) power. The beams on the vast majority of machines are aligned so as to apply torque in the plasma current toroidal direction, and higher power is thus coupled to higher injected torque. However, in these L-mode DIII-D plasmas the rotation in the region outside of ρ ≈ 0.6 remained approximately constant. Changes in the NBI torque only changed the deep core rotation profile, which varied from inverted to peaked. The  surface in these plasmas was located at ρ ≈ 0.66 and thus the plasma rotation there changed little. The plasmas are in the Saturated Ohmic Confinement (SOC) regime, in which the confinement is also approximately independent of the power. Thus, the
  scaling seen here is best compared to the temperature scalings in analytic theory. Making this comparison, we find these particular DIII-D n = 2 experimental results agree better with the classic Rutherford regime value of 0.6 (with SOC fixed
  ) than to the more recently developed polarization regime value of 1.5 [24, 58].
Again, the TM1 modeled penetration threshold has been fit across an artificially extended scan. In this synthetic experiment, density, toroidal field, and safety factor profiles from the L-mode BT = 1T,  shot 171672 were used together with the rotation profile taken from a similar shot (173147) as before. The modeling synthetically scaled the temperature, keeping everything else fixed, and found the threshold
  boundary condition amplitude that resulted in non-linear mode penetration. This threshold (converted to overlap assuming a constant dominant mode structure) scales with the temperature to the power of 0.6. This exponent is consistent with the scaling expected in the commonly used Rutherford and visco-resistive regime theoretical models [58]. It also matches the
  scaling observed in the experimental data from DIII-D. The fact that all these values are close to one another is promising. The use of modeling also enables extension of the scan to the high temperatures expected in ITER and shows no surprises there, lending confidence to our ability to extend the lessons learned in current devices to larger future ones (at least for the currently documented Ohmic and L-mode regimes).
It should be re-stressed at this point, however, that the objective of the large multi-machine database collection and regression is not to validate or invalidate a specific analytical regime scaling. In fact, the objective is to scan as wide a parametric space as possible regardless of the validity boundaries for any one analytic regime. The comparisons given here are presented as a sanity check on the empirical regression, and are meant to confirm broad qualitative trends rather than precise quantitative values. The appropriate conclusions to take away from this discussion are that 1) n = 2 overlap threshold has a positive correlation with βN, 2) this does not conflict with the negative n = 1 scaling previous reported by the ITPA [40] because it does not yet include the plasma amplification physics important closer to the no-wall limit and 3) it is consistent with the expected positive scaling with temperature in Ohmic plasmas.
4.4. Size scaling
The best empirical fit to the n = 2 EF threshold data available on current machines results in a major radius exponent that is not at all consistent with the n = 1 regression. Unfortunately, two of the three machines that have studied the n = 2 threshold to date are very close in size (DIII-D and EAST). This means that the size scaling exponent is incredibly sensitive to the relative empirical thresholds on COMPASS as compared to these machines. Figure 8 shows that COMPASS plasmas tend to have penetration at lower applied n = 2 EF overlap values than the two larger machines despite spanning otherwise similar parametric spaces in figure 3. This is shown more explicitly in the partial regression plot of figure 17.
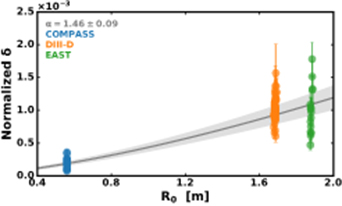
Figure 17. Empirical resonant n = 2 EF threshold values normalized by the equation (6) density, toroidal field, and pressure scalings as a function of major radius. The grey curve marks the remaining equation (6) major radius scaling.
Download figure:
Standard image High-resolution imageThis poorly conditioned regression can be contrasted with the breadth of data across the other parameters shown in figure 3. The partial regression plot of the toroidal field, shown in figure 18, shows the BT scaling being checked and balanced throughout the experimentally covered range. Many more machines are needed to constrain the n = 2 size scaling in this manor. For inspirational context, the n = 1 partial regression is shown in figure 19. This figure shows how the empirical scatter across the multiple small ( m) machines evens out the overall scaling. The addition of a significantly larger machine, in this case JET, also plays a large role in constraining this scaling. The fit exponent could have been much larger, for example, had there only been CMOD, KSTAR, and EAST n = 1 data available. A final note of interest in contrasting the n = 1 and n = 2 size scaling is that the COMPASS n = 1 data is very clearly comparable to the DIII-D and EAST n = 1 data. This is clear in both figure 19 and the unnormalized data shown in figure 1.
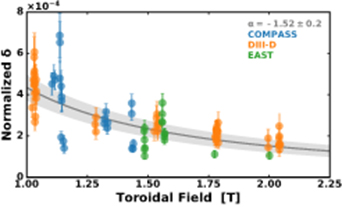
Figure 18. Empirical resonant n = 2 EF threshold values normalized by the equation (6) density, major radius, and pressure scalings as a function of toroidal field. The grey curve marks the remaining equation (6) major radius scaling.
Download figure:
Standard image High-resolution image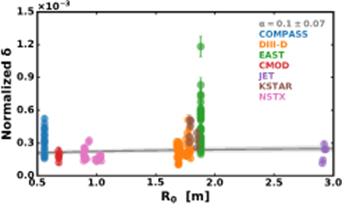
Figure 19. Empirical resonant n = 1 EF threshold values normalized by the equation (4) density, toroidal field, and pressure scalings as a function of major radius. The grey curve marks the remaining equation (4) major radius scaling.
Download figure:
Standard image High-resolution imageIn a reduced model with constant aspect-ratio, an increasing major radius increases the resistive time  , the Alfven time
  and the viscous time
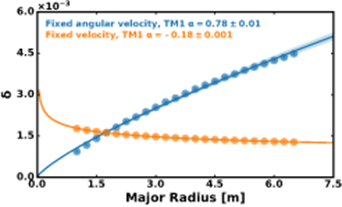
  , all of which affect the dynamics of EF penetration [58]. The catch, of course, is that many other things tend to vary experimentally when machines are built on different scales. One particularly relevant variable we expect to change as the size and shaping change is the intrinsic rotation, which will then impact these low power (low injected torque) scalings. Figure 20 shows that the size scaling is highly dependent on how exactly the rotation scales with machine size, which is currently an active area of study [48]. The TM1 model, using the same set of initial parameters from DIII-D shots 171672 and 173147, shows that the major radius scaling exponent could easily span a large range and even change sign depending on the rotation's size scaling. This span easily encompasses the observed n = 1 scaling and draws into question the large n = 2 R0 exponent.
Figure 20. Resonant n = 2 EF threshold as a pure function of major radius in the TM1 model with corresponding least-squares fit to a single-parameter scaling power law scaling  .
.
Download figure:
Standard image High-resolution image
Of course, the motivation for using 0D variables such as the major radius and normalized pressure was largely the dearth of empirical measurements for rotation profiles in the historically Ohmic and L-mode experiments across these devices. Other experimental factors, such as poorly constrained n = 2 intrinsic EFs could also be influencing the COMPASS results relative to DIII-D and EAST. A thorough investigation into these possible influences will be published by COMPASS in a publication devoted to their distinct empirical scans of both the n = 1 and n = 2 thresholds.
For our purposes, it is most important to consider how this COMPASS data influences the broad scaling and projection to ITER. To answer this, a new scaling was fit without including the COMPASS data and without size scaling (as the two remaining machines are so close in major radius). This regression produced a EF threshold scaling of,
Importantly, the density, toroidal field and normalized pressure scalings all stay fairly similar despite this significant change in the database used in the regression. This implies that the strong COMPASS size scaling does not influence the other parametric dependencies.
5. Conclusions and implications for ITER
The various empirical scalings presented throughout this work and their associated threshold projections to ITER are summarized in table 1. The n = 1 overlap threshold scaling using the present database and fit techniques from section 3 predicts a threshold of roughly 1 × 10⁻⁴ for all the considered ITER scenarios, which is consistent with the order of magnitude experienced in current devices as well as the combination of ITER engineering tolerances and error field correction coils. Limiting the regression to only Ohmic and L-mode data retains a similar prediction for ITER L-mode, and results in an slightly higher H-mode ITER threshold projection of about 3 × 10⁻⁴. A new n = 2 database, containing thresholds measured on three machines in Ohmic and L-mode plasmas, projects an n = 2 threshold nearly 10 times higher in L-mode and roughly 25 times larger when projecting Ohmic and L-mode scalings to ITER H-modes. No H-mode data is available to be included in the n = 2 regression and based on the n = 1 scaling such data would be expected to decrease the projection by changing the sign of the pressure scaling although it is not expected to be a dangerously large effect (factor of 1.5 to 3). The high n = 2 projection is more heavily influenced by the strong machine size dependence seen between the smaller COMPASS and the similarly sized DIII-D and EAST. This size dependence is not consistent with the n = 1 regression or simple analytic scalings and should be investigated further by introducing data from more machines of varying size. The n = 2 thresholds experienced in current devices are of the same order of magnitude as the n = 1 thresholds (although, perhaps a factor of roughly 2 times larger). A regression limited to only the relatively similar DIII-D and EAST machines projects an ITER n = 2 threshold roughly twice that of the n = 1 in L-mode and 5 times the equivalent n = 1 projections to H-modes. These comparable to, but slightly higher than n = 1 thresholds are consistent with experience on machines thus far. The expectations of (low) Connor-Taylor invariant size scaling and the reduced MHD modeling combine to suggest it is judicious to plan for similar n = 1 and n = 2 EF sensitivity in future devices.
Table 1. Power law scaling exponents from regressions on the different databases. Here O refers to the inclusion of Ohmic discharges, L to L-modes, and H to H-modes while -C denotes the exclusion of COMPASS data. Projections are given for 15MA ITER "baseline" (ITERB), H-mode (ITERH) and L-mode (ITERL) scenarios [41–43].
| Database | α10 | αn | αB | αR |  |
 |
 |
 |
|---|---|---|---|---|---|---|---|---|
| n = 1 O,L,H | −3.65 ± 0.03 | +0.58 ± 0.06 | −1.13 ± 0.07 | +0.10 ± 0.07 | −0.20 ± 0.05 | 1.37 ± 0.36 | 1.24 ± 0.33 | 1.26 ± 0.32 |
| n = 1 O,L | −3.49 ± 0.05 | +0.65 ± 0.06 | −1.17 ± 0.07 | +0.17 ± 0.07 | +0.11 ± 0.07 | 2.93 ± 0.69 | 3.18 ± 0.81 | 1.28 ± 0.25 |
| n = 2 O,L | −3.36 ± 0.06 | +1.07 ± 0.09 | −1.52 ± 0.2 | +1.46 ± 0.09 | +0.36 ± 0.11 | 69.62 ± 31.78 | 88.02 ± 44.78 | 12.11 ± 3.41 |
| n = 2 O,L,-C | −2.98 ± 0.05 | +0.93 ± 0.08 | −1.28 ± 0.15 | 0 | +0.41 ± 0.08 | 13.21 ± 4.62 | 17.18 ± 6.74 | 2.32 ± 0.46 |
TM1 model also supports this conclusion. The TM1 code has been used to estimate the ITER n = 1 and n = 2 EF penetration thresholds using DIII-D "ITER Baseline Scenario" discharge profiles scaled to have 1 keV temperature and a density of  at the q = 2 surface combined with the ITER size and toroidal field. Estimating the ITER electric (E × B) precession frequency rotation between 2 − 8 krad/s, the code predicts thresholds spanning
  for n = 1 and
  for n = 2 in ITER. This is consistent with the simple experimental regression projection for n = 1 and consistent with the experience that the n = 2 threshold tends to be on the same order as the n = 1 threshold on current machines.
Our experience and expectations thus suggest that it will be important to measure and correct any unduly large n = 2 EF in ITER. ITER EF assessments have focused on the expected level of n = 1 EF sources and the possible n = 2 EFs have not been scrutinized to the same degree [17, 47]. Although n = 2 distortions of coils are commonly less extreme than n = 1 displacements, Models of ITER's intrinsic EFs based on engineering tolerances and Monte-Carlo should be extended to n = 2 to confirm no sources are expected to be as larger or larger than the (tolerable) n = 1 intrinsic EF. In addition, as-built metrology will be necessary to quantify the true spectral composition of ITER's intrinsic EF and properly tailor the EF correction. Sources such as asymmetries of the poloidal field coils and nearby bus work have been characterized from geometric measurements in existing facilities including NSTX [61], DIII-D [62] and C-Mod [4] while EFs have been measured with in situ magnetic diagnostics in C-Mod [4] and TCV [63] and with special apparatus in DIII-D [62] and MAST [64]. This EF data serves as input to models of vacuum sources, enabling prediction of the optimal overlap minimizing EFC validated by experimental optimization [4, 7, 33, 61, 64]. A similar process should be completed for both n = 1 and n = 2 once the ITER is assembled in order to inform optimized correction of both low n EFs if they exist near dangerous levels.
6. Remaining challenges
The scaling laws presented in this work are the initial step towards a robust and useful constraint on the allowable EF in a tokamak. The regressions used to develop these scaling laws utilize new multi-device databases and are consistent with the primary parametric dependencies historically used within the tokamak community. However, there is more work that must be done beyond the scope of these foundational scalings. Future work in this field should concentrate on three primary tacks: 1) Expansion and improvement of the experimental database, 2) testing and development of additional parametric scalings, and 3) quantifying the impact of EFs that reduce performance in ways other than resonant mode penetration.
The first approach is the most straightforward. As discussed in section 5, the most impactful data that could be added to the existing database would be additional n = 2 data from varied machine sizes. Specifically, the addition of a larger device (e.g. JET) and at least one more much smaller machine (perhaps JTEXT) would go a long way towards constraining the size scaling for the n = 2 threshold. In addition to measurements on new machines, additional n = 2 experiments on the machines already contributing data could be critical as well. H-mode threshold data, for example, would enable a wider parametric scaling and determine if the pressure scaling linking the high and low confinement regimes reverses as in the n = 1 case. In addition, none of the machines in question have constrained the intrinsic n = 2 EF as thoroughly as the intrinsic n = 1 EF [59]. Uncertainties in the intrinsic n = 2 could skew the scalings between machines or even within a single machine using multiple coil configurations (internal and external coils, changes in the phasing between multiple coil sets, or even just different absolute phases of the ramped coil currents). Devoted n = 2 Ohmic and L-mode compass scans like those done for n = 1 would provide useful EFC optimization information to each individual program as well as confidence in the consistency of the multi-machine scale [32, 39].
Of course, more thorough parametric descriptions of the plasmas in the database would also enable more work to be done in this field. One critical scaling in the theory for which there is currently little historical data, for example, is the plasma rotation. However, the toroidal rotation profile can be difficult to measure in machines such as COMPASS or JTEXT (which are important for size scalings). It is also difficult to predict the exact rotation profile of a future machine. Thus, the inclusion of detailed profile information should be avoided in even future multi-machine scalings (although they will continue to be useful in detailed theory validation studies). Instead, regressions including additional global and accessible parameters such as the energy confinement time (τE) could be investigated in the future by obtaining additional data from all the n = 1 and n = 2 database contributors.
Finally, the deleterious effects of edge resonant and non-resonant EFs must be quantified and projected to future devices such as ITER. The premise behind the work presented here is that the surface current required to shield resonant (m = nq) flux in ideal MHD is indicative of the drive for islands at rational surfaces and that the opening of these islands is the largest direct impact of the external fields on the equilibrium. We know, however, that particle and momentum confinement degradation induced by components of the EF with little core coupling can impact performance and stability over relatively long time scales [65]. The higher toroidal mode number EFs can also influence the n = 1 EF threshold though this type of indirect effect [66]. This is most readily parameterized by the neoclassical toroidal viscosity braking observed when applying wide spectrum or non-resonant 3D fields. A similar matrix decomposition technique to determine the dominant torque-inducing spectrum of the EF [29] combined with simple, robustly observed parametric dependencies [67, 68] may one day provide a reduced scaling of the EF braking for EFC optimization.
Continued work on these important impacts of the EF is needed to provide better constraints on the design and construction of future devices. This work provides the foundation for these improvements, providing the first multi-parameter and multi-machine n = 2 core resonant EF threshold scaling. The fact that this threshold is near the n = 1 threshold and that the parametric scalings are comparable to many of the n = 1 experimental and theoretical results reported over the last two decades suggest these n = 2 EFs should not be ignored in ITER and establishes the pressing need for more experiments in this vein.
Acknowledgments
This work was supported by the U.S. Department of Energy Office of Science Office of Fusion Energy Sciences using the DIII-D National Fusion Facility and Alcator C-Mod, both DOE Office of Science user facilities, under Awards DE-FC02-04ER54698, DE-AC02-09CH11466 and DE-FC02-99ER54512. The work was also supported by the National Key R&D Program of China under Grant No. 2017YFE0301100, the Czech Science Foundation (GA CR) under the Grant Number 19-15229S, and by MEYS of CR projects number 8D15001 and LM2015045. The work has been carried out within the framework of the project COMPASS-U: Tokamak for cutting-edge fusion research (No. CZ.02.1.01/0.0/0.0/16_019/0000768) and co-funded from European structural and investment funds. This work has been carried out within the framework of the EUROfusion Consortium and has received funding from the EURATOM research and training program 2014-2018 and 2019-2020 under Grant Agreement No. 633053. The views and opinions expressed herein do not necessarily reflect those of the European Commission
Disclaimer: This report was prepared as an account of work sponsored by an agency of the United States Government. Neither the United States Government nor any agency thereof, nor any of their employees, makes any warranty, express or implied, or assumes any legal liability or responsibility for the accuracy, completeness, or usefulness of any information, apparatus, product, or process disclosed, or represents that its use would not infringe privately owned rights. Reference herein to any specific commercial product, process, or service by trade name, trademark, manufacturer, or otherwise does not necessarily constitute or imply its endorsement, recommendation, or favoring by the United States Government or any agency thereof. The views and opinions of authors expressed herein do not necessarily state or reflect those of the United States Government or any agency thereof.