
Abstract
Magnetized plasma studies are necessary for many applied studies, including laser-driven inertial fusion, modeling astrophysically relevant phenomena, and innovative industrial and medical applications. An interesting method of generating highly magnetized plasma can be based on the interaction of a laser with spiral-shaped cavity (snail-like) targets. A target shaped in this way can represent the central area of a spherical pellet that is not irradiated radially, but rather through an entrance hole allowing the laser beam to almost impact its inner surface tangentially (Pisarczyk et al 2018 Sci. Rep. 8 17 895). In the reported experiment, snail targets of various diameters were irradiated by linearly or circularly polarized radiation of a Prague asterix laser system (PALS) iodine laser delivering ∼500 J, 350 ps and 1.315 μm pulses on targets. Three-frame complex interferometry demonstrated that plasma is generated on the entire inside and outside surfaces of the snail target, starting from the very beginning of the laser–target interaction. The time-resolved records of the magnetic field and the electron density distribution inside and outside the snail target characterize the changes in the structure of the magnetized plasma. Inside the target, the magnetic field survives long after the termination of the laser–matter interaction, namely longer than 10 ns. Compared to a circularly polarized laser pulse, the irradiation of targets with a p-polarized beam increases both the emission of hot electrons (HEs) and the intensity of the magnetic field. The emission of HEs is not isotropic, and their energy distribution cannot be characterized by a single temperature.
Export citation and abstract BibTeX RIS

Original content from this work may be used under the terms of the Creative Commons Attribution 4.0 license. Any further distribution of this work must maintain attribution to the author(s) and the title of the work, journal citation and DOI.
1. Introduction
High energy density physics (HEDP) refers to extreme states of matter with pressures exceeding one million times the atmospheric pressure on the Earth's surface. Such states occur in the fusion plasma of stars and in the cores of planets. In laboratory conditions, similar states can be achieved in plasmas generated by high-power lasers, in which the magnetic fields associated with the plasma production can reach values of up to several hundred Tesla. The investigation of related phenomena not only plays an important role in fundamental studies of HEDP and the modeling of diverse astrophysical situations but, at the same time, opens new approaches in the fields of inertial fusion energy (IFE) implementation and innovative industrial and medical applications. One of the main difficulties met in this research is the generation of sufficiently strong magnetic fields, which are predicted to increase the efficiency of the IFE implosion and fusion ignition but are also capable of producing laboratory data required for the modeling of objects and phenomena in the universe.
The use of pulse generators or permanent magnets is limited by induction values up to a dozen Tesla [1, 2]. A particularly interesting alternative for the production of magnetized plasma streams suitable for various applications are targets with a special capacitor coil target (CCT) [3, 4] and snail target (ST) [5, 6] design, in which the spontaneous magnetic fields are generated by an interaction of the intense laser beam with (i) a capacitor or a disk, in the case of CCT targets, or (ii) a spiral-shaped ribbon for ST targets. Experiments with CCT targets conducted at LULI [3, 7] and GEKKO-XII [4] demonstrated the generation of magnetic fields above 500 T. Much higher magnetic fields reaching tens of kT (hundreds of Megagauss (MGs)) can be obtained using ST targets irradiated in the relativistic intensity domain [5, 6, 8], which opens new horizons for various applications, e.g. in proton–boron fusion [9]. The interaction of a laser beam with an inhomogeneous strongly magnetized plasma is a complex process, since the beam propagation through an ionized medium depends on its linear or circular polarization and, in the latter case, on its clockwise or anticlockwise rotation [10, 11]. The progress in the production of strongly magnetized plasmas facilitates experimental studies of new mechanisms of laser–plasma interaction, such as backscattering and laser propagation in plasmas [12] and the occurrence of a transverse force component of the friction force when a charged projectile moves through the strongly magnetized plasma [13, 14].
However, another interesting regime may be achieved by irradiating the snail targets with laser pulses of moderate intensity. In this situation, considerably more laser energy can be transferred into the target with a longer laser pulse, while the resulting structure of the magnetized plasma seems to be more stable. This was confirmed by recent experimental studies of snail targets using the iodine laser system Prague asterix laser system (PALS) [15] (λ = 1315 nm, t = 350 ps) at intensities of about 1016 W cm−2. The targets were produced from a copper strip (thickness 20 μm, width of 200 μm) shaped into a snail-like spiral with a diameter of 1000 μm. To visualize the process of formation of the magnetized plasma inside the snail target, a two-frame complex interferometry was used. This main diagnostic provided information on the space–time distribution of the magnetic field and the electron density in the formed plasma. The interferometry combined with the electron and ion emission measurements confirmed the creation of a magnetized plasma stream on the axis of the snail target (after termination of the laser pulse interaction with the target) characterized by a theta-pinch-like magnetic field geometry with an induction of about 40 T and an electron density at the level of 1018 cm−3.
This work presents further studies of magnetized plasma creation inside an ST target. The experiment was realized in the regime of moderate intensities by varying the irradiation conditions, namely the laser beam polarization, energy and target design. In analogy to previous studies [15], a comprehensive diagnostic system was used to diagnose the magnetized plasma stream. The process of plasma formation in ST targets was visualized both in the visible (via three-frame complex interferometry) and x-ray range (using a four-frame x-ray camera). Important supplementary information on the electron emission was provided by the 2D resolved imaging of the Cu Kα line emission, by a multi-channel magnetic electron spectrometer, and by return target current measurements. The ion emission was characterized using a system of grid collectors and a Thomson parabolic spectrometer. The reported experiment provides new information on:
- the space–time structure of the magnetic field and electron density in the formed magnetized plasma
- the efficiency of the laser energy conversion into hot electrons (HEs) generated on ST targets, including their energy, temperature and angular distribution.
These characteristics were studied in dependence on the ST target dimensions and as a function of the laser beam polarization. The paper is structured as follows: in section 2, we describe the experimental setup, the target construction and the diagnostic complex used. Section 3 presents the results of the measurements and a discussion. The general conclusions following from the performed studies are presented in section 4.
2. Experimental setup
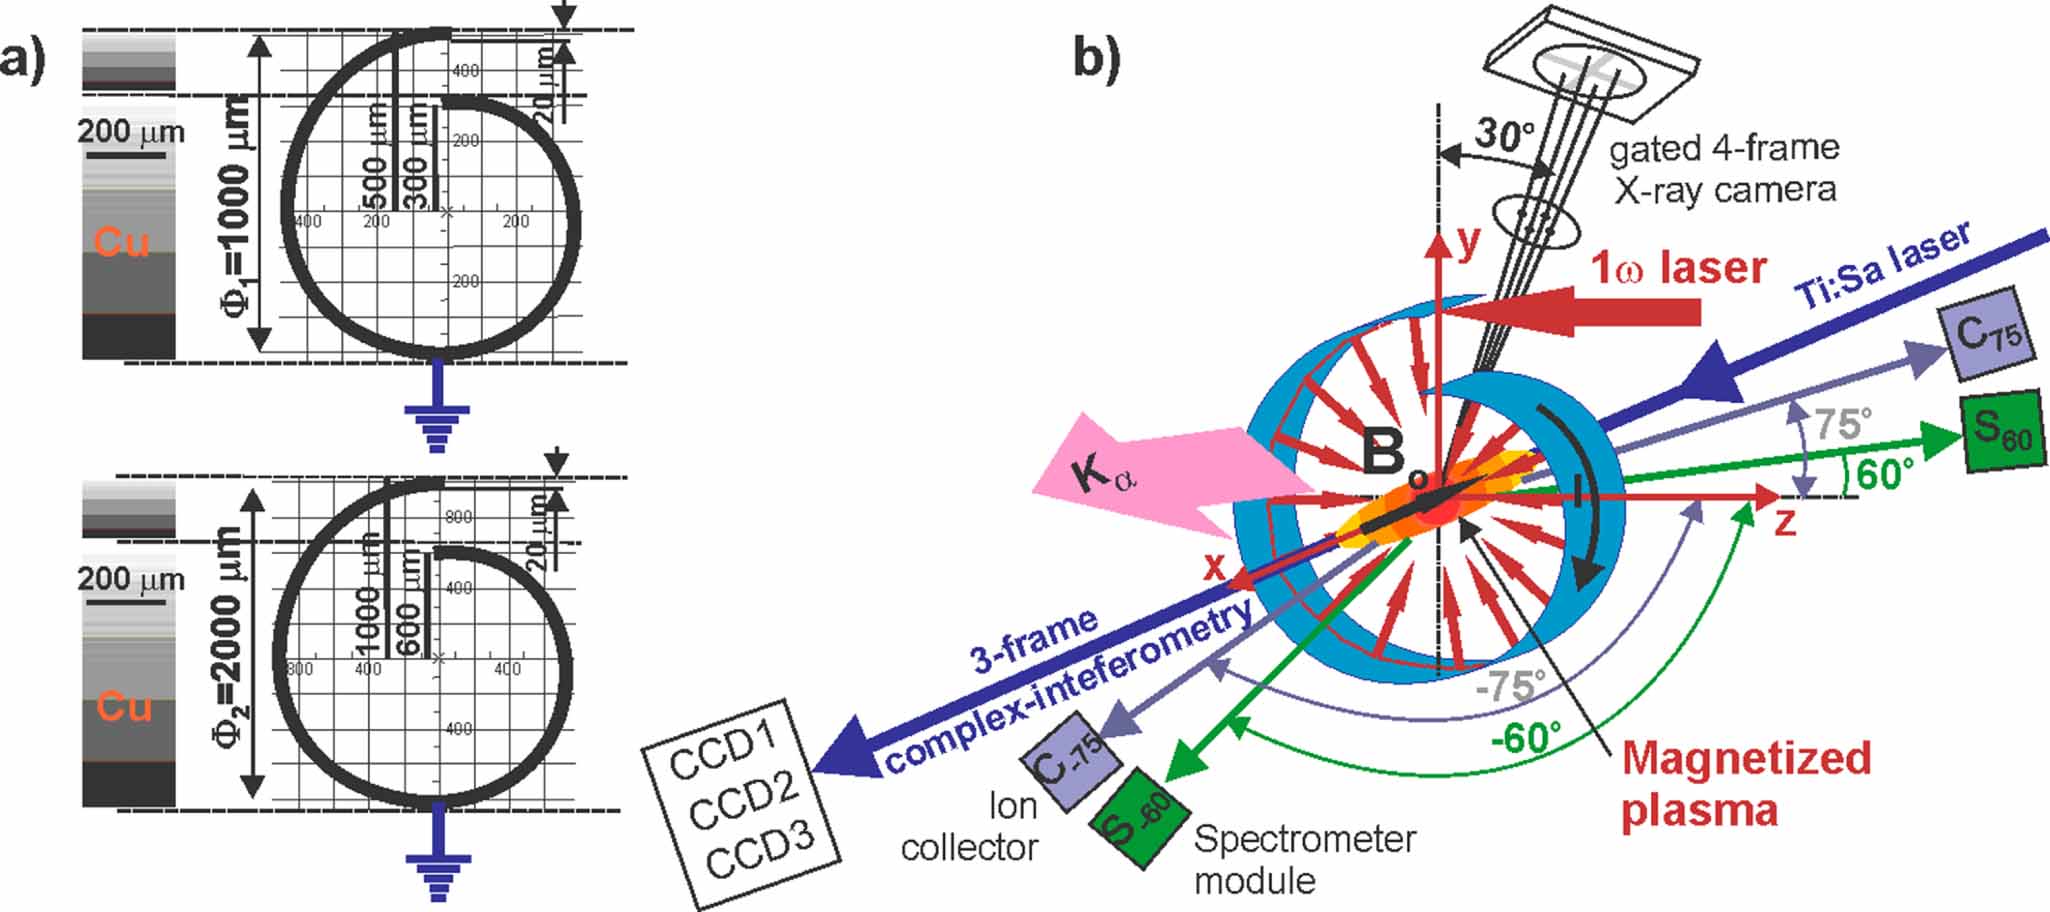
The copper ST targets with diameters of Φ1 = 1000 μm and Φ2 = 2000 μm, see figure 1(a), were manufactured at GSI Darmstadt. They were irradiated by a p- or circularly polarized PALS laser beam with an energy of about 500 J, which was focused to a minimum focal spot radius (rL = 50 μm) corresponding to the random phase plate used.

Figure 1. The design of snail targets (a) and the scheme of their irradiation with a laser beam, including the location of individual diagnostics in the experiment (b). Electron spectrometers and ion collectors are positioned in the horizontal plane symmetrically (left and right) along the laser beam vector.
Download figure:
Standard image High-resolution imageThe implemented diagnostics included
- Three-frame complex interferometry measuring temporal changes in the distribution of the magnetic field and the electron density in the magnetized plasma [16–18],
- A four-frame x-ray pinhole camera for imaging the magnetized plasma stream forming in ST targets covering the range of soft x-rays with energy from 10 to 10 000 eV [19],
- 2D resolved imaging of the Cu Kα line emission to visualize the process of HE interaction with the target in the x-ray range, to map the distribution of their energy deposited along the target surface, and to evaluate the conversion of the laser radiation into energy of HEs [15],
- A multi-channel magnetic electron spectrometer for recording angular distributions of HE energy and temperature, the anisotropy of which provides an important criterion for assessing the effectiveness of forming magnetized plasma with an axial magnetic field [20],
- Inductive probe measurements of the return current neutralizing a positive charge on the target due to HEs escaped from the plasma [21],
- Several Faraday cups and a parabolic Thomson spectrometer for measuring the angular distribution of the ion emission, which in correlation with the electron emission data constitutes an additional criterion confirming the formation of the magnetized plasma in the ST target center [22].
A schematic diagram of the ST target irradiation as well as the location of the implemented diagnostics are shown in figure 1(b).
3. Results and discussion of comprehensive investigation of ST targets
3.1. Complex interferometry results
The principal diagnostic data were collected with a three-frame polar interferometer [16]. This system consists of three independent tracks operating in the complex interferometry regime [17]. The recorded interferogram fringes relate to the electron density, while their intensity modulation corresponds to the Faraday effect in the magnetized plasma stream created on the ST targets. To obtain the temporally resolved information on the plasma formation inside the laser-irradiated snail, three frames separated by a time interval of 300 ps were recorded in each shot. The delay between the first frame and the maximum of the laser intensity varied from −1000 ps to a few or even a dozen ns. To provide identical irradiation conditions for all snail targets, they were reproducibly illuminated as shown in figure 2(a), frame 1. The laser beam was incident on the inner target surface about 120 μm below the entrance edge of the snail. The random alignment errors did not exceed 50 μm deviation from the desired focal position. The supporting stems visible in the lower parts of the frames did not considerably affect the process of magnetized plasma formation in the target. This indicates that this process is governed by local discharges inside the interaction region. To check the laser–target configuration, a sequence of reference interferograms was recorded before each shot. This procedure is necessary to justify the methodology of quantitative analysis of interferograms used to get information on the distribution of the electron density and magnetic field inside the created plasma.
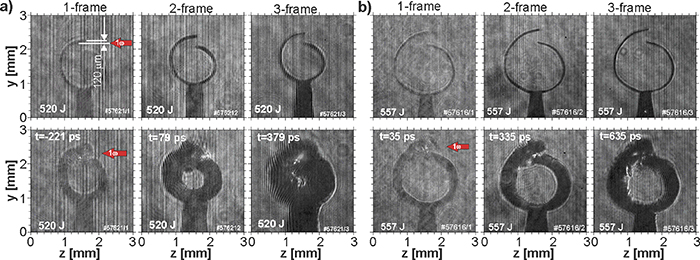
Figure 2. Three-frame sequences of the reference and plasma-affected complex interferograms illustrating the formation of magnetized plasma inside the ST target with different diameters: (a) Φ1 = 1000 µm and (b) Φ2 = 2000 µm. The targets were irradiated by a linearly polarized 1ω beam of the PALS iodine laser with an energy of about 500 J.
Download figure:
Standard image High-resolution imageFigure 2 presents the three-frame sequences of complex interferograms illustrating the radial implosion of the plasma created on the inner surfaces of two snail targets with different diameters. These targets were irradiated by a p-polarized beam with an energy of about 500 J. The laser focus spot was located in the ST target opening; see figure 1. The comparison of both recorded sequences indicates that the process of plasma implosion in targets with a smaller diameter starts much earlier compared to that observed in the larger diameter targets. It precedes by several hundred ps the maximum intensity of the laser pulse, see figure 2(a), recorded at time t = −221 ps, and the well-formed plasma in the center of the snail is visible at t = 79 ps, i.e. already during the laser pulse duration. On the other hand, in targets with a diameter of 2000 μm, the process of plasma creation starts only after the maximum of the laser pulse intensity, as shown in figure 2(b). Obviously, the smaller curvature of larger diameter targets results in larger spots of the focused beam and hence in decreased laser intensities producing the plasma.
The delayed plasma production inside the larger snail target compared to the smaller one can tentatively be attributed to a weaker contribution of HEs and soft x-rays produced within the laser–snail interaction and to the gradual ablation of the inner target surface due to their rarefaction over a longer flight distance. At the same time, the effect of the laser radiation scattered by the plasma should be considered.
To illustrate the plasma flux formation in more detail, several time sequences of interferograms recorded at both types of targets are combined in figure 3. Compared to figure 2, they cover a much longer evolution of the process investigated. These extended sequences confirm the much faster process of the magnetized plasma formation in ST targets with a diameter of 1000 μm. As shown in figure 3(a), the plasma created at the surface of the snail implodes radially toward the target center already during the laser pulse, thus increasing the electron density, which becomes more opaque for the radiation of the diagnostic laser. The complex interferograms display the amplitude modulation of the interference fringes due to the Faraday effect affecting the diagnostic beam. The magnetic field force lines formed in the plasma are parallel to the 'x' axis, as explained by the geometry of the experiment depicted in figure 1(b). However, the structure of the interference fringes is too unclear to obtain reliable quantitative information on the electron density and magnetic field distributions via the amplitude–phase analysis of the complex interferogram. In the case of targets with a larger diameter, the sequence of complex interferograms recorded at an expansion time of about t = 1 ns demonstrates the formation of a characteristic (quasi-static) stable plasma configuration with a current structure in the form of 'jets' [23] propagating toward the center of the target. This is particularly visible at later times, even a dozen ns after the maximum of the laser pulse (see t = 13.3 ns). The persistence of this structure in the very late stages of expansion may be caused by freezing of the magnetic field in the formed plasma due to strong magnetization of the stream, in accordance with the ST target operational concept presented in [5, 6]. The structure of the interference fringes turns out to be readable enough to obtain quantitative information on the magnetic field distribution and electron density for selected interferogram sequences. Consequently, quantitative analyses of complex interferograms regarding the effect of the laser beam polarization on the formation of plasma streams in ST targets were limited to selected interferogram sequences recorded on larger diameter targets.
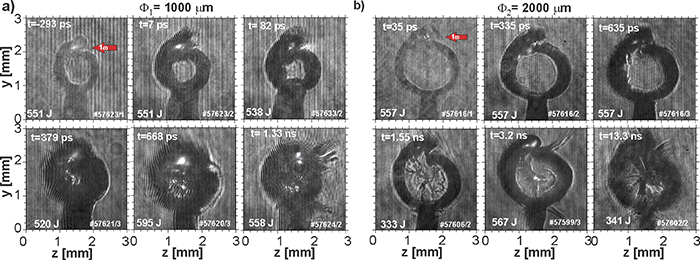
Figure 3. A time sequence of complex interferograms compiled from a series of three-frame records showing the evolution of the magnetized plasma inside the snails: (a) with a diameter of Φ1 = 1000 µm during and after the laser–target interaction from −293 ps to 1.33 ns; (b) with a diameter of Φ2 = 2000 µm for the time period from 35 ps to 13.3 ns. The targets were irradiated by a linearly polarized laser beam with an energy of about 500 J.
Download figure:
Standard image High-resolution imageThe three-frame sequences of complex interferograms comparing the plasma stream forming in ST targets with a diameter of Φ1 = 1000 μm irradiated by a laser beam with linear and circular polarization are shown in figures 4(a), and (b) presents analogous results collected on ST targets with a diameter of Φ2 = 2000 μm. In the case of smaller diameter targets, the comparison of interferograms recorded at very similar expansion times indicates that the qualitative differences in the distribution of interference fringes observed at different beam polarizations cannot provide unambiguous data capable of formulating conclusions regarding the polarization effect. Moreover, the illegibility of the fringes prohibits the full amplitude–phase analysis of complex interferograms [10] to obtain information about the magnetic field and the electron density distribution in the formed plasma structure.

Figure 4. Comparison of the magnetized plasma stream formation in ST targets with a diameter of (a) Φ1 = 1000 µm and (b) Φ2 = 2000 µm in targets irradiated by a laser beam with linear and circular polarization.
Download figure:
Standard image High-resolution imageAt larger diameter targets, see figure 4(b), the qualitative differences in complex interferograms due to the plasma formation processes observed at different polarizations of the laser beam are also difficult to assess. However, in contrast to interferograms obtained at smaller diameter targets, the structure of the interference fringes is sufficiently clear (although very complex) to obtain information on the distribution of the magnetic field and the electron density. To extract the desired data, the methodology used in the paper [15] was modified. A strong disturbance of the Fourier spectrum by the snail target and the holder construction complicates the mapping of the phase distribution in the inner and outer areas of the ST target. The reconstruction of the interferogram was therefore based on the maximum fringe method, and the software for amplitude analysis of complex interferograms was modified to obtain reliable information on the distribution of the angle of rotation of the polarization plane. This method of quantitative analysis of complex interferograms is schematically depicted in figure 5.
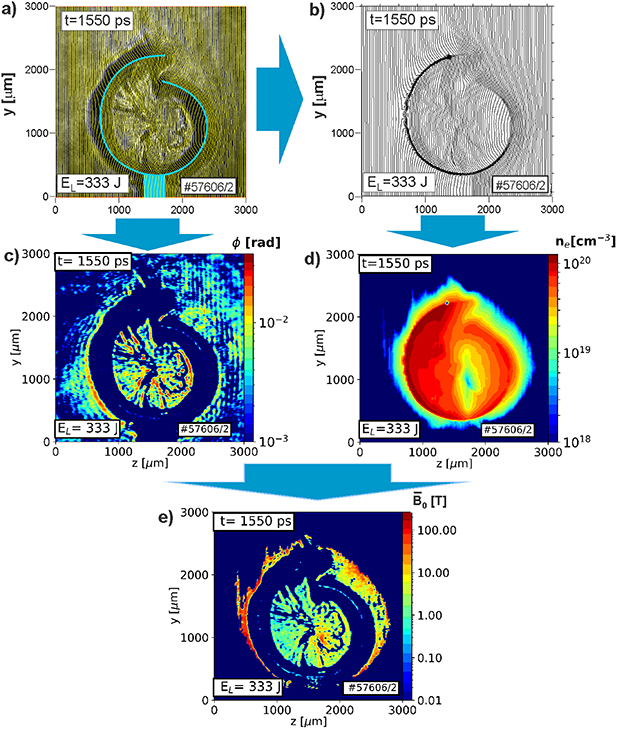
Figure 5. A schematic of quantitative analysis of complex interferograms providing information on the distribution of the electron density and the magnetic field in ST targets: (a) reconstruction of the interferogram using the maximum fringe method, (b) reconstructed interferogram, (c) rotation angle of the polarization plane following from the amplitude analysis of the complex interferogram, (d) distribution of the average electron density, and (e) average magnetic field distribution.
Download figure:
Standard image High-resolution imageThe first step of the analysis consists of the reconstruction of the fringe distribution using the maximum fringe method, which provides the phase distribution, and the amplitude analysis of the Fourier spectrum of the interferogram, providing the distribution of the rotation angle of the polarization plane. According to the geometry of the optical probing, distribution of the electron density and magnetic field in the (y, z) plane normal to the probing direction has been calculated from the average phase, the Faraday rotation data, and assuming a plasma probing length along the x-direction given by the formula [15]

where  and
and  are distributions of the average electron density and the magnetic field, respectively, and lx
is the characteristic length of the plasma. Calculations were performed for lx =400 μm, an average value estimated from the x-ray streak camera measurements.
are distributions of the average electron density and the magnetic field, respectively, and lx
is the characteristic length of the plasma. Calculations were performed for lx =400 μm, an average value estimated from the x-ray streak camera measurements.
Figure 6 relates to the complex interferograms shown in figure 4(b). Individual frames compare distributions of the average electron density and the average magnetic field at various expansion times of the magnetized plasma stream formation in ST targets with diameters of 2000 µm irradiated by a linearly and circularly polarized laser beam.
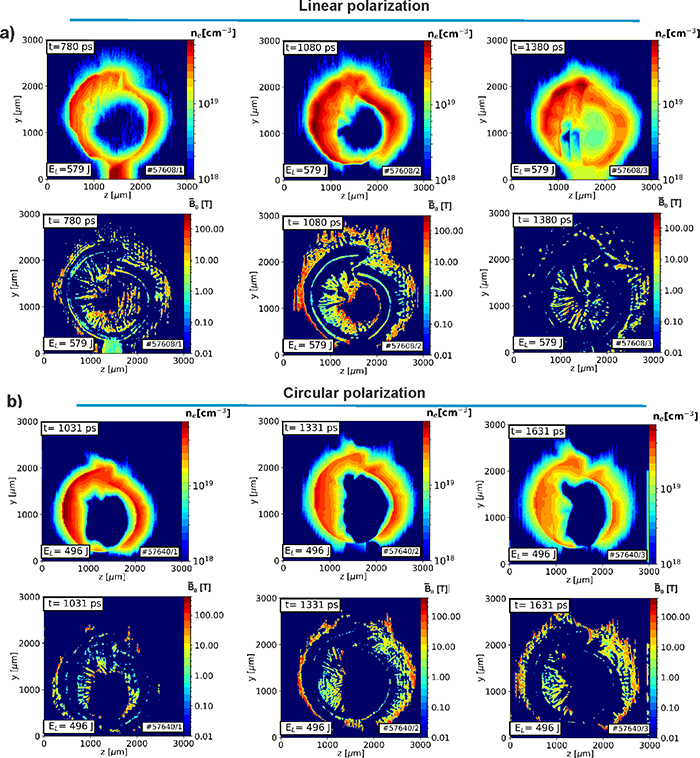
Figure 6. Temporal sequences of the average electron density and the average magnetic field distribution illustrate the formation of magnetized plasma in snail targets with a diameter of 2000 µm irradiated by a laser beam with (a) linear and (b) circular polarization.
Download figure:
Standard image High-resolution imageIn order to assess more reliably the influence of the laser beam polarization on the process of magnetized plasma formation, we considered plasma with an electron concentration above 1018 cm−3. For both types of polarization, a similar structure of the average electron density and the magnetic field distribution is observed (figure 6). In the first phase, the radially imploding plasma develops instabilities in the form of current 'jets' propagating toward the center of the target (see above and [23]). The currents inside the plasma propagating to the center of the target have clockwise-directed (effect of anticlockwise movement of electrons) components [5, 6] parallel to the surface of the snail. These observed currents increase the magnetic field in the center of the target and reduce the field in the denser plasma closer to the target surface. The effect of polarization is clearly visible in the distributions of the electron density and the magnetic field and, at the same time, it affects the effectiveness of the radial implosion of the plasma created at the snail surface. In the case of a target irradiated with a linearly polarized laser beam, the radially imploding plasma characterized by an electron density larger than 1018 cm−3 and by magnetic field induction up to 50 T reaches the center of the snail target. In contrast, when using a circularly polarized beam, the radial range of the plasma with a magnetic field of similar induction is clearly smaller. Moreover, for circular polarization, the structure and induction of the magnetic field inside the target are preserved longer. This may be explained by different scales of the plasma formation and expansion in dependence on the laser polarization. The hypothesis of the influence of the laser beam polarization on the plasma formation process has been confirmed by complementary measurements performed using the diagnostic complex described in section 2. The obtained results will be discussed in the next section of this paper.
Figure 6 shows distinctly that magnetic fields spreading outside the snail are also observed. The field structure close to the front edge of the snail target (top left part of individual frames) relates to the presence of the return discharge current as opposed to the current inside a snail (anticlockwise), which dominates in the outer side of the snail [5]. As presented further in figure 10, the time of observation of this field agrees well with the maximum of the measured return current, which confirms the above presented analysis. The temporal profiles of the return current and the discussed magnetic field are also interlinked. For linear polarization, the extent of the magnetic field is larger, the field is slightly stronger at its maximum (which can be correlated with the stronger return current seen in figure 10(b)), and is preserved for a shorter time (see faster decrease of return current in figure 10(b)) than in the case of circular polarization. The field structure observed outside the snail close to its rear edge (top right part of the figures) corresponds to the plasma expansion from the outside surface of the snail edge (see figure 6).The plasma expansion bears on irradiation of the outside snail surface by the laser pulse rim or by the radiation reflected from the plasma expanded from the nearby inside layer of the snail beginning (see figure 8(a)).
3.2. Results of spectroscopic diagnostics
The generation of HEs and the conversion efficiency of the laser radiation into HEs were measured via the quasi-monochromatic imaging of the Cu Kα1 x-ray emission induced in cold or moderately heated Cu targets. Consequently, this diagnostic refers to HE with energy above the Cu K-edge ionization limit (i.e. above 8979 eV). The imager design combines the diffraction of x-ray radiation from a crystal of quartz (422) spherically bent to a radius of 380 mm with the time-integrated x-ray detection using absolutely calibrated Fuji BAS MS and SR imaging plates (IPs) the sensitivity of which differ due to a slightly different composition of sensitive layers. The 2D-resolved magnified (M = 1.73) images of the HE-induced Cu Kα1 emission from the snail target surfaces were observed at an angle of 72.8° from the laser axis. The distortion of images due to the inclined target observation was taken into account within the reconstruction procedure; see details described in paper [15]. The signal distribution of the exposed IP was mapped using the Amersham Typhoon scanner with a pixel size of 25 × 25 μm2. The transfer function of the system was determined using the ray-tracing algorithm [24]. Recorded signals were recalculated to the number of Cu Kα1 photons emitted from the target assuming isotropic x-ray emission and taking into account the crystal reflectivity and transmission through protective filters. The Monte Carlo code GEANT4 [25] was used to model the HE energy deposition into the target material and subsequent production of Kα radiation as a function of the HE energy, dose, and observation angle of x-ray emission.
The results of measurements performed with the four-frame x-ray pinhole camera and the Cu Kα imager are presented in figures 7 and 8. They provide complementary information on the effect of the laser beam polarization on the parameters of the formed plasma and the emission of HEs.
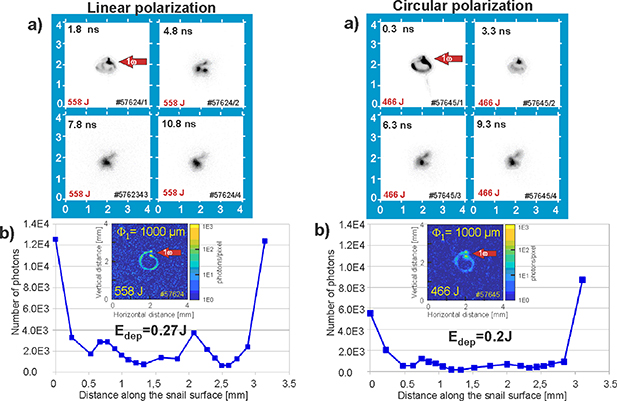
Figure 7. Time-resolved measurements performed with the four-frame x-ray camera (a) and the time-integrated Cu Kα imager (b) provide information on the plasma evolution and HE production at snail targets with a diameter of 1000 µm irradiated by a linearly and circularly polarized laser beam.
Download figure:
Standard image High-resolution image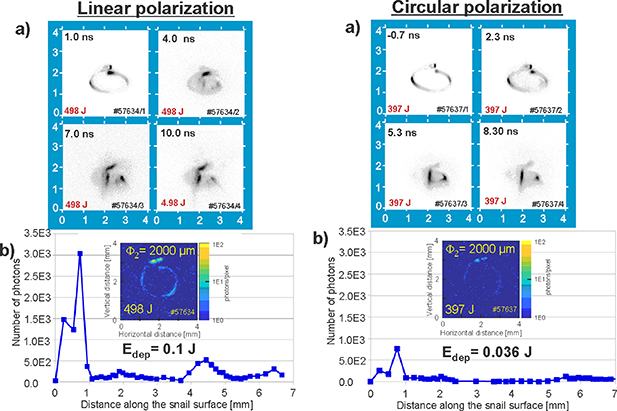
Figure 8. Images characterizing the plasma evolution (a) and HE-induced Cu Kα emission (b) from snail targets with a diameter of 2000 µm irradiated by a linearly and circularly polarized laser beam.
Download figure:
Standard image High-resolution imageAs observed from the comparison of images recorded with the four-frame x-ray camera at different polarizations of the laser beam (figure 7(a)), the final stage of the target irradiation process is in both cases the dense plasma region created in the center of the ST target. The effect of the polarization on the configuration of the plasma formed in a target of the same diameter is difficult to qualitatively assess and does not seem to depend significantly on the laser beam polarization. Clear differences resulting from the target irradiation with a linearly or circularly polarized laser beam are visible in the Cu Kα emission images shown in figure 7(b). Irradiation of the target with a linearly polarized laser beam distinctly increases the emission of photons emitted under the action of HEs propagating along the surface of the target. The calculated HE energy deposited both in the first 'spot' (corresponding to the focusing of the laser beam on the target) and along the entire target surface is considerably larger compared to the energy deposited under the target irradiation by the circularly polarized beam.
For shot #57624 (shown in figure 7(b)), the energy of the HEs deposited along the entire snail surface equals tabout 0.27 J, while the energy corresponding to the first spot is smaller by more than an order of magnitude.
In the case of larger diameter ST targets, the influence of the laser beam polarization on the Cu Kα emission is again confirmed by the increased energy of HEs deposited along the surface of targets irradiated by the linearly polarized laser beam; see figure 8(b). The absolute values of the HE energy deposited by HEs are clearly smaller compared to targets with a diameter of 1000 μm.
For shot #57634 (shown in figure 8(b)), the HE energy deposited along the surface of the target is about 0.1 J, i.e. more than two times smaller than that observed in shot #57624 (see figure 7(b)), corresponding to a target with a diameter of 1000 μm. Figure 8(a) indicates that for larger diameter targets, the shape of the formed plasma also appears to be independent of the laser beam polarization, but it differs considerably from the shape of the plasma formed at 1000 µm diameter targets. In the case of a snail with a larger diameter, figure 8(a), the soft x-ray images show that the implosion occurs in several spots inside the target instead of in its center, as observed at targets with a diameter of 1000 µm. This observation is confirmed by the distribution of the electron density and the magnetic field in the late expansion phases shown in figure 6.
A more detailed comparison demonstrating the effect of the laser beam polarization on the Cu Kα emission from ST targets with different diameters is presented in the graphs shown in figure 9. Figure 9(a) depicts a comparison of the total number of emitted photons and the related conversion efficiency of the laser radiation into HE energy for targets with a diameter of 1000 µm irradiated by beams with different polarizations, while figure 9(b) shows a similar comparison for larger diameter targets. Obviously, the photon emission from targets irradiated by a linearly polarized laser beam is significantly larger and increases with the laser energy. The conversion efficiency found for targets with a diameter of 1000 µm reaches about 0.1% for the linearly polarized beam (figure 9(a) (ii)), which is larger by a factor of approximately 3 compared to that measured at targets with a diameter of 2000 µm (figure 9(b) (ii)).
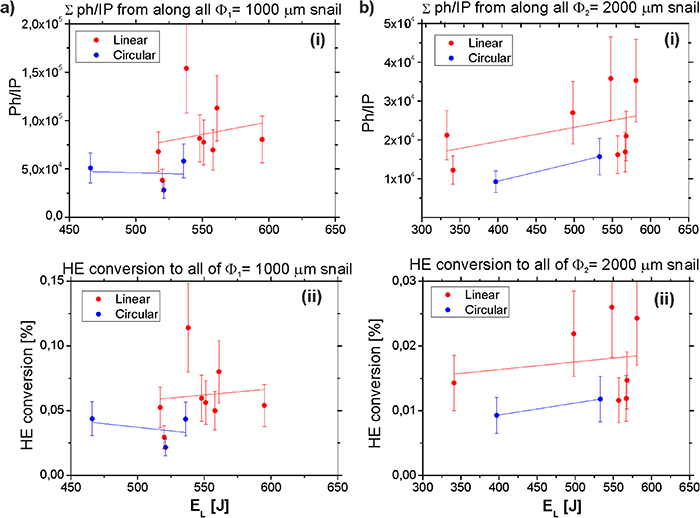
Figure 9. Comparison of (i) the total number of emitted Cu Kα photons and (ii) the conversion efficiency of the laser radiation into HE energy along the full length of the inner snail surface for targets with a diameter of (a) Φ1 = 1000 µm and (b) Φ2 = 2000 µm irradiated by laser beams with different polarization and energy.
Download figure:
Standard image High-resolution imageObviously, the differences in the generation of HEs escaping from the plasma correlate with the diverse polarization of the laser beam irradiating the target. Additionally, this effect increases as the diameter of the snail target decreases.
Important differences in the effect of laser beam polarization on the process of plasma formation inside the target are also manifested in the time evolution of the target return current, which flows from the ground to the target and balances the positive charge generated on the target due to the leakage of electrons from the plasma, as shown in figure 10. In the case of linear polarization of the laser beam, the width of the dominant peak at half amplitude is comparable to the width of the laser pulse, with an insignificant influence of the diameter of the snail target. Irradiation of the target with a circularly polarized beam, however, significantly changes the time profile of the return target current, the peak of which is approximately twice as wide. This change in the target current indicates that many HEs escape from the plasma long after the interaction.
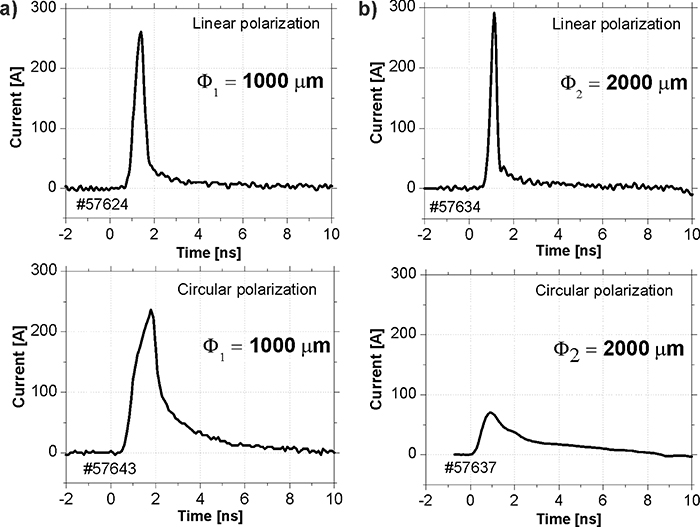
Figure 10. Temporal profiles of the return target current measured with the current probe on snail targets with diameters of (a) Φ1 = 1000 µm and (b) Φ2 = 2000 µm irradiated by differently polarized laser beams.
Download figure:
Standard image High-resolution imageThe extension of the target current duration observed for a circularly polarized laser beam and its dependence on the target diameter suggest a reduction in the dynamics of the plasma formation. This, in turn, leads to a distinct alteration in the process of magnetized plasma formation, as proved by the complex interferometry, by the decreased emission of HEs deduced from Cu Kα emission measurements, and by time-resolved x-ray imaging.
The positive effect of linear laser beam polarization on HE emission from ST targets with different diameters is also seen in the measurements of the electron energy distribution by the multi-channel electron spectrometer. To measure the angular distribution of HE emission characteristics, seven spectrometers were placed in an angular array on the horizontal plane around the target at angles −68°, −30°, −21°, 21°, 30°, 41° and 52° from the target normal. Each electron spectrometer covered the energy range from 50 keV to 1.5 MeV. The HE flux was obtained by integrating the energy distribution. The characteristic temperature of HEs was obtained by using the exponential function fit. The maximum energy of HEs detected was inferred from the point where the energy distribution function is above the noise level. The results of this quantitative analysis providing information about the angular distribution of the number of emitted electrons, their energy and temperature for snail targets with different diameters irradiated by linearly and circularly polarized laser beams are presented in figures 11 and 12.
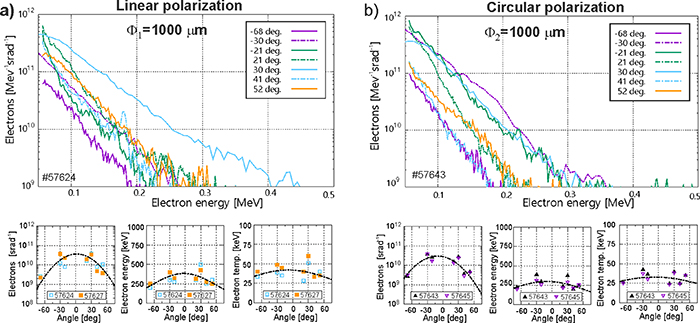
Figure 11. Comparison of the angularly dependent electron energy spectra and emission parameters measured at targets with a diameter of 1000 μm irradiated by a laser beam with an energy of about 500 J polarized (a) linearly and (b) circularly.
Download figure:
Standard image High-resolution image
Figure 12. Comparison of the angular dependent electron energy spectra and emission parameters obtained when irradiating targets with a diameter of 2000 μm by 1ω iodine laser beam with an energy of about 500 J polarized (a) linearly and (b) circularly.
Download figure:
Standard image High-resolution imageFigure 11 depicts the angular distribution of the electron energy spectra and emission parameters obtained at targets with a diameter of 1000 μm by the 1ω iodine laser beam with linear and circular polarization, while in figure 12, the analogous electron emission characteristics corresponding to the target with a diameter of 2000 µm are presented.
The shown dependencies clearly demonstrate the influence of the laser beam polarization on the above-mentioned parameters of the electron emission from snail targets with different diameters. In the case of linear polarization, the electron energy and temperature values are definitely higher compared to those measured at circular polarization, but the angular distributions of the number of electrons emitted per unit solid angle, energy and temperature remain unchanged. A characteristic feature of these distributions is their flattened character, which confirms that when compared with the electron emission from flat foil targets, the emission of electrons from snail targets is stronger in the direction perpendicular to the plane of the target [8, 9]. This flattened distribution character also proves that the formed configuration of the magnetized plasma has a symmetry similar to that of the theta-pinch system, with the axial magnetic field perpendicular to the plane of the snail target.
The electron energy distributions observed at the smaller 1000 µm snail target show that they can be well characterized by the Maxwellian distribution, see figure 11, while the energy spectra observed at 2000 µm targets have a peaked structure in some directions, which indicates a two-temperature distribution. This could be due to the larger volume of the plasma, which does not allow the complete thermalization of the HEs at a given laser intensity.
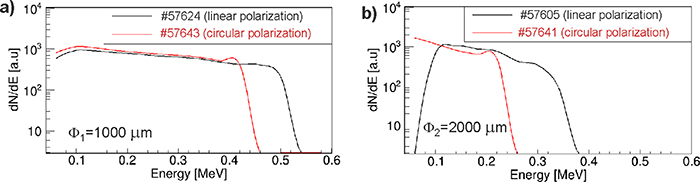
The effect of the laser beam polarization on the characteristics of ST targets with different diameters was also registered in the measurements of the proton emission by means of a parabolic Thomson spectrometer positioned at an angle of 30° in relation to the target normal.
The maximum and average energies of accelerated protons (figures 13(a) and (b)) agree well with the characteristics presented for electrons in figures 11 and 12. Both values exhibit the same dependency on the applied laser pulse polarization for either snail size—the average and maximum energies of measured protons are higher in the case of linearly polarized pulses compared to circularly polarized ones. Moreover, the collected data show the dependency of the maximum and average proton energies on the size of the snail target—both are nearly doubled for ST with Φ1 = 1000 μm compared to ST with Φ2 = 2000 mm. The average energy of the proton bunch was taken as the mean value of the histogram created from the visible registered part of the parabola—protons of the lowest energy were deflected outside the detection area and information about their energies could not be retrieved. Using the calculated average energies of accelerated protons and the relation  , the ion temperature can be derived. For ST with the diameter of Φ1 = 1000 μm, the ion temperature is equal to
  and
and  for a linearly and circularly polarized laser pulse, respectively. In the case of Φ2 = 2000 μm ST, the calculated ion temperatures are
  for linear polarization and
  for circular polarization laser pulses.
Figure 13. Proton spectra obtained by irradiating snail targets with diameters (a) Φ1 = 1000 μm and (b) Φ2 = 2000 μm by laser radiation with the linear and circular polarization.
Download figure:
Standard image High-resolution image
The main alternative mechanisms of HE generation include resonant absorption [26–28] as well as parametric plasma instabilities; in particular, two-plasmon decay and stimulated Raman scattering [28]. The previous experiments performed with the PALS laser show that for this facility, resonant absorption is a dominant mechanism for HE generation [27] coexisting with other nonlinear processes, such as stimulated Raman scattering and two-parameter instabilities. The resonant absorption appears near the critical density of the plasma where the resonant field accelerating electrons occur. This phenomenon depends on many factors, such as the angle of incidence of the laser beam, its wavelength and its intensity. The resonant field can be described by the formula [27]
where  is the electric field amplitude of the incident wave,
  is the resonant function depending on the angle of incidence of the laser beam,
  is the wave number, L is the size of the plasma inhomogeneities toward the density gradient and
  ,
,  . We note that the above-mentioned resonant absorption occurs only for p-polarized laser pulses. The circularly polarized laser beam can be represented by the superposition of two linearly polarized (s-type and p-type) waves with the field amplitudes by a factor of
  smaller than the wave amplitude of the linearly polarized pulse. Only one of these two waves (p-polarized) carrying half of the laser pulse energy is in part resonantly absorbed, while in the case of the linearly polarized pulse the whole laser energy is relevant (the laser pulse is p-polarized). Consequently, in the case of a linearly polarized laser pulse, the resonant field response for HE acceleration is by a factor of
  higher than for a linearly polarized pulse. This fact explains the observed higher energies of HEs and enhanced x-ray and Cu Kα line emission. The resonant absorption is accompanied by the generation of electron plasma waves that propagate into the target, and the energy carried out by this wave depends on the size of the resonant field. Additionally, the significant part of the generated HEs is reflected from the plasma border by the plasma potential back to the target and also generates electron plasma waves [16, 27]. Finally, the HEs and ions create on the plasma edge a double layer with a potential jump [16]. The maximum electric field in this double layer increases with the increased energy of the HEs (
 , where
  is the characteristic HE energy and rD is the Debye length). To conclude, higher values of resonant field corresponding to linearly polarized laser pulses lead to higher energies of generated plasma waves and of electric fields generated by HEs in the double layer at the plasma edge. Both the energy of the plasma waves (due to dumping) and the electric field at the edge of the plasma are transferred to the ions and contribute to the observed higher energy of protons that originates from contaminants adsorbed at the target surface.
4. Conclusions
The presented experimental study proved the possibility of generating highly magnetized plasma inside a snail target at moderate laser intensities. The analysis of data collected using complex interferometry indicates that when irradiating targets with a diameter of 2 mm, the intensity of the magnetic field can reach 100 T. Unlike a circularly polarized laser beam, a p-polarized beam produces a stronger, highly magnetized plasma, which is an intense source of HEs, bremsstrahlung and ions. The observed high temperature and maximum energy of HEs results from the combined effects of resonant absorption and nonlinear processes, such as stimulated Raman scattering and two-parameter instabilities, which cease to be effective in the case of circular polarization and a larger target diameter. In the case of larger diameter snail targets, the radial plasma implosion process starts much later, after the maximum intensity of the laser pulse, and results in the formation of a characteristic (filamentous) stable current structure, which is observed up to 10 ns after the laser pulse termination. The main mechanism affecting the formation of the magnetic field cannot be associated only with the duration of the laser pulse, but with other processes driven by the energy accumulated in the plasma during interaction with the laser.
The presented studies of magnetized plasma are important from the point of view of many applied studies, including laser-driven inertial fusion, modeling astrophysically relevant phenomena, and innovative industrial and medical applications.
Acknowledgments
This scientific paper has been published as a part of an international project called 'PMW', co-financed by the Polish Ministry of Science and Higher Education within the framework of the scientific financial resources for 2021–2022 under Contract No. 5084/PALS/2020/0 (Project No. PALS002628).
This research was partially supported by the Access to the PALS RI under the EU LASERLAB IV (Grant Agreement No. 654148) project; by the Ministry of Youth and Sports of the Czech Republic (Project Nos. LM2015083 and LM2018114 (PALS RI), LTT17015) and by the Czech Science Foundation (Grant No. 19-24619S).
This scientific paper has been published as part of an international project co-financed by the Polish Ministry of Science and Higher Education within the programme called 'PMW' for 2022 under Contract No. 5246/HEU-Euratom/2022/2. The work was carried out within the framework of the EUROfusion Consortium, funded by the European Union via the Euratom Research and Training Programme (Grant Agreement No. 101052200—EUROfusion). The views and opinions expressed are however those of the author(s) only, and do not necessarily reflect those of the European Union or the European Commission. Neither the European Union nor the European Commission can be held responsible for them.
This work was partially supported by the IMPULSE Project and has thus received funding from the European Union's Horizon 2020 research and innovation program under Grant Agreement No. 871161.
Data availability statement
The data that support the findings of this study are available upon reasonable request from the authors.