

Abstract
Low density foams are widely used for laser plasma interaction studies. Here, we present the results of first direct measurements of a residual level of inhomogeneity of a foam plasma by using a pump-probe technique. It is demonstrated that large scale density modulations in such a plasma can survive a time larger than 1 ns, much longer than the plasma formation time.
Export citation and abstract BibTeX RIS
1. Introduction
Plasmas created by laser ionization of low density foams have attractive properties for various applications such as accumulation of high density of thermal energy [1], smoothing of laser intensity modulations [2–4], formation of strong shock waves, equation of state measurements [5] and creation of bright x-ray sources [6–8]. Techniques of foam fabrication have been significantly improved and one can produce now foams of various materials with density varying from a few mg/cc to a few hundred mg/cc and with micron size pores [9]. Such foams can be efficiently ionized with intense laser pulses [10] if their average density is lower than the electron critical density (sub-critical foams) or by laser-driven x-ray flashes [2, 11] for super-critical foams. As the foam structure adds specific features to the interaction, special attention is paid to keep the pores open and the cross-section of the structural elements similar on the average at all densities. Thus, these foams may be classified as quasi-periodic networks.
Laser or x-ray radiation creates an ionization wave in a foam which propagates with a supersonic velocity and leaves behind the ionization front a quasi-homogeneous plasma [12]. Energy deposited to the foam solid elements by radiation or electron thermal conductivity in the ionization front results in their fast expansion. It is supposed that a homogeneous plasma is created when expanding solid elements overlap, mix up and their kinetic energy is transformed into a plasma internal energy. A homogenization time depends on laser intensity and pore size. In typical experimental conditions it is about 30–50 ps corresponding to the ionization front thickness of 30–50 μm [12–15]. Penetration of low intensity rising part of laser pulse through initially transparent foam, foam preheat and laser transmission through foam layers were studied experimentally [16, 17].
A foam homogenization time has never been measured, moreover, fast mixing smooths out only small-scale inhomogeneities on the order of the pore size. Larger scale inhomogeneities may persist much longer time and manifest themselves as ion acoustic waves. It is important to know the foam homogenization time for such foam applications as laser beam smoothing, studies of parametric instabilities and equation of state measurements. However, it is difficult to simulate a long-term foam homogeneization with hydrodynamic codes, since it is a three-dimensional process involving propagation of ion-acoustic waves. Here, we present the first direct measurement of a foam homogenization dynamics by applying a pump-probe technique. A low density foam sample is ionized by intense laser pulse and plasma is probed with an auxiliary low intensity laser pulse, crossing plasma with a varied time delay. The wavelength and amplitude of plasma density perturbations are deduced from measurements of angular scattering and spectral broadening of the transmitted probe beam detected in the far field with respect to the target. It is found that large scale plasma density modulations exist more than 1 ns after plasma creation.
2. Experiment setup and plasma diagnostics
Experiment has been conducted on the PALS laser system in the Institute of Plasma Physics of the Czech Academy of Sciences [18]. This is an iodine laser delivering up to 700 J in a 300 ps pulse at the wavelength 1.314 μm. In the present experiment the laser pulse was converted into the third harmonics (the wavelength λ0 = 438 nm) and split into two beams. The main beam delivered about 120 J with a pulse duration of ∼240 ps. It was focused with a random phase plate on a foam target at normal incidence. The target was placed slightly behind the best focus so that the laser spot diameter on the foam surface was 300–500 μm. The use of a random phase plate provided a fairly homogeneous foam ionization with no small-scale spatial variations induced by the laser beam. The characteristic spatial scale of laser intensity modulation across the laser spot on target was 100 μm. The auxiliary beam with energy of 100–150 mJ and same pulse duration ∼240 ps was focused on a foam plasma into a smaller focal spot of approximately 100 μm at an angle of 25° to the target normal with a time delay varying from 0.25 to 1.1 ns. The transmitted beam was recorded on a CCD camera through a lens at a distance of L = 25 cm from the target. The experimental setup is presented in figure 1(a). Figure 1(b) shows an example of the transmitted probe beam through plasma. A dashed circle indicates the size of transmitted probe beam without plasma. Our diagnostics based on the angular broadening of the transmitted auxiliary beam is not capable to detect density modulations of the scale length λ ∼ 100 μm caused by the inhomogeneities in the main laser beam as they lead to small deflections of the auxiliary beam Δθ ∼ λ0/λ less than 0.5°.

Figure 1. Experimental setup (a) and image (b) of the transmitted probe beam (shot #53649—foam density 2 mg/cc and thickness 150 μm, main beam energy 92 J, spot diameter 500 μm, probe delay 250 ps). Dashed white circle of a diameter of 31 mm shows the probe beam size in a test shot without target. (c) Photo of a target before the shot. The foam is supported in a washer of a thickness of 300 μm. Parameters of laser beams and diagnostics are specified in the text.
Download figure:
Standard image High-resolution imageThe plasma parameters were measured with temporal resolution of better than 100 ps in soft x-ray and optical domains. Soft x-ray streak camera was measuring plasma emission in the spectral range above 1 keV in the direction perpendicular to the main beam through a slit in a washer supporting the foam target. Lower energy photons do not reach the streak being strongly absorbed in mylar as the optical path includes 6 μm thick mylar foil for differential pumping and 10 nm thick Al filter on a 3.5 μm thick mylar foil. This diagnostic registered emission from a plasma behind the ionization front.
An optical streak camera registered the transmitted main beam light together with the temporal profile of the incident beam. In figure 2, the incident beam profile is noisy, as it is imaged to a small spot on the optical streak via an optical fiber. Cold foams are transparent, see figure 1(c). Consequently, the transmitted signal shows a weak shine-through pulse followed by a stronger second peak at the time when plasma density falls below the critical density. This diagnostic confirms that the foam is fully ionized by the laser pulse. The plasma density modulations were measured by detecting the transmitted probe light scattered out of the beam divergence angle, see figure 3(a). The beam divergence angle was detected in a separate shot without target, see figure 1(b). The spectrum of transmitted probe light was also detected showing plasma-induced spectral broadening, see figure 3(b).

Figure 2. Time dependence of the transmitted main beam intensity (red) compared to the incident beam temporal profile (blue). Shot #53620—foam density 2 mg/cc and thickness 330 μm, main beam energy 117 J, spot diameter 500 μm.
Download figure:
Standard image High-resolution image
Figure 3. Vertical (blue) and horizontal (red) cuts of the spatial distribution of the transmitted probe beam at the detection lens (a) and the spectrum of transmitted probe beam (b) for a foam density 2 mg/cc and thickness 150 μm. The distance in panel (a) is in pixels, dashed lines show the beam width at the levels 50% and 20%, shot number #53649. Color code in panel (b) corresponds to shots #53613 (red solid), #53650 (pink dashed), #53651 (green dotted), #53620 (blue dash–dot), see table 1 for the shot attribution.
Download figure:
Standard image High-resolution imageThe targets were made of microcellular aerogels produced from triacetate cellulose (TAC) C12H16O8 of density 2 and 4 mg/cc and thickness h varying from 140 to 330 μm [19, 20]. The average pore size was varying between 0.5 and 2 μm. The foams were confined in copper washers of the same thickness as the foam with an inner diameter d = 2 mm and outer diameter 8 mm. Washers had a slit 1.2 mm wide for observation of soft x-ray emission, see figure 1(c). Washers were mounted on a thin metallic stalk and positioned normally to the main laser beam.
The plasma parameters have been calculated with a single temperature radiation hydrodynamic code PALE [14, 21] providing estimates for the plasma temperature, ionization time and the expansion velocity. A single temperature model is justified for a large-scale foam modeling as ion-electron relaxation is accelerated in collisions of expanding foam solid elements heated by the laser [15]. The foam equation of state was taken from the SESAME tables. However, the process of foam homogenization was not modeled—the foam was considered as a continuous material of equivalent average density. It is known that such a model significantly (up to a factor of 2) overestimates the ionization front velocity, but reproduces reasonably well the overall plasma temperature and density profile [12–14, 22, 23].
3. Experimental results
Two series of experiments have been conducted with foam densities 2 and 4 mg/cc. We present here only results from the first series, the data from targets of a higher density are similar. Each series consisted with three sets of shots corresponding to probe delays increasing progressively from 250 ps to 500 ps and to 1100 ps. The major detection parameter was intensity distribution of the transmitted probe light on the reception lens. The transmitted probe energy fraction varied weakly with the delay time but it decreased with the foam density and thickness. Intensity distribution of the probe beam transmitted through the target is shown in figure 1(b). It presents pattern with a width approximately twice larger than in the control shot without target, shown with a white dashed line in the figure.
A more detailed analysis was performed by tracing intensity cuts in two transverse directions: vertical and horizontal, see figure 3(a). While the cuts are not identical, they show similar features: a central peak with a width at half maximum equal to the probe beam width in the control shots without plasma, and a wider pedestal, which we measured at a level of 20% of the maximum. Average width of the pedestal is 60 mm, that is, twice larger than the width of unperturbed probe. Statistical variation of the probe beam spread is at a level of 10%–15% (see table 1 below), but we do not observe change of the pedestal width with the probe delay. There are also overall shot-to-shot variations of the beam centroid within ±10 mm, which can be explained by deviations from planarity of the foam surface that was not controlled. This may also explain azimuthal anisotropy of the scattered light, which can be observed in the raw images such as shown in figure 1(b). Consequently, the width of laser spot was calculated as an average of the width of vertical and horizontal cuts.
Table 1. Parameters of the experiment and measured data for the foams with density of 2 mg/cc. Main beam diameter on target is 500 μm, pulse duration 240 ps. First line presents the data of a control shot without target. Data precision is 10%–15%.
| Shot | Foam | Main pulse | Main pulse | Probe pulse | Probe beam | Probe beam | Spectral |
|---|---|---|---|---|---|---|---|
| number | thickness, | energy, | transmission, | delay, | width at | width at | width, |
| μm | J | % | ps | 50%, mm | 20%, mm | nm | |
| 53613 | — | 3 | 100 | 250 | 31 | — | 0.6 |
| 53649 | 150 | 92 | 18 | 250 | 29 | 57 | 0.8 |
| 53650 | 180 | 87 | 20 | 250 | 25 | 52 | 0.8 |
| 53651 | 305 | 107 | 21 | 250 | 31 | 58 | 0.8 |
| 53654 | 150 | 87 | 27 | 500 | 32 | 55 | 0.8 |
| 53655 | 195 | 85 | 22 | 500 | 32 | 54 | 0.8 |
| 53619 | 330 | 121 | 13 | 500 | 35 | 62 | — |
| 53620 | 330 | 117 | 7.9 | 500 | 32 | 65 | 1.0 |
| 53617 | 330 | 115 | 6.5 | 1100 | 35 | 51 | — |
Spatial spreading of the transmitted probe beam is accompanied with its spectral broadening as shown in figure 3(b). The spectral width of the probe of 0.6 nm was increased up to 1 nm in certain shots. However, in difference to angular spread that has been observed regularly in all shots, spectral broadening was less reproducible, probably due to insufficient resolution of the spectrograph. A summary of measured results for the foams with density of 2 mg/cc is presented in table 1.
4. Data analysis and discussion
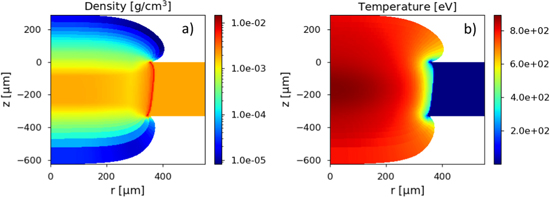
Figure 4 shows plasma density and temperature spatial distribution calculated with the hydrodynamic code PALE at the end of laser pulse. The characteristic plasma density scale of about 200 μm is defined by the foam thickness and the focal spot radius. Plasma density corresponds to the initial value of 2 mg/cc and temperature has raised to 800 eV. In the following 1 ns rarefaction waves propagate from plasma edges to the center, maximum density drops approximately two times and temperature decreases to 150 eV. While it is not described in the simulation, plasma is not completely homogeneous, we expect there density fluctuations on spatial scale of the initial pore size, that is λs ∼ 0.5–2 μm and also on larger scales due to the homogenization process.
Figure 4. Calculated density (a) and temperature (b) distributions of a foam plasma with initial density 2 mg/cc and thickness 330 μm at the end of laser pulse t = 400 ps. Laser energy 120 J and focal spot diameter 500 μm. Laser propagates from the top to the bottom.
Download figure:
Standard image High-resolution image
These perturbations evolve in plasma as ion acoustic waves, which are not described in the hydrodynamic codes because of their small spatial scale and short time variations. The characteristic ion acoustic speed cs ∼ 150 μm/ns corresponds to the period of density oscillations of 5–10 ps. Scattering of the probe laser light on density perturbations would result in its angular deviation and spectral broadening. However, the angle of laser ray deviation due to scattering on the primary fluctuations, Δθs ∼ λ0/λs ∼ 0.25–0.5, would be significantly larger that the observed deviation Δθs ≲ 0.1. That estimate suggests that these small-scale density fluctuations have already been damped out and larger scale fluctuations dominate.
This is indeed the case with the calculated plasma parameters. For ion density ni ≃ 6 × 1020 cm−3 and temperature T = 400 eV, the ion–ion collision frequency (collision of carbon ions) is νii ≃ 1.5 ps−1 and ion–ion mean free path is lii ≃ 0.1 μm, which is much smaller than the ion acoustic wavelength. Therefore, ion acoustic waves are in the viscous damping regime [24, 25] and their damping rate  ps−1 is approximately ten times smaller than the ion acoustic frequency ωs = kscs ∼ 1 ps−1. (Here, ks = 2π/λs is the ion acoustic wave number, vTi ≃ cs(Ti/Te)1/2 is the ion thermal velocity, and Ti and Te are the ion and electron temperatures.) Consequently, small-scale density fluctuations are damped out in a few ps, and they cannot be observed with our diagnostics.
A situation is however different for longer wavelength density perturbations. The damping rate decreases as square of the wavelength, and ion acoustic waves with wavelengths of ≳10 μm may exist on time scale of a few ns. Perturbations with these wavelengths may explain the fact that angular spread of the probe beam does not change within the considered range of time delays. Here, however, we need to explain the value of the observed angular spread, Δθs ∼ 0.1, which is at least two times larger than angle of probe deviation due to scattering from a 10 μm wavelength ion acoustic wave.
Explanation of the angular spread is motivated by the observed dependence of the size of the transmitted probe beam on the foam thickness. Indeed, the data show a systematic increase of the beam size with the foam thickness. This is a clear indication that the probe beam is subject to multiple scattering where photons diffuse in the foam plasma and their angular divergence increases as a square root of the distance:

Here, δne/ne is the relative amplitude density fluctuations in plasma, nc is the electron critical density and h is the foam thickness. This expression has been obtained in [26] for laser scattering on arbitrary density fluctuations in plasma. In our case with ne/nc ≃ 0.1 and ksh ≃ 200, it would be sufficient to have amplitude of density fluctuations of 10% to explain the observed angular broadening.
This is a rather reasonable value. With this value of density fluctuation amplitude, photons of the probe beam would make in average Ns ∼ 10–15 scattering events while propagating through the foam plasma. A theory of multiple scattering light on density fluctuations [26] provides also an estimate for the fraction of probe beam involved in multiple scattering
where k0 = 2π/λ0 is the probe beam wave number. The expected scattering fraction is on the order of 50%, which qualitatively agrees with the observation that the pedestal area is comparable to the area of the main peak.
Process of multiple scattering explains also spectral broadening of the probe. Each elementary scattering process corresponds to a relative frequency shift on the order of 10−4. A diffusion process increases this shift with the number of scattering events as  . Therefore, the expected spectral broadening is about (3–4) × 10−4, which is smaller than the intrinsic laser spectral width of ∼10−3. This estimate is in qualitative agreement with the observation where the spectral width of transmitted light is 20–30% larger than the incident light.
One can also use equations (1) and (2) for evaluation of plasma density inhomogeneities from the characteristics of scattered light. Indeed, by measuring the scattering angle Δθs, scattered intensity fraction, ΔIs/I0, and knowing plasma thickness h, one would be able to calculate the wavelength and amplitude of density perturbation in the plasma. By conducting these measurements at several time delays, it will be possible to evaluate the temporal evolution of plasma fluctuations and homogeneization time.
5. Conclusions
This experiment provided for the first time an information on the density fluctuations in a plasma created from underdense foams. Two major conclusions can be deduced. First, a fast plasma homogenization proceeds on a time scale smaller than 100 ps. There, density fluctuations of a size compared to the pore size are strongly suppressed due to the ion viscosity. This fact is in agreement with the theoretical model of foam ionization with laser beams [12, 13]. However, density perturbations on a scale ten times larger than the pore size survive a much longer time of several ns with relative amplitudes on the order 10%. This fact may present a problem for using foams as material inducing spatial smoothing of intense laser beams [2–4]. While laser intensity inhomogeneities could be smoothed out as the beam propagates through the foam, residual density perturbations produced during the foam ionization process may be imprinted in a denser target and further amplified when target is accelerated.
This effect of delayed damping of long wavelength density perturbations can possibly explain the observations reported in studies of laser beam smoothing in foam plasmas [27]. By face-on radiography, the authors of that paper demonstrated a significant suppression of laser beam intensity inhomogeneities and a subsequent delay of development of the Richtmyer–Meshkov instability in a thin plastic layer placed behind the foam. However, at a later stage of interaction, the authors observed in a foam of density 5 mg/cc spontaneous emergence of three-dimensional density structures with characteristic size of 100 μm, which grow with time. The origin of these unexpected density modulations was not identified. Density fluctuations detected in our experiment may explain appearance of these large size structures, but this hypothesis needs further investigation.
Unfortunately, temporal resolution in the present experiment was limited by the probe pulse duration, which is comparable with the life time of characteristic ion density perturbations. Moreover, the probe delay time was limited by the plasma expansion time, which is about 1 ns because of a small foam thickness. It would be desirable to repeat this experiment with better temporal and angular resolution and by using more energetic laser pulse for creation of a larger volume of plasma.
Acknowledgments
The authors acknowledge financial support from the European Regional Development Fund through the projects CAAS CZ.02.1.01/0.0/0.0/16_019/0000778 and ELITAS (ELI Tools for Advanced Simulation) CZ.02.1.01/0.0/0.0/16_013/0001793. This research was also supported by the Czech Ministry of Education, Youth and Sports (projects LM2015083 and EF16_013/0001552) and by the Czech Science Foundation (project 19-24619S). This work has been partially carried out within the framework of the EUROfusion Consortium and has received funding from the Euratom research and training programme 2014-2018 and 2019–2020 under grant agreement No 633053 (EUROfusion projects CfP-AWP17-IFE-CEA-01 and ENR-IFE19.CEA-01). The views and opinions expressed herein do not necessarily reflect those of the European Commission. The authors (NGB, AAA, LAB and VGB) in charge of the targets acknowledge the support of RFBR project # 17-02-00366.