

Abstract
Currents flowing in the scrape-off layer (SOL) are routinely observed in a number of tokamaks. They are usually closed through the divertor plates, either between the inner and outer target or between different poloidal sections of each target. The most common driving mechanisms of SOL currents are the thermoelectric effect (due to electron temperature difference between the two targets) and Pfirsch–Schlüter flows caused by radial pressure gradient. The SOL currents are commonly used for diagnostic purposes—e.g. as ELM monitors or for real-time estimation the divertor electron temperature. In this paper, we report on attempts to extract the SOL currents and related electrical power from the tokamak COMPASS using a dedicated insulated divertor tile and electronics setup, which allows for fast switching between grounded and floating state. It is observed that plasma acts as an ideal power source and that the magnitude of SOL currents scales with upstream separatrix temperature Te,sep.
Export citation and abstract BibTeX RIS
1. Introduction
Scrape-off layer currents (SOLCs) have been detected in a number of contemporary tokamaks [1–5]. They can be either stationary or linked to intermittent events, such as edge localised modes (ELMs) [2, 6] or MHD activity [7]. The most common driving mechanism of the SOLCs is the thermoelectric effect, which appears when each divertor target has a different electron temperature, therefore a different magnitude of the sheath potential drop and consequently a different value of potential at the sheath entrance [8]. In such case, the particles flowing along the magnetic field lines are experiencing a parallel electric field, which drives the SOL current. The current is closed through the divertor plates and the vessel between the two targets. Another driving mechanism for SOLCs are the Pfirsch–Schlüter flows [9, 10] which arise in locations of high radial pressure gradient, typically close to the last closed flux surface.
The SOLCs have been intensively studied in the past for two reasons: intermittent SOLCs driven by the thermoelectric effect occurring during ELMs, were suspected to cause stochastization of the magnetic equilibrium and consequently ejection of hot and dense plasma from the pedestal region into the SOL and divertor [11]. The steady-state SOLCs have been investigated with hopes that they could be manipulated by divertor biasing in order to control transport in the edge plasma and e.g. mitigate ELMs [12, 13].
In this work we revisit the SOLCs from a new perspective: we will address the question whether such currents could be extracted from the machine and used as an non-thermal mean of electricity production in future thermonuclear reactors. Unlike the traditional way of power extraction via heat conversion, this method is attractive as it does not suffer from poor efficiency of the conversion. We will base our report on dedicated experiments at the COMPASS tokamak, where such extraction has been attempted.
2. Experimental setup
The divertor of the COMPASS tokamak [14] has been equipped with a specially designed segmented tile, which consists of 5 radially separated graphite segments placed on an insulating bed made of boron nitride (see figure 1). Two 2 cm wide segments (no. 2 a and 4) are placed on radial locations where the strike-points are typically situated (R = 480–500 mm and 418–438 mm respectively), the middle segment (no. 3) covers the private flux region and the remaining segments (no. 1 and 5) cover the far SOL on low field side (LFS) and high field side (HFS) respectively. The segments are radially separated by gaps of 1 mm between each other and toroidally by 1 cm from the neighbouring tiles, which are conductively connected to the vessel (grounded). The segmented tile occupies 1/32th fraction of the total divertor area. The toroidal lengths of the segments increase towards the LFS, with segment 2 being approximately 6 cm long. The areas of top surfaces of segments 1–5 are 9124, 805, 1726, 724 and 2934 mm2 respectively.
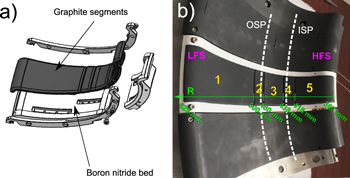
Figure 1. Segmented divertor tile: schematic view of components (A) and assembled tile prior to installation in the COMPASS divertor (B). Individual segments are numbered starting by the LFS.
Download figure:
Standard image High-resolution imageSimilar tiles were installed in the past on a number of tokamaks in order to characterise the SOLCs [3, 6]. The novelty of our approach is that each segment is connected to a feedthrough and further to the dedicated electronics located outside the vessel. This electronics was developed to allow fast switching between two different regimes: (i) Floating regime, where the segments are electrically disconnected from the vessel and (ii) Grounded regime, where the segments are connected to the vessel and current flowing through the circuit is measured. The change of regime can be controlled by a trigger signal and was typically performed every 5 ms during a discharge, so that both the floating potential Vfloat and the current to the grounded tile I0 (shunt current) could be measured during the flat top of the discharge. This setup allowed for initial characterisation of the SOLCs in different plasma regimes.
Preliminary estimations of the magnitude of the currents revealed that currents induced during disruptions could reach several hundreds of amperes. Such currents may damage the cables inside the vessel and most importantly the feedthrough, which could in the worst case lead to a loss of pressure in the vacuum. Therefore, a robust feedthrough capable of carrying up to 180 A (in steady state) through each lead was installed. Disruptions may induce large voltage differences between floating segments and the vessel, which could drive arcing and damage of the vessel. For this reason, the segments were located on a 2 cm thick boron-nitride bed and additional kapton insulation was placed between the cables and the vessel beneath the tile.
3. SOLCs at COMPASS
First measurements with the segmented tile were performed during a so-called standard discharge, which is a simple ohmic discharge performed at the beginning of every experimental day at COMPASS (R = 0.56 m, a = 0.18 m, Iplasma = −180 kA, BT = −1.15 T, ne = 4 × 10¹⁹ m−3, q95 = 4, κ = 1.76, βn = 1.0, ∇B drift pointing toward the target). The measured shunt currents and floating potentials of each segment are shown in figure 2. The shunt currents flowing through the segments can reach magnitude of several amperes and have opposite sign on the LFS and HFS target. This is in qualitative agreement with results reported from COMPASS-D [4]. The total current is, however, not zero, which indicates that the segmented tile has insufficient radial coverage to collect all the currents flowing through the targets. The sign of the floating potentials reflect the direction of the currents flowing in the segments.
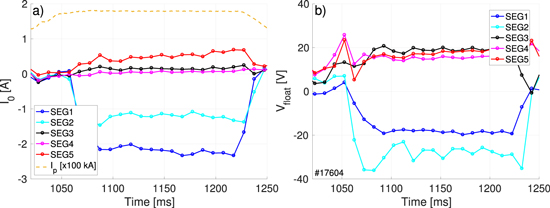
Figure 2. Shunt currents (A) and floating potentials (B) recorded by the segmented divertor tile during a standard discharge #17604. Plasma current shown in A indicates the duration of the discharge flat-top.
Download figure:
Standard image High-resolution imageIn order to cross-check the validity of the segmented tile measurements, a comparison with divertor probes [15] was attempted, as shown in figure 3. The divertor probes consist of a single poloidal array of 56 Ball-pen probes (whose floating potential Vfloat,BPP is close to the plasma potential) and two poloidal arrays of protruding Langmuir probes, measuring the ion saturation current Isat and floating potential Vfloat,LP respectively. The electron temperature can be derived from the difference of the two potentials as

where the value of coefficient α has been experimentally determined as 1.4 [15]. The probe array covers the entire poloidal cross-section of the divertor; however, the interpretation of probe measurements on the HFS is not resolved at the time of writing, therefore only measurements from the LFS target are used in this work. The parallel current density for each segment is calculated as

where αB is an average angle of impact of magnetic field line with respect to the top surface for each segment (ranging typically from 0.5° to 3° depending on the distance from the strike points) as calculated by the magnetic equilibrium reconstruction code EFIT and Aseg is the area of the top surface of the segment.
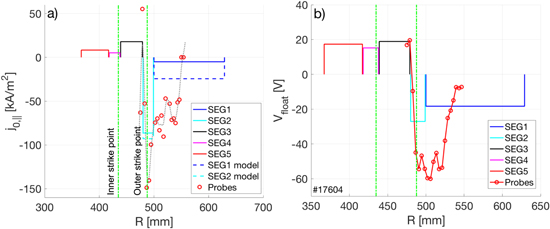
Figure 3. Radial profiles of parallel current density for grounded segments (A) and floating potentials for segments insulated from the vessel (B) recorded by the segmented divertor tile. The results are compared to measurements of divertor probes. Strike point locations calculated by EFIT are marked by vertical green lines.
Download figure:
Standard image High-resolution imageThe comparison of floating potentials measured by the tile segments and the Langmuir probes (figure 3(B)) is straightforward, but only qualitative agreement could be assessed due to different radial resolution of the probes and segments. The comparison of parallel current density j0,∥ requires some assumptions on the electron and ion current, since the divertor probe array does not measure the shunt current directly. Using the ideal Langmuir probe theory [16], it is possible to reconstruct the full I–V characteristics and subsequently to determine the current at zero bias, assuming that the plasma potential is above zero. According to the three-parameter probe model the total current Ip should depend on probe potential Vp as:

The grounded probe has Vp = 0 and therefore the shunt current is simply

Unfortunately, this model is generally valid only for Vp < Vfloat, as the electron current can be significantly reduced in the presence of magnetic fields, especially if the biased surface is at grazing angle of incidence with respect to the magnetic field [17]. Dedicated measurements with the divertor probe array [15] have revealed a ratio of ion and electron saturation current  , instead of the theoretical value of Rtheor=17. This information can help us to modify the model presented in equation (3). We assume that the electron current drawn by the segment is reduced either by electron reflection in the magnetic pre-sheath of the nearby tiles [18] or by flux tube charging [19] and employ a correction to the electron current driven by the segment—the current follows the Langmuir theory only until it becomes limited by a value dictated by the value of Rexp. In the following text, we dub this model the limited model, while the original model based on Langmuir theory as the ideal model

An illustration of the two models is shown in figure 4. In order to verify the applicability of the limited model for the conditions in COMPASS divertor, dedicated measurements were performed, in which every odd Langmuir probe was directly connected to ground via a resistor, measuring the shunt current (instead of Isat). These currents were compared to the expected shunt currents calculated by equation (5), based on measurements of the even probes sets (as shown in figure 5) for L-mode and ELM-free H-mode. It can be seen that the limited model yields a reasonable agreement with the measurements; however it overestimates the shunt current in far-SOL in the case of L-mode discharge. This corresponds to the results obtained in figure 3(A)-the expected shunt current (shown by dashed blue and cyan lines for segments 1 and 2 respectively) agrees with the measured value for segment 2 (near SOL) but overestimates the value for segment 1. Since the value Rexp may be in principle dependent of specific plasma conditions, predictions of the limited model are shown for a span of values from 5 to 9. Actually, the predictions are rather insensitive to the precise value of Rexp since the local non-ambipolarity is typically not pronounced enough to reach Ie > − Rexp Isat. The source of discrepancy in L-mode is not fully understood, however it is at least partially caused by a non-monotonous profile of Isat, which shows a local maximum at the radial location of the discrepancy. This feature has been already observed in COMPASS-D [4] and has been attributed to the presence of strong E × B drifts in the SOL.

Figure 4. I–V characteristics of the ideal Langmuir and limited models for different values of Rexp.
Download figure:
Standard image High-resolution image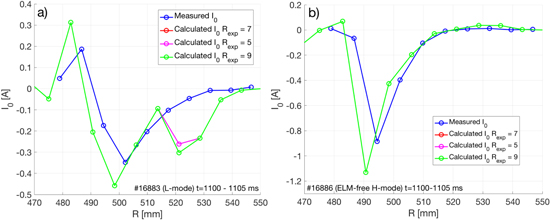
Figure 5. Radial profiles of I0 measured by divertor probes at the LFS target during L-mode (A) and ELM-free H-mode (B) compared to the predictions of the limited model with different values of Rexp.
Download figure:
Standard image High-resolution image4. Power extraction
In the experiments dedicated to power extraction, currents I0 from segments 1 and 2 were totalled to form ISOL and measured against the tokamak ground. In principle, one could also measure the current flowing between the inner and outer target; however, measurements presented in figure 2(A) show that the tile is not reaching far enough on the HFS to capture the whole current flowing to the inner target, and this would limit the current extracted in such a setup. In order to characterise the plasma as a source of current and voltage, a circuit element equivalent to a variable resistance Rz was required. In laboratory conditions, this setup is typically achieved by a potentiometer; however the magnitude of SOLCs and the required temporal rate of change of the resistance was incompatible with a mechanical solution. Instead, an additional controlled source of current was introduced in the circuit, which acted against the current driven by plasma.
Measurements were again performed during a standard shot. The time traces of the current, voltage and variable load Rz are shown in figure 6(A). Measurements between t = 1160 and 1180 ms were combined to produce averaged dependence of the extracted power Pout on the equivalent resistance Rz, as shown in figure 6(B). It can be seen that the maximum extracted power of 12 W is achieved for Rz ∼ 10 Ω (which corresponds to 384 W if the current was drawn from the entire outer target). Finally, figure 6(C) shows the current-voltage characteristics of plasma, which is in the first approximation linear and as such represents an ideal power source. The slope of the characteristics yields the plasma internal resistance Ri ∼ 12 Ω. This is in agreement with the general rule that maximum power can be extracted from the power source when Rz ∼ Ri. The working point with maximum Pout (marked by magenta symbol) is located at approximately half the current and voltage. The maximum extracted power Pout, max can be related to ISOL and Vfloat as

where the constant cp is a priori not known but can be determined experimentally, as shown in figure 7, where an approximate value 0.27 ± 0.01 was found. The Vfloat and ISOL are not independent but linked by equation (5). Assuming only a moderate degree of local non-ambipolarity, one can obtain


Figure 6. Time traces of power extraction experiment (A), extracted power versus load Rz (B) and source characteristics (C). The working point with maximum Pout marked by magenta symbol.
Download figure:
Standard image High-resolution image
Figure 7. Scaling of extracted power with the product of floating potential Vfloat and SOL current ISOL.
Download figure:
Standard image High-resolution imageIn this particular discharge, the electron temperature measured by the divertor probes (averaged over the radial extend of near SOL) was 37 eV and the equivalent Isat 1.7 A, which yields Pout of 15 W, in reasonable agreement with the value measured at the segmented tile.
In order to demonstrate the practicality of power extraction, a demonstration experiment was performed, replacing the dedicated electronics with a light bulb with resistance of 1 Ω (note that the resistance of the bulb wire increases approx. tenfold when it heats up). A recording of the visible camera confirmed that the electrical power from the SOLCs was successfully converted into light [20].
5. Scaling of SOLCs
In this section we attempt to address the problem of scaling of the magnitude of Pout and possible extrapolation to next-step devices, such as ITER. Considering equation (7), the problem is reduced to the scaling of ISOL.
One possible approach would be to predict the magnitude of ISOL using analytical models, which describe the underlying mechanisms. The thermoelectric current was first studied by Harbour [21] and his model was later extended by Staebler [8] to account for finite plasma conductivity. It allows to calculate ISOL based on the knowledge of Te at both targets and the plasma conductivity. However, there is no analytical model to predict the divertor temperatures and their ratio. Similarly, the Pfirsch–Schluter current was addressed by a model developed by Schaffer [9] for JET conditions; however, it requires knowledge of radial pressure gradient in the edge plasma, which again cannot be determined a priori. Moreover, Silva has demonstrated [4], that in COMPASS-D the SOL current is driven by a combination of the two mechanisms, which makes any analytical prediction even more arduous. Instead, we attempt to derive a scaling of ISOL experimentally, using results of series of measurements in COMPASS.
We have assembled a set of measurements from a series of attached L-mode discharges performed during the CC20.01 campaign in 2018, where the floating tile was in operation. The ISOL data points were extracted as averaged values of 10-20 ms long intervals, where the discharges were quasi-stationary. ISOL was determined either by measurements of segment 1 or combined current from segments 1 and 2, depending on the location of the outer strike point in the particular discharge. This series of discharges contained a range of plasma currents between 150 and 330 kA (corresponding to POhm between 150 and 400 kW) at BT between −1.15 and −1.5 T, resulting in span of q95 between 2.5 and 5.0. In some discharges the NBI heating with power delivered to plasma of up to 400 kW was applied.
The standard deviations of the measured signals were used to estimate the errors. Figure 8 shows the dependence of the SOL current ISOL on the plasma current Iplasma (representing a scan in q95 between 2.5 and 5.5, with values of BT between −1.15 T and −1.5 T), maximum electron temperature Te,div,max measured at the outer target by probes [15], the LFS gas puff particle flux ΓD2 and the Greenwald fraction (calculated as  using the line-averaged density nint measured by the interferometer). A scaling model derived for intra-ELM SOLCs at AUG [3] (the only scaling of SOLCs known from literature) is shown in figure 8(D).

Figure 8. Magnitude of ISOL plotted against the plasma current (A), the Te maximum at the outer target measured by probes (B), the gas puff intensity (C) and the Greenwald fraction (D) with the dashed line indicating the scaling model derived for intra-ELM SOLCs at AUG [3].
Download figure:
Standard image High-resolution imageIt can be seen that neither of these variables are very good scaling factors for ISOL. The ELM current scaling also does not seem to describe the data very well for low Greenwald fractions. It is also possible to assume a combined scaling with the ratio of maximum temperature target temperature (representing the magnitude of the thermoelectric effect) and the line averaged density (which is linked to the collisionality in the SOL). Unfortunately such scaling is strongly nonlinear (as shown in figure 9) and moreover exhibits a dependence on Iplasma.
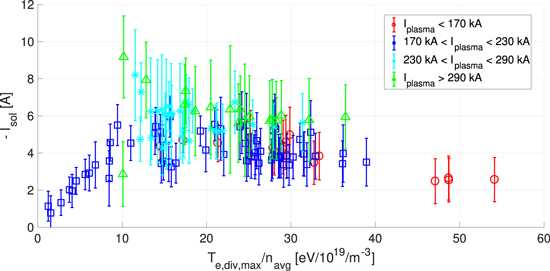
Figure 9. Scaling of the ISOL with a ratio of maximum target temperature Te,div and the line-averaged density navg for varying magnitude of the plasma current Iplasma.
Download figure:
Standard image High-resolution imageThe strongest variation of ISOL is with the gas puff intensity; however, there is a large scatter for a number of discharges where the gas puff was completely turned off. An example of how intensively the gas puff influences edge plasma is shown in figure 10. It can be seen that the gas puff does not only provokes a decrease in the target temperature but also reduces the upstream temperature measured by the Thomson scattering diagnostics at the separatrix Te,sep. The values of Te,sep were obtained from vertical profiles of Te by fitting data points between 0.9 < ψn < 1.1 with an exponential decay (similarly to analysis at AUG [22]) and interpolating the fit to ψn = 1. The profile of ψn was obtained from the magnetic equilibrium reconstruction code EFIT. Note that the location of LFCS is known to have limited precision, so a systematic offset in Te,sep may occur [23]. Separatrix temperature appears to be the best scaling parameter for ISOL, the dependence determined by nonlinear fitting being ![${I}_{{\rm{SOL}}}[A]=0.35\pm 0.09{({T}_{e,{\rm{sep}}}[{eV}])}^{0.64\pm 0.06}$](https://content.cld.iop.org/journals/0741-3335/61/9/095017/revision2/ppcfab2739ieqn3.gif) , as shown in figure 11. For tokamaks in conduction-limited regime, Te,sep can be determined from the two-point model [24] and depends mostly on the power crossing the separatrix Psep, which in turn depends on the heating power (for a fixed value of plasma current, which sets the power decay length [25]). This scaling parameter is, therefore, favourable with respect to the burning scenarios in next-step devices, where the heating power should be dominated by alpha heating Pα (and which should lead to an increase of Te,sep).
, as shown in figure 11. For tokamaks in conduction-limited regime, Te,sep can be determined from the two-point model [24] and depends mostly on the power crossing the separatrix Psep, which in turn depends on the heating power (for a fixed value of plasma current, which sets the power decay length [25]). This scaling parameter is, therefore, favourable with respect to the burning scenarios in next-step devices, where the heating power should be dominated by alpha heating Pα (and which should lead to an increase of Te,sep).
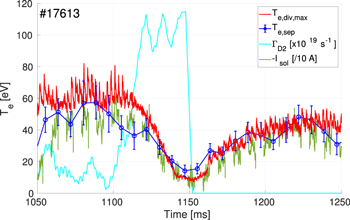
Figure 10. Response of ISOL to intensive gas puff, which also influences the separatrix temperature Te,sep and the temperature measured by the probes at the outer target.
Download figure:
Standard image High-resolution image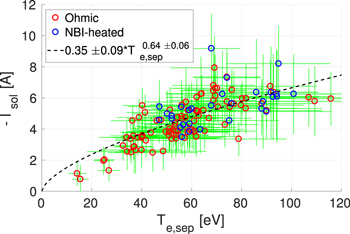
Figure 11. Scaling of the SOLC magnitude ISOL with the separatrix temperature Te,sep measured by HRTS.
Download figure:
Standard image High-resolution image6. Discussion
There are two major questions related to the possibility of direct power extraction from SOL currents:
- 1.The impact of the power extraction on the plasma operation. In the experiments described in this work, no such effect was observed (e.g. on confinement or even divertor heat flux footprint). One has to note that the extracted power of 12 W is very small compared to the plasma heating. The ohmic power delivered to plasma PΩ in this particular discharge was 200 kW, Psep = 50 kW. This ordering would remain valid even if the extraction was performed from the entire divertor (the segmented tile covers 1/32 of the divertor area, leading to some 380 W of possible total extracted power).
- 2.Prediction of the magnitude of extracted power on next-step devices, such as ITER. In principle it is possible to use the scaling of the magnitude of ISOL derived in the previous section to simply extrapolate it (assuming Te,sep ∼ 200 eV [26], divertor parameters Te = 10 eV, ne = 6 × 10²⁰ m−3 [27] and accounting for the size difference between the machines). The extremely high electron density results in a small ratio of ISOL to Isat in equation (7) and subsequently in a very small value of the floating potential (
 V). The resulting extracted power is therefore negligible, however we suspect that single-machine measurement are insufficient to resolve all important parametric dependencies and to produce a reliable prediction. Moreover, ITER will be operating in conditions, which are rather different to most contemporary machines: (i) it will be fuelled by pellets and NBIs, (not by gas puff) and (ii) it will operate in real-time controlled partial detachment, which will also affect Te at both targets. Experimental results from JT60-U show that under detachment the SOLCs are probably no longer driven by thermoelectric effect and are larger than expected [5]. In principle it would be also possible to optimise the discharge scenario to deliver maximum power via the SOLCs, which is clearly not considered in the current baseline scenario for ITER. While some room for this optimisation can be envisaged (such as preferentially detaching one target to increase the temperature difference between the two targets), it would have to respect the stringent conditions regarding plasma performance and material limits of the divertor PFCs.

For these reasons we believe that the estimate of the extracted power in ITER cannot be based only on COMPASS and more dedicated measurements in dedicated ITER-like plasmas on larger devices would be necessary. An alternative approach could make use of fluid modelling of edge plasma with drifts in codes such as SOLPS-ITER [28]. Such simulations are, however, due to its complexity outside the scope of this work.
7. Summary
We have demonstrated a possibility to intercept parallel currents flowing in the SOL and use them to extract electrical power from the plasma in a dedicated proof-of-concept experiment at the COMPASS tokamak. The COMPASS plasmas act as an ideal power source with low internal resistance of 10 Ω and allow to extract electrical power which is very small compared to the input power. The magnitude of the SOL currents scales approximately as a square root of the upstream separatrix temperature, at least in the series of L-mode discharges, which were analysed. The strongest actuator on the SOL currents is the gas puff, which affects both the upstream and target temperature. More experiments or dedicated modelling are needed to reliably predict the amount of extracted power for next-step devices, such as ITER.
Acknowledgments
MK would like to thank K Jirakova for corrections of the manuscript. This work was supported by the Czech Science Foundation project GA16-14228S and co-funded by MEYS project CZ.02.1.01/0.0/0.0/16_013/0001551 and #LM2015045.