
Smart Design of Cz-Ge Crystal Growth Furnace and Process

1
Leibniz-Institut für Kristallzüchtung, Max-Born-Str. 2, 12489 Berlin, Germany
2
Leibniz Institute for Catalysis, Albert-Einstein-Str. 29A, 18069 Rostock, Germany
3
Institute of Computer Science, Pod Vodárenskou Věží 2, 18207 Prague, Czech Republic
*
Author to whom correspondence should be addressed.
Crystals 2022, 12(12), 1764; https://doi.org/10.3390/cryst12121764
Submission received: 2 November 2022
/
Revised: 23 November 2022
/
Accepted: 29 November 2022
/
Published: 5 December 2022
(This article belongs to the Special Issue Artificial Intelligence for Crystal Growth and Characterization (2nd Edition))
Abstract
:The aim of this study was to evaluate the potential of the machine learning technique of decision trees to understand the relationships among furnace design, process parameters, crystal quality, and yield in the case of the Czochralski growth of germanium. The ultimate goal was to provide the range of optimal values of 13 input parameters and the ranking of their importance in relation to their impact on three output parameters relevant to process economy and crystal quality. Training data were provided by CFD modelling. The variety of data was ensured by the Design of Experiments method. The results showed that the process parameters, particularly the pulling rate, had a substantially greater impact on the crystal quality and yield than the design parameters of the furnace hot zone. Of the latter, only the crucible size, the axial position of the side heater, and the material properties of the radiation shield were relevant.
1. Introduction
Today, a century after its invention, Czochralski (Cz) growth is the dominant method in industry to produce large crystalline materials for modern electronic and photonic technologies [1,2,3]. Out of many parameters influencing the crystal quality and yield, the furnace design (e.g., geometry and the material properties of the hot zone parts) and process parameters (e.g., pulling and rotational rates, heating power, etc.) are essential. Their optimization has been the subject of extensive experimental and numerical research, especially in the case of the Cz growth of silicon (Cz-Si), e.g., [3,4,5,6,7,8,9], followed by germanium, gallium arsenide, and various oxides [10,11,12,13].
The furnace design studies focused mainly on optimizing the geometry of the radiation shield [4,11,14,15,16,17,18] and rarely on the position of the side heater [14], the geometry of the cooler [16], the flow guide [4], and the insulation materials [4,17]. Concerning process parameters, numerous papers were devoted to the study of the influences of the crystal and crucible rotational rates on the interface shape [9,19] and the limitations of the growth rates [20,21]. In magnetically driven Cz-Si growth, optimization of the magnetic parameters with respect to oxygen and carbon transport was a topic of numerous studies, e.g., [22,23,24,25,26].The sensitivity of the Cz-Ge process dynamics to the pulling rate and heating power at the beginning and towards the end of the growth was investigated in [10].
Computational fluid dynamics (CFD) is a traditional numerical tool for solving the governing differential equations describing the transport phenomena during crystal growth that helped understand the crucial process steps and factors determining the crystal growth. The main challenge of this approach is the fact that CFD simulations are laborious, expensive, and time consuming without the ability to generalize.
One of the most exciting cutting-edge tools that entered the field of crystal growth over the last decade is machine learning (ML). It has a great potential to revolutionize the optimization of the crystal growth processes and equipment, process control, and interpretability of the results in general [27].
Based on the added value achieved by combining ML and crystal growth research fields, we aimed to assess the potential of a selected interpretable ML technique for understanding the relationships among furnace design, process parameters, crystal quality, and yield in the case of Cz growth of germanium (Cz-Ge) to improve on the latter two. This study was motivated by the fact that Ge, a pioneering crystalline material in the history of electronics, is making a comeback as a next-generation semiconductor for applications in infrared optics, gamma-radiation detection, and photovoltaics [28,29,30,31]. The ultimate success in this endeavor depends on the quality and yield of the Ge crystals and their relationship to actual Si values [8].
One of the first attempts to develop the geometry of a bulk crystal growth furnace with ML support goes back to the work of Yu et al. [32], which was focused on the top-seeded solution growth of silicon carbide (TSSiC). The authors derived an artificial neural network (ANN) from 500 axisymmetric CFD simulations varying seven geometrical furnace parameters and optimizing the geometry using a genetic algorithm. Further ML studies were devoted to the applications of ANN and convolutional neural networks (CNN) to optimize process parameters in Cz-Si, Cz-YAG, DS-Si, and TSSiC growth [33,34,35,36,37].
The ANN and CNN are the most popular ML methods, characterized by a high accuracy of predictions but also a black-box nature, long computational times, and the demand for a large amount of training data. Our ML focus was on using the decision trees (DTs) method [38,39], which is suitable for applications with a small amount of data and high demands on the interpretability of the results (i.e., on understanding cause–effect relationships), which are common in crystal growth. Recently, we successfully applied regression and classification trees to study the influence of process parameters on interface deflection in VGF-GaAs growth [40].
In this study, Cz-Ge furnace and process design considerations included the hot zone geometry parameters, radiation shield material, heating power, rotation, and pulling rates.
Altogether, 13 input and 3 output parameters were considered. In total, 77 training data sets were provided by CFD modelling.
The pros and cons of the here proposed data-driven DT approach for Cz-Ge furnace and process design will be discussed and results compared with the common CFD and data-driven ANN approach.
2. Models and Methodology
2.1. Generation of Training Data by CFD Modelling
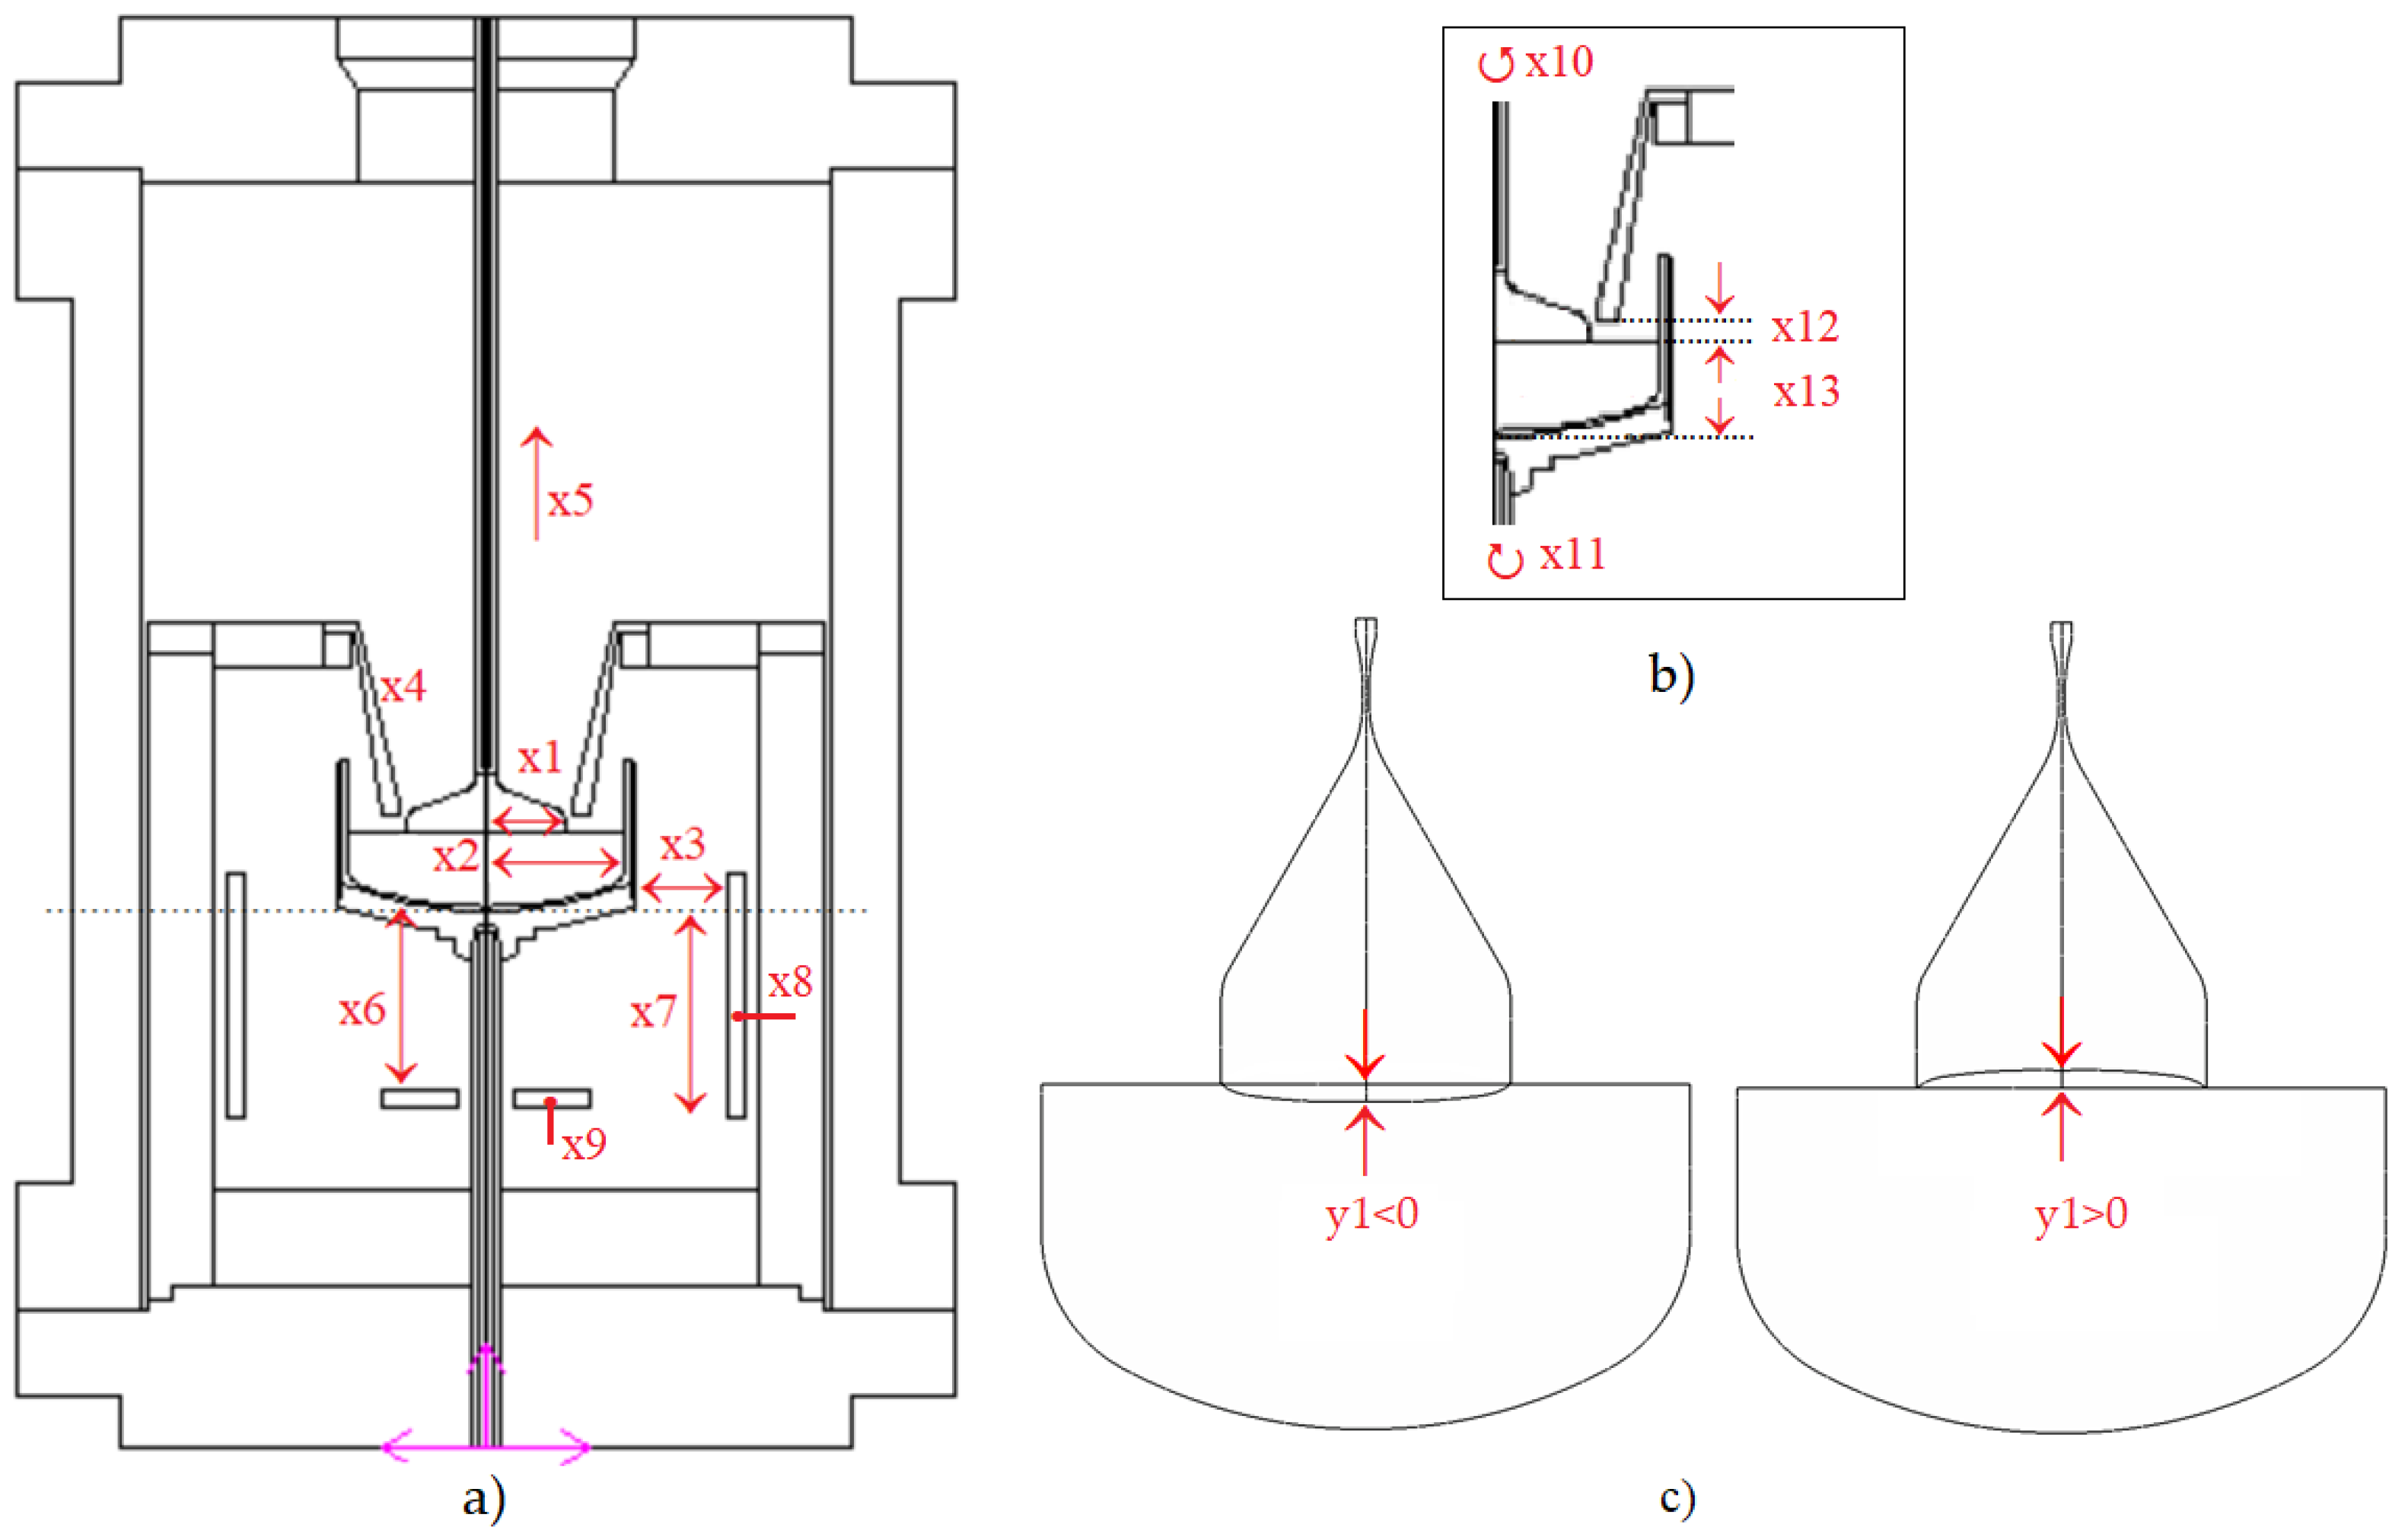
A sketch of the Cz-Ge furnace geometry with a definition of the main geometric and process parameters used in the simulations is given in Figure 1. The furnace was equipped with two graphite resistance heaters positioned on the side and bottom of the crucible. The quartz crucible was charged with 6.7 kg of Ge. The radiation shield was made of different materials and varied in length but had a constant slope. Its geometry guaranteed the visibility of the Ge triple point.
The transport phenomena taking place during the Cz-Ge growth were described by a common two-dimensional axisymmetric model. Governing equations for CFD modelling included equations of continuity, Navier-Stokes with the Boussinesq approximation, and energy Equations (1)–(5).
The Stefan and isothermal conditions must be fulfilled at the melt–crystal interface:
Details and theoretical backgrounds can be found elsewhere [41].
Due to the small size of the crucibles and crystals, Reynolds numbers were expected to be below the range typical for the turbulent flow. Against this background, melt convection was described by the laminar flow model.
The Ge material properties used in this study are given in Table 1. The crystals were grown in Ar atmosphere under atmospheric pressure. The CFD simulations were performed using the commercial code CGSim.
In order to obtain maximum information from a minimum number of CFD simulations, i.e., to cover relationships among 13 inputs and 3 outputs with good quality, a Design of Experiments (DoE) method [42] was used. If all input variables were varied at three levels, the theoretical number of CFD simulations (i.e., virtual experiments) based on a full factorial design would be 313 = 1,594,323, which is impossible to perform. In this study, we applied a D-optimal design for eight variables at three levels. However, nonsensical geometrical combinations and constrained process variables were discarded from DoE considerations.
For the generation of data sets for ML simulations, 77 combinations of seven geometric, one radiation shield material choice, and five crystal growth process parameters were used as input parameters for the CFD simulations. From the obtained axisymmetric CFD results, the interface deflection, crystal growth rate, and ratio of growth rate to the vertical temperature gradient (v/G) were extracted as output parameters for the ML training database. The interface deflection y1 was selected as the main measure of the crystal quality due to its well-known correlation with the development of thermal stress-induced crystal dislocations [43].
The output v/G was included as an additional measure of crystal quality based on the following considerations. The so-called Voronkov criterion is one of the key parameters that defines the critical value of v/G for the growth of defect-free perfect silicon crystals for device processing [44]. For v/G > 1.34 × 10⁻³ cm2/K min, the silicon crystal is vacancy rich, while for v/G < 1.34 × 10⁻³ cm2/K min, the crystal is self-interstitial rich. Recent studies showed that application of the Voronkov criterion to a Cz-Ge single crystal is also possible when Ge is doped with Ga and Sb [45,46,47,48]. Otherwise, the vacancy is always the dominant intrinsic point defect for Cz-Ge [48]. Finally, we selected the crystal growth rate as a crucial parameter for the economics of the process.
The common optimization goal in industrial crystal growth is to find ranges of input parameters in which the economy and crystal quality criteria are met simultaneously. In our study, this multi-objective optimization goal corresponded to the cases where s/l interface was flat, the crystal growth rate was maximal, and the Voronkov criterion was satisfied. In other words, we looked for the minimum of the objective (fitness) function y123 that was defined as a combined normalized output:
The data were pre-processed by normalization rescaling so that they ended up ranging between 0 and 1:
The fitness function y123 can also be defined in different ways, emphasizing the influence of certain outputs by adding weighting factors to Equation (6), as suggested in the literature [49]. In this study, we assumed that all outputs were equally important.
The interface deflection y1 was measured at the melt symmetry axis with respect to the three-phase junction (melt/crystal/gas) and varied between detrimental concave (y1 > 0) and favorable slightly convex (y1 < 0), as shown in Figure 1c. Process parameters were selected from the typical range of values given in the literature [28], e.g., pulling rate, crystal, and crucible rotational rates were varied in the intervals 0.16–1.5 mm/min, 10–60 rpm and, −1 to −5 rpm, respectively. Although the radiation shield can be made from multiple materials in a stacked arrangement, for simplicity we used a single material shield made of either quartz, ceramics, or graphite. All material properties of the shield materials were taken into account in the CFD simulations. In the ML simulations, only the emissivity of the radiation shield was considered as an input parameter.
2.2. Correlation Coefficients
Because of its simplicity, we used correlation coefficients as a starting point for data analysis. The Pearson correlation coefficient r of any input xi and output yj pairs of random variables is a measure of their linear dependence [50]. If each variable has N observations, then the Pearson correlation coefficient is defined as
where and are the empirical mean and standard deviation of xi, respectively, and and are the empirical mean and standard deviation of yj.
Two variables, xi and yj, are positively correlated (r > 0) if their values change in the same direction, negatively correlated (r < 0) if they change in the opposite direction, or may exhibit zero correlation (r = 0) if there is no relationship between the change of the variables. When interpreting the r = 0 results, the limitations of this simple approach must be taken into account, e.g., results may indicate zero correlation where non-linear dependences exist. Additionally, an observed correlation between the variables does not imply causation.
2.3. Regression Trees
The dependency between input and output parameters was modelled using regression trees (RTs), a non-linear regression model suitable for small data sets and high interpretability requirements. Regression trees are a type of decision trees where the output variables are real numbers [39].
The method enables us to analyze how the combination of input variables affects the outputs and to predict them individually. It has a tree structure, starting from the topmost root node with the initial data set, undergoing recursive binary splitting down in each node until the terminal node is reached that either is in a given maximal depth or has at most a given minimum size. The nodes represent the input variables: each branch is a decision and both nodes below a branch are the more homogeneous subsets of the data set above the branch. The splits are based on the sum of squared errors (SSE) with respect to the means of the yj in the two subsets, forming the split
From all possible splits of the data set S above the branch, a split was chosen that led to the minimal sum of squared errors.
The fitted model can be used to predict yj values as a function of xi variables. In this study, the maximum tree depth was set at 10.
From the regression trees for the crystal growth rate, the interface deflection, and the v/G ratio, the importance of each input variable (also known as feature importance) was also derived. Feature importance is the sum of the mean square error (RMSE) reductions across all those interior nodes in which this input variable resulted in the highest RMSE reduction in the node.
3. Results and Discussion
3.1. CFD Modelling
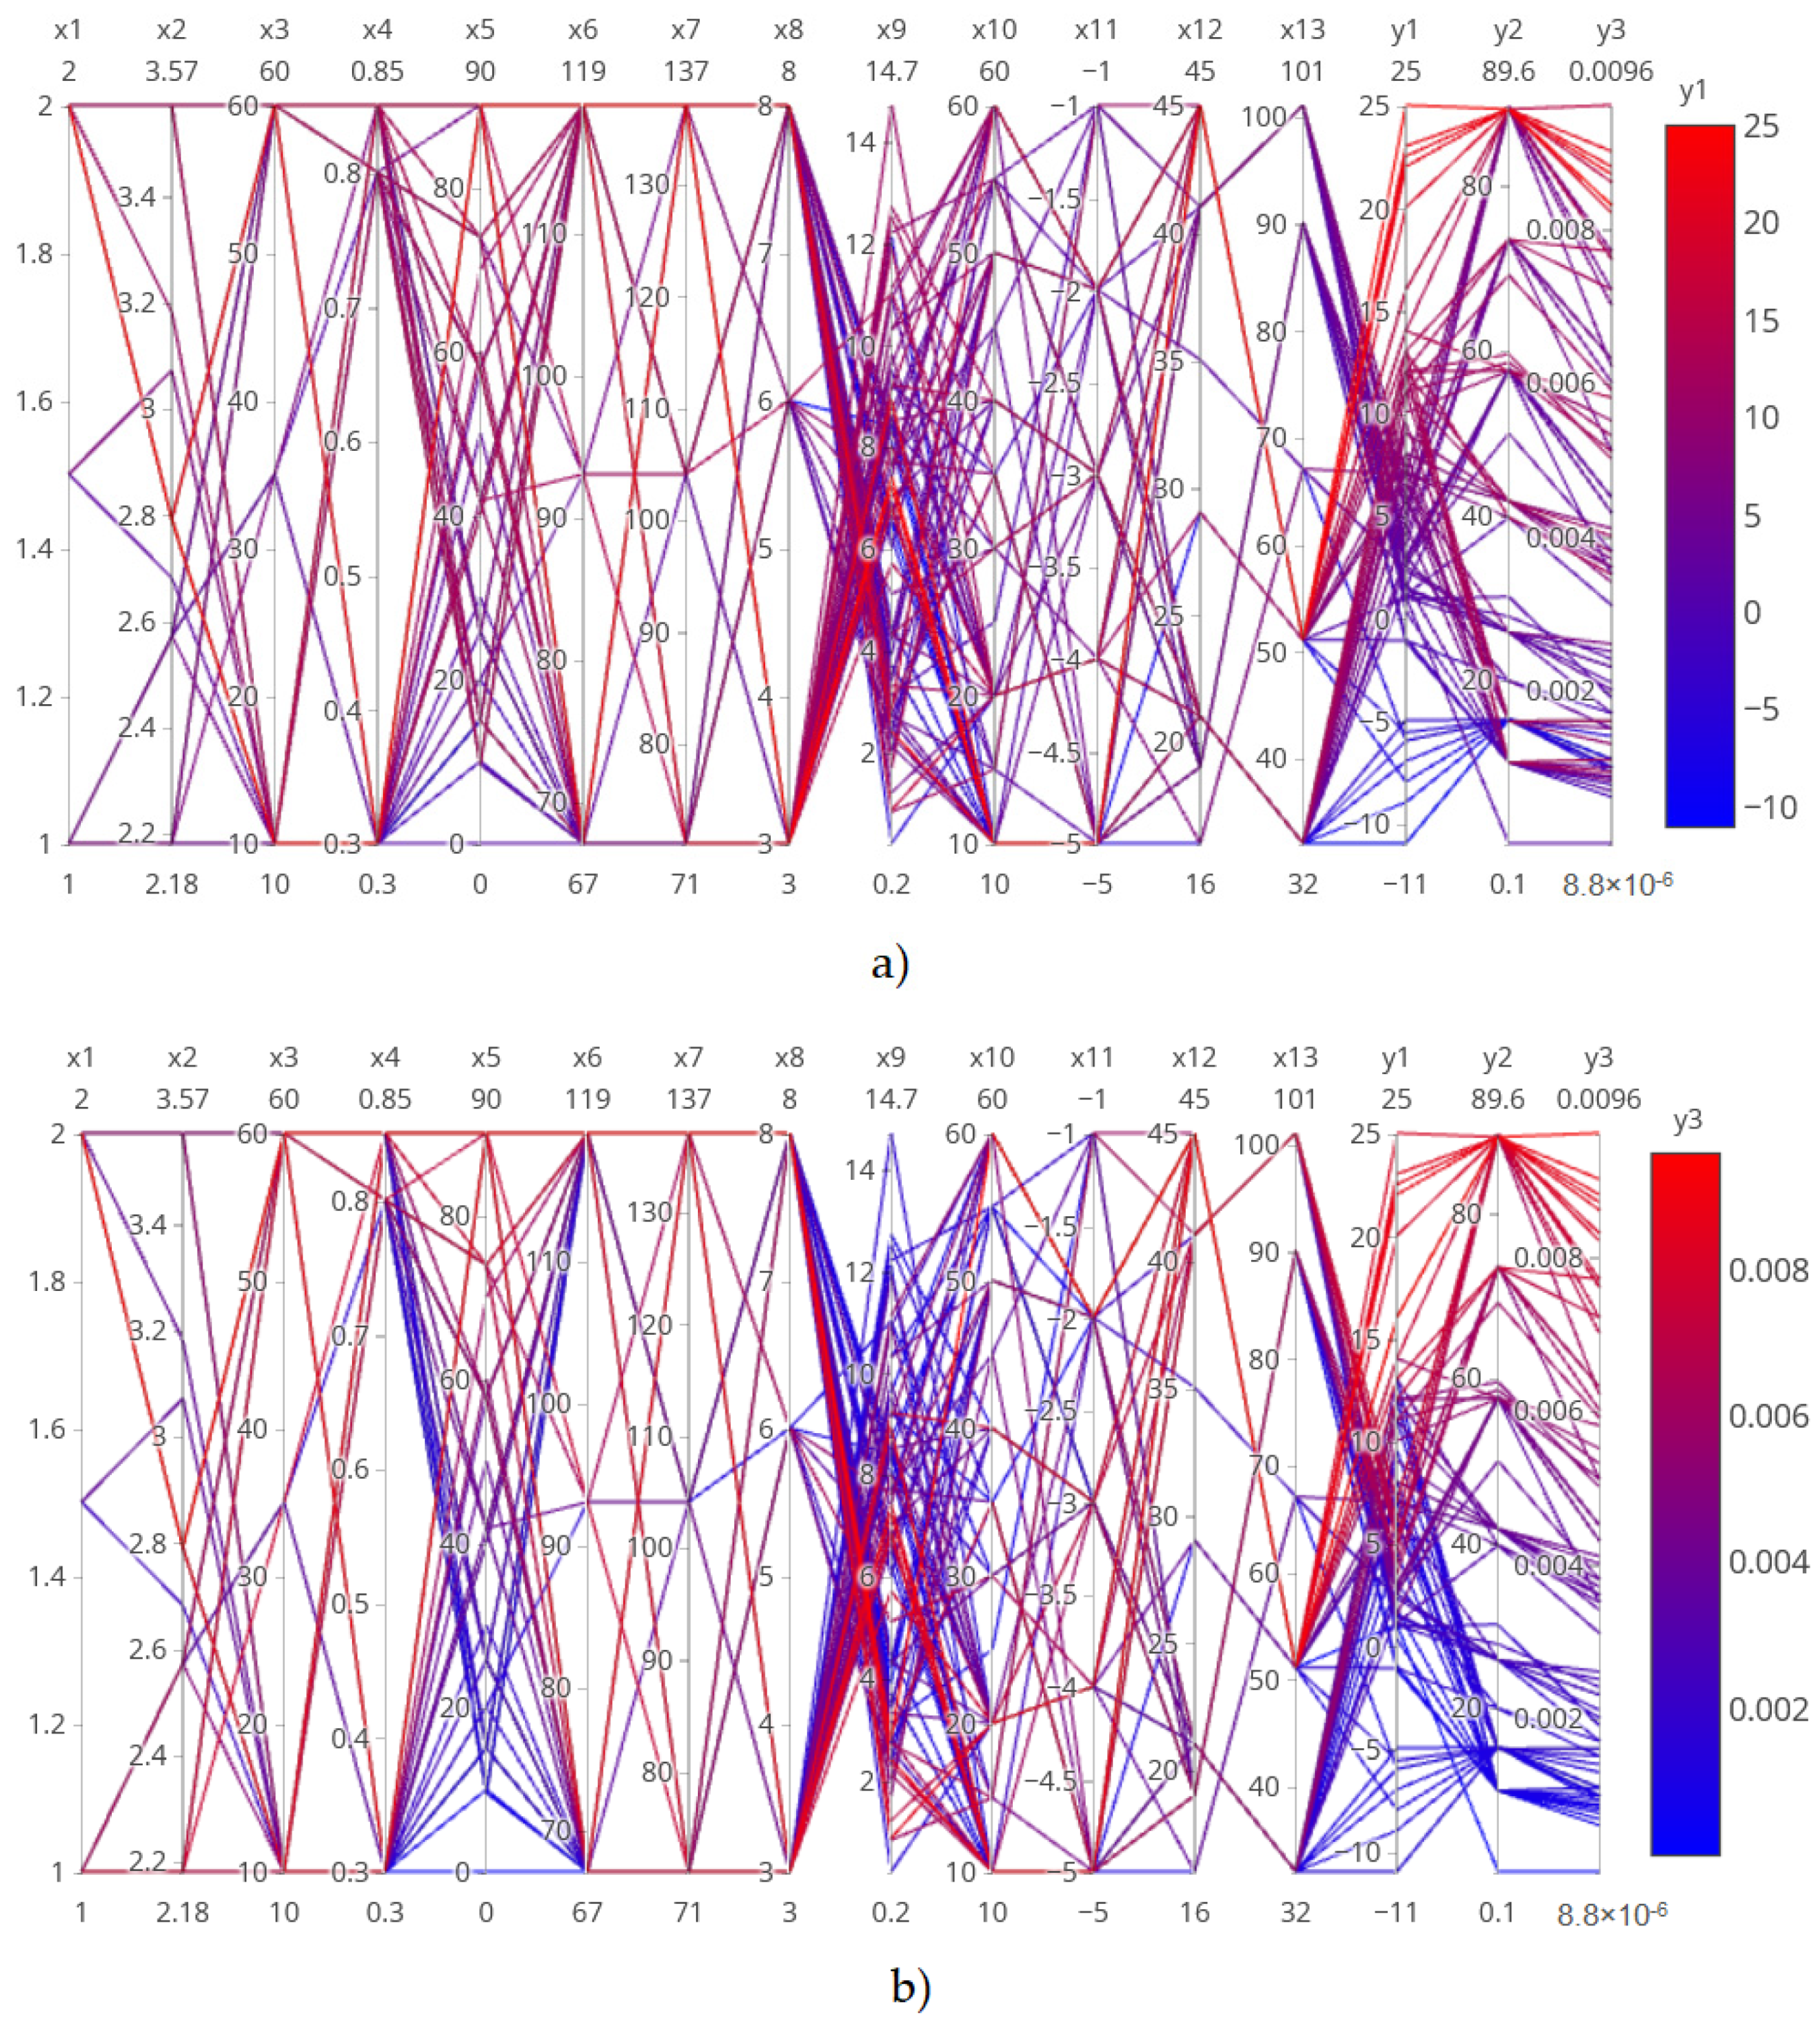
The CFD results provided 77 data sets in the form of 16-dimensional vectors, each with 13 input and 3 output parameters. All data are presented in parallel coordinates in Figure 2. Each line in the diagram corresponds to one data tuple (x1 … x13, y1 … y3). The generated database was used for ML training and analysis. The line color in Figure 2a,b matches the value of the interface deflection y1 and v/G ratio y3, respectively. In both cases, the visual inspection of the results indicated the strong influence of the pulling rate x5, as known from experimental investigations, i.e., the higher the pulling rate x5, the lower the crystal quality due to higher concavity of the interface (y1 > 0) and the v/G value (y3). Similarly, as the crystal radius x1 increases, so does the interface concavity y1 increase, which is the well-known challenge of upscaling.
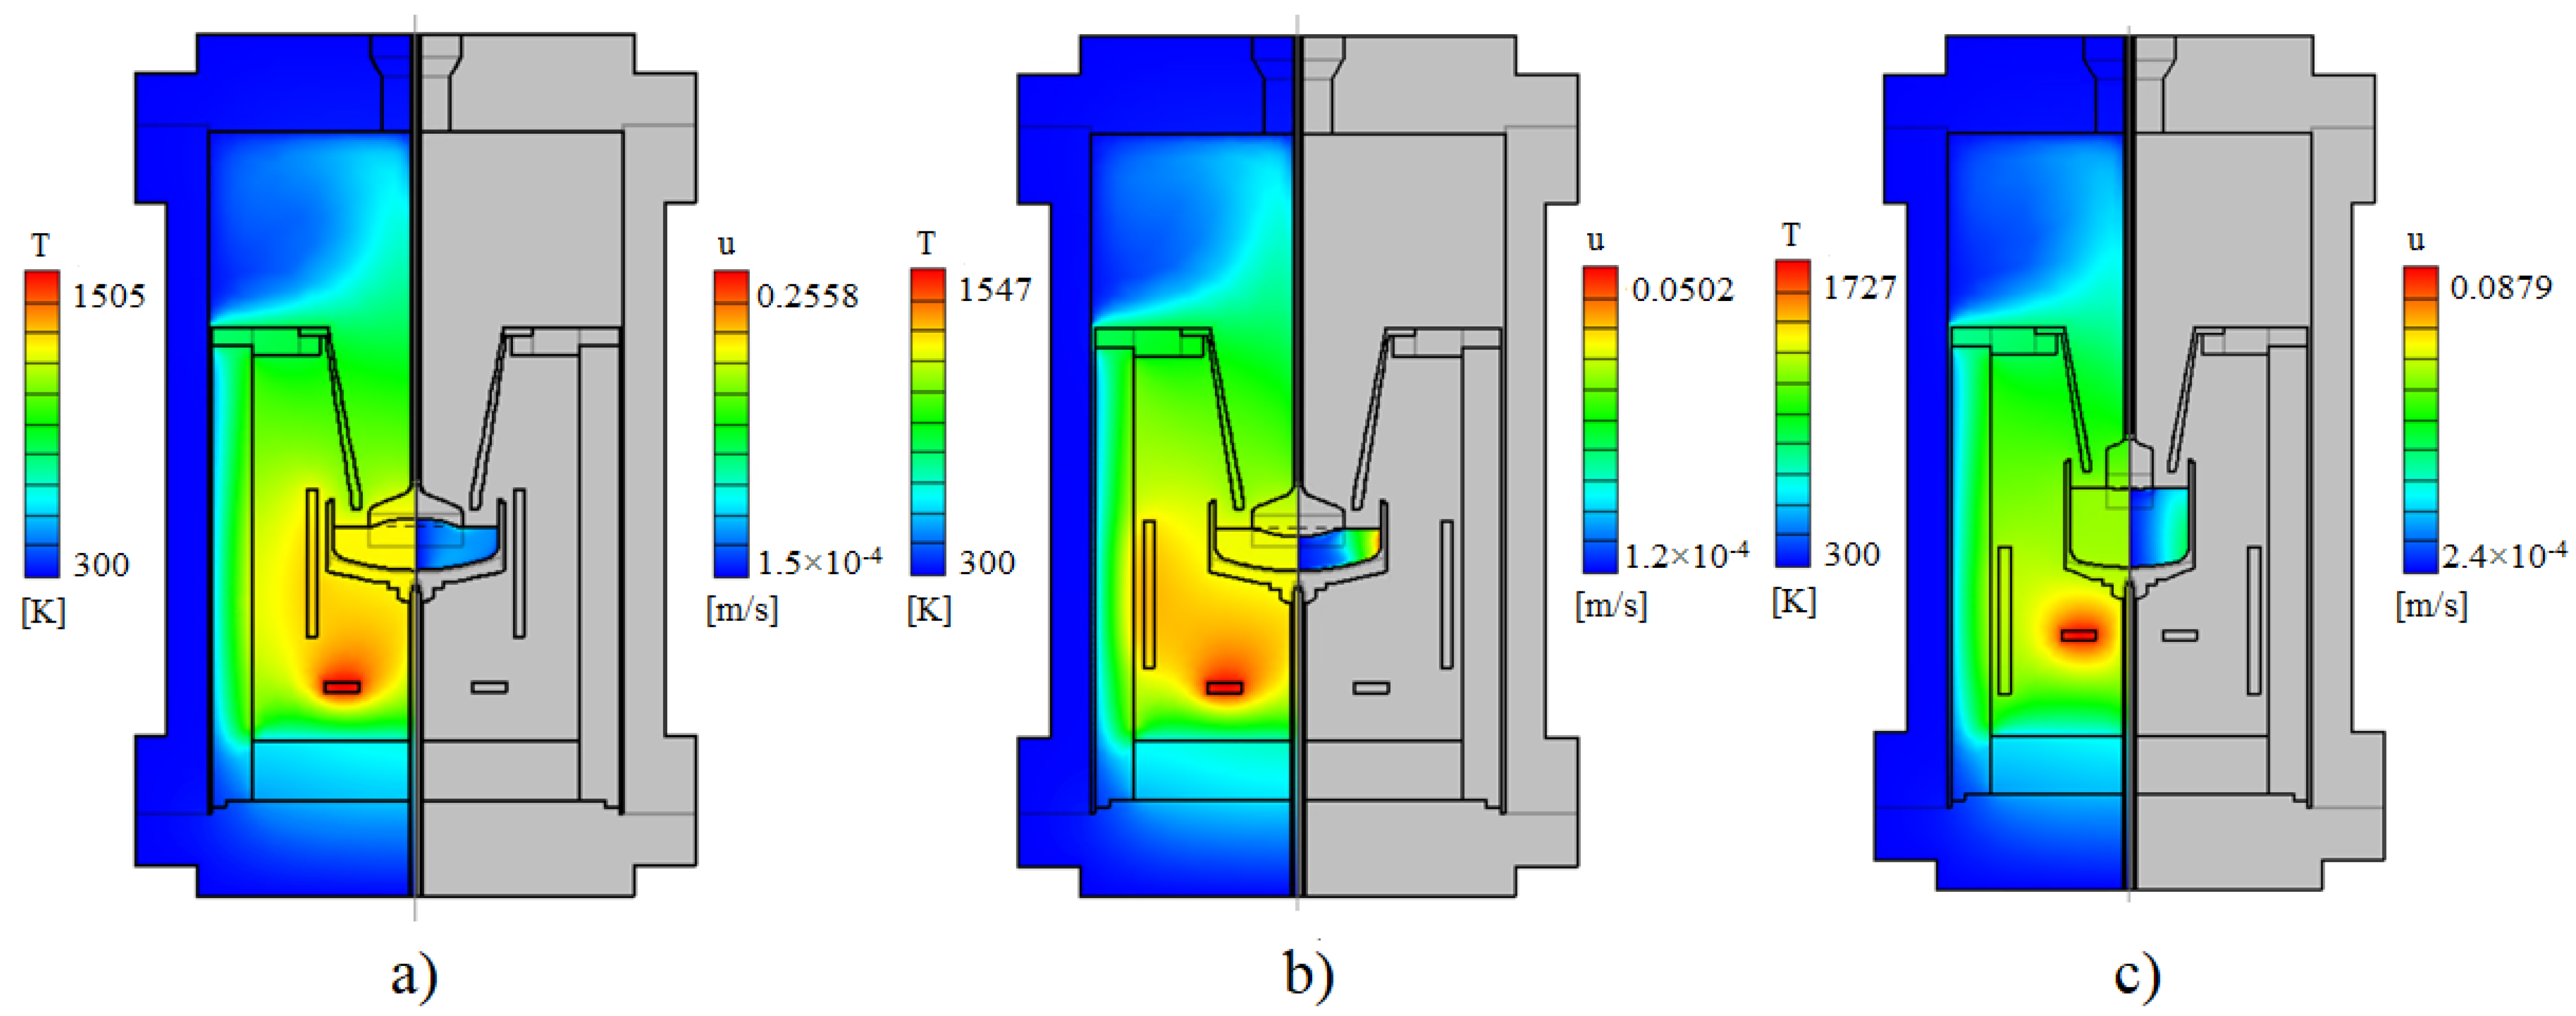
Examples of axisymmetric quasi-steady state CFD simulation results for various furnace designs and growth recipes in a form of temperature and melt velocity distributions in the Cz-furnace are shown in Figure 3. The melt flow patterns reflected the typical superposition of buoyancy-driven convection and forced convection due to crystal and crucible rotation. Interface deflection varied among concave (Figure 3a), convex (Figure 3b), and nearly flat (Figure 3c) depending on the used growth recipe, hot zone design, and materials’ allocation.
3.2. Data Mining and Machine Learning
The resulting values for the correlation coefficients for all inputs and outputs are shown in Figure 4 and Table A1.
The strongest linear correlation between interface deflection y1 and one of the inputs was observed for pulling rate x5. Their correlation coefficient with value rx5,y1 = 0.5877 showed medium-strong positive correlation. This result is in agreement with the experimental observations that higher pulling rates generate more latent heat at the crystallization front and finally more concave interface. Please note that in this study convex interface deflection had a negative value (y1 < 0) and a negative correlation was beneficial for the crystal quality. The strongest linear correlation between the growth rate y2 and one of the inputs was again observed for the pulling rate x5, with a correlation coefficient of rx5,y2 = 0.9999. This finding is supported by crystal growth experiments and is one of the reasons why pulling rates and crystal growth rates are often treated as interchangeable terms. Finally, the strongest positive linear correlation between y3 and other inputs was observed for x5 (the pulling rate) and for x12 (distance from the radiation shield to the melt, i.e., melt gap) with correlation coefficients of rx5,y3 = 0.9781 and rx12,y3 = 0.5517, respectively. Similar results were reported in the literature for Cz-Si growth [5,7]. Additionally, the strong linear correlations were observed between inputs x1 (crystal radius) and x2 (crucible radius) from one side and x13 (melt height) from the other side. The large negative values rx1,x13 = −0.9512 and rx2,x13 = −0.9213 were a consequence of the assumption of constant Ge loading in this study.
The correlation coefficients provided the first simple estimate of the linear dependencies between the examined parameters. However, many dependencies in crystal growth are strongly non-linear and need to be further investigated. A viable solution for studying complex relationships in small data sets is provided by regression trees.
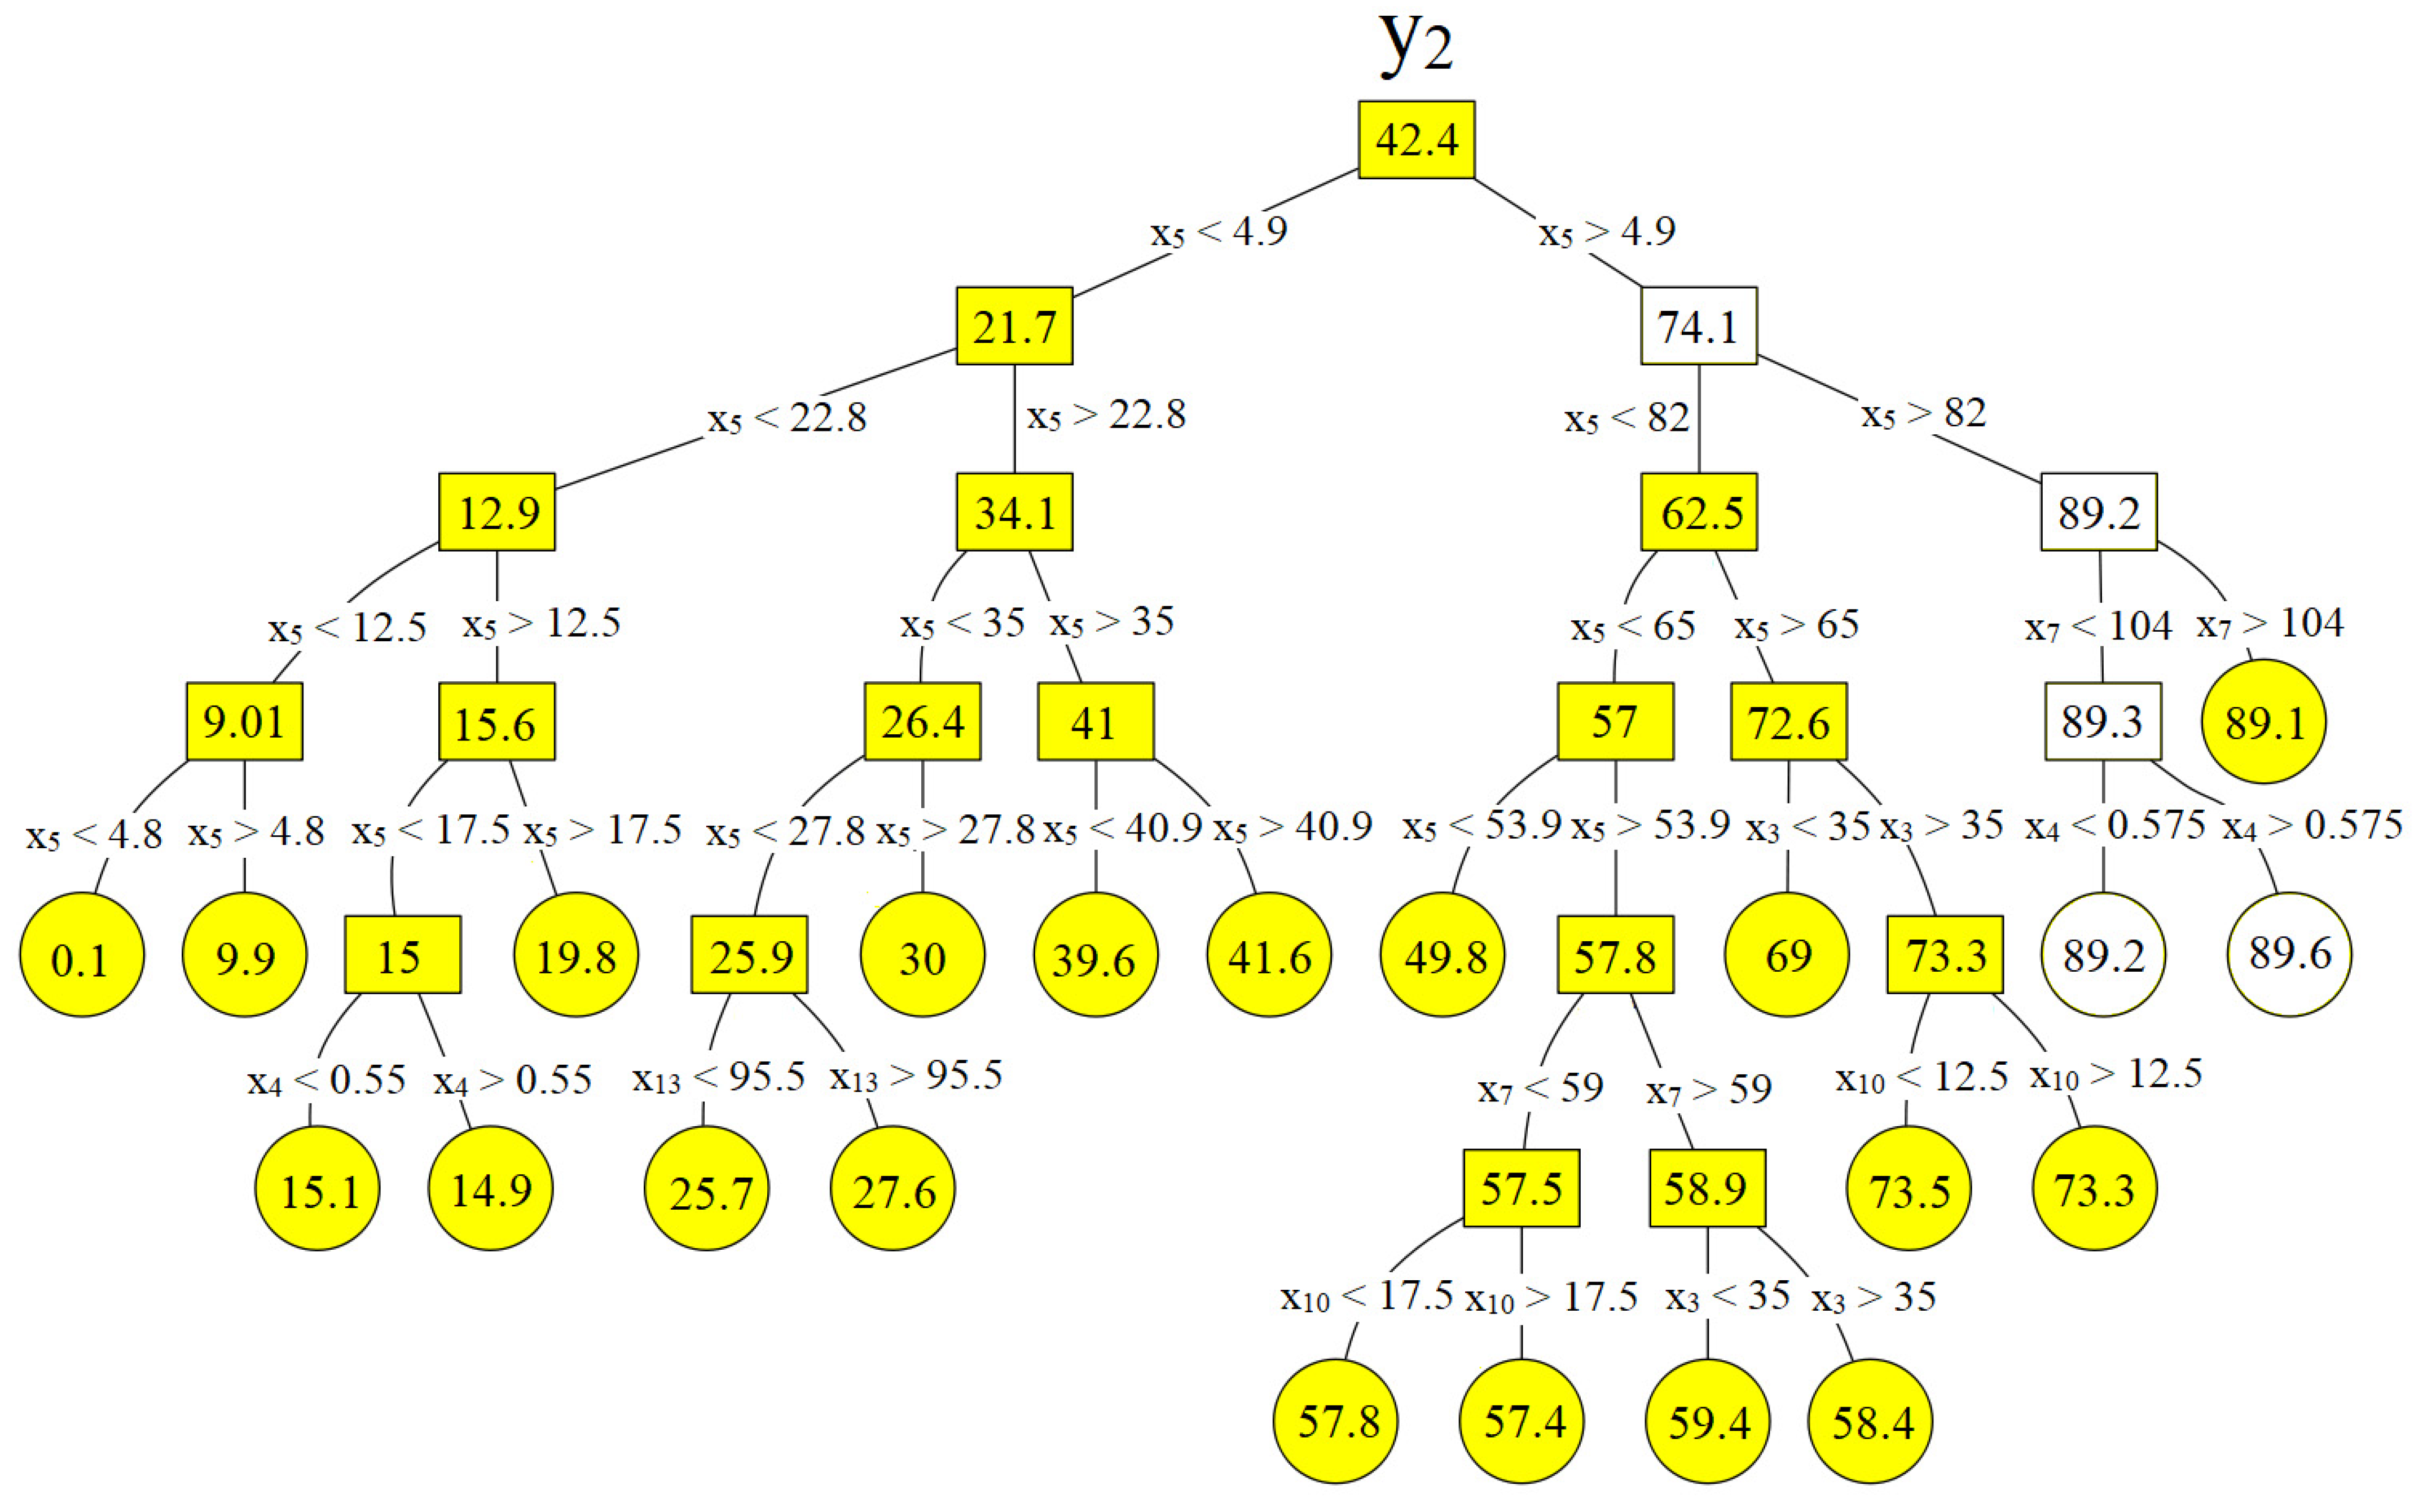
The regression trees for outputs y1–y3, y1,2,3 are given in Figure 5, Figure 6, Figure 7 and Figure 8 and summarized in Table 2, Table 3, Table 4 and Table 5. The value in the root node at the top of each regression tree represents the mean of the examined output yi in all the data in the database. The values in interior nodes and leaf nodes correspond to the mean value of output yi in the set of data remaining over the node after the last splitting. The root mean square error (RMSE) for each split is given in Table A2 in appendix. The path from the root to the leaf at the bottom of the tree indicates the influence of a given input xi on the output yi under study, with the highest relevance at the top and lowest at the bottom.
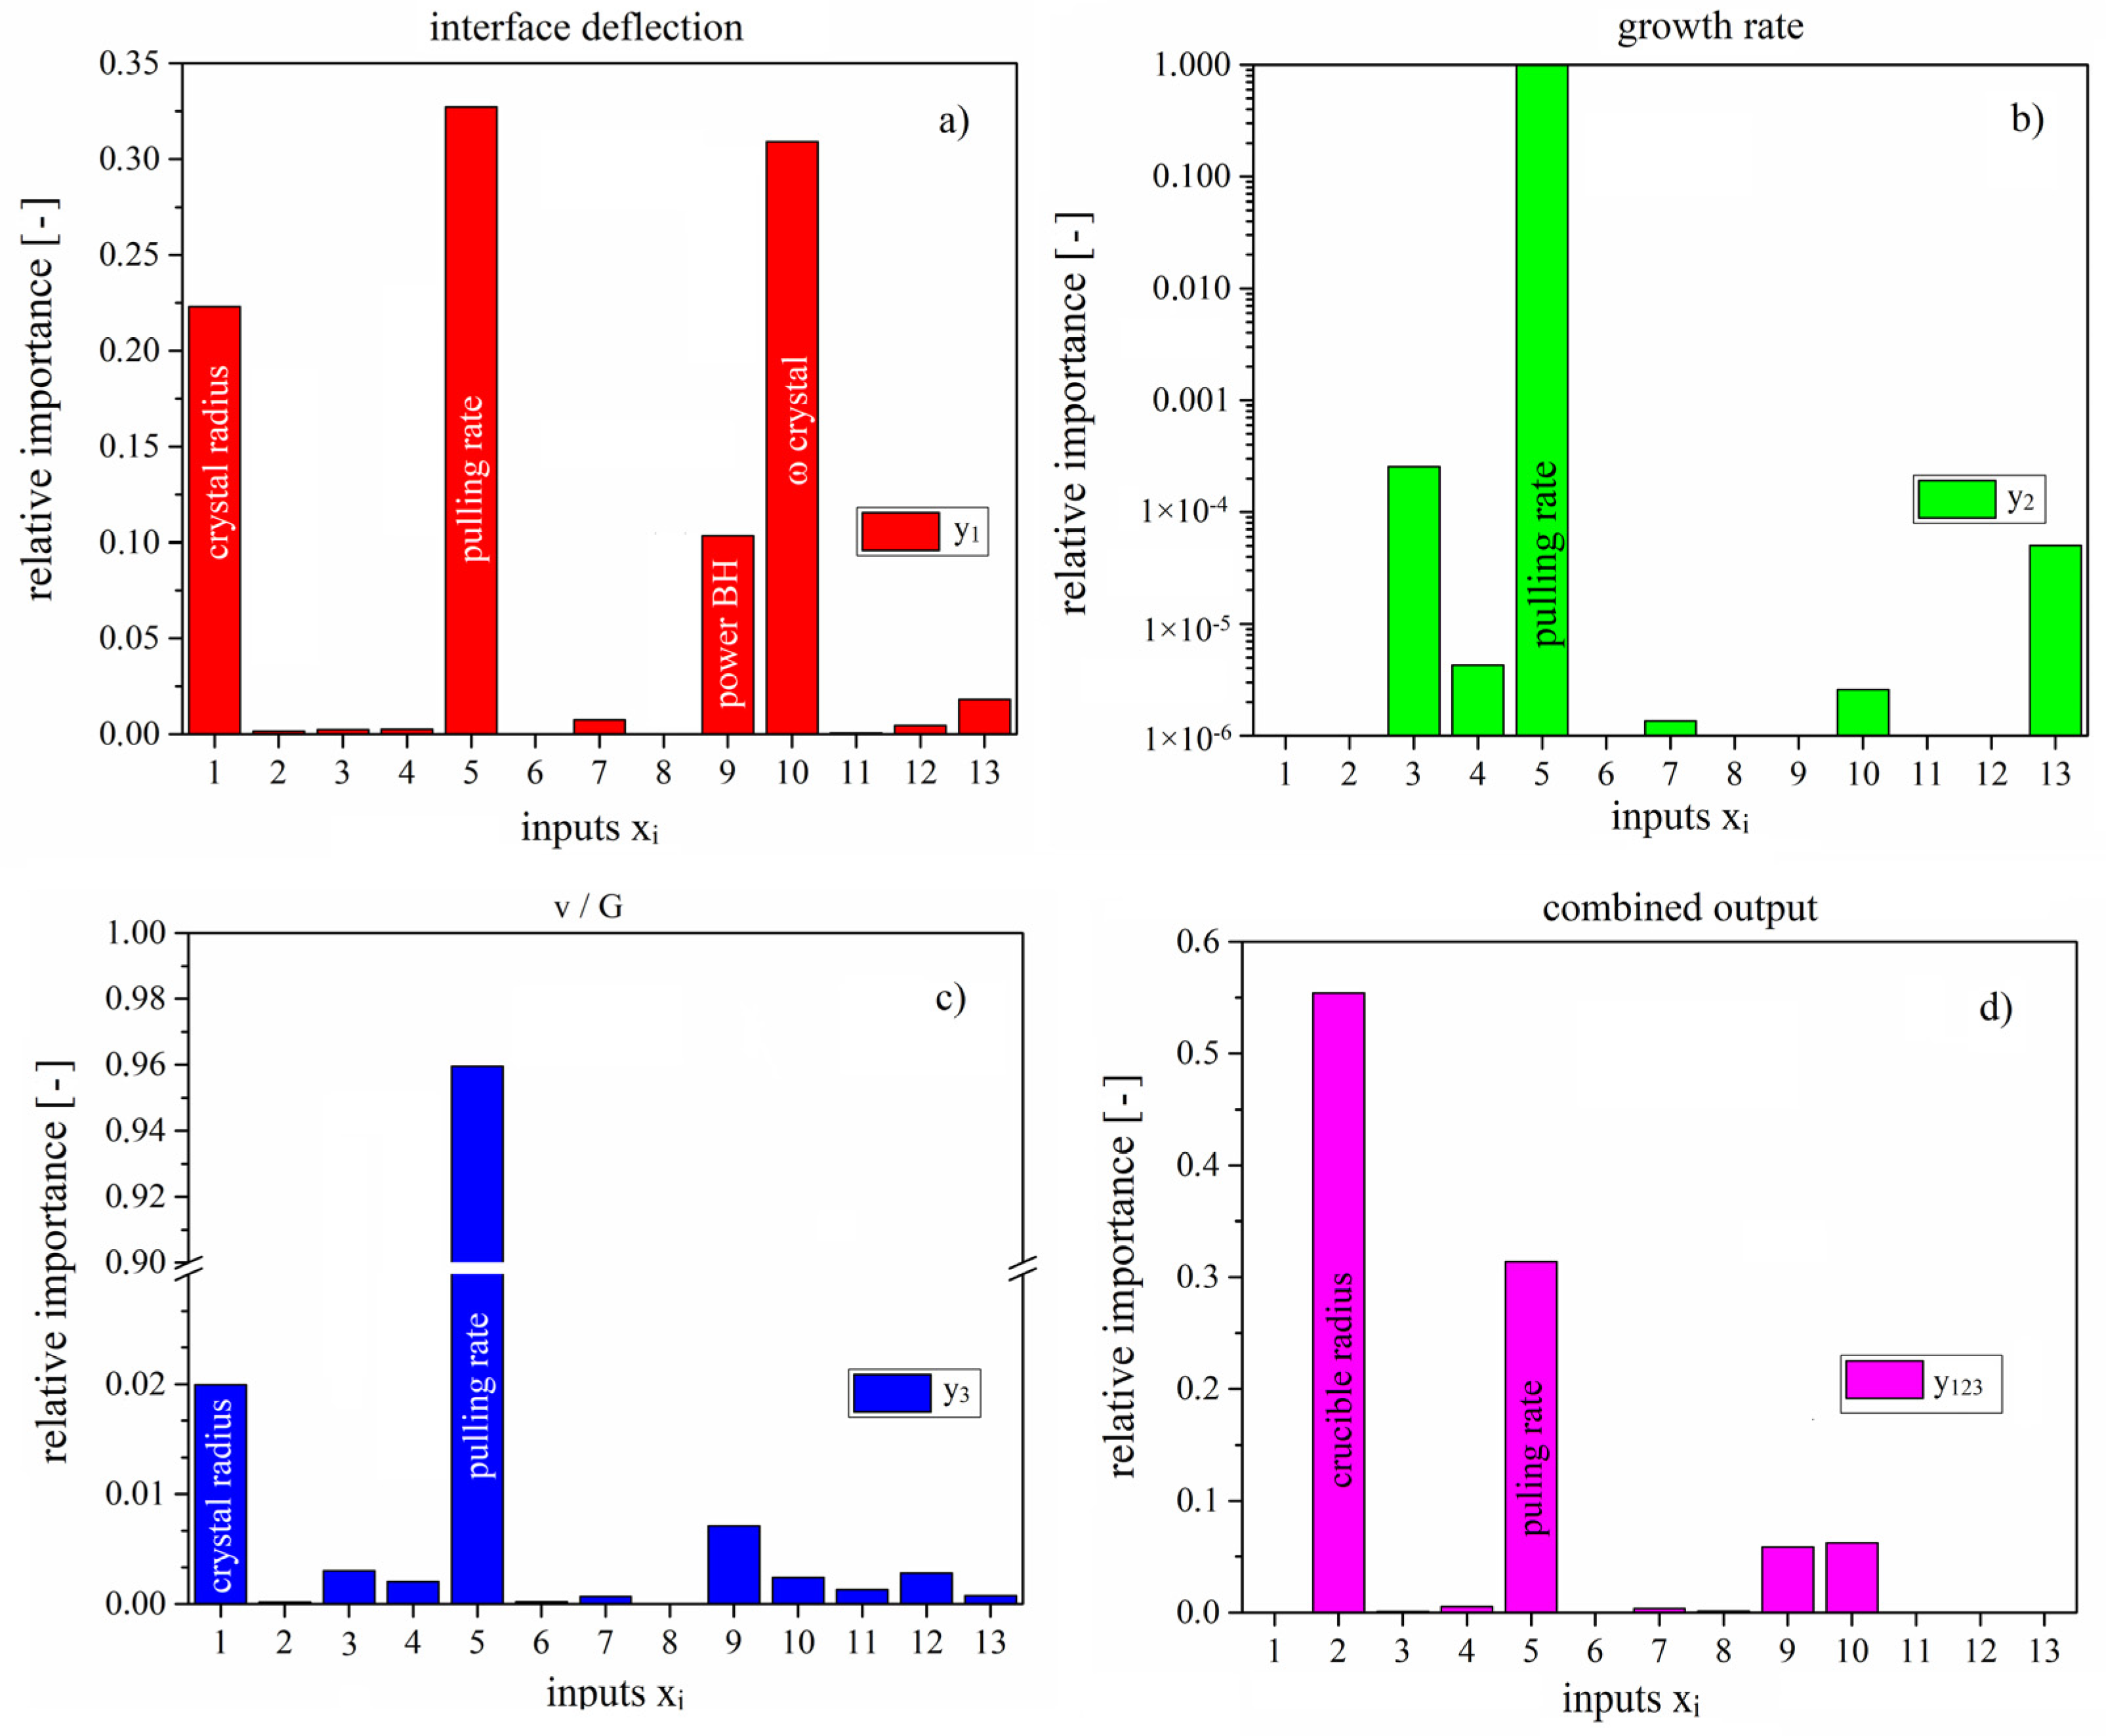
The resulting RT for interface deflection y1 reveals x5, followed by x10 and x9 as the most decisive inputs for the favorable flat or slightly convex interface shape (interface deflection y1 ≤ 0, the nodes marked white in the tree graph in Figure 5). Their importance decreased in the order mentioned above. The most decisive input was the pulling rate x5, which had a deteriorating effect on the interface deflection, i.e., x5 should be below 22.8 mm/min to strongly reduce y1 from average y1 = 5.84 mm to average y1 = 1.4 mm. All decisive inputs and ranges of their optimal values that assured the Cz-Ge growth with nearly flat s/l interface, derived from RT analysis, are given in Table 2. From these results, it was also possible to derive the relative feature importance for y1, as shown in Figure 9a. Again, the most important input concerning its influence on interface deflection had a pulling rate x5 (32.7%), followed by crystal rotational rate x10 (30.91%), crystal radius x1 (22.31%), and power of bottom heater x9 (10.34%). The importance of the input x1 was high but not conducive to interface flattening. Therefore, x1 did not appear in the branches marked in white, leading to the optimal value of the interface deflection in Figure 5.
The resulting RT for the crystal growth rate y2 gave the pulling rate x5, followed by the position of the side heater x7 and the emissivity of the radiation shield x4 as the most decisive inputs for the favorable crystal yield (i.e., the maximum value of y2, corresponding to the nodes in the tree graph in Figure 6 marked white). Their importance decreased in the order mentioned above. All decisive inputs for y2 and ranges of their optimal values are given in Table 3. The relative inputs’ importance for y2 is shown in Figure 9b. The pulling rate x5 with 99.96% influenced the growth rate, followed by 0.025% and 0.005% relative influence of x3 and x13, respectively. These ML/RT results confirmed the general assumption in Cz crystal growth practice of the equivalence between the growth rate and the pulling rate. In view of this, ML results can serve as the last trusted criterion to explain various assumptions, free from human errors.
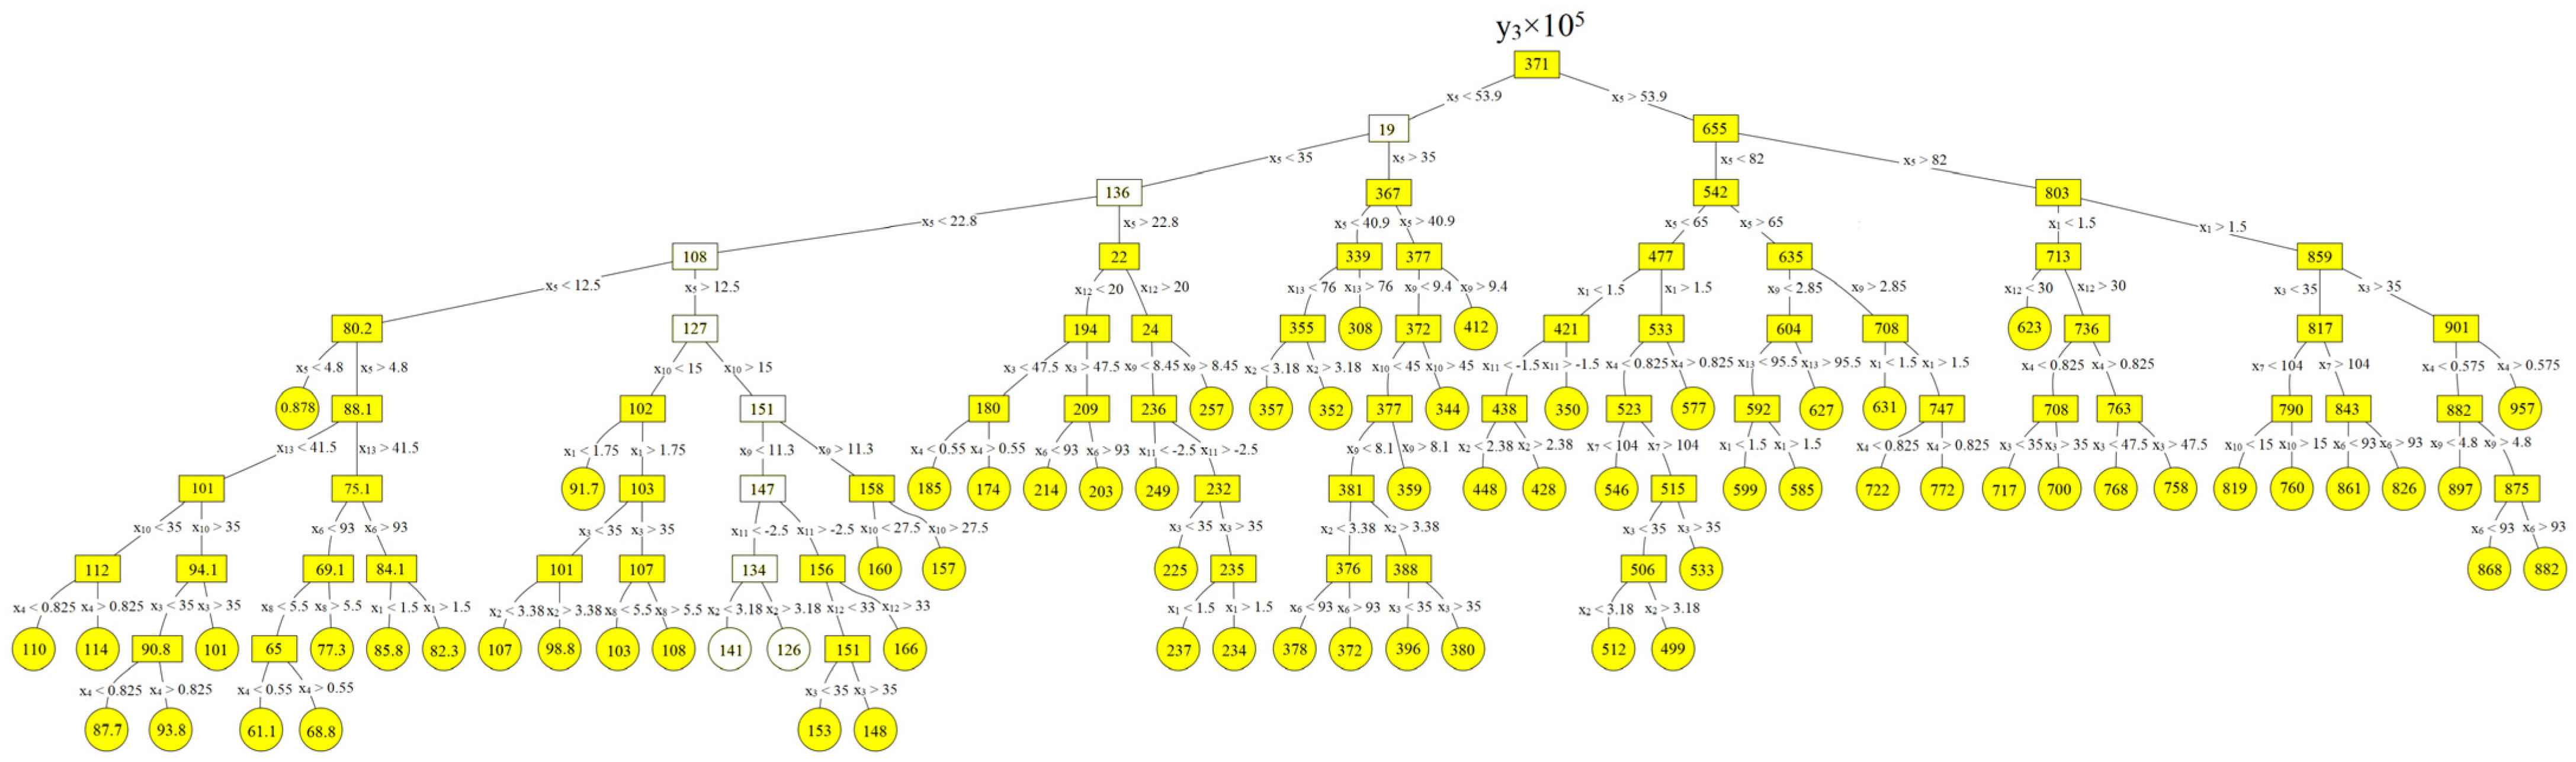
The resulting RT for the output y3 (ratio of growth rate and axial temperature gradient in the crystal) is shown in Figure 7. The most decisive inputs for the favorable value y3 according to the Voronkov criteria were x5, x10, x9, x11, and x2 (the nodes in Figure 7 are marked in white). As already mentioned, the Voronkov criteria for defect-free Cz-Si crystals can only be applied to Cz-Ge if the crystal is doped with Ga and Sb. The optimal values of the most critical inputs are given in Table 4, and the relative importance of all inputs is shown in Figure 9c. The pulling rate x5 with 95.96% influenced the y3, followed by 1.99% and 0.71% relative influence of x1 and x9, respectively.
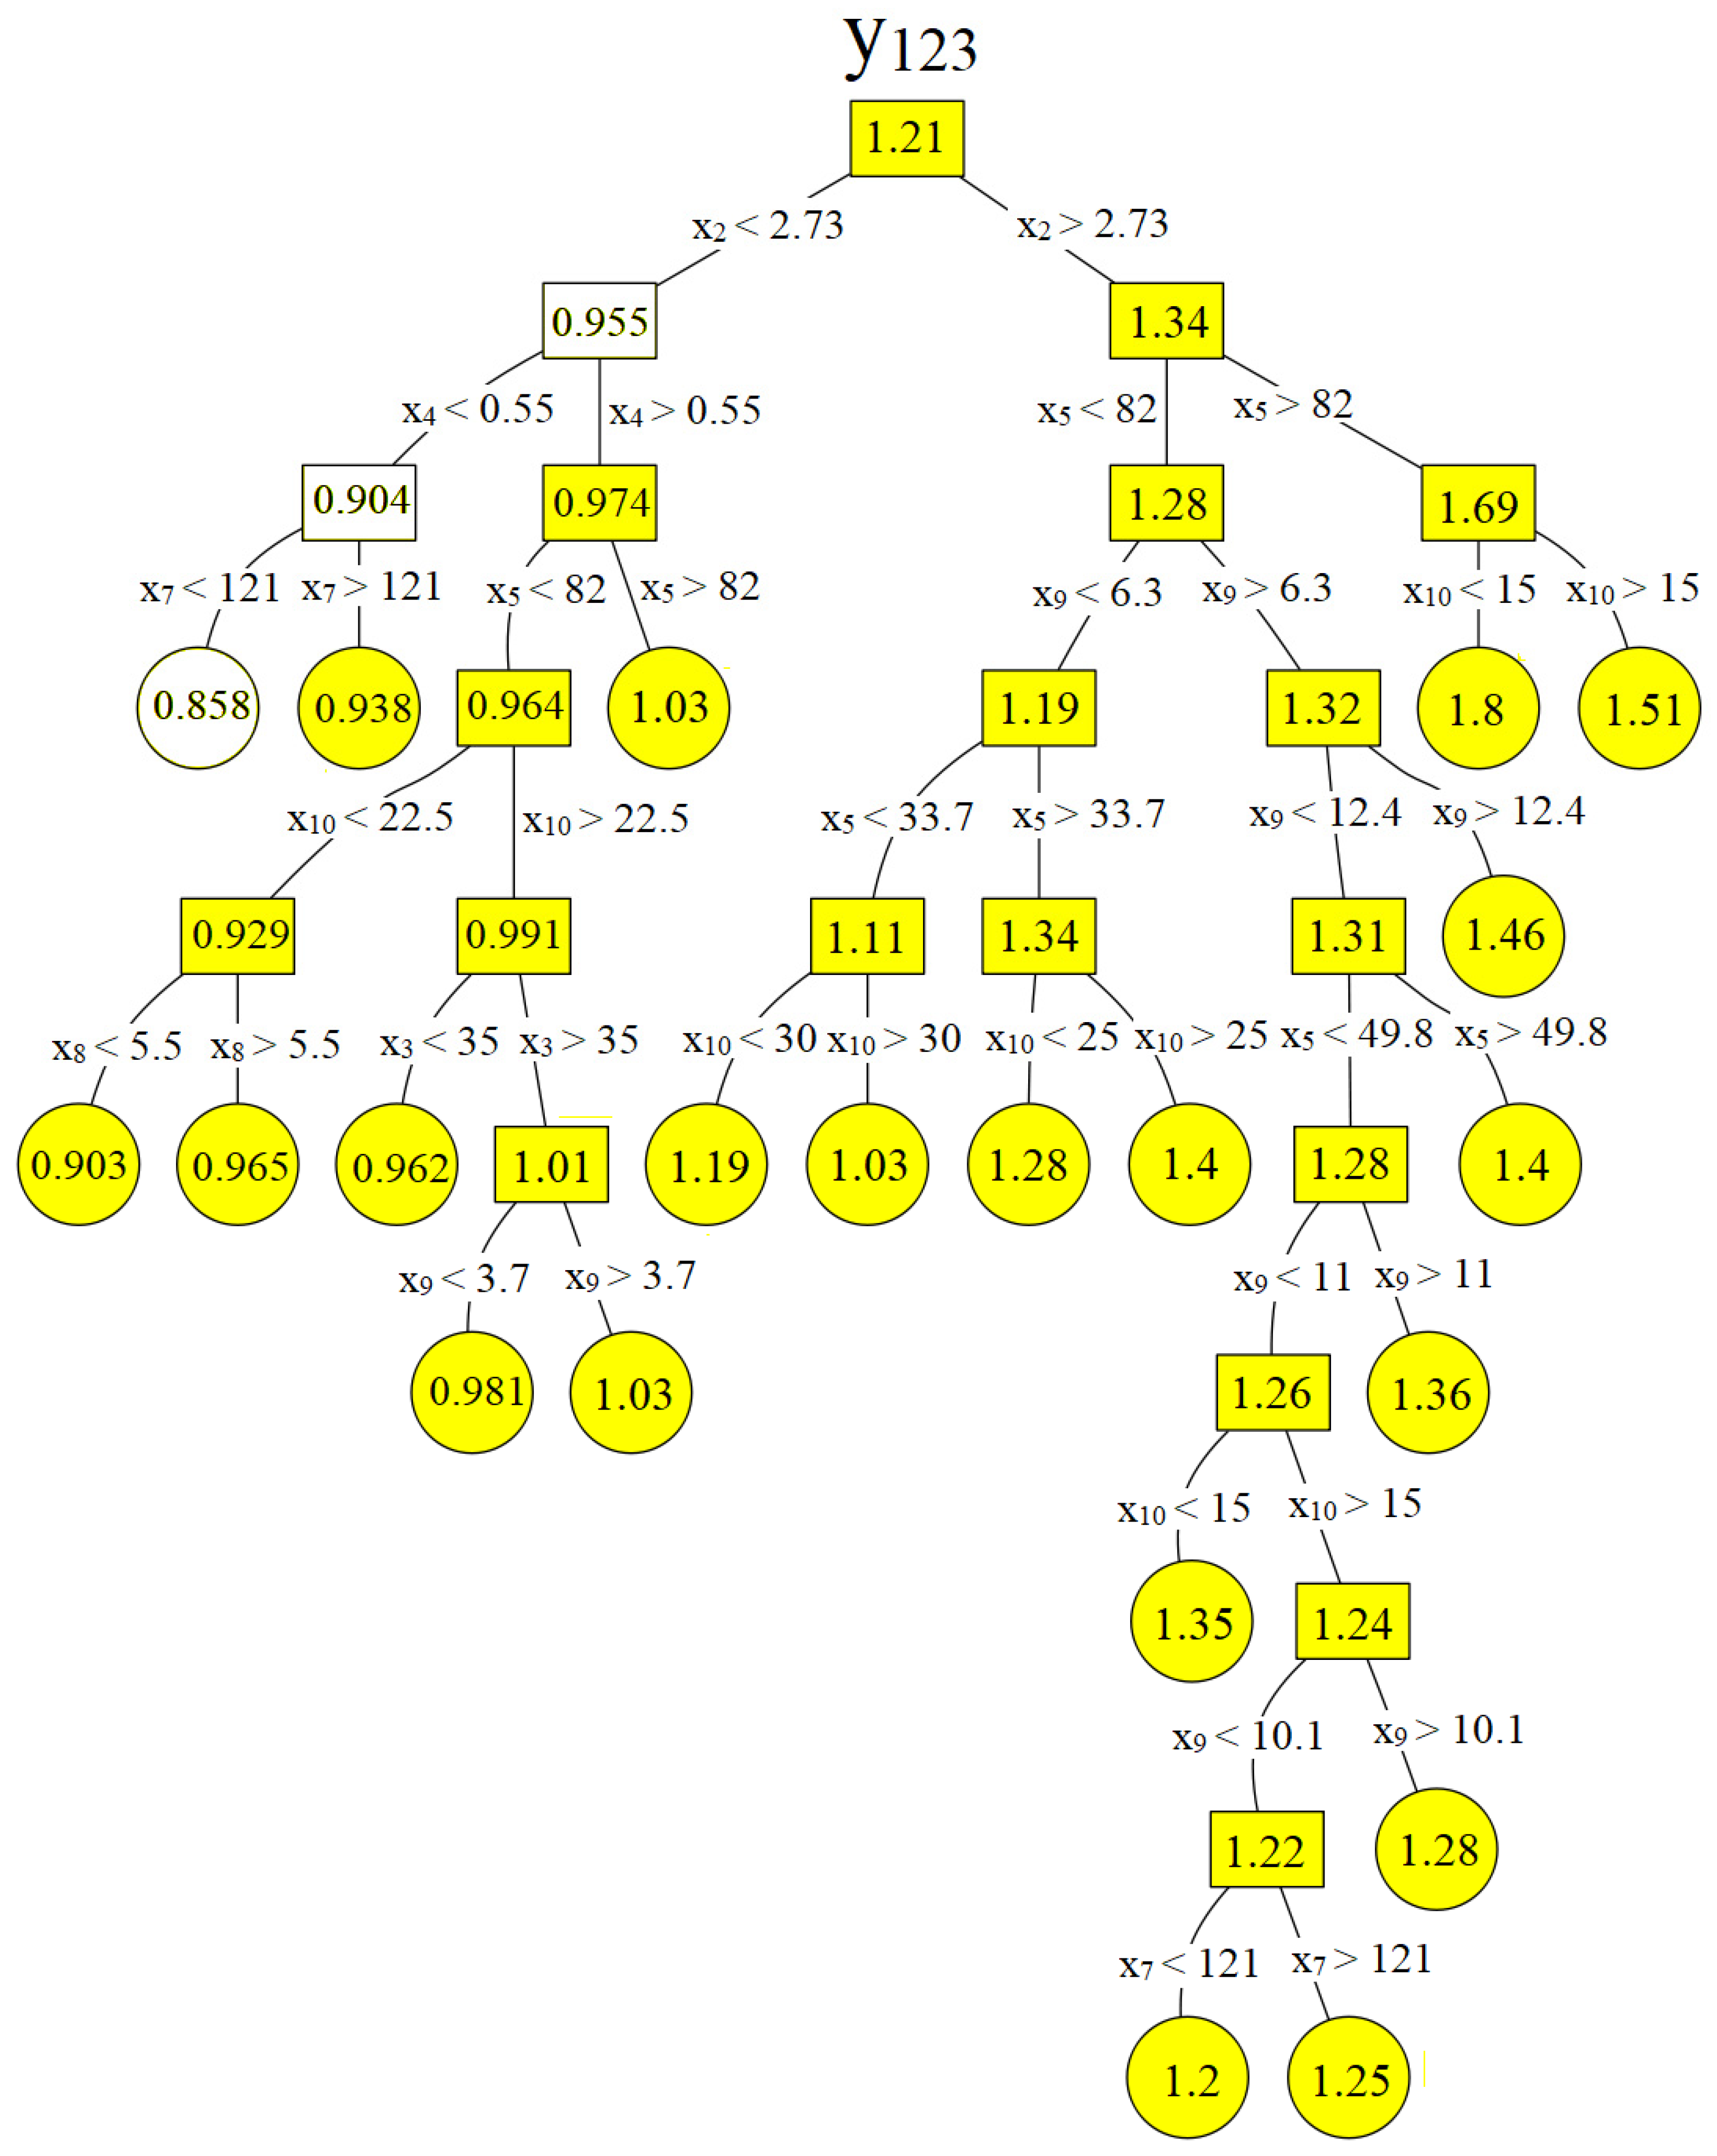
The RT for the combined output y123 is given in Figure 8. The favorable values of the input parameters correspond to the minimal leaf mean value of the objective function y123 = 0.878. The most decisive inputs for the favorable mean value y123 were x2, x4, and x7 (the white nodes in Figure 8). Their related data ranges are given in Table 5, and the relative importance of all inputs is shown in Figure 9d.
In summary, our data-driven study based on the decision trees and synthetic training data revealed the key furnace design and process parameters, their importance, and the ranges of their values for achieving high-quality, high-yield Cz-Ge crystals. Interestingly, the process parameters, especially the pulling rate, had a substantially larger impact on all singular outputs than the furnace hot-zone design parameters. Among the latter, only the crucible size, the axial position of the side heater, and the material properties of the radiation shield were relevant.
In the case of a combined output y123 with equal contribution of each singular output y1–y3, the obtained results were different, i.e., the furnace design parameters such as crucible size, the axial position of the side heater, and the material properties of the radiation shield were more important than the pulling rate. However, the last result strongly depended on the definition of y123 (i.e., on the weighting of contributions of individual outputs and on the justification of consideration of y3) and could not be generalized.
4. Conclusions
The decision trees are an excellent choice for studying Cz-Ge crystal growth if one needs methods with short training times and acceptable prediction accuracy based on low-volume data (77 in this study) that are able to provide guidelines for understanding the influences of the furnace design and the process parameters on the process economy and crystal quality. The decision trees also provide ranges of 13 input parameters (7 geometric, 1 radiation shield material choice, and 5 crystal growth process parameters) where optimal values of three targeted output variables (s/l interface deflection, growth rate, and v/G ratio) can be found.
Compared to the standard approach to furnace and process development based solely on CFD simulations, e.g., [4,5], characterized by accurate but slow predictions with no ability to generalize and more novel deep learning methods that require a large amount of training data to be accurate and have a black-box nature, e.g., [32], decision trees offer high interpretability with acceptable accuracy at low cost. Against this background, decision trees are a recommendable steppingstone in the development of new processes and equipment for various grown materials and growth techniques before applying high-prediction accuracy methods such as ANN.
Author Contributions
Conceptualization, N.D. and M.H.; methodology, N.D. and M.H.; software, M.H. and N.D.; investigation, M.H., N.D. and X.T.; data generation, X.T., G.K.C. and N.D.; writing—original draft preparation, N.D.; writing—review and editing, N.D., M.H., G.K.C. and X.T.; funding acquisition, N.D. and M.H. All authors have read and agreed to the published version of the manuscript.
Funding
The research was partly funded by the German Research Foundation, project number 467401796.
Data Availability Statement
Data available in the IKZ repository.
Acknowledgments
Proofreading of the article by Kevin-Peter Gradwohl is gratefully acknowledged.
Conflicts of Interest
The authors declare no conflict of interest.
Nomenclature
| cp | heat capacity (J/kg/K) |
| g | gravity constant (m/s2) |
| ΔH | latent heat (J/kg) |
| u | velocity (m/s) |
| v | growth rate (m/s) |
| T | temperature (K) |
| t | time (s) |
| x1 | crystal radius (inch) |
| x2 | crucible radius (inch) |
| x3 | distance between crucible and side heater (mm) |
| x4 | emissivity of the radiation shield (-) |
| x5 | pulling rate (mm/h) |
| x6 | distance between crucible and bottom heater (mm) |
| x7 | axial displacement of side heater (mm) |
| x8 | power of side heater (kW) |
| x9 | power of bottom heater (kW) |
| x10 | crystal rotational rate (rpm) |
| x11 | crucible rotational rate (rpm) |
| x12 | distance from the radiation shield to the melt (mm) |
| x13 | melt height (mm) |
| y1 | interface deflection (mm) |
| y2 | growth rate (mm/h) |
| y3 | ratio of the growth rate and axial temperature gradient in crystal v/G (cm2/K min) |
| y123 | combined output (-) |
| Symbols | |
| α | volume expansion coefficient (1/K) |
| λ | heat conductivity (W/m/K) |
| ρ | density (kg/m3) |
| τ | stress tensor (Pa) |
| || | absolute value |
| {} | normalized value |
| Subscripts | |
| l | liquid |
| m | melting |
| s | solid |
Appendix A

Table A1.
Correlation coefficients for input and output variables x1–x13, y1–y3.
| x1 | x2 | x3 | x4 | x5 | x6 | x7 | x8 | x9 | x10 | x11 | x12 | x13 | |
|---|---|---|---|---|---|---|---|---|---|---|---|---|---|
| x1 | 1.00 | 0.77 | −0.24 | −0.20 | −0.19 | 0.10 | 0.00 | 0.07 | 0.21 | 0.16 | −0.10 | 0.09 | −0.95 |
| x2 | 0.77 | 1.00 | −0.20 | −0.17 | −0.48 | −0.01 | −0.01 | 0.14 | 0.38 | 0.21 | −0.05 | −0.55 | −0.92 |
| x3 | −0.24 | −0.20 | 1.00 | 0.05 | 0.00 | −0.02 | 0.01 | −0.06 | 0.23 | −0.02 | 0.02 | 0.00 | 0.22 |
| x4 | −0.20 | −0.17 | 0.05 | 1.00 | −0.06 | 0.03 | 0.01 | 0.04 | −0.02 | 0.25 | 0.30 | 0.02 | 0.20 |
| x5 | −0.19 | −0.48 | 0.00 | −0.06 | 1.00 | 0.13 | 0.07 | −0.15 | −0.26 | −0.28 | −0.21 | 0.49 | 0.33 |
| x6 | 0.10 | −0.01 | −0.02 | 0.03 | 0.13 | 1.00 | −0.04 | 0.09 | 0.08 | −0.14 | −0.03 | 0.15 | −0.06 |
| x7 | 0.00 | −0.01 | 0.01 | 0.01 | 0.07 | −0.04 | 1.00 | −0.07 | 0.15 | −0.02 | 0.00 | 0.02 | 0.02 |
| x8 | 0.07 | 0.14 | −0.06 | 0.04 | −0.15 | 0.09 | −0.07 | 1.00 | −0.75 | −0.08 | 0.07 | −0.11 | −0.09 |
| x9 | 0.21 | 0.38 | 0.23 | −0.02 | −0.26 | 0.08 | 0.15 | −0.75 | 1.00 | 0.15 | −0.07 | −0.29 | −0.31 |
| x10 | 0.16 | 0.21 | −0.02 | 0.25 | −0.28 | −0.14 | −0.02 | −0.08 | 0.15 | 1.00 | 0.57 | −0.13 | −0.21 |
| x11 | −0.10 | −0.05 | 0.02 | 0.30 | −0.21 | −0.03 | 0.00 | 0.07 | −0.07 | 0.57 | 1.00 | −0.07 | 0.07 |
| x12 | 0.09 | −0.55 | 0.00 | 0.02 | 0.49 | 0.15 | 0.02 | −0.11 | −0.29 | −0.13 | −0.07 | 1.00 | 0.20 |
| x13 | −0.95 | −0.92 | 0.22 | 0.20 | 0.33 | −0.06 | 0.02 | −0.09 | −0.31 | −0.21 | 0.07 | 0.20 | 1.00 |
| y1 | 0.30 | −0.01 | 0.00 | 0.12 | 0.59 | 0.20 | 0.25 | −0.29 | 0.14 | 0.09 | −0.01 | 0.38 | −0.19 |
| y2 | −0.19 | −0.48 | 0.00 | −0.06 | 1.00 | 0.13 | 0.07 | −0.15 | −0.26 | −0.28 | −0.21 | 0.49 | 0.34 |
| y3 | −0.06 | −0.41 | 0.03 | −0.01 | 0.98 | 0.16 | 0.08 | −0.13 | −0.24 | −0.25 | −0.20 | 0.55 | 0.22 |
Table A2.
The RMSE values for each split in regression trees for y1, y2, y3 and y123. The nodes are numbered from the top of the tree down and from the left to the right at each tree depth.
Table A2.
The RMSE values for each split in regression trees for y1, y2, y3 and y123. The nodes are numbered from the top of the tree down and from the left to the right at each tree depth.
| y1 | y2 | y3 | y123 | y1 | y3 | y1 | y3 | |||
|---|---|---|---|---|---|---|---|---|---|---|
| Node | RMSE | RMSE | RMSE | RMSE | Node | RMSE | RMSE | Node | RMSE | RMSE |
| 1 | 7.59 × 1000 | 2.87 × 1001 | 2.63 × 10−03 | 2.52 × 10−01 | 42 | 1.80 × 10−01 | 1.09 × 10−04 | 83 | 0.00 × 1000 | 0.00 × 1000 |
| 2 | 6.47 × 1000 | 1.18 × 1001 | 1.11 × 10−03 | 6.62 × 10−02 | 43 | 5.89 × 10−01 | 0.00 × 1000 | 84 | 4.44 × 10⁻¹⁶ | 0.00 × 1000 |
| 3 | 6.24 × 1000 | 1.44 × 1001 | 1.63 × 10−03 | 2.08 × 10−01 | 44 | 6.24 × 10−01 | 9.88 × 10−05 | 85 | 0.00 × 1000 | 0.00 × 1000 |
| 4 | 3.47 × 1000 | 3.91 × 1000 | 5.92 × 10−04 | 6.26 × 10−02 | 45 | 6.24 × 10−01 | 4.34 × 10⁻¹⁹ | 86 | 8.88 × 10⁻¹⁶ | 0.00 × 1000 |
| 5 | 4.62 × 1000 | 7.39 × 1000 | 2.64 × 10−04 | 5.67 × 10−02 | 46 | 3.55 × 10⁻¹⁵ | 1.81 × 10−04 | 87 | 0.00 × 1000 | 0.00 × 1000 |
| 6 | 1.87 × 1000 | 7.72 × 1000 | 1.06 × 10−03 | 1.37 × 10−01 | 47 | 4.08 × 10−01 | 8.67 × 10⁻¹⁹ | 88 | 6.10 × 10−01 | 0.00 × 1000 |
| 7 | 5.15 × 1000 | 1.39 × 10−01 | 8.89 × 10−04 | 1.68 × 10−01 | 48 | 2.18 × 1000 | 6.78 × 10−05 | 89 | 3.75 × 10−01 | 6.90 × 10−05 |
| 8 | 0.00 × 1000 | 2.82 × 1000 | 3.58 × 10−04 | 5.55 × 10−02 | 49 | 1.17 × 1000 | 0.00 × 1000 | 90 | 2.16 × 10−01 | 2.06 × 10−05 |
| 9 | 2.15 × 1000 | 1.58 × 1000 | 2.65 × 10−04 | 4.27 × 10−02 | 50 | 0.00 × 1000 | 0.00 × 1000 | 91 | 1.00 × 10−01 | 5.37 × 10−05 |
| 10 | 2.92 × 1000 | 1.41 × 1000 | 2.23 × 10−04 | 4.97 × 10−02 | 51 | 0.00 × 1000 | 2.49 × 10−04 | 92 | 0.00 × 1000 | 6.60 × 10−05 |
| 11 | 2.33 × 1000 | 9.17 × 10−01 | 1.95 × 10−04 | 6.00 × 10−02 | 52 | 5.00 × 10−01 | 8.38 × 10−05 | 93 | 0.00 × 1000 | 1.78 × 10−05 |
| 12 | 1.67 × 1000 | 2.37 × 1000 | 6.49 × 10−04 | 1.41 × 10−01 | 53 | 8.88 × 10⁻¹⁶ | 5.03 × 10−05 | 94 | 4.44 × 10⁻¹⁶ | 3.45 × 10−05 |
| 13 | 1.15 × 1000 | 1.61 × 1000 | 8.15 × 10−04 | 1.08 × 10−01 | 54 | 0.00 × 1000 | 2.96 × 10−04 | 95 | 0.00 × 1000 | 2.64 × 10−05 |
| 14 | 1.61 × 1000 | 2.05 × 10−01 | 5.17 × 10−04 | 7.30 × 10−02 | 55 | 0.00 × 1000 | 1.75 × 10−04 | 96 | 2.22 × 10⁻¹⁶ | 7.01 × 10−05 |
| 15 | 2.64 × 1000 | 0.00 × 1000 | 5.49 × 10−04 | 1.19 × 10−01 | 56 | 2.50 × 10−01 | 1.19 × 10−04 | 97 | 0.00 × 1000 | 7.62 × 10−05 |
| 16 | 1.12 × 1000 | 0.00 × 1000 | 2.94 × 10−04 | 3.60 × 10−02 | 57 | 2.22 × 10⁻¹⁶ | 0.00 × 1000 | 98 | 8.88 × 10⁻¹⁶ | 0.00 × 1000 |
| 17 | 2.05 × 1000 | 0.00 × 1000 | 2.64 × 10−04 | 4.16 × 10−02 | 58 | 0.00 × 1000 | 9.60 × 10−05 | 99 | 0.00 × 1000 | 3.40 × 10−06 |
| 18 | 2.03 × 1000 | 1.12 × 10−01 | 1.55 × 10−04 | 8.84 × 10−02 | 59 | 7.07 × 10−01 | 9.02 × 10−05 | 100 | 0.00 × 1000 | 0.00 × 1000 |
| 19 | 2.12 × 1000 | 0.00 × 1000 | 1.14 × 10−04 | 7.98 × 10−02 | 60 | 1.14 × 1000 | 0.00 × 1000 | 101 | 0.00 × 1000 | 1.65 × 10−05 |
| 20 | 7.07 × 10−01 | 6.28 × 10−01 | 2.68 × 10−05 | 1.03 × 10−01 | 61 | 6.62 × 10−01 | 4.33 × 10−05 | 102 | 0.00 × 1000 | 2.68 × 10−05 |
| 21 | 1.15 × 1000 | 3.55 × 10⁻¹⁵ | 4.34 × 10⁻¹⁹ | 1.55 × 10−02 | 62 | 0.00 × 1000 | 1.32 × 10−04 | 103 | 0.00 × 1000 | 8.12 × 10−05 |
| 22 | 6.61 × 10−01 | 7.11 × 10⁻¹⁵ | 1.54 × 10−04 | 2.46 × 10−02 | 63 | 1.78 × 10⁻¹⁵ | 1.50 × 10−05 | 104 | 8.16 × 10−01 | 6.55 × 10−05 |
| 23 | 0.00 × 1000 | 0.00 × 1000 | 0.00 × 1000 | 6.93 × 10−03 | 64 | 0.00 × 1000 | 0.00 × 1000 | 105 | 5.00 × 10−01 | 0.00 × 1000 |
| 24 | 8.54 × 10−01 | 0.00 × 1000 | 3.62 × 10−04 | 4.81 × 10−02 | 65 | 0.00 × 1000 | 0.00 × 1000 | 106 | 0.00 × 1000 | 0.00 × 1000 |
| 25 | 0.00 × 1000 | 6.20 × 10−01 | 2.73 × 10−04 | 2.87 × 10−02 | 66 | 0.00 × 1000 | 0.00 × 1000 | 107 | 0.00 × 1000 | 0.00 × 1000 |
| 26 | 0.00 × 1000 | 0.00 × 1000 | 1.72 × 10−04 | 4.37 × 10−02 | 67 | 0.00 × 1000 | 0.00 × 1000 | 108 | 0.00 × 1000 | 0.00 × 1000 |
| 27 | 1.14 × 1000 | 1.26 × 10−01 | 5.86 × 10−04 | 2.81 × 10−02 | 68 | 1.00 × 10−01 | 0.00 × 1000 | 109 | 4.90 × 10−01 | 0.00 × 1000 |
| 28 | 2.15 × 1000 | 9.43 × 10−02 | 0.00 × 1000 | 6.82 × 10−02 | 69 | 1.00 × 10−01 | 4.90 × 10−05 | 110 | 0.00 × 1000 | 3.06 × 10−05 |
| 29 | 9.43 × 10−01 | 0.00 × 1000 | 2.81 × 10−04 | 2.34 × 10−02 | 70 | 2.00 × 10−01 | 8.04 × 10−05 | 111 | 0.00 × 1000 | 0.00 × 1000 |
| 30 | 0.00 × 1000 | 4.33 × 10−02 | 3.62 × 10−04 | 9.16 × 10−02 | 71 | 0.00 × 1000 | 4.34 × 10⁻¹⁹ | 112 | 8.16 × 10−02 | 3.86 × 10−05 |
| 31 | 8.16 × 10−01 | 7.45 × 10−02 | 3.39 × 10−04 | 8.80 × 10−02 | 72 | 2.50 × 10−01 | 2.02 × 10−06 | 113 | 0.00 × 1000 | 1.08 × 10⁻¹⁹ |
| 32 | 9.43 × 10−01 | 7.11 × 10⁻¹⁵ | 0.00 × 1000 | 1.36 × 10−02 | 73 | 0.00 × 1000 | 5.84 × 10−06 | 114 | 0.00 × 1000 | 0.00 × 1000 |
| 33 | 8.88 × 10⁻¹⁶ | 0.00 × 1000 | 1.60 × 10−04 | 1.72 × 10−02 | 74 | 2.50 × 10−01 | 8.67 × 10⁻¹⁹ | 115 | 0.00 × 1000 | 0.00 × 1000 |
| 34 | 6.24 × 10−01 | 1.36 × 10−01 | 5.59 × 10−05 | 6.25 × 10−02 | 75 | 0.00 × 1000 | 1.39 × 10−04 | 116 | 5.00 × 10−02 | 0.00 × 1000 |
| 35 | 1.06 × 1000 | 5.00 × 10−01 | 1.19 × 10−04 | 1.32 × 10−01 | 76 | 3.55 × 10⁻¹⁵ | 0.00 × 1000 | 117 | 0.00 × 1000 | 4.82 × 10−06 |
| 36 | 0.00 × 1000 | 0.00 × 1000 | 5.36 × 10−05 | 3.71 × 10−02 | 77 | 2.50 × 10−01 | 8.67 × 10⁻¹⁹ | 118 | 0.00 × 1000 | 0.00 × 1000 |
| 37 | 1.26 × 1000 | 8.66 × 10−02 | 5.60 × 10−05 | 4.67 × 10−02 | 78 | 1.85 × 1000 | 0.00 × 1000 | 119 | 0.00 × 1000 | 1.43 × 10−05 |
| 38 | 0.00 × 1000 | 0.00 × 1000 | 8.66 × 10−05 | 3.77 × 10−02 | 79 | 4.71 × 10−01 | 0.00 × 1000 | 120 | 0.00 × 1000 | 0.00 × 1000 |
| 39 | 4.71 × 10−01 | 7.28 × 10−02 | 0.00 × 1000 | 4.32 × 10−02 | 80 | 7.45 × 10−01 | 8.67 × 10⁻¹⁹ | 121 | 5.00 × 10−01 | 0.00 × 1000 |
| 40 | 2.50 × 10−01 | 7.11 × 10⁻¹⁵ | 0.00 × 1000 | 2.77 × 10−02 | 81 | 5.00 × 10−01 | 8.67 × 10⁻¹⁹ | 122 | 0.00 × 1000 | 2.55 × 10−05 |
| 41 | 7.50 × 10−01 | 0.00 × 1000 | 0.00 × 1000 | 2.99 × 10−02 | 82 | 0.00 × 1000 | 8.67 × 10⁻¹⁹ | 123 | 0.00 × 1000 | 2.17 × 10⁻¹⁹ |
| 124 | 4.71 × 10−01 | 0.00 × 1000 | ||||||||
| 125 | 1.78 × 10⁻¹⁵ | 0.00 × 1000 | ||||||||
| 126 | 5.00 × 10−02 | 6.52 × 10−06 | ||||||||
| 127 | 0.00 × 1000 | 0.00 × 1000 | ||||||||
| 128 | 0.00 × 1000 | 0.00 × 1000 | ||||||||
| 129 | 0.00 × 1000 | 0.00 × 1000 | ||||||||
| 130 | 1.78 × 10⁻¹⁵ | 0.00 × 1000 | ||||||||
| 131 | 0.00 × 1000 | 0.00 × 1000 | ||||||||
| 132 | 5.00 × 10−01 | 0.00 × 1000 | ||||||||
| 133 | 0.00 × 1000 | 0.00 × 1000 | ||||||||
| 134 | 1.08 × 10⁻¹⁹ | |||||||||
| 135 | 0.00 × 1000 | |||||||||
| 136 | 0.00 × 1000 | |||||||||
| 137 | 0.00 × 1000 |
References
- Müller, G. Review: The Czochralski Method—where we are 90 years after Jan Czochralski’s invention. Cryst. Res. Technol. 2007, 42, 1150–1161. [Google Scholar] [CrossRef]
- Rudolph, P.; Nishinga, T. Handbook of Crystal Growth: Bulk Crystal Growth; Elsevier: Amsterdam, The Netherlands, 2014; Volume 2, pp. 389–397. [Google Scholar]
- Friedrich, J.; von Ammon, W.; Muller, G. Czochralski Growth of Silicon Crystals. In Handbook of Crystal Growth: Bulk Crystal Growth; Rudolph, P., Ed.; Elsevier Science: Amsterdam, The Netherlands, 2014; pp. 47–61. [Google Scholar]
- Su, W.; Zuo, R.; Mazaev, K.; Kalaev, V. Optimization of crystal growth by changes of flow guide, radiation shield and sidewall insulation in Cz Si furnace. J. Cryst. Growth 2010, 312, 495–501. [Google Scholar] [CrossRef]
- Noghabi, O.A.; M’Hamdi, M.; Jomâa, M. Sensitivity analyses of furnace material properties in the Czochralski crystal. Meas. Sci. Technol. 2013, 24, 015601. [Google Scholar] [CrossRef]
- Dornberger, E.; Tomzig, E.; Seidl, A.; Schmitt, S.; Leister, H.-J.; Schmitt, C.; Müller, G. Thermal simulation of the Czochralski silicon growth process by three different models and comparison with experimental results. J. Cryst. Growth 1997, 180, 461–467. [Google Scholar] [CrossRef]
- Tsukada, T.; Imaishi, N.; Hozawa, M. Effect of a radiation shield on melt crystal interface shape and pull rate of silicon CZ puller. J. Chem. Eng. Jpn. 1988, 21, 381–387. [Google Scholar] [CrossRef] [Green Version]
- Mosel, F.; Denisov, A.V.; Klipp, B.; Sennova, N.; Kranert, C.; Jung, T.; Trempa, M.; Reimann, C.; Friedrich, J. Limitations of the growth rate of silicon mono ingots grown by the Czochralski technique. Proc. EU PVSEC 2020, 468–473. [Google Scholar]
- Ding, J.; Liu, L. Real-time prediction of crystal/melt interface shape during Czochralski crystal growth. Cryst. Eng. Comm. 2018, 20, 6925–6931. [Google Scholar] [CrossRef]
- Van den Bogaert, N.; Dupret, F. Dynamic global simulation of the Czochralski process, II. Analysis of the growth of a germanium crystal. J. Cryst. Growth 1997, 171, 77–93. [Google Scholar] [CrossRef]
- Böttcher, K.; Rudolph, P.; Neubert, M.; Kurz, M.; Pusztai, A.; Müller, G. Global temperature field simulation of the vapour pressure controlled Czochralski (VCz) growth of 3″–4″ gallium arsenide crystals. J. Cryst. Growth 1999, 198, 349–354. [Google Scholar] [CrossRef]
- Derby, J.J.; Atherton, L.J.; Gresho, P.M. An integrated process model for the growth of oxide crystals by the Czochralski method. J. Cryst. Growth 1989, 97, 792–826. [Google Scholar] [CrossRef]
- Hur, M.J.; Han, X.F.; Song, D.S.; Kim, T.H.; Lee, N.J.; Jeong, Y.J.; Yi, K.W. The influence of crucible and crystal rotation on the sapphire single crystal growth interface shape in a resistance heated Czochralski system. J. Cryst. Growth 2014, 385, 22–27. [Google Scholar] [CrossRef]
- Fühner, T.; Jung, T. Use of genetic algorithms for the development and optimization of crystal growth processes. J. Cryst. Growth 2004, 266, 229–238. [Google Scholar] [CrossRef]
- Smirnova, O.V.; Durnev, N.V.; Shandrakova, K.E.; Mizitov, E.L.; Soklakov, V.D. Optimization of furnace design and growth parameters for Si Cz growth, using numerical simulation. J. Cryst. Growth 2008, 310, 2185–2191. [Google Scholar] [CrossRef]
- Müller, G.; Fischer, B. Optimization of Melt Growth Processes by Experimental Analysis and Computer Modelling; Sato, K., Furukawa, Y., Nakajima, K., Ohachi, T., Eds.; Proceedings of the ISSCG 11; Elsevier: Amsterdam, The Netherlands, 2001; pp. 167–190. [Google Scholar]
- Huang, L.Y.; Lee, P.C.; Hsieh, C.K.; Hsu, W.C.; Lan, C.W. On the hot-zone design of Czochralski silicon growth for photovoltaic applications. J. Cryst. Growth 2004, 261, 433–443. [Google Scholar] [CrossRef]
- Dornberger, E.; von Ammon, W.; Van den Bogaert, N.; Dupret, F. Transient computer simulation of a CZ crystal growth process. J. Cryst. Growth 1996, 166, 452–457. [Google Scholar] [CrossRef]
- Noghabi, O.A.; M’Hamdi, M.; Jomâa, M. Effect of crystal and crucible rotations on the interface shape of Czochralski grown silicon single crystals. J. Cryst. Growth 2011, 318, 173–177. [Google Scholar] [CrossRef]
- Rea, S.N. Czochralski silicon pull rate limits. J. Cryst. Growth 1981, 54, 267–274. [Google Scholar] [CrossRef]
- Friedrich, J.; Jung, T.; Trempa, M.; Reimann, C.; Denisov, A.; Muehe, A. Considerations on the limitations of the growth rate during pulling of silicon crystals by the Czochralski technique for PV applications. J. Cryst. Growth 2019, 524, 125168. [Google Scholar] [CrossRef]
- Kakimoto, K.; Yi, K.-W.; Eguchi, M. Oxygen transfer during single silicon crystal growth in Czochralski system with vertical magnetic fields. J. Cryst. Growth 1996, 163, 238–242. [Google Scholar] [CrossRef]
- Kakimoto, K.; Eguchi, M.; Ozoe, H. Use of an inhomogenous magnetic field for silicon crystal growth. J. Cryst. Growth 1997, 180, 442–449. [Google Scholar] [CrossRef]
- Liu, L.; Kakimoto, K. Partly three-dimensional global modeling of a silicon Czochralski furnace. II. Model application: Analysis of a silicon Czochralski furnace in a transverse magnetic field. Int. J. Heat Mass Transf. 2005, 48, 4492–4497. [Google Scholar] [CrossRef]
- Smirnov, A.D.; Kalaev, V.V. Development of oxygen transport model in Czochralski growth of silicon crystals. J. Cryst. Growth 2008, 310, 2970–2976. [Google Scholar] [CrossRef]
- Gao, B.; Kakimoto, K. Global simulation of coupled carbon and oxygen transport in a Czochralski furnace for silicon crystal growth. J. Cryst. Growth 2010, 312, 2972–2976. [Google Scholar] [CrossRef]
- Dropka, N.; Holena, M. Application of Artificial Neural Networks in Crystal Growth of Electronic and Opto-Electronic Materials. Crystals 2020, 10, 663. [Google Scholar] [CrossRef]
- Curtolo, D.C.; Friedrich, S.; Friedrich, B. High Purity Germanium, a Review on Principle Theories and Technical Production Methodologies. J. Cryst. Process Technol. 2017, 7, 65–84. [Google Scholar] [CrossRef] [Green Version]
- Depuydt, B.; Theuwis, A.; Romandic, I. Germanium: From the first application of Czochralski crystal growth to large diameter dislocation-free wafers. Mater. Sci. Semicond. Process. 2006, 9, 437–443. [Google Scholar] [CrossRef]
- Abrosimov, N.; Czupalla, M.; Dropka, N.; Fischer, J.; Gybin, A.; Irmscher, K.; Janicskó-Csáthy, J.; Juda, U.; Kayser, S.; Miller, W.; et al. Technology Development of High Purity Germanium Crystals for Radiation Detectors. J. Cryst. Growth 2020, 532, 125396. [Google Scholar] [CrossRef]
- Sumathi, R.R.; Abrosimov, N.; Gradwohl, K.-P.; Czupalla, M.; Fischer, J. Growth of heavily-doped Germanium single crystals for mid-Infrared applications. J. Cryst. Growth 2020, 535, 125490. [Google Scholar] [CrossRef]
- Yu, W.; Zhu, C.; Tsunooka, Y.; Huang, W.; Dang, Y.; Kutsukake, K.; Harada, S.; Tagawa, M.; Ujihara, T. Geometrical design of a crystal growth system guided by a machine learning algorithm. Cryst. Eng. Comm. 2021, 23, 2695–2702. [Google Scholar] [CrossRef]
- Kutsukake, K.; Nagai, Y.; Banba, H. Virtual experiments of Czochralski growth of silicon using machine learning: Influence of processing parameters on interstitial oxygen concentration. J. Cryst. Growth 2022, 584, 126580. [Google Scholar] [CrossRef]
- Kutsukake, K.; Nagai, Y.; Horikawa, T.; Banba, H. Real-time prediction of interstitial oxygen concentration in Czochralski silicon using machine learning. Appl. Phys. Express. 2020, 13, 125502. [Google Scholar] [CrossRef]
- Qi, X.; Ma, W.; Dang, Y.; Su, W.; Liu, L. Optimization of the melt/crystal interface shape and oxygen concentration during the Czochralski silicon crystal growth process using an artificial neural network and a genetic algorithm. J. Cryst. Growth 2020, 548, 125828. [Google Scholar] [CrossRef]
- Asadian, M.; Seyedein, S.H.; Aboutalebi, M.R.; Maroosi, A. Optimization of the parameters affecting the shape and position of crystal-melt interface in YAG single crystal growth. J. Cryst. Growth 2009, 311, 342–348. [Google Scholar] [CrossRef]
- Takehara, Y.; Sekimoto, A.; Okano, Y.; Ujihara, T.; Dost, S. Explainable machine learning for the analysis of transport phenomena in top-seeded solution growth of SiC single crystal. J. Therm. Sci. Technol. 2021, 16, 20–00269. [Google Scholar] [CrossRef]
- Shalev-Shwartz, S.; Ben-David, S. Decision Trees. In Understanding Machine Learning; Cambridge University Press: Cambridge, UK, 2014. [Google Scholar]
- Breiman, L.; Friedman, J.; Olshen, R.; Stone, C. Classification and Regression Trees; CRC Press: Boca Raton, FL, USA, 1984. [Google Scholar]
- Dropka, N.; Böttcher, K.; Holena, M. Development and optimization of VGF-GaAs crystal growth process using data mining and machine learning techniques. Crystals 2021, 11, 1218. [Google Scholar] [CrossRef]
- Kakimoto, K.; Gao, B. Fluid Dynamics: Modeling and Analysis. In Handbook of Crystal Growth; Rudolph, P., Ed.; Elsevier: Amsterdam, The Netherlands, 2015; pp. 845–870. [Google Scholar]
- Montgomery, D. Design and Analysis of Experiments, 8th ed.; John Wiley & Sons, Inc.: Hoboken, NJ, USA, 2013. [Google Scholar]
- Jiptner, K.; Gao, B.; Harada, H.; Miyamura, Y.; Fukuzawa, M.; Kakimoto, K.; Sekiguchi, T. Thermal stress induced dislocation distribution in directional solidification of Si for PV application. J. Cryst. Growth 2014, 408, 19–24. [Google Scholar] [CrossRef]
- Voronkov, V.V. The mechanism of swirl defects formation in silicon. J. Cryst. Growth 1982, 59, 625–643. [Google Scholar] [CrossRef]
- Dornberger, E.; Graef, D.; Suhren, M.; Lambert, U.; Wagner, P.; Dupret, F.; von Ammon, W. Influence of boron concentration on the oxidation-induced stacking fault ring in Czochralski silicon crystals. J. Cryst. Growth 1997, 180, 343–352. [Google Scholar] [CrossRef]
- Wang, G.; Guan, Y.; Mei, H.; Mei, D.; Yang, G.; Govani, J.; Khizar, M. Dislocation Density Control in High-Purity Germanium Crystal Growth. J. Cryst. Growth 2014, 393, 54–58. [Google Scholar] [CrossRef]
- Vanhellemont, J.; Nakamura, K.; Kamiyama, E.; Sueoka, K. Control of Intrinsic Point Defects in Single-Crystal Si and Ge Growth from a Melt. In Defects and Impurities in Silicon Materials. Lecture Notes in Physics; Yoshida, Y., Langouche, G., Eds.; Springer: Minato-Ku, Tokyo, 2015. [Google Scholar]
- Vanhellemont, J.; Kamiyama, E.; Nakamura, K.; Spiewak, P.; Sueoka, K. Impacts of thermal stress and doping on intrinsic point defect properties and clustering during single crystal silicon and germanium growth from a melt. J. Cryst. Growth 2017, 474, 96–103. [Google Scholar] [CrossRef]
- Dang, Y.; Liu, L.; Li, Z. Optimization of the controlling recipe in quasi-single crystalline silicon growth using artificial neural network and genetic algorithm. J. Cryst. Growth 2019, 522, 195–203. [Google Scholar] [CrossRef]
- Box, G.E.P.; Hunter, W.G.; Hunter, J.S. Statistics for Experimenters: An Introduction to Design, Data Analysis and Model Building; Wiley: New York, NY, USA, 1978. [Google Scholar]
Figure 1.
Furnace for Cz-Ge growth: (a,b) geometry with a definition of the main geometric and process parameters: x1, crystal radius; x2, crucible radius; x3, distance between crucible and side heater; x4, shield emissivity; x5, pulling rate; x6, distance between crucible and bottom heater; x7, axial displacement of side heater; x8, power of side heater; x9, power of bottom heater; x10, crystal rotational rate; x11, crucible rotational rate; x12, distance from the radiation shield to the melt; x13, melt height; (c) definition and a sign of interface deflection y1.

Figure 2.
All CFD results derived from 77 crystal growth recipes shown in parallel coordinate system for inputs x1–x13 and outputs y1–y3. The line color matches the value of: (a) the interface deflection y1 and (b) v/G = y3. The database was used for ML analysis.
Figure 2.
All CFD results derived from 77 crystal growth recipes shown in parallel coordinate system for inputs x1–x13 and outputs y1–y3. The line color matches the value of: (a) the interface deflection y1 and (b) v/G = y3. The database was used for ML analysis.

Figure 3.
Examples of CFD results for the temperature T in the furnace and the melt velocity u for various furnace designs and growth recipes. The results correspond to the following inputs x1–x13: (a) 2; 3.574803; 10; 0.8; 58; 119; 71; 6; 7.6; 50; −2; 21; 32; (b) 2; 3.574803; 60; 0.3; 15; 119; 104; 8; 8.1; 10; −5; 21; 32; (c) 1; 2.574803; 60; 0.3; 10; 67; 137; 3; 9.2; 35; −5; 19; 90.

Figure 4.
Correlation coefficients r for all 77 data tuples shown as colored correlation plots. The corresponding numerical matrix is given in Table A1 in Appendix A.
Figure 4.
Correlation coefficients r for all 77 data tuples shown as colored correlation plots. The corresponding numerical matrix is given in Table A1 in Appendix A.

Figure 5.
Regression tree analyzing the dependence of the solid–liquid interface deflection y1 (mm) on the furnace design and process parameters x1–x13. The white-marked branches where leaf nodes have a mean deflection y1 ≤ 0 mm, i.e., a slightly convex shape of s/l interface, are favorable. The RMSE for each split is given in Table A2 in Appendix A.

Figure 6.
Regression tree analyzing the dependence of the crystal growth rate y2 (mm/h) on the furnace design and process parameters x1–x13. The white-marked branches where leaf nodes have a maximum mean y2 value are favorable. The RMSE for each split is given in Table A2 in Appendix A.
Figure 6.
Regression tree analyzing the dependence of the crystal growth rate y2 (mm/h) on the furnace design and process parameters x1–x13. The white-marked branches where leaf nodes have a maximum mean y2 value are favorable. The RMSE for each split is given in Table A2 in Appendix A.

Figure 7.
Regression tree analyzing the dependence of the ratio of the growth rate over axial temperature gradient in crystal y3 × 105 (cm2/K min) on the furnace design and process parameters x1–x13. The mean values of y3 in the nodes were rescaled by a factor of 1× 10⁵ to improve tree readability. In the case of doped Ge, the branches where leaf nodes have a mean y3~1.34 × 10⁻³ (cm2/K min) = 134 × 105 (cm2/K min) are favorable. The RMSE for each split is given in Table A2 in Appendix A.

Figure 8.
Regression tree analyzing the dependence of the normalized combined output y123 on the furnace design and process parameters x1–x13. In the case of doped Ge, the branch where leaf node has a minimal mean value y123~0.858 (-) is favorable. The RMSE for each split is given in Table A2 in Appendix A.

Figure 9.
Relative importance of the inputs for: (a) interface deflection y1, (b) crystal growth rate y2, (c) ratio of growth rate and axial temperature gradient in the crystal y3, and (d) combined normalized output y123.
Figure 9.
Relative importance of the inputs for: (a) interface deflection y1, (b) crystal growth rate y2, (c) ratio of growth rate and axial temperature gradient in the crystal y3, and (d) combined normalized output y123.

Table 1.
Material properties of Ge melt and crystal.
| Property Unit | Tm (K) | ρ (kg m−3) | μ (Pas) | λ (W m−1K−1) | cp (J kg−1K−1) | α (K−1) | ε (-) | Pr (-) |
|---|---|---|---|---|---|---|---|---|
| Ge melt | 1211 | 5670 | 7.42 × 10⁻⁴ | 39 | 394 | 1.11 × 10⁻⁴ | 0.5 | 0.008 |
| Ge crystal | 5323 | - | 17.3 | 404 | 0.5 |
Table 2.
The most decisive inputs and their optimal values for the Cz-Ge growth with flat or slightly convex s/l interface (y1 ≤ 0 mm), derived from RT analysis. The data ranges correspond to the white nodes in Figure 5.
Table 2.
The most decisive inputs and their optimal values for the Cz-Ge growth with flat or slightly convex s/l interface (y1 ≤ 0 mm), derived from RT analysis. The data ranges correspond to the white nodes in Figure 5.
| Mean | Decisive Inputs | ||||
|---|---|---|---|---|---|
| y1 | x4 | x5 | x9 | x10 | x13 |
| −1 −1.15 | 0.55 < ∗ < 0.825 <0.55 | <22.8 <22.8 | 1.25 < ∗ < 9.4 1.25 < ∗ < 9.4 | 12.5 < ∗ < 52.5 12.5 < ∗ < 52.5 | >41.5 >41.5 |
Table 3.
The most decisive inputs and their optimal values for the Cz-Ge growth with high growth rate y2, derived from RT analysis. The data ranges correspond to the white nodes in Figure 6.
Table 3.
The most decisive inputs and their optimal values for the Cz-Ge growth with high growth rate y2, derived from RT analysis. The data ranges correspond to the white nodes in Figure 6.
| Mean | Decisive Inputs | ||
|---|---|---|---|
| y2 | x4 | x5 | x7 |
| 89.6 89.2 | >0.575 <0.575 | >82 >82 | <104 <104 |
Table 4.
The most decisive inputs and their optimal values for the favorable y3 (cm2/K min) value corresponding to the Voronkov criteria, derived from RT analysis. The data ranges correspond to the white nodes in Figure 7.
Table 4.
The most decisive inputs and their optimal values for the favorable y3 (cm2/K min) value corresponding to the Voronkov criteria, derived from RT analysis. The data ranges correspond to the white nodes in Figure 7.
| Mean | Decisive Inputs | ||||
|---|---|---|---|---|---|
| y3 | x2 | x5 | x9 | x10 | x11 |
| 0.00126 0.00141 | >3.18 <3.18 | 12.5 < ∗ < 22.8 12.5 < ∗ < 22.8 | <11.3 <11.3 | >15 >15 | <−2.5 <−2.5 |
Table 5.
The most decisive inputs and their optimal values for the favorable y123 value, derived from RT analysis. The data ranges correspond to the white nodes in Figure 8.
Table 5.
The most decisive inputs and their optimal values for the favorable y123 value, derived from RT analysis. The data ranges correspond to the white nodes in Figure 8.
| Mean | Decisive Inputs | ||
|---|---|---|---|
| y123 | x2 | x4 | x7 |
| 0.858 | >2.73 | >0.55 | >121 |
Publisher’s Note: MDPI stays neutral with regard to jurisdictional claims in published maps and institutional affiliations. |
© 2022 by the authors. Licensee MDPI, Basel, Switzerland. This article is an open access article distributed under the terms and conditions of the Creative Commons Attribution (CC BY) license (https://creativecommons.org/licenses/by/4.0/).
Share and Cite
MDPI and ACS Style
Dropka, N.; Tang, X.; Chappa, G.K.; Holena, M. Smart Design of Cz-Ge Crystal Growth Furnace and Process. Crystals 2022, 12, 1764. https://doi.org/10.3390/cryst12121764
AMA Style
Dropka N, Tang X, Chappa GK, Holena M. Smart Design of Cz-Ge Crystal Growth Furnace and Process. Crystals. 2022; 12(12):1764. https://doi.org/10.3390/cryst12121764
Chicago/Turabian StyleDropka, Natasha, Xia Tang, Gagan Kumar Chappa, and Martin Holena. 2022. "Smart Design of Cz-Ge Crystal Growth Furnace and Process" Crystals 12, no. 12: 1764. https://doi.org/10.3390/cryst12121764
Note that from the first issue of 2016, this journal uses article numbers instead of page numbers. See further details here.