
Environmental Role of Snowmelt in Headwaters Affected by Atmospheric Acid Deposition


1
Department of Hydrology, Czech Technical University in Prague, Thákurova 7, 166 29 Prague, Czech Republic
2
Aon Impact Forecasting, Václavské náměstí 19, 110 00 Prague, Czech Republic
3
Institute of Hydrobiology, Biology Centre, Czech Academy of Sciences, Na Sádkách 7, 370 05 České Budějovice, Czech Republic
*
Author to whom correspondence should be addressed.
Water 2023, 15(13), 2458; https://doi.org/10.3390/w15132458
Submission received: 14 June 2023
/
Revised: 29 June 2023
/
Accepted: 30 June 2023
/
Published: 4 July 2023
(This article belongs to the Section Water Resources Management, Policy and Governance)
Abstract
:In headwaters, snowmelt affects the replenishment of water resources as well as the occurrence of natural hazards. The environmental impacts of snowpack were analysed in a small forest catchment (Jizera Mountains, Czech Republic) in the context of forest dynamics, atmospheric deposition, and climate, 1982–2021. Snowmelt dominates in March–May with 41% of the long-term annual water yield; however, there is also seasonal acidification of stream water. Forest clear-cutting together with air pollution control has contributed to a decrease in the acid atmospheric load, but, in the spring, streams’ pH is often below the environmental threshold of 5.3. Snowmelt volumes did not show significant transformation with forest canopy and do not affect summer low flows. Peak flows in the springtime do not exceed summer flash floods (frequencies up to 0.13 against 0.02). Mean annual air temperature is increasing by 0.26 ± 0.08 °C per decade with more intensive warming (0.64 ± 0.1 °C per decade) in the winter season. The seasonal reduction in snowpack duration and maximum snow water equivalent (5.5 ± 1.2 days and 34 ± 8.6 mm per decade) corresponds with the largest drop in snow cover duration reported in zones of seasonal temperatures ranging from −5° to +5 °C.
1. Introduction
Snow has a significant impact on the earth’s climate and provides benefits and delivers threats to society’s infrastructure [1]. Particularly, in high altitudes and latitudes, snowmelt processes significantly affect hydrological recharge (quantity and quality) while at the same time they may trigger natural hazards (overland flow, flooding, and soil erosion) [2,3]. In headwater regions, runoff from snowmelt represents a major source of flow in rivers worldwide [4], and mean annual streamflow is likely to decrease for catchments that experience significant reductions in the snow fraction of precipitation [5]. Generally, seasonal recharge of water resources is determined by processes of snow accumulation and ablation. Snow accumulation is most often represented by the peak snow water equivalent (SWE, mm) on the ground before snowmelt, and the snow ablation rate (mm/day) is computed as the peak SWE divided by the number of days of the ablation period [6]. The most significant reduction in snowmelt intensity was found in dense mature spruce plantation, while in forest openings, the amount of snow that accumulated and the turbulent energy exchange between the air and the snowpack surface were greater than in the forest stands [7].
The strong correlation between snowmelt rate and baseflow efficiency reported by [8] shows that generally, greater snowmelt rates increase subsurface flow. The effects of forest cover on snow accumulation and ablation have been subjects of substantial research over the last century, and the relationship between forest and snow cover have been extensively discussed [2,8,9,10]. According to field studies in North America and Europe from the 1930s to the present, changes in forest cover explained 57% and 72% of the variance of relative changes in snow accumulation and ablation, respectively [6]. Generally, forest ecosystems at stream headwaters are considered likely to guarantee the best quality freshwater sources [11]. Mountain regions in central Europe are predominantly forested; therefore, forestry practices and forest protection strategies are among the key aspects in watershed management [12]. Evidence of water quality deterioration on a global scale during the last century has been associated mainly with poor watershed management [13,14]. In downstream areas, water quality has deteriorated mostly due to pollution at point sources, but headwaters are affected predominantly by large-scale air pollution (emissions of SO2, NOx, and NH4) and subsequent atmospheric acid deposition [15,16,17].
In the winter, when more fossil fuel is used, snow becomes a superabsorbent for air pollutants due to the large surface area of the crystals, and the pollutants along with the snowmelt flow into underground pipes and aquifers [18,19]. Moreover, the orographic enhancements of precipitation and pollutant deposition are considered significantly greater for snowfall than for rainfall [18]. In regions with high levels of air pollution, forest stands can increase acid deposition through their relatively high leaf area and roughness of the canopy and, thus, counteract the beneficial effects of forests on the water quality at stream headwaters [20]. UNEP [21] called for a reduction of the atmospheric acid deposition in headwater catchments to mitigate the progressive downstream acidification of rivers and the ocean. Within a watershed, the presence of deciduous or mixed forests can decrease the atmospheric acid load through lower canopy areas, particularly in the dormant season (November–April) [22]. Although most water quality regulations, legislation, and sampling are promulgated for base-flow conditions, Bolstad and Swank [23] warned of land-use impacts on water chemistry and biota during stormflow. In snow-rich catchments, water quality is affected particularly by seasonal acidification associated with the direct runoff from melting snow in the spring [20].
While acidification became one of the most important topics in vulnerable headwater ecosystems of Central Europe by the end of the 20th century, currently the impacts of global warming are considered the primary driving factor of environmental changes there [24,25]. Snow cover extent is believed to be a significant indicator of climate change [24]; a reduction in Northern Hemisphere snow cover has been detected since the 1950s [26], associated with the threat to water supply and flood risk management. Concerning the mitigation of negative environmental impacts, the restoration of natural and semi-natural ecosystems is recommended by ICPP [25].
The aim of this paper is to analyse the snowmelt process in a small forest catchment located in the upper plain of the Jizera Mountains (Czech Republic) over the last forty years, considering the factors of changing pollution, climate, and forest stands. Environmental effects of snowmelt that we assessed included water yield, runoff extremes (floods and droughts), and water quality.
2. Materials and Methods
2.1. Study Site
The Jizerka experimental catchment (50°48′21″–50°48′59″ N, 15°19′34″–15°20′48″ E) is located in the upper plain of the Jizera Mountains (Northern Bohemia, Czech Republic). That basin of the Sklářský Potok stream (Elbe River district: 1-05-01-004) and the outlet near the Jizerka settlement (Figure 1, Table 1) belong to the Kőppen sub-arctic region Dfc with mean annual precipitation 1400 mm (evenly distributed during a year) and air temperature of 4 °C. The average annual maximum snowpack of 120 cm and snow cover last from the beginning of November to the end of April, [27]. Thus, this catchment shows a high contributing potential to water resources recharge (a relative water yield of 4.69 exceeds the critical value of 1.25) [4]. Low-base-status soils (sandy-loamy Podzols) developed on porphyritic granite reaching depths between 0.5 and 1.2 m [28,29]. The root system dominates in the topsoil occurring down to a depth of 15 cm. The topsoil is created by litter (Ol, depth of 0–2 cm), a humus layer (Of + Oh, 2–10 cm), and leached horizon (Ah, 10–15 cm). Mor is the most common humus (2–5 cm). A fast subsurface run-off dominates, and groundwater occurs only in shallow weathered rock formations, [28]. The spruce soils in the Jizera Mountains were found to be more acidic in the organic horizons than in the subsurface mineral horizons (mean pH from 3.5 to 4.2), and the cation exchange capacity decreases with depth (from 20 to 5 cmol+kg−1), remaining stable in 2008–2020, [29].
This catchment lies within the Protected Headwater Area of the Jizera Mountains declared by Decree 40/1978 of the Czech government according to the Water Act 138/1973, 254/2001 Coll. to support hydrological recharge (of quantity and quality) by controlling the reduction of forest area and drainage development [30]. However, the typically high water quality found in forest headwater areas is negatively affected by the phenomenon of acid rain, when the atmospheric acid deposition (the airborne emissions of sulphur and nitrogen) increased due to the forest canopy area and roughness [22]. Acidification has probably affected aquatic ecosystems of the Jizera Mountains since the 1850s [15,17,31]. Atmospheric deposition reached its peak in the late 1980s and caused the widespread acidification of fresh water sources. This lowered the quality of drinking water and adversely affected populations of fish and other aquatic organisms [22]. The first signs of recovery in acidified mountain waters were registered in the 1990s, following the 1985 Helsinki Protocol on the Reduction of Sulphur Emissions or their Transboundary Fluxes (with loads of sulphur decreased to approx. 40% of those in 1987) [22,32].
Climax forests of the Jizerka basin include Norway spruce (Picea abies (L.) Karst.) and European beech (Fagus sylvatica L.) [33], but spruce plantations have dominated Jizerka since the end of the 18th century. From 1984 to 1988, mature spruce stands (showing a 30% defoliation) were harvested by clear-cutting followed by reforestation with coniferous stands again. After the clear-cut, grass-dominated Junco effuse and Calamagrostietum villosae became a new dominant community there [17]. Through reforestation, in the 1990s, several exotic species (blue spruce—Picea pungens, black spruce—Picea mariana, etc.) were introduced to produce stands more resistant to air pollution [34]. Currently, conversion projects to establish forests close to the native composition are motivated by the need for higher ecosystem stability and resistance to global warming.
2.2. Catchment Monitoring
The World Health Organization defines environmental health as those aspects of human health that are determined by environmental factors [35]. Therefore, physical, chemical, and biological parameters were monitored in the studied catchment, particularly with the concern of potential hazards in water resources recharge.
The experimental catchment (Figure 1) was instrumented in 1982. At the catchment outlet, runoff is registered by the sharp-crested V-notch weir hydraulics [36]: the water level and temperature are registered in ten minutes intervals by the automatic recorder ALA 4020 (ALA, Bučovice, Czech Republic). Meteorological observations are carried out along the vertical transect harvested in 1984 (Figure 1): precipitation, air temperature and humidity, global radiation, and soil moisture are observed in hourly intervals by the ALA system (Bučovice, Czech Republic) at 975 m asl. Additionally, three modified Hellmann rain gauges (area of 200 cm2, plastic collectors) are installed at elevations of 862, 899, and 975 m.
The snow survey included weekly measurements of snow depth and water equivalent at twelve fixed snow stakes along the snow transect by a distance of 100 m (Figure 1). Snow water equivalent was estimated by a gravimetric tube (cross-section area of 50 cm2) repeated five times at each stake according to [2]. To identify the evidence of fog drip, twelve passive fog collectors were installed near the fixed snow stakes (from 862 to 994 m asl.). At each collector, the fog drip was generated by 400 m of Teflon line (diameter of 0.25 mm, thus, surface area index SAI = 5) exposed at the height of 1.7 m above the ground. Sample bottles there were protected against direct rainfall access by a wide-brimmed cover that overlapped the fog collector at an angle of 34°. The throughfall observation method was used to detect fog drip in the mature spruce stand at 3 different elevations [37,38]. Ten 200 cm2 storage gauges were randomly adjusted under the canopy on plots of 30 × 30 m (substituted by snow lysimeters in winter periods) while stem flow in spruce stands was considered negligible according to [38,39].
In situ monitoring of stream water included temperature, pH, and conductivity, measured by the field multimeter WTW–350i (WTW GmbH, Germany). Stream water was sampled weekly and deposited precipitation (rain, fog drip, snow, and frost) in monthly intervals. The collected samples were analysed in the laboratory of the Hydrobiological Station Velký Pálenec (Charles University in Prague). Concentrations of major ions (Ca2+, Mg2+, Na+, K+, NH4+, Cl−, NO3−, and SO42−) were determined by ion chromatography. pH was measured with combination electrodes, and conductivity was measured by the radiometer conductometric sensor [40]. A portable photometer Paqualab 430–550 (ELE International, Milton Keynes, UK) was used to analyse concentrations of focused ions NH4+, NO3−, and SO42− more frequently during the weekly field campaigns (four to six a year) [20].
The vegetation canopy in the investigated catchment was analysed by satellite data supported by ground observations [41]. Basic forest parameters (tree species, age, basal area, tree height, timber volume, and horizontal canopy density) were evaluated by standard techniques [42]. The LANDSAT imagery (with a resolution of 30 m) was used to identify the vegetative cover in years 1983 (mature spruce stands), 1985 (extensive clear-cut), and consecutive years of 1992, 2002, 2010, and 2022 to detect the progress in reforestation. Only the clear-sky images of the summer seasons (June–August) were considered. From the multi-band raster images, five canopy classes were identified: (1) mature spruce forests, (2) stands of a crown closure above 0.3, (3) plots with a crown closure below 0.3, (4) areas covered only by grass communities, and (5) clear-cut areas. These classes correspond with the forest classification used by the United Nations Framework Convention on Climate Change [43].
2.3. Data Processing
Climate characteristics of snow accumulation and melt in individual years were mean annual and seasonal air temperature and precipitation, snowpack duration (including calendar dates of beginning and ending), and the date of maximum water equivalent.
The snow–water equivalent SWE [m] is expressed by Equations (1) and (2) [2].
where Vm is the volume of melted water from the snowpack (m3), A is the basal area (m2), hs is the depth of the snowpack (m), ρs is the snow density (the mass per unit volume of snow, kg m−3), and ρw is water density (kg m−3).
SWE = Vm A−1
SWE = hs ρs ρw−1
Hydrological analysis emphasized the impact of snowpack on seasonal and annual water balance, runoff timing, and extreme runoff events. The Hamon temperature-based method was applied to calculate daily evaporation potentials ETP according to [44], Equation (3). This method allowed calculations also in winter when temperatures averaged below 0 °C.
where ETP is the daily potential evaporation (mm day−1), N is the maximum possible sunshine (h day−1), Td is the mean daily temperature of air (°C), and es is the saturated vapour pressure of the air at temperature Td (kPa), calculated by approximate Equation (4):
ETP = (2.1 N2 es)/(Td + 273.2)
es = 611 exp [(17.27 Td)/(237.3 + Td)]
Atmospheric precipitation inputs at the Jizerka catchment are affected by both elevation and vegetative canopy [17]. Therefore, the hypsometric method was used to extrapolate point observations of gross precipitation, canopy throughfall, and the atmospheric deposition of acid components (sulphate, nitrate, and ammonia).
The interception loss of the canopy I was calculated by Equation (5), and the input of fog/cloud deposition was identified by the reduction of the canopy loss according to [39]
where I is the canopy interception (mm), P is the open field (gross) precipitation (mm), and Pt is throughfall under the canopy (mm).
I = P − Pt
Seasonal atmospheric loads of studied acidifying chemicals (SO42−, NO3−, and NH4+) by fog drip were estimated by Equation (6) [37]:
where m is the seasonal (summer/winter) load, b and b0 are empirical hypsometric coefficients, E is elevation, Aer is the effective receptor area, and Fc is the fog drip coefficient.
Methods of spatial interpolation (ArcGIS 10.2) were used to approximate the catchment deposition of water and acidifying ions (SO42−, NO3−, and NH4+), and their runoff was estimated from concentrations and discharge measured at the catchment outlet. Mean annual concentrations were calculated by weighted averages, and mean pH values were recalculated by converted values of hydrogen ions H+, Equation (7).
pH = −log (H+)
Standard descriptive statistics and one-way ANOVA were applied to analyse the collected data sets [45]. A non-parametric Kruskal–Wallis H test was used to determine significant differences in data groups, and trends in time series were detected by the CTPA programme [46]. For all the tests, the probability threshold was considered p = 0.05. The method of frequency factor was used to analyse frequencies of runoff extremes [33].
3. Results and Discussion
3.1. Climate Characteristics
From 1982 to 2021, mean annual air temperature showed a tendency to increase by 0.26 ± 0.08 °C per decade by a significant linear trend (p = 0.006, Spearman correlation coefficient R = 0.43 > Rcrit = 0.30, number of years n = 40, and probability threshold p = 0.05) while the trend in annual precipitation is not significant (drop in 23 mm per decade, p = 0.054, R = 0.15) (Figure 2). In the cold season (November–March), intensive warming of 0.64 ± 0.1 °C per decade was detected (p < 0.0001, R = 0.62), but there was not a significant decrease in precipitation (p = 0.24, R = 0.20), and for the warm season (May–October) such a trend is not significant (Figure 3 and Figure 4).
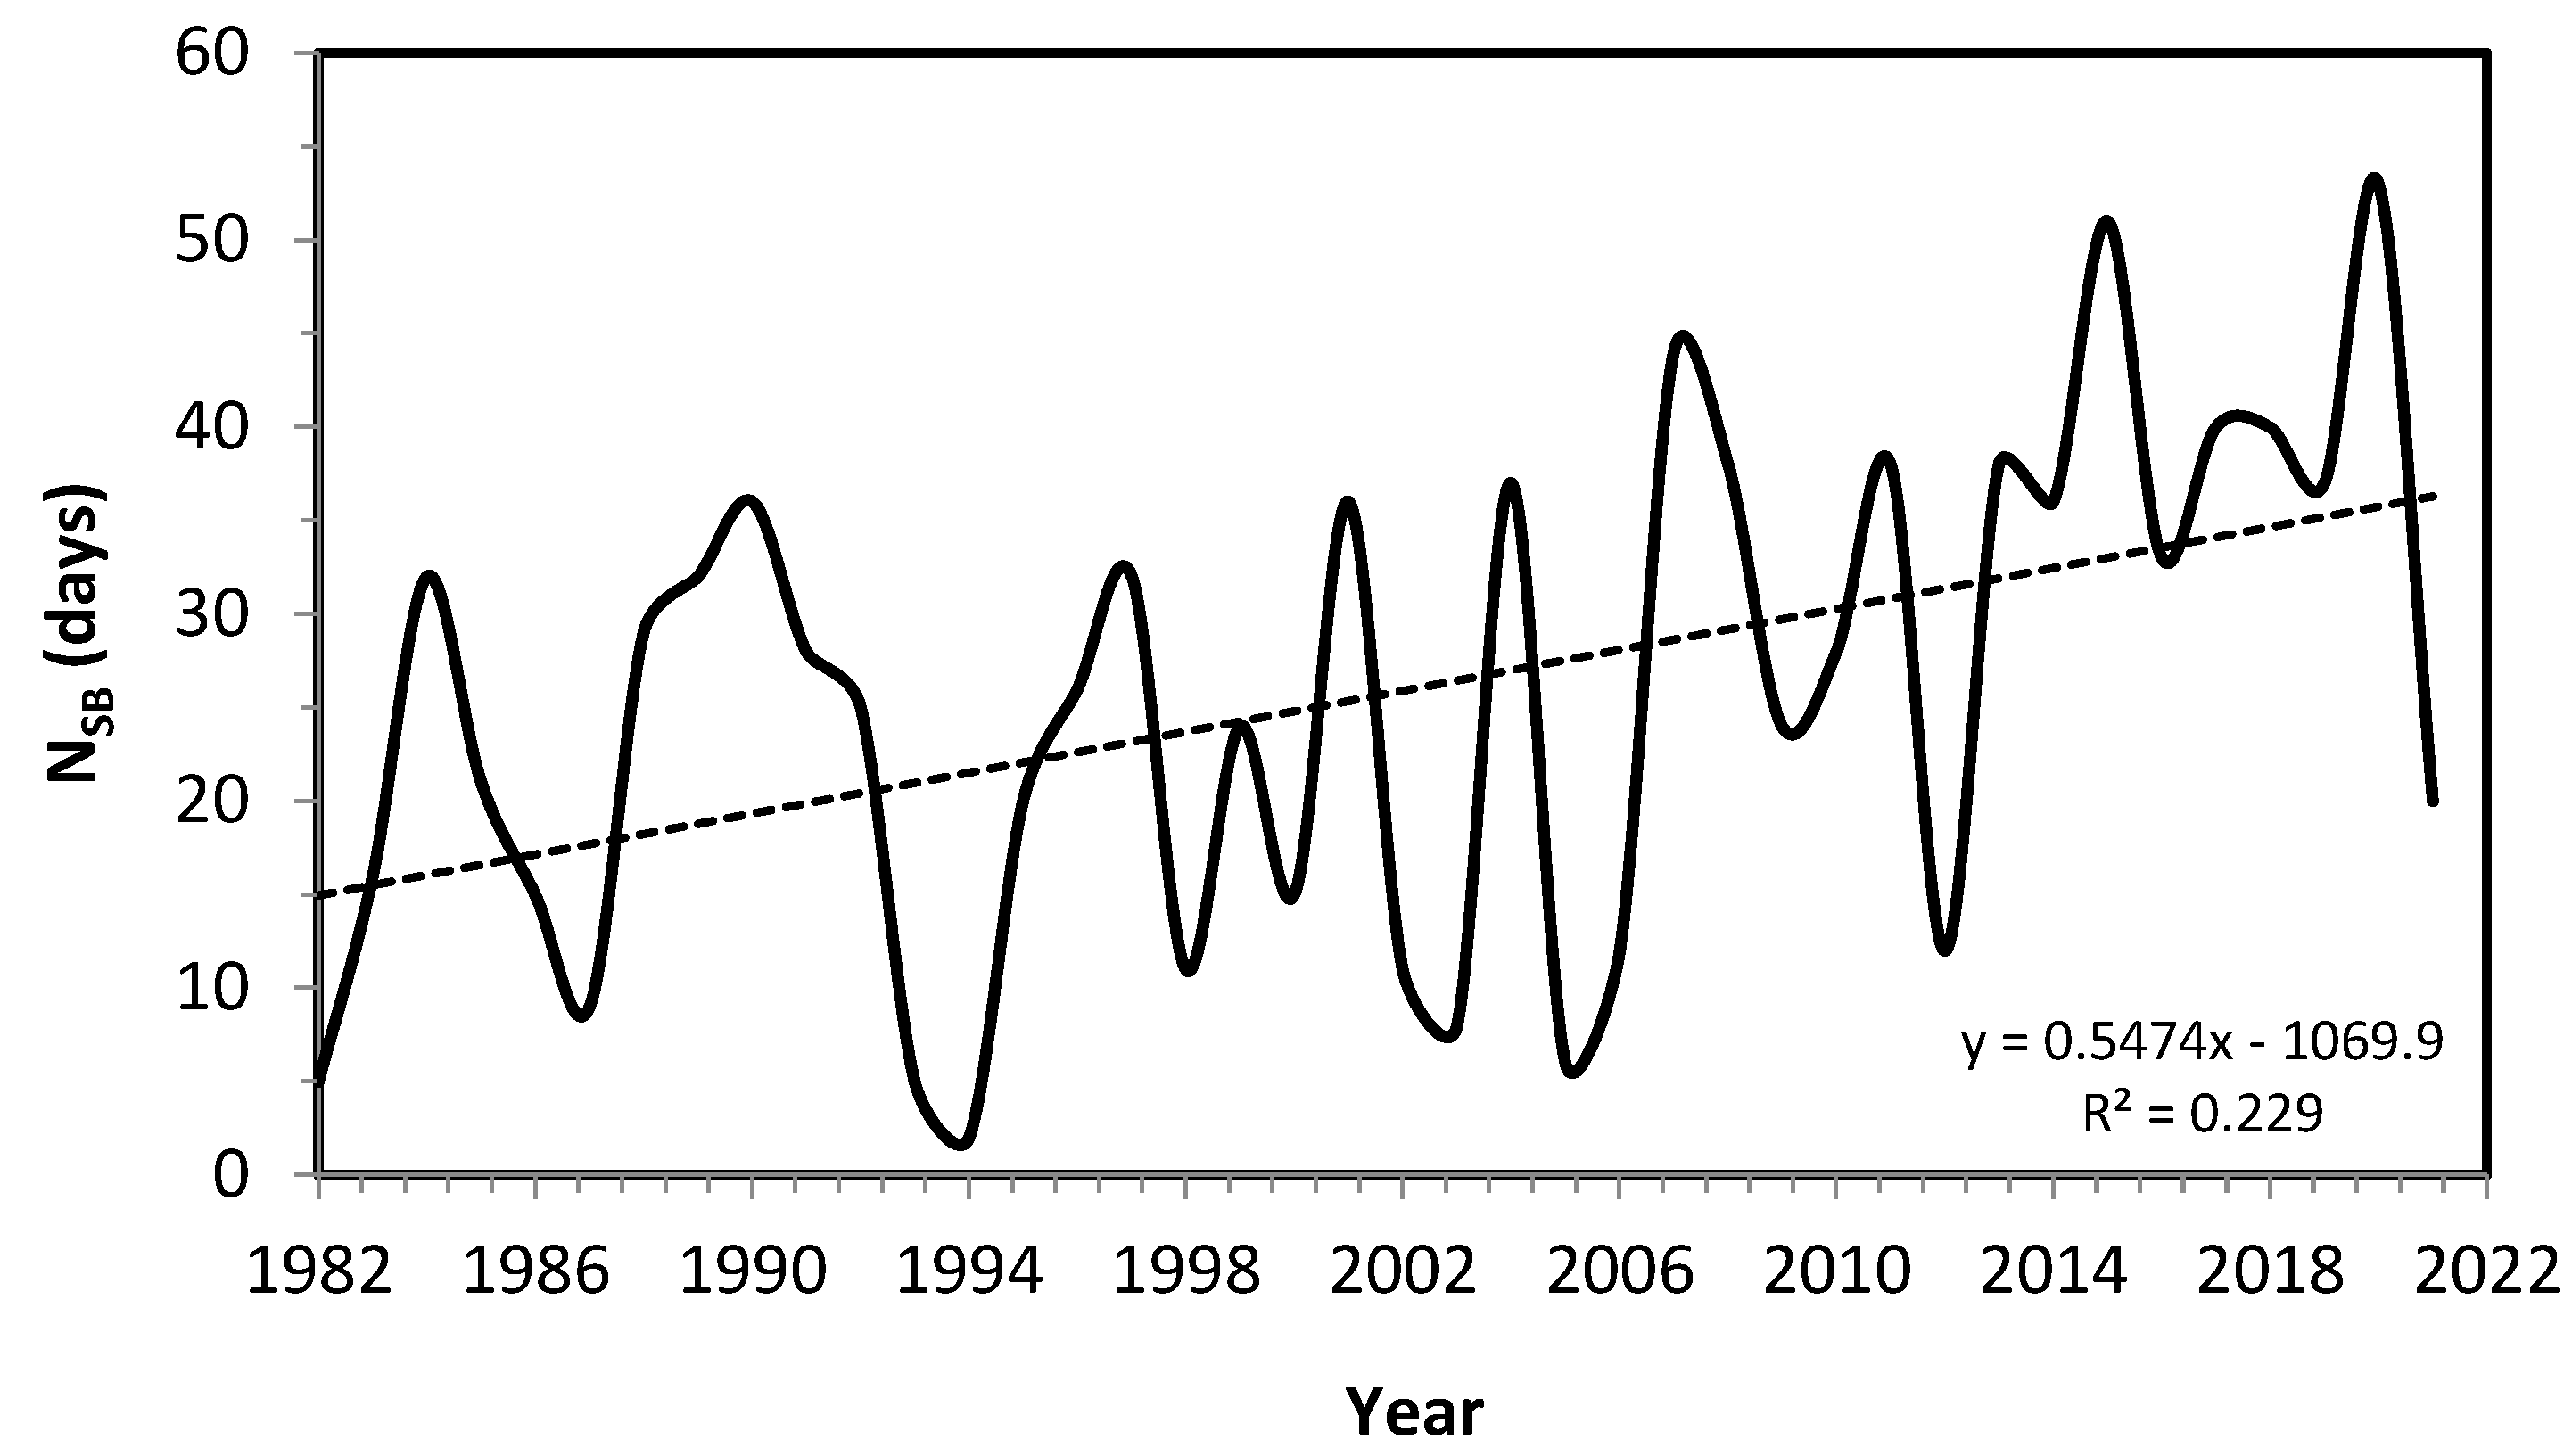
The length of the snow season is becoming shorter (Figure 5 and Figure 6). During the period 1982–2021, the first snowpack date was delayed by 5.5 ± 1.2 days per decade (p = 0.0001, R = 0.48), but the last snow cover date does not shift significantly (p = 0.12, R = 0.07). This recent shortening of snow seasons by 5.5 days per decade exceeds the figure of 3.4 days per decade reported by [47] for North America since 1972 and corresponds with the largest decreases in snow cover duration in zones of seasonal mean air temperatures ranging from −5° to +5°C, as reported by [24]. The decreasing trend in the onset of snowmelt season (considered by snowpack depletion after reaching the maximum snow water equivalent) (Figure 7) is not significant at the 0.05 threshold (p = 0.26, R = 0.20).
3.2. Forest Cover
Initially, the Jizerka catchment was dominated by mature Norway spruce stands (Picea abies (L.) Karst.). In 1984, 62% of the catchment area was harvested by clear-cutting, and by the end of the 1980s, the harvested area reached 88% of the investigated catchment. The areal development of forest stands with reforestation in subsequent years, 1983 (mature spruce forest), 1985 (clear-cut), 1992, 2002, 2010, and 2022 (reforestation), is given in Figure 8.
In the reforested area, blue spruce (Picea pungens) and Norway spruce (Picea abies) dominate with 48% and 32%, respectively, while deciduous species, such as mountain-ash (Sorbus aucuparia) and silver birch (Betula pendula), represent only 10%. In 2012, 25 years after the clear-cut, the leaf area index of reintroduced trees achieved values between LAI = 0.11 and 2.76 [41]. Additionally, there was the seasonal development of the assimilating surface of the herbaceous canopy reaching maximum values between 2.1 and 3.2 in the high summer. The corresponding values of the Normalized Difference Vegetation Index (NDVI) vary from 0.66 to 0.76.
3.3. Atmospheric Acid Deposition
Annual values of the open field load of sulphur and nitrogen registered at Jizerka in the years 1982–2021 are presented in Figure 9.
In the Jizerka experimental catchment, fog drip is significantly rising with the number of foggy days, elevation, and the canopy density [37]. Generally, in the upper part of the Jizera Mountains, the number of winter foggy days exceeds the summer foggy days by 60% [27]. For the respected canopy classes (Figure 8), the fog drip coefficient Fc (Equation (7)) was found to decrease from Fc = 1 (mature spruce forests with the horizontal canopy density CD > 0.8) to values Fc = 0.33 (middle age stands with CD > 0.3) and Fc = 0.18 (young stands with a dominant herbaceous layer by CD < 0.3). Seasonal coefficients b and b0 (Equation (3)) of the deposited fog water and acidic ions (SO42−, NO3− and NH4+) in summer (V–X) and winter (XI–IV) periods are given in Table 2.
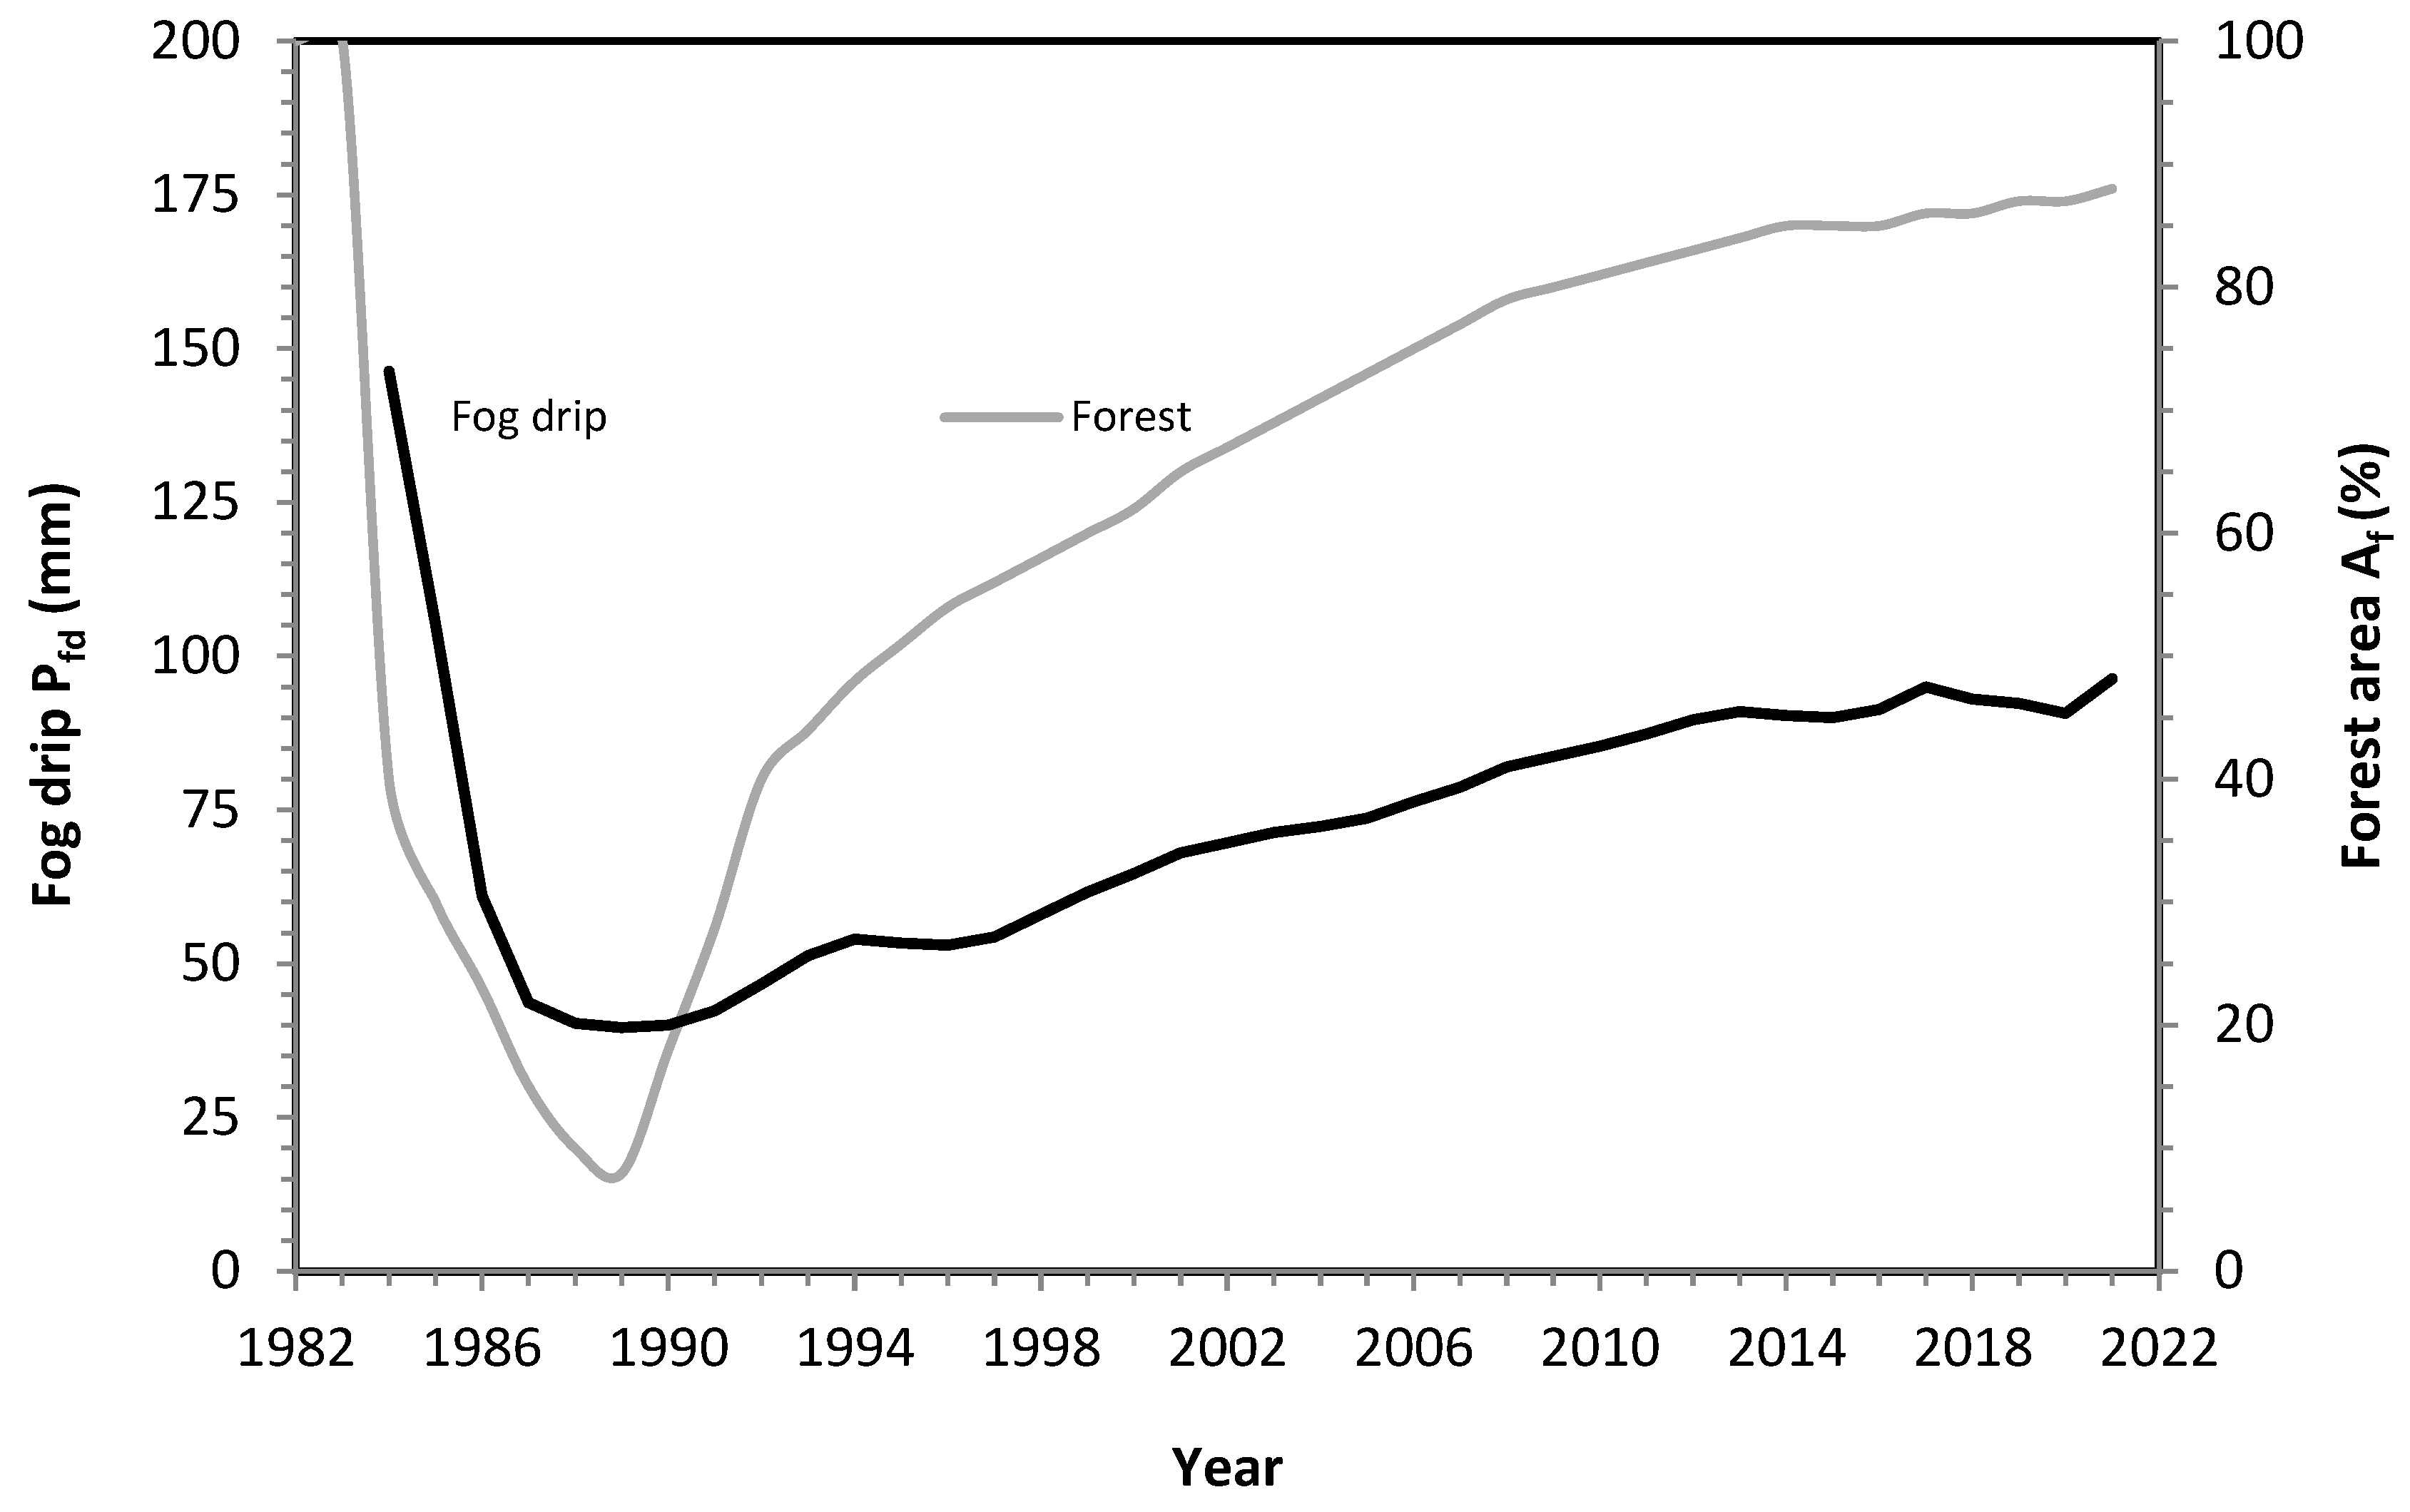
The annual fog drip varies between 39 and 175 mm (i.e., 3 and 14% of the gross precipitation) with lowest values of 3–5% after the clear-cut (1984–1991), rising from 4 to 9% with reforestation, and a maximum of 12–14% in the mature spruce stands (1982–1983), Figure 10.
Consequently, a load of sulphur registered under the canopy varies between 0.5 and 5.2 g m−2 (i.e., 30 and 136% of the open field deposition), and the load of nitrogen varies between 0.3 and 1.2 g m−2 (i.e., 21 and 84% of the open field deposition) (Figure 11). The highest under-the-canopy percentage (136% of sulphur and 84% of nitrogen) was detected in mature spruce stands, and the lowest values (30% of sulphur and 21% of nitrogen) were detected after the clear-cut (1984–1991). With reforestation, the percentage of under-the-canopy and open field loads of S and N have increased to 110% and 45%, respectively.
It is evident that the ratio between annual loads of sulphur and nitrogen in the studied catchment has changed from the original value of 3.5 (1982–1984) to the recent 0.5 (2019–2021). In winter, fog drip amounts (as well as loads of S and N) exceeded the summer volumes by 23–50%. The open field load of sulphur is controlled by the Sulphur Protocol [32], but a future rise in nitrogen deposition is still expected [26].
In the Jizerka catchment, fog drip can support water yield, but it can also significantly contribute to a decline in water quality (particularly in environments of a relatively low buffer capacity). At the catchment scale, the atmospheric acid load could be controlled by forestry practices that regulate the structure and extent of the canopy.
3.4. Water Yield and Runoff Timing
In the investigated period, the mean annual precipitation of the cold season (months November–April) (PXI–IV = 676 mm) exceeds that of the warm season (months May–October) (PV–X = 620 mm) by 56 mm (i.e., 9%). According to the relatively low values of potential evapotranspiration (ETPXI–IV = 66 mm) (i.e., 23% of the annual Hamon’s potential), the winter season is crucial for water resource recharge at Jizerka.
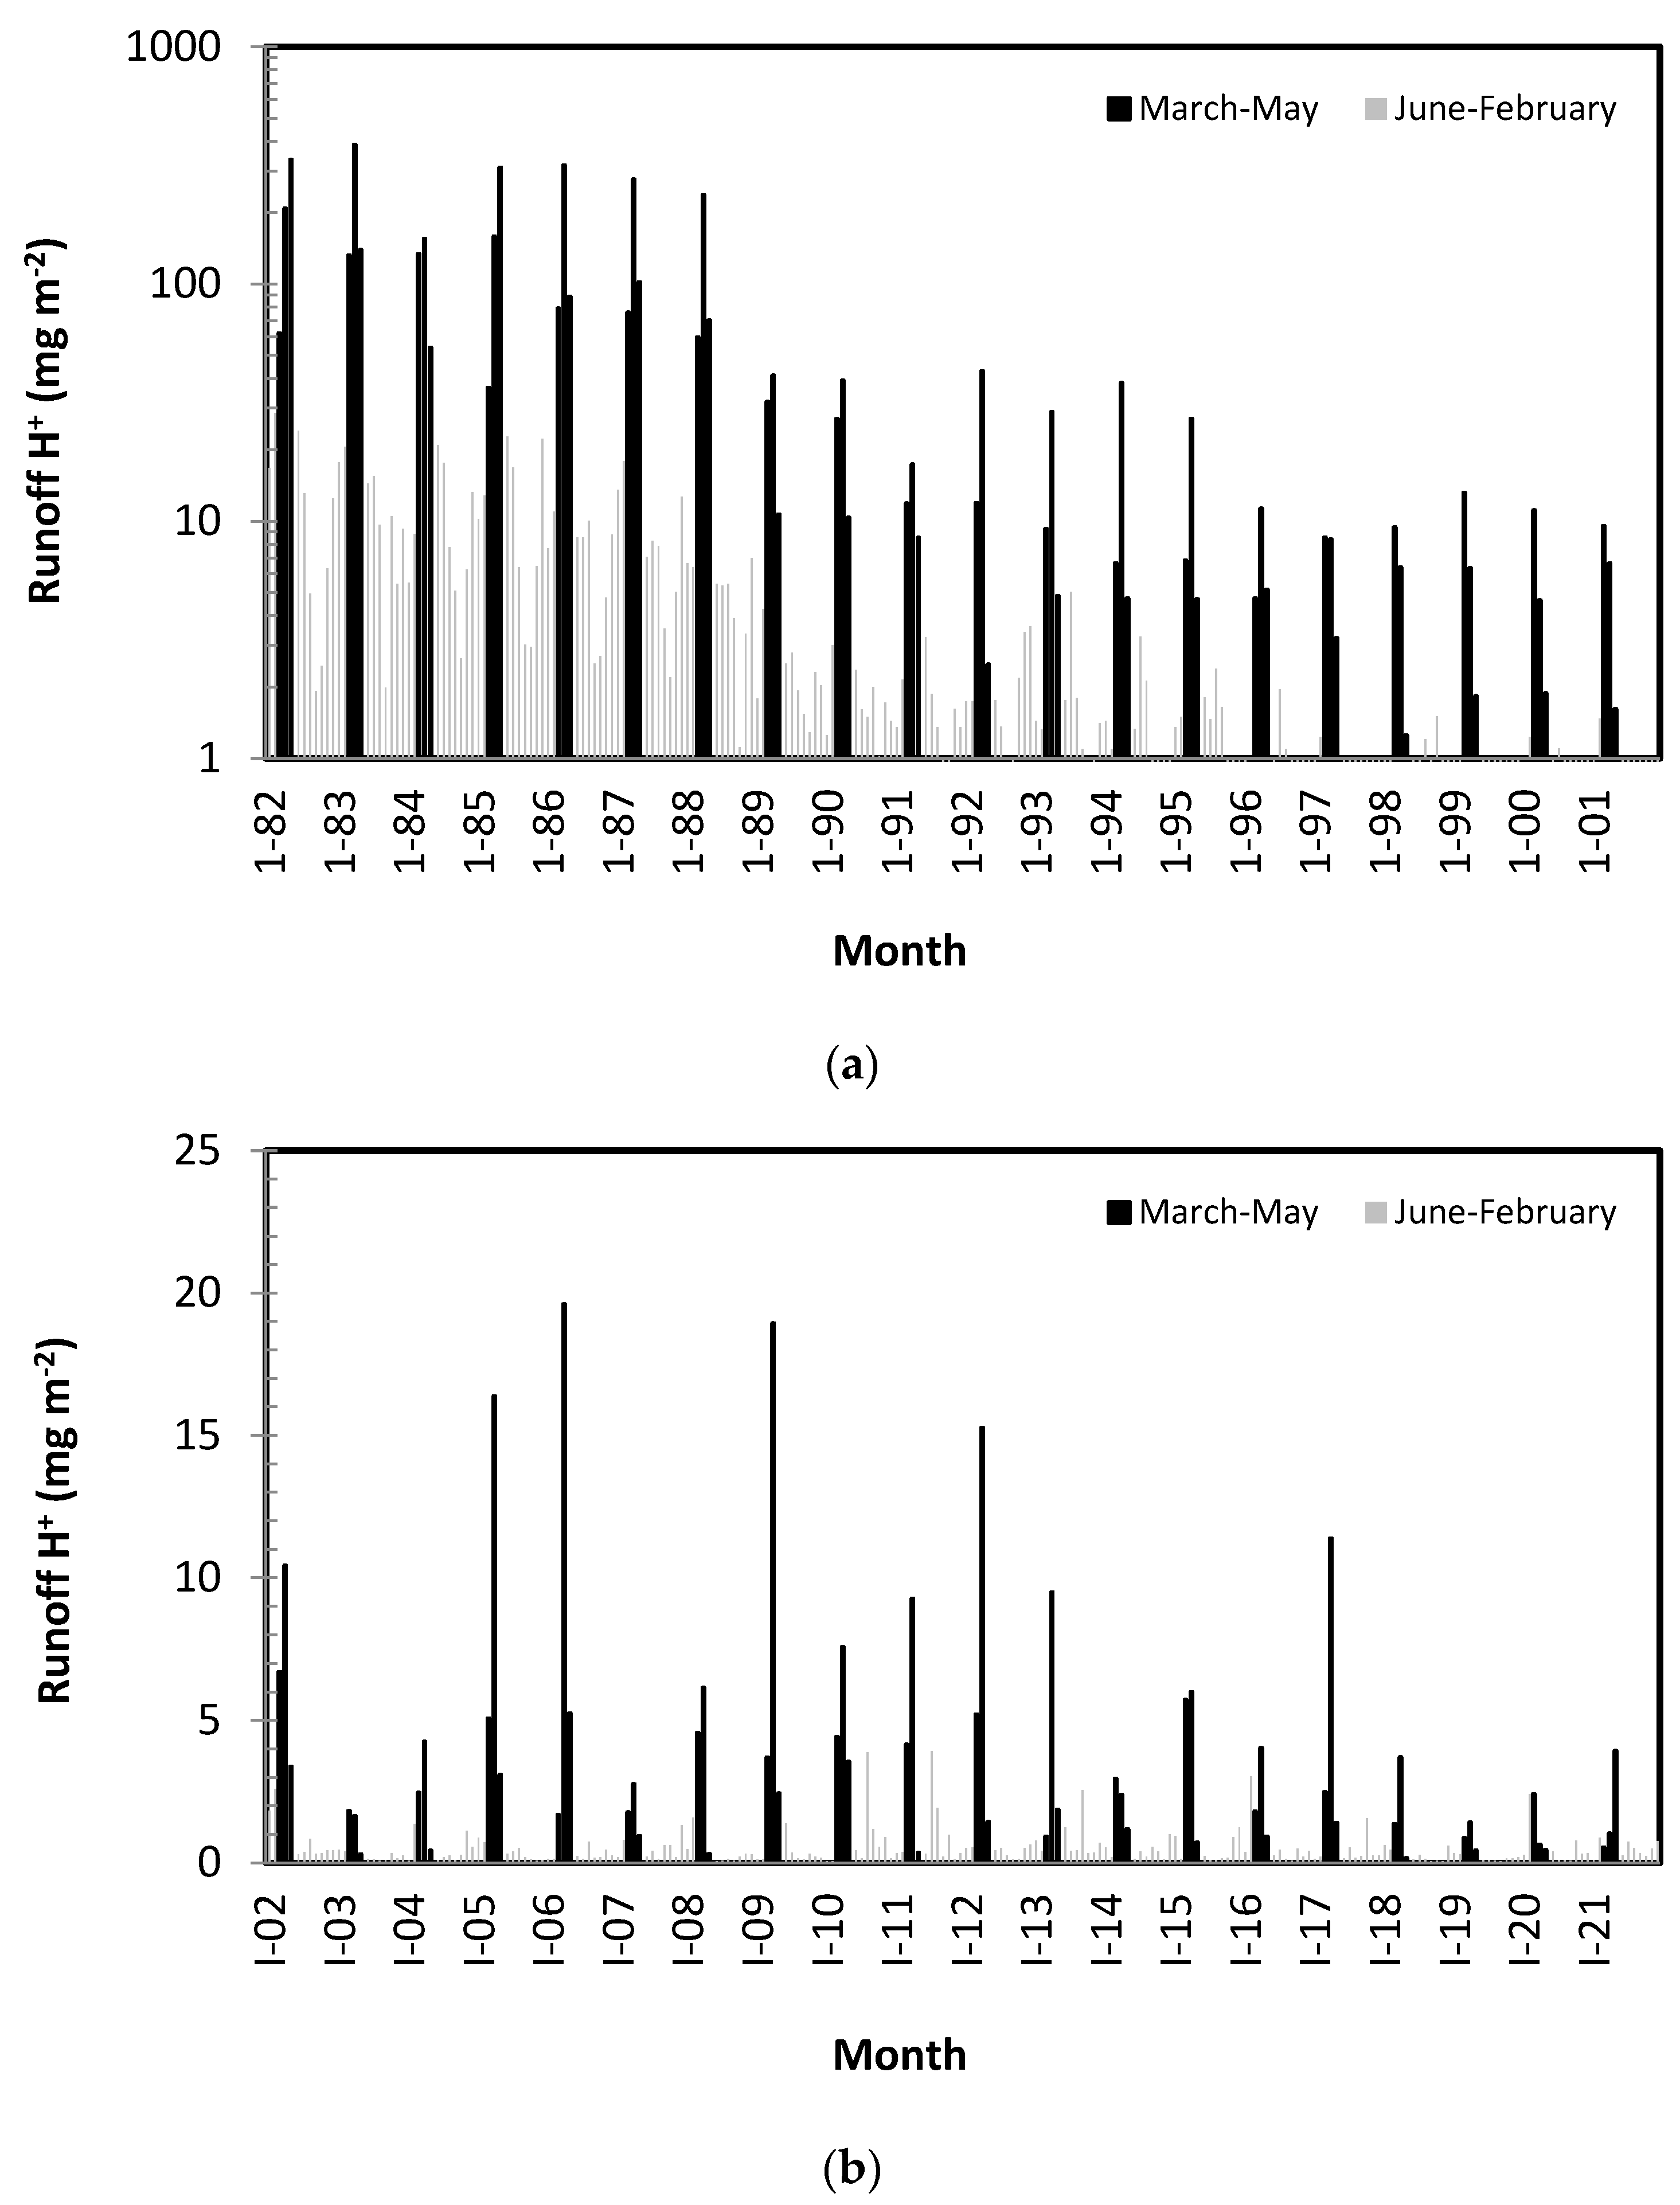
At the Jizerka outlet, from 1982 to 2021, 60% of the long-term mean annual runoff was registered in the cold season. Snowmelt dominates mainly in the springtime (March, April, and May) with 41% of the long-term annual water yield (1104 mm) (Figure 12 and Figure 13a,b).
Decreasing maximum snow water equivalent SWEmax (drop of 34 ± 8.6 mm per decade) is significant at the probability threshold p = 0.05 (p = 0.008, R = 0.31) (Figure 14).
The Kruskal–Wallis statistics (H = 4.96 and p = 0.24) did not confirm significant differences in the medians of intensive snowmelt runoff (March–May) within the periods of 1982–1985 (mature spruce stands), 1986–1991 (clear cutting), and three consequent decades after the clear-cutting (1992–2001, 2002–2011, and 2012–2021) at the probability level p = 0.05 (Figure 15). Therefore, the loss of canopy interception in the winter period seems to be compensated by the incoming fog drip.
The water yield of the investigated catchment is affected by additional fog drip from the forest canopy; currently, it is ca. 12% of the annual runoff [17]. With future warming and canopy changes, the incoming fog drip might decrease to 75% of the recent value. Generally, future warming projections claim a runoff decline in the summer and an increase in the winter season by 50–70% with a shift in maximum snowmelt runoff from May back to March. However, uncertainties in the European gridded precipitation used in mountainous regions by regional climate analysis are associated with up to 80% of the predicted values [49].
3.5. Runoff Extremes
The frequency of observed peak flows between 1982 and 2021 was estimated by extrapolating the annual maximum series (skewness 2.74 and variation coefficient 0.41) with the Log–Pearson III Distribution [36]. In the investigated 40 years, snowmelt processes dominated the annual peak flows in 18 years (i.e., 45%, mainly in March–April) and summer flash floods in 22 years (i.e., 55%, mainly in July–August), Table 3.
While snowmelt runoff maxima reached frequencies up to 0.13 (return period of 1–8 years), summer rainstorms created events with frequencies up to 0.02 (1–50 years). This situation corresponds to the ‘depth–area–duration’ dependency by summer rainstorms and the relatively small area of headwater catchments. Concerning the definition of Davis [50], the return period of extreme floods exceeds 50 years; therefore, summer rainstorm events are fundamental for flood protection in the studied area (Figure 16).
With regard to the time series of annual runoff maxima (Figure 17), peak flows from snowmelt do not show a significant trend (p = 0.071, R = 0.21) from 1982 to 2021, but summer maxima are rising by 0.13 ± 0.05 m3 s−1 per decade (p = 0.02, R = 0.32) for the probability threshold p = 0.05. Such a trend can be interpreted as a 6% increase in the flow with a return period of 50 years.
Runoff maxima are related also to processes of soil erosion and sedimentation. In the studied catchment, soil erosion responds namely to summer flash floods from rainstorms with relatively high flow velocities and forest harvest practices [51]. On the harvested plots not affected by skid trails, the loss of soil was 0.007–0.014 mm year−1 (comparable with undisturbed spruce stands), but the transport of eroded soil in skid trails reaching 6.17 mm (61.73 m3 ha−1) was observed dominantly in summer months where ca. 25% of the eroded material soil was registered at the catchment outlet [17,51]. Snowmelt peak flows were not found critical; moreover, they decreased from 1982 to 2022 (Figure 16).
Annual minimum flows Qmin occur in the outlet of investigated catchment during late summer (August–September). Those values reach 16–35% of the mean annual runoff, and there is not a significant trend in their time series 1982–2021 (p = 0.16, R = 0.12). The impacts of winter conditions on low summer flows in snow-affected catchments are reported by several studies [7,52]. Namely, the snow water equivalent is considered the dominant winter preconditioning factor of low flows, particularly at the end of summer. However, in the studied catchment of Jizerka, there is no relationship between annual maximum snow water equivalent SWEmax and annual minimum flow Qmin in 1982–2021 (p = 0.42, R = 7 × 10⁻⁵) (Figure 17), probably because of relatively low groundwater storage in the fractured granite reservoir [28] and humid environment [27].
3.6. Seasonal Acidification
In high snowmelt periods (March–April), the observed stream flow dominates (Figure 12 and Figure 13a,b) with rising outflow of hydrogen ions H+ and lowering of pH values (Figure 18a,b).
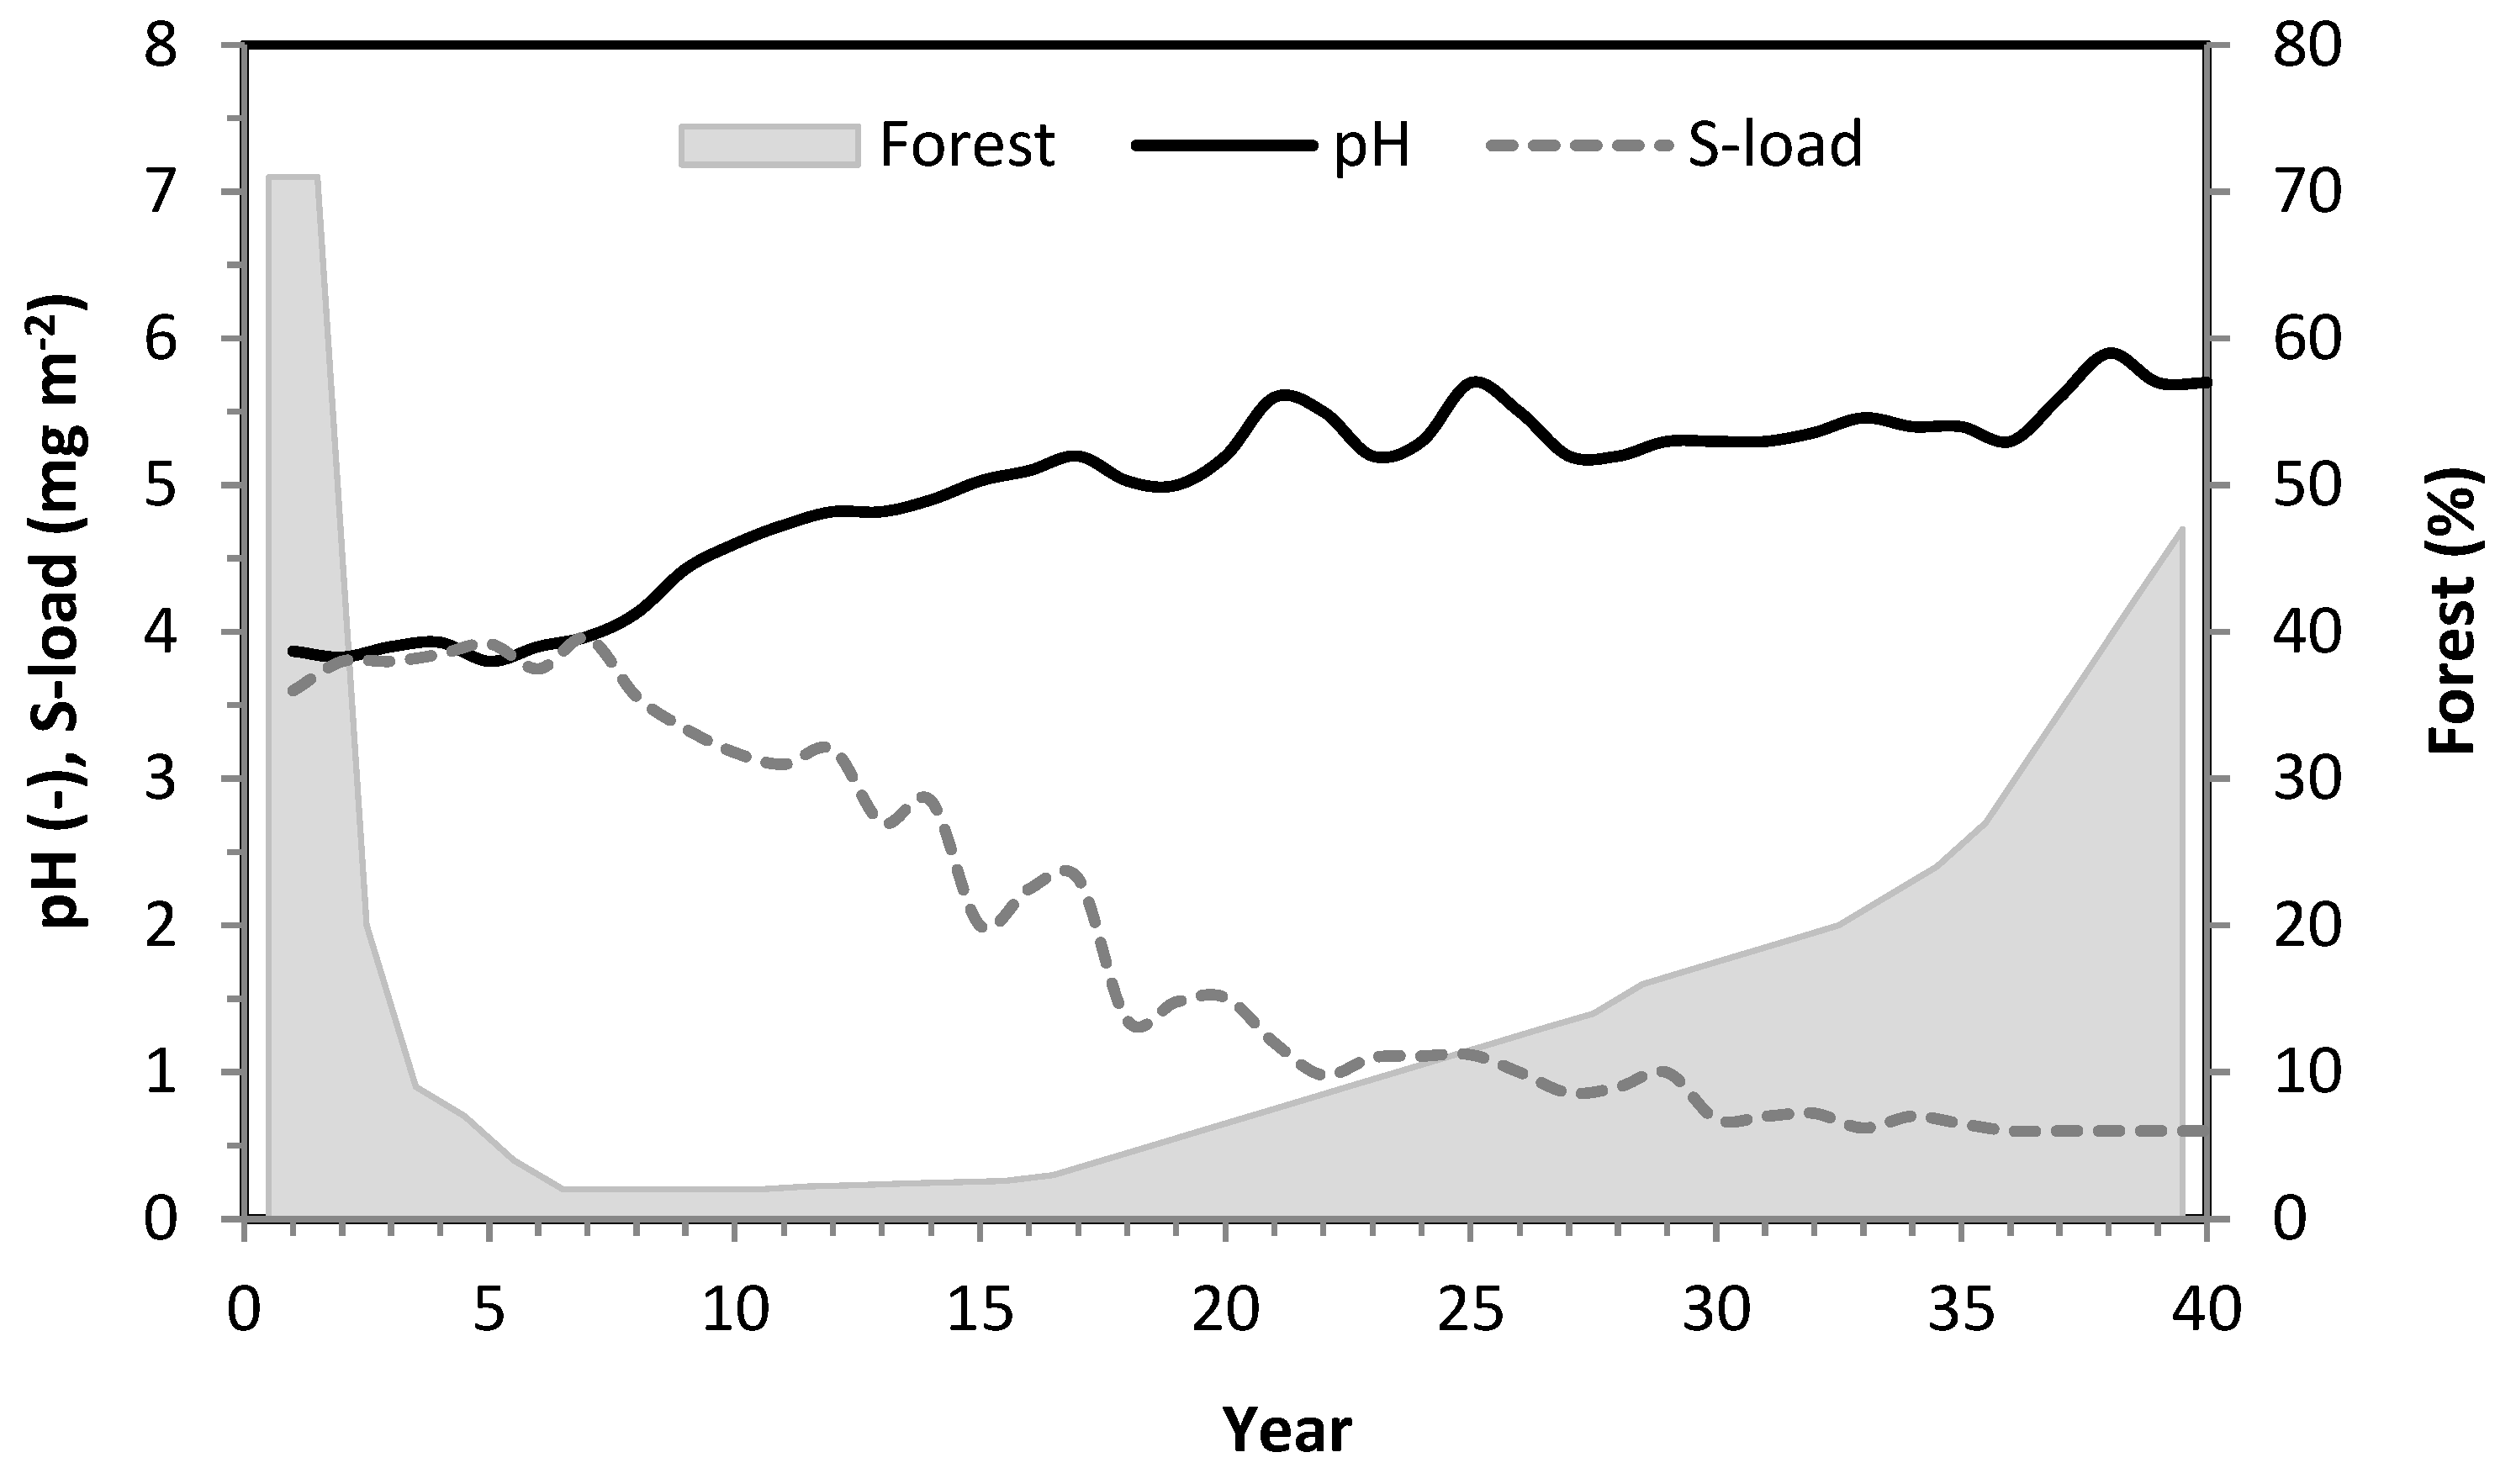
In the analysed years 1982–2021, both seasonal characteristics volume of runoff RIII-V and peak flow from snowmelt Qmax correlate significantly with annual snowpack duration (SP-D) and annual maximum snow water equivalent SWEmax, Table 4, while seasonal pH of stream water is driven by the load of acidic ions and canopy density (Figure 19).
A significant decline of sulphate concentrations in European headwater streams in the 1990s (against the average of the 1980s) has been reported by [53]. The response in runoff has slowed down, particularly with the soil storage capacity. The rapid increase of pH in stream water at Jizerka (0.06 units year−1) corresponds with both reduction of open field load of sulphur (Figure 9) and reduction of extreme throughfall under the canopy (Figure 11 and Figure 19). The relatively fast response of the sulphate runoff to the drop in the deposition during the 1990s reflects the clear-cut of spruce forests (1984–1988) and prevailing fast subsurface runoff generated in relatively shallow podzolic soils of a low sulphate storage capacity [20]. For example, this gradient exceeds the value 0.01 units year−1 found in forest catchment in the White Mts. (New Hampshire, U.S.) [16]. The mean annual runoff of sulphur (2.96 g m−2 year−1) exceeds the open field deposition (2.14 g m−2 year−1) by 38% but does not reach the total deposition (3.31 g m−2 year−1, 89%) while the mean annual runoff of nitrogen (0.95 g m−2 year−1) does not reach both the total (2.43 g m−2 year−1, 39%) and the open field (1.68 g m−2 year−1, 56%) loads.
3.7. Environmental Health
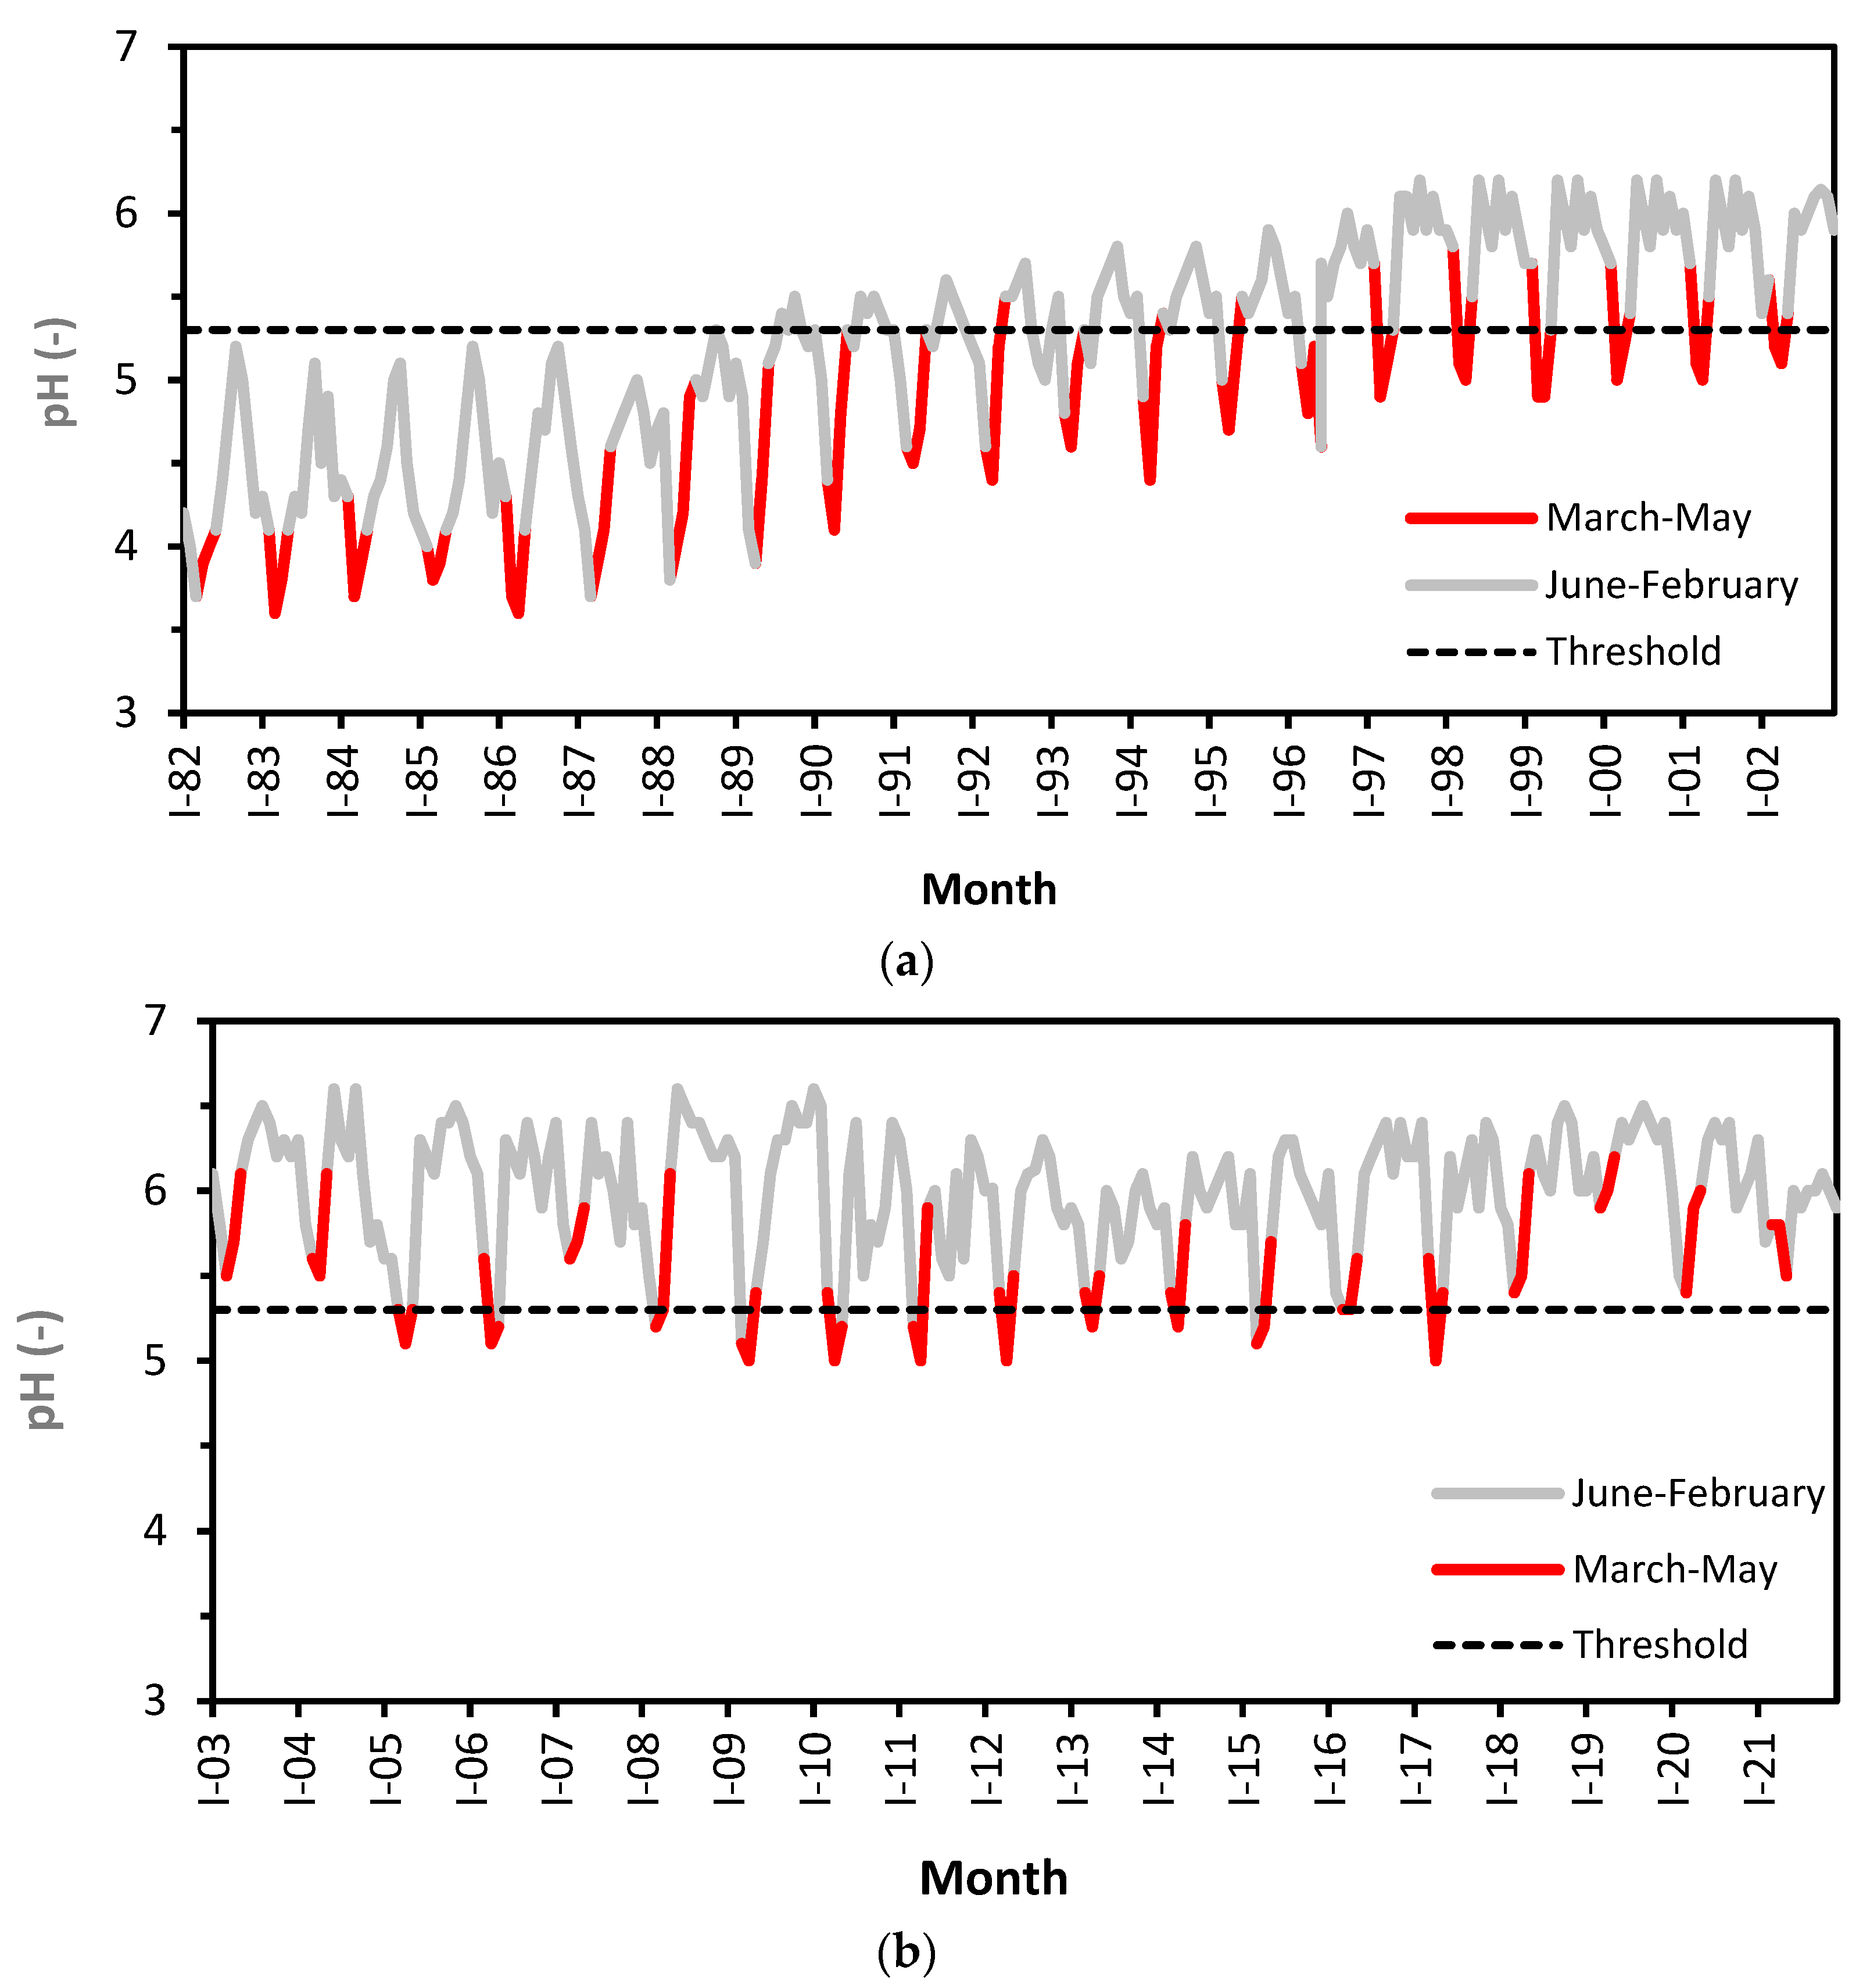
With respect to the drinking water standard, pH is one of the most important operational water quality parameters [54]. Without acid rain, distant headwater streams would have a pH level near 6.5 [55]. The drop in pH, particularly in the springtime (Figure 20), is associated with increased mobility of aluminium and heavy metals in the podzolic soil layer with a negative impact on water biota [56]. A threshold of pH = 5.3 is associated with the rapid mobilisation of toxic aluminium [57]. Particularly, low pH, low hardness (up to 10 mg L−1 of calcium and magnesium), and high aluminium contents (above 0.2 mg L−1) were observed in surface waters of the Jizera Mountains in the 1980s [22]. In the months March–May, the seasonal drop in pH values is typically below the safe threshold 5.3 (Figure 20a,b).
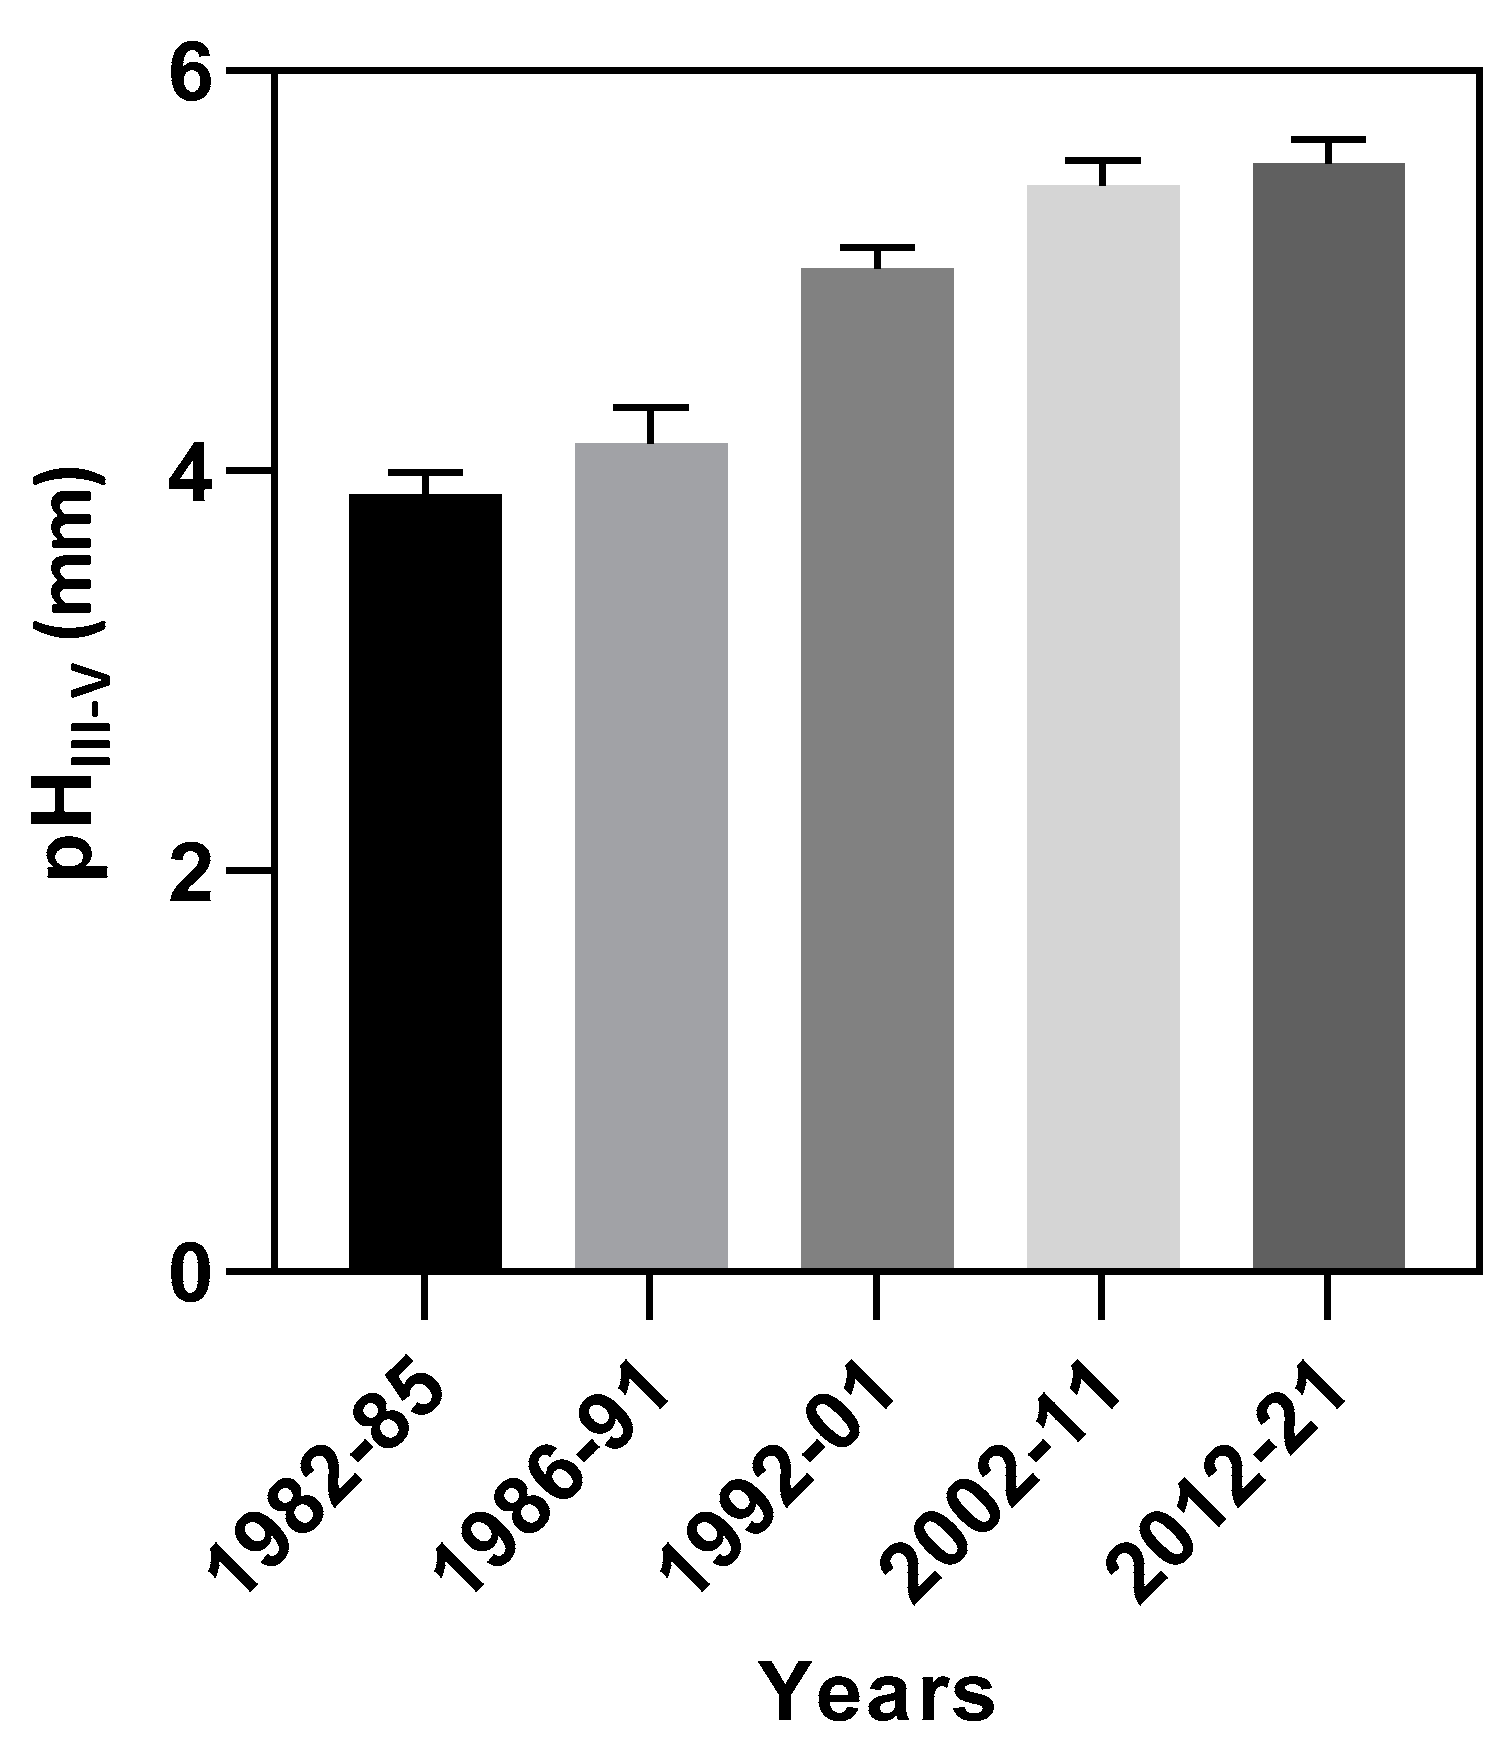
Significantly rising seasonal pH in streamflow of the Jizerka catchment was confirmed by the Kruskal–Wallis test: medians of pH values vary significantly (p < 0.0001, H = 84.86) within time periods 1982–85 (mature spruce plantations), 1986–91 (clear-cutting), and three following decades (1992–2001, 2002–2011, and 2012–2021) (Figure 21). The significant change in trend was detected in the year 1996, where the gradient in linear regression changed from 0.007 to 0.002 (both significant at p = 0.05). This situation has been affected particularly by two factors: reduced open-field load of sulphur (p < 0.0001, R = 0.75), as result of the Helsinki Sulphur Protocol [32], and the percentage of forests with the horizontal canopy density CD > 0.3 (p = 0.034, R = 0.34) at the probability threshold p = 0.05. With these changes, in the 1990s, aluminium contents in stream waters in the Jizerka Basin were reported below 0.2 mg L−1 [22].
In snowmelt seasons, periodic drops in pH below the threshold pH = 5.3 (Figure 20a,b) limit the full recovery of stream water in the Jizerka catchment. Decreasing the pH in streamflow by summer flash floods with relatively higher peak flows but lower volumes of direct runoff influences the aquatic environment for a much shorter time (several hours versus tens of days annually).
To avoid harmful impacts on sensitive ecosystems, the concept of critical load for atmospheric inputs of sulphur and nitrogen must be addressed [58]. In the studied catchment at Jizerka, the critical load of sulphur (75 meq m−2 year−1, provided by [59]) has been exceeded until 2002 (75–247 meq m−2 year−1) in the open field (herbaceous vegetation) but permanently exceeded in forest stands (79–553 meq m−2 year−1). The critical load of nitrogen (55 meq m−2 year−1) still remains exceeded in both herbaceous vegetation (99–149 meq m−2 year−1) and spruce stands (142–206 meq m−2 year−1).
4. Conclusions
The cold season (November–April) is critical for hydrological recharge in the Jizerka headwater catchment: long-term winter precipitation volume exceeds the summer data by 56 mm (i.e., 9%), and evapotranspiration potential is only 66 mm (i.e., 23% of the annual estimate). At the Jizerka outlet, 60% of long-term mean annual runoff was registered in the winter half of the year, and snowmelt dominates mainly in the spring months (March, April, and May) with 453 mm (i.e., 41% of the long-term annual water yield).
At the catchment outlet, snowmelt dominated the annual peak flows in 18 years (i.e., 45% of the studied 40 years) and summer flash floods in 22 years (i.e., 55%). While peak flows from snowmelt reached frequencies up to 0.13 (return period of 1–8 years), summer flash floods reached only up to 0.02 (return period of 1–50 years). Thus, summer rainstorms are critical for flood protecting in small headwater catchments, but snowmelt events are important for water quality decline related to acidification. In the last 40 years, snowmelt peaks do not show a change, but summer maxima are rising by 0.13 m3 s−1 per decade (i.e., 6% of the 50-year discharge). There was no confirmed relationship between maximum snow water equivalent and summer low flows, probably because of relatively pure groundwater storage in the fractured granite reservoir.
Snowmelt volumes and peak flows correlate significantly with the snowpack duration and maximum snow water equivalent, while the seasonal pH of stream water is driven by the atmospheric load of acidic ions (and air pollution control) and canopy density. The seasonal acidification (low pH values) in March–May is associated with low water hardness and mobilisation of aluminium and heavy metals by the threshold pH = 5.3. The rising seasonal pH of streamflow at Jizerka is evident (namely in the 1990s) as a consequence of both reduced sulphur emissions and reduction in the forest canopy. However, the studied catchment is still exposed to the atmospheric loads above the critical values of sulphur and nitrogen estimated for forests, and, in snowmelt seasons, the aquatic environment is still exposed to pH values below the safe threshold for tens of days annually. This situation complicates a full recovery of surface waters in the headwater catchment of the Jizera Mountains.
Since 1982, the mean annual air temperature has been increasing by 0.26 °C per decade with more intensive warming (0.64 °C per decade) in the dormant season (XI–IV or November through April). The shortening of snowpack duration (by 5.5 days per decade) corresponds with the largest drop in snow cover duration observed in zones of seasonal air temperatures ranging from −5° to +5 °C. Consequently, a decline in seasonal maximum snow water equivalent (34 mm per decade) is evident. Trends in annual precipitation are not significant (at p = 0.05).
Author Contributions
Conceptualization: J.K.; methodology: J.K., L.P. and E.S.; software and data validation: L.P. and L.Š.; field investigations: J.K., L.P. and L.Š.; analyses: E.S. and L.Š.; writing—original draft preparation: J.K.; writing—review and editing: E.S.; supervision and project administration: J.K. All authors have read and agreed to the published version of the manuscript.
Funding
This research was supported by the Earthwatch Institute (Oxford, UK, Mountain Waters of Bohemia, 1991–2012), Czech Science Foundation (Grant No. 526-09-0567), CLIMHEAD, 2009–2013), the Czech Ministry of Education (INTER-EXCELLENCE: INTER-COST LTC 17006, 2017–2020), Czech Science Foundation (Grant No. 23-06075S), and Czech Technical University in Prague (SGS 22/093/OHK1/2T/11, 2022–2023).
Data Availability Statement
The collected data sets are unavailable due to privacy and ethical restrictions.
Acknowledgments
Our thanks are also to Joanna P. Ballard for language corrections, Zuzana Hořická (co-PI of the Earthwatch project in 1994–2008) for her field logistic assistance, Jiří Vrtiška for technical maintenance of field observation systems, and all the Earthwatch volunteers for their participation in field expeditions.
Conflicts of Interest
The authors declare no conflict of interest.
References
- Bruland, O. Snow Processes, Modeling, and Impact. In Precipitation: Earth Surface Responses and Processes; Rodrigo-Comino, J., Ed.; Elsevier Inc.: Amsterdam, The Netherlands, 2021; pp. 107–143. [Google Scholar]
- WMO. Guide to Hydrological Practices (Data Acquisition and Processing, Analysis, Forecasting and Other Applications). WMO-No. 168, 15th ed.; World Meteorological Organization: Genéva, Switzerland, 1994; 735p. [Google Scholar]
- DeBeer, C.M.; Pomeroy, J.W. Influence of snowpack and melt energy heterogeneity on snow cover depletion and snowmelt runoff simulation in a cold mountain environment. J. Hydrol. 2017, 553, 199–213. [Google Scholar] [CrossRef]
- Viviroli, D.; Dürr, H.H.; Messerli, B.; Meybeck, M. Mountains of the world, water towers for humanity: Typology, mapping, and global significance. Water Resour. Res. 2007, 43, W07447. [Google Scholar] [CrossRef] [Green Version]
- Berghuijs, W.; Woods, R.; Hrachowitz, M. A precipitation shift from snow towards rain leads to a decrease in streamflow. Nat. Clim. Change 2014, 4, 583–586. [Google Scholar] [CrossRef] [Green Version]
- Varhola, A.; Coops, N.C.; Weiler, M. Forest canopy effects on snow accumulation and ablation: An integrative review of empirical results. J. Hydrol. 2010, 392, 219–233. [Google Scholar] [CrossRef]
- Berris, S.N.; Harr, R.D. Comparative snow accumulation and melt during rainfall in forested and clear-cut plots in the western Cascades of Oregon. Water Resour. Res. 1987, 23, 135–142. [Google Scholar] [CrossRef]
- Barnhart, T.B.; Molotch, N.P.; Livneh, B.; Harpold, A.A.; Knowles, J.F. Snowmelt rate dictates streamflow. Geophys. Res. Lett. 2016, 43, 8006–8016. [Google Scholar] [CrossRef]
- Pomeroy, J.; Gray, D.; Hedstrom, N. Prediction of seasonal snow accumulation in cold climate forests. Hydrol. Process. 2002, 16, 3543–3558. [Google Scholar] [CrossRef]
- Brooks, K.H.; Folliott, P.F.; Magner, J.A. Hydrology and the Management of Watersheds, 4th ed.; John Wiley & Sons: New York, NY, USA, 2013; 533p. [Google Scholar]
- Neary, D.G.; Ice, G.G.; Jackson, C.R. Linkages between forest soils and water quality and quantity. For. Ecol. Manag. 2009, 258, 2269–2281. [Google Scholar] [CrossRef]
- FAO. The New Generation of Watershed Management Programmes and Projects; FAO Forestry Paper 150; Food and Agriculture Organization of the United Nations: Rome, Italy, 2006; 128p. [Google Scholar]
- Biswas, A.K.; Tortajada, C.; Izquierdo, R. Water Quality Management: Present Situations, Challenges and Future Perspectives; Routledge: London, UK, 2014. [Google Scholar]
- McDonald, R.I.; Weber, K.F.; Padowski, J.; Shemie, D. Estimating watershed degradation over the last century and its impact on water-treatment costs for the world’s large cities. Biol. Sci. 2016, 113, 9117–9122. [Google Scholar] [CrossRef]
- Schöpp, W.; Posch, M.; Mylona, S.; Johansson, M. Long-term development of acid deposition (1880–2030) in sensitive freshwater regions in Europe. Hydrol. Earth Syst. Sci. 2003, 7, 436–446. [Google Scholar] [CrossRef] [Green Version]
- Fuss, C.B.; Driscoll, C.T.; Campbell, J.L. Recovery from chronic and snowmelt acidification: Long-term trends in stream and soil water chemistry at the Hubbard Brook Experimental Forest, New Hampshire, USA. J. Geophys. Res. Biogeosciences 2015, 120, 2360–2374. [Google Scholar] [CrossRef]
- Křeček, J.; Nováková, J.; Palán, L.; Pažourková, E.; Stuchlík, E. Role of forests in headwater control with changing environment and society. Int. Soil Water Conserv. Res. 2021, 9, 143–157. [Google Scholar] [CrossRef]
- Nawrot, A.P.; Migała, K.; Pakszys, P.; Głowacki, P. Chemistry of snow cover and acidic snowfall during a season with a high level of air pollution on the Hans Glacier, Spitsbergen. Polar Sci. 2016, 10, 249–261. [Google Scholar] [CrossRef]
- Tian, X.; Cui, K.; Sheu, H.L.; Hsieh, Y.K.; Yu, F. Effects of rain and snow on the air quality index, PM2.5 levels, and dry deposition flux of PCDD/Fs. Aerosol Air Qual. Res. 2021, 21, 210158. [Google Scholar] [CrossRef]
- Křeček, J.; Palán, L.; Pažourková, E.; Stuchlík, E. Water-quality genesis in a mountain catchment affected by acidification and forestry practices. Freshw. Sci. 2019, 38, 257–269. [Google Scholar] [CrossRef]
- United Nations Environmental (UNEP). Global Environmental Outlook GEO—4: Environment for Development; Programme, Progress Press Ltd.: Valetta, Malta, 2007; 540p. [Google Scholar]
- Křeček, J.; Hořická, Z. Forests, air pollution and water quality: Influencing health in the headwaters of Central Europe’s “Black Triangle”. Unasylva 2006, 57, 46–49. [Google Scholar]
- Bolstad, P.V.; Swank, W.T. Cumulative impacts of landuse on water quality in a southern Appalachian watershed. J. Am. Water Resour. Assoc. 1997, 33, 519–553. [Google Scholar] [CrossRef]
- Brown, R.D.; Mote, P.W. The response of Northern Hemisphere snow cover to a changing climate. J. Clim. 2009, 22, 2124–2145. [Google Scholar] [CrossRef]
- IPCC. Climate Change 2022: Impacts, Adaptation and Vulnerability. In Sixth Assessment Report of the Intergovernmental Panel on Climate Change; IPCC: Genéva, Switzerland, 2022; 35p. [Google Scholar]
- IPCC. Climate Change 2014: Synthesis Report. In Fifth Assessment Report of the Intergovernmental Panel on Climate Change; IPCC: Genéva, Switzerland, 2014; 151p. [Google Scholar]
- Tolasz, R. Climate Atlas of the Czech Republic; Czech Hydrometeorological Institute: Prague, Czech Republic, 2007; 255p. [Google Scholar]
- Chaloupský, J. Geology of the Giant Mts and Jizera Mts; Academia: Prague, Czech Republic, 1989; 288p. (In Czech) [Google Scholar]
- Thai, S.; Pavlů, L.; Tejnecký, V.; Chovancová, S.; Hin, L.; Thet, B.; Němeček, K.; Drábek, O. Temporal changes in soil chemical compositions in acidified mountain forest soils of Czech Republic. Eur. J. For. Res. 2023, 142. [Google Scholar] [CrossRef]
- Tureček, K. The Water Act; SONDY: Prague, Czech Republic, 2002; 349p. (In Czech) [Google Scholar]
- Kopáček, J.; Hejzlar, J.; Krám, P.; Oulehle, F.; Posch, M. Effect of industrial dust on precipitation chemistry in the Czech Republic (Central Europe) from 1850 to 2013. Water Res. 2016, 103, 30–37. [Google Scholar] [CrossRef]
- Holen, S.; Wright, R.F.; Seifert, I. Effects of Long Range Transported Air Pollution (LRTAP) on Freshwater Ecosystem Services; ICP-Waters Report 115/2013; Norwegian Institute for Water Research: Oslo, Norway, 2013; 43p. [Google Scholar]
- Zlatník, A. Forest Phytocenology; SZN: Prague, Czech Republic, 1976; 495p. (In Czech) [Google Scholar]
- Špulák, O.; Kacálek, D.; Balcar, V. Seven spruce species on a mountain site—Performance, foliar nutrients, and forest floor properties in stands 20 years old. iForest 2019, 12, 106–113. [Google Scholar] [CrossRef]
- Kelly, T. The ecology of environmental health. Environ. Health Insights 2008, 21, 25–36. [Google Scholar] [CrossRef] [PubMed]
- Shaw, E.M.; Beven, K.J.; Chappell, N.A.; Lamb, R. Hydrology in Practice, 4th ed.; Spon Press: New York, NY, USA, 2010; 542p. [Google Scholar]
- Křeček, J.; Palán, L.; Stuchlík, E. Acid atmospheric deposition in a forested mountain catchment. iForest 2017, 10, 680–686. [Google Scholar] [CrossRef] [Green Version]
- Krečmer, V.; Páv, B. Methodology to estimate the number of rain gauges under the forest canopy. J. Hydrol. Hydromech. (Vodohospodársky Časopis) 1982, 30, 479–490. (In Czech) [Google Scholar]
- Lovett, G.M.; Reiners, W.A. Canopy structure and cloud water deposition in subalpine coniferous forests. Tellus 1986, 38, 319–327. [Google Scholar] [CrossRef] [Green Version]
- Stuchlík, E.; Kopáček, J.; Fott, J.; Hořická, Z. Chemical composition of the Tatra Mountain lakes: Response to acidification. Biologia 2006, 18, S11–S20. [Google Scholar] [CrossRef]
- Palán, L.; Křeček, J.; Sato, Y. Leaf area index in a forested mountain catchment. Hung. Geogr. Bull. 2018, 67, 3–11. [Google Scholar] [CrossRef] [Green Version]
- Watts, S.B.; Tolland, L. Forestry Handbook for British Columbia, 5th ed.; UBC Faculty of Forestry: Vancouver, BC, Canada, 2005; 464p. [Google Scholar]
- Sasaki, N.; Putz, F.E. Critical need for new definitions of “forest” and “forest degradation” in global climate change agreements. Conserv. Lett. 2009, 2, 226–232. [Google Scholar] [CrossRef]
- Haith, D.A.; Shoemaker, L.L. Generalized watershed loading functions for stream flow nutrients. Water Resour. Bull. 1987, 23, 471478. [Google Scholar] [CrossRef]
- Motulski, H.J.; Searle, P. InStat Guide to Choosing and Interpreting Statistical Tests; GraphPad Software, Inc.: San Diego, CA, USA, 1998; 154p. [Google Scholar]
- WMO. Technology for detecting trends and changes in time series of hydrological and meteorological variables. In Hydrological Operational Multipurpose System; World Meteorological Organization: Geneva, Switzerland, 2001; 28p. [Google Scholar]
- EPA. Climate Change Indicators: Snow Cover; U.S. Environmental Protection Agency: Washington, DC, USA, 2022. Available online: https://www.epa.gov/climate-indicators/climate-change-indicators-snow-cover (accessed on 16 May 2023).
- Vandenberghe, C.; Freléchoux, F.; Gadallah, F.; Buttler, A. Competitive effects of herbaceous vegetation on tree seedling emergence, growth and survival: Does gap size matter? J. Veg. Sci. 2006, 17, 481–488. [Google Scholar] [CrossRef]
- Prein, A.F.; Gobiet, A. Impacts of uncertainties in European gridded precipitation observations on regional climate analysis. Int. J. Climatol. 2017, 37, 305–327. [Google Scholar] [CrossRef]
- Davis, D.W. Is the current approach to managing flood threats in the United States sustainable? In Water Resources Engineering (EWRI Conference Proceedings); Environment and Water Resources Institute: Tampa, FL, USA, 2007; 638p. [Google Scholar]
- Křeček, J.; Nováková, J.; Palán, L.; Pažourková, E. Soil conservation in a forested mountain catchment. EQA Environ. Qual. 2019, 33, 27–36. [Google Scholar]
- Kinnard, C.; Bzeouich, G.; Assani, A. Impacts of summer and winter conditions on summer river low flows in low elevation, snow-affected catchments. J. Hydrol. 2022, 605, 127393. [Google Scholar] [CrossRef]
- Prechtel, A.; Alewell, C.; Armbruster, M.; Bittersohl, J.; Cullen, J.M.; Evans, C.D.; Helliwell, R.; Kopácek, J.; Marchetto, A.; Matzner, E.; et al. Response of sulphur dynamics in European catchments to decreasing sulphate deposition. Hydrol. Earth Syst. Sci. 2001, 5, 311–325. [Google Scholar] [CrossRef]
- WHO. Guidelines for Drinking Water Quality, 3rd ed.; World Health Organization: Geneva, Switzerland, 2004; 515p. [Google Scholar]
- Skjelkvĺle, B.L.; Evans, C.; Larssen, T.; Hindar, A.; Raddum, G. Recovery from acidification in European surface waters: A view to the future. AMBIO A J. Hum. Environ. 2003, 32, 170–175. [Google Scholar] [CrossRef] [PubMed]
- Horecký, J.; Rucki, J.; Krám, P.; Křeček, J.; Bitušík, J.; Stuchlík, E. Benthic macroinvertebrates of headwater streams with extreme hydrochemistry. Biologia 2013, 68, 1–11. [Google Scholar] [CrossRef]
- Veselý, J.; Majer, V. The effect of pH and atmospheric deposition on concentrations of trace elements in acidified freshwaters: A statistical approach. Water Air Soil Pollut. 1996, 88, 227–246. [Google Scholar] [CrossRef]
- Nilsson, J. Critical loads for sulphur and nitrogen. In Air Pollution and Ecosystems; Mathy, P., Ed.; Springer: Dordrecht, The Netherlands, 1988; pp. 85–91. [Google Scholar]
- Schwarz, O. Maps of Critical Atmodpheric Loads of Sulphur and Nitrogen in Forest Ecosystems of the Giant Mountains National Park and the Jizera Mountains; Lesnická práce: Kostelec nad Černými lesy, Czech Republic, 2009; published on CD-ROM. (In Czech) [Google Scholar]
Figure 1.
The Jizerka experimental catchment.

Figure 2.
Trends in mean annual temperature Ta and annual precipitation Pa (1982–2021).

Figure 3.
Trends in mean seasonal temperature Ts for winter (dormant months XI–IV) and summer (V–X) months.
Figure 3.
Trends in mean seasonal temperature Ts for winter (dormant months XI–IV) and summer (V–X) months.

Figure 4.
Trends in seasonal precipitation Ps for winter (XI–IV) and summer (V–X) periods.

Figure 5.
First snowpack date (number of days NSB since the beginning of November).

Figure 6.
Last snowpack date (number of days NSL since the beginning of January).

Figure 7.
Date of maximum snow water equivalent (number of days NMSW since the beginning of January).
Figure 7.
Date of maximum snow water equivalent (number of days NMSW since the beginning of January).

Figure 8.
Canopy changes in the experimental catchment (CD is the horizontal canopy density).

Figure 9.
Annual loads of nitrogen and sulphur in the open field (moving averages of order 3).

Figure 10.
Annual fog drip Pfd (mm) related to the forest area Af (%) in the Jizerka catchment, 1982–2021 (moving averages of order 3).
Figure 10.
Annual fog drip Pfd (mm) related to the forest area Af (%) in the Jizerka catchment, 1982–2021 (moving averages of order 3).

Figure 11.
Total annual load of nitrogen and sulphur in the Jizerka basin (moving averages of order 3).
Figure 11.
Total annual load of nitrogen and sulphur in the Jizerka basin (moving averages of order 3).

Figure 12.
Mean monthly runoff Rm (mm), 1982–2021.

Figure 13.
(a) Monthly runoff Rm (mm), 1982–2002. (b) Monthly runoff Rm (mm), 2003–2021.

Figure 14.
Annual maxima of snow water equivalent SWEmax (mm), 1982–2021.

Figure 15.
Medians (with 95% confidence) of snowmelt runoff RIII-V (March–May) for years spans: 1982–1985, 1986–1991, 1992–2001, 2002–2011, and 2012–2021.
Figure 15.
Medians (with 95% confidence) of snowmelt runoff RIII-V (March–May) for years spans: 1982–1985, 1986–1991, 1992–2001, 2002–2011, and 2012–2021.

Figure 16.
Annual runoff maxima Qmax (m3 s−1) for snowmelt and summer rainstorms, 1982–2021.

Figure 17.
Annual minimum flow Qmin (L s−1) plotted against annual maxima of snow water equivalent SWEmax (mm), 1982–2021.
Figure 17.
Annual minimum flow Qmin (L s−1) plotted against annual maxima of snow water equivalent SWEmax (mm), 1982–2021.

Figure 18.
(a) Monthly runoff H+ (mg m−2), 1982–2001. (b) Monthly runoff H+ (mg m−2), 2002–2021.

Figure 19.
Seasonal stream water pH (March–May), annual open field load of sulphur (S-load, mg m−2), and areal percentage of forest stands (with canopy density CD > 0.3) in 40 years of observation (1982–2021).
Figure 19.
Seasonal stream water pH (March–May), annual open field load of sulphur (S-load, mg m−2), and areal percentage of forest stands (with canopy density CD > 0.3) in 40 years of observation (1982–2021).

Figure 20.
(a) Mean monthly pH (-) of stream water at the Jizerka outlet, 1982–2002. (b) Mean monthly pH (-) of stream water at the Jizerka outlet, 2003–2021.
Figure 20.
(a) Mean monthly pH (-) of stream water at the Jizerka outlet, 1982–2002. (b) Mean monthly pH (-) of stream water at the Jizerka outlet, 2003–2021.

Figure 21.
Medians of stream water pH at the Jizerka outlet during snowmelt (March–May) time periods: 1982–1985 (mature spruce forests), 1986–1991 (clear-cut), and 1992–2001, 2002–2011, and 2012–2021 (reforestation).
Figure 21.
Medians of stream water pH at the Jizerka outlet during snowmelt (March–May) time periods: 1982–1985 (mature spruce forests), 1986–1991 (clear-cut), and 1992–2001, 2002–2011, and 2012–2021 (reforestation).


Table 1.
Morphological characteristics of the Jizerka catchment.
| Parameter | Unit | Value |
|---|---|---|
| Area | (km2) | 1.03 |
| Elevation | (m) | 927 (862–994) |
| Slope | (%) | 7.52 (0.02–24.33) |
| Shape index | (-) | 0.69 |
| Length of streams | (m) | 1490 |
| Drainage density | (km/km2) | 1.45 |
| Length of the mainstream | (m) | 657 |
| Slope of the mainstream | (%) | 5.98 |
| Strahler stream order | (-) | 2 |
Table 2.
Coefficients b and b0 (Equation (3)) of the deposited fog water and acidic ions in the summer and winter periods.
Table 2.
Coefficients b and b0 (Equation (3)) of the deposited fog water and acidic ions in the summer and winter periods.
| Substances | b | b0 | Months |
|---|---|---|---|
| Water | 9.045 | −6.186 × 10³ | V–X |
| SO4− S− | 0.077 | −56.107 | V–X |
| NO3− N | 0.027 | −19.886 | V–X |
| NH4− N | 0.075 | −55.567 | V–X |
| Water | 10.268 | −6.762 × 10³ | XI–IV |
| SO4− S− | 0.113 | −81.772 | XI–IV |
| NO3− N | 0.036 | −26.290 | XI–IV |
| NH4− N | 0.094 | −68.664 | XI–IV |
Table 3.
Annual maxima of streamflow Qmax, 1982–2021.
| Year | Qmax (m3 s−1) | Month (-) | Frequency (-) |
|---|---|---|---|
| 1982 | 0.47 | V | 1 |
| 1983 | 0.38 | VI | <1 |
| 1984 | 0.37 | III | <1 |
| 1985 | 0.41 | IV | <1 |
| 1986 | 0.51 | IV | 1–2 |
| 1987 | 0.72 | VIII | 4 |
| 1988 | 0.47 | VII | 1 |
| 1989 | 0.26 | VII | <1 |
| 1990 | 0.67 | III | 3 |
| 1991 | 0.62 | IV | 2 |
| 1992 | 0.75 | VI | 4 |
| 1993 | 0.74 | IV | 4 |
| 1994 | 1.12 | IV | 7 |
| 1995 | 0.91 | VIII | 4 |
| 1996 | 0.87 | IV | 3–4 |
| 1997 | 0.58 | VII | 1–2 |
| 1998 | 075 | IX | 3 |
| 1999 | 0.41 | VII | <1 |
| 2000 | 0.53 | IV | 1–2 |
| 2001 | 0.76 | VII | 3 |
| 2002 | 1.14 | VIII | 6 |
| 2003 | 0.24 | III | <1 |
| 2004 | 0.50 | II | 1–2 |
| 2005 | 0.62 | III | 2 |
| 2006 | 1.72 | VIII | 25 |
| 2007 | 0.25 | II | <1 |
| 2008 | 0.48 | III | 1 |
| 2009 | 0.75 | VII | 3 |
| 2010 | 2.03 | VIII | 50 |
| 2011 | 1.66 | VII | 20 |
| 2012 | 0.58 | IV | <2 |
| 2013 | 1.46 | IX | 15 |
| 2014 | 1.18 | III | 8 |
| 2015 | 1.08 | III | 7 |
| 2016 | 1.38 | VII | 15 |
| 2017 | 0.49 | IV | 1 |
| 2018 | 0.33 | IV | <1 |
| 2019 | 0.96 | VI | 5 |
| 2020 | 0.91 | VI | 4 |
| 2021 | 1.07 | VII | 7 |
Table 4.
The correlation matrix of snowpack duration SP-D (days), maximum snow water equivalent SWEmax (mm), snowmelt runoff Rsm (mm), snowmelt peak flow Qmax (m3s−1), and mean pH (-) of stream water in March–May; Rcrit = 0.30 (n = 40, p = 0.05).
Table 4.
The correlation matrix of snowpack duration SP-D (days), maximum snow water equivalent SWEmax (mm), snowmelt runoff Rsm (mm), snowmelt peak flow Qmax (m3s−1), and mean pH (-) of stream water in March–May; Rcrit = 0.30 (n = 40, p = 0.05).
| SP-D | SWEmax | Rsm | Qmax | pH | |
|---|---|---|---|---|---|
| SP-D | 1 | 0.55 | 0.46 | 0.57 | −0.19 |
| SWEmax | 0.55 | 1 | 0.40 | 0.56 | −0.26 |
| Rsm | 0.46 | 0.40 | 1 | 0.31 | 0.17 |
| Qmax | 0.57 | 0.56 | 0.31 | 1 | −0.21 |
| pH | −0.19 | −0.26 | 0.17 | −0.21 | 1 |
Disclaimer/Publisher’s Note: The statements, opinions and data contained in all publications are solely those of the individual author(s) and contributor(s) and not of MDPI and/or the editor(s). MDPI and/or the editor(s) disclaim responsibility for any injury to people or property resulting from any ideas, methods, instructions or products referred to in the content. |
© 2023 by the authors. Licensee MDPI, Basel, Switzerland. This article is an open access article distributed under the terms and conditions of the Creative Commons Attribution (CC BY) license (https://creativecommons.org/licenses/by/4.0/).
Share and Cite
MDPI and ACS Style
Křeček, J.; Šedivá, L.; Palán, L.; Stuchlík, E. Environmental Role of Snowmelt in Headwaters Affected by Atmospheric Acid Deposition. Water 2023, 15, 2458. https://doi.org/10.3390/w15132458
AMA Style
Křeček J, Šedivá L, Palán L, Stuchlík E. Environmental Role of Snowmelt in Headwaters Affected by Atmospheric Acid Deposition. Water. 2023; 15(13):2458. https://doi.org/10.3390/w15132458
Chicago/Turabian StyleKřeček, Josef, Lada Šedivá, Ladislav Palán, and Evžen Stuchlík. 2023. "Environmental Role of Snowmelt in Headwaters Affected by Atmospheric Acid Deposition" Water 15, no. 13: 2458. https://doi.org/10.3390/w15132458
Note that from the first issue of 2016, this journal uses article numbers instead of page numbers. See further details here.