New Insights towards High-Temperature Ethanol-Sensing Mechanism of ZnO-Based Chemiresistors

 ,
,  , , , , and
Abstract
:1. Introduction
2. Materials and Methods
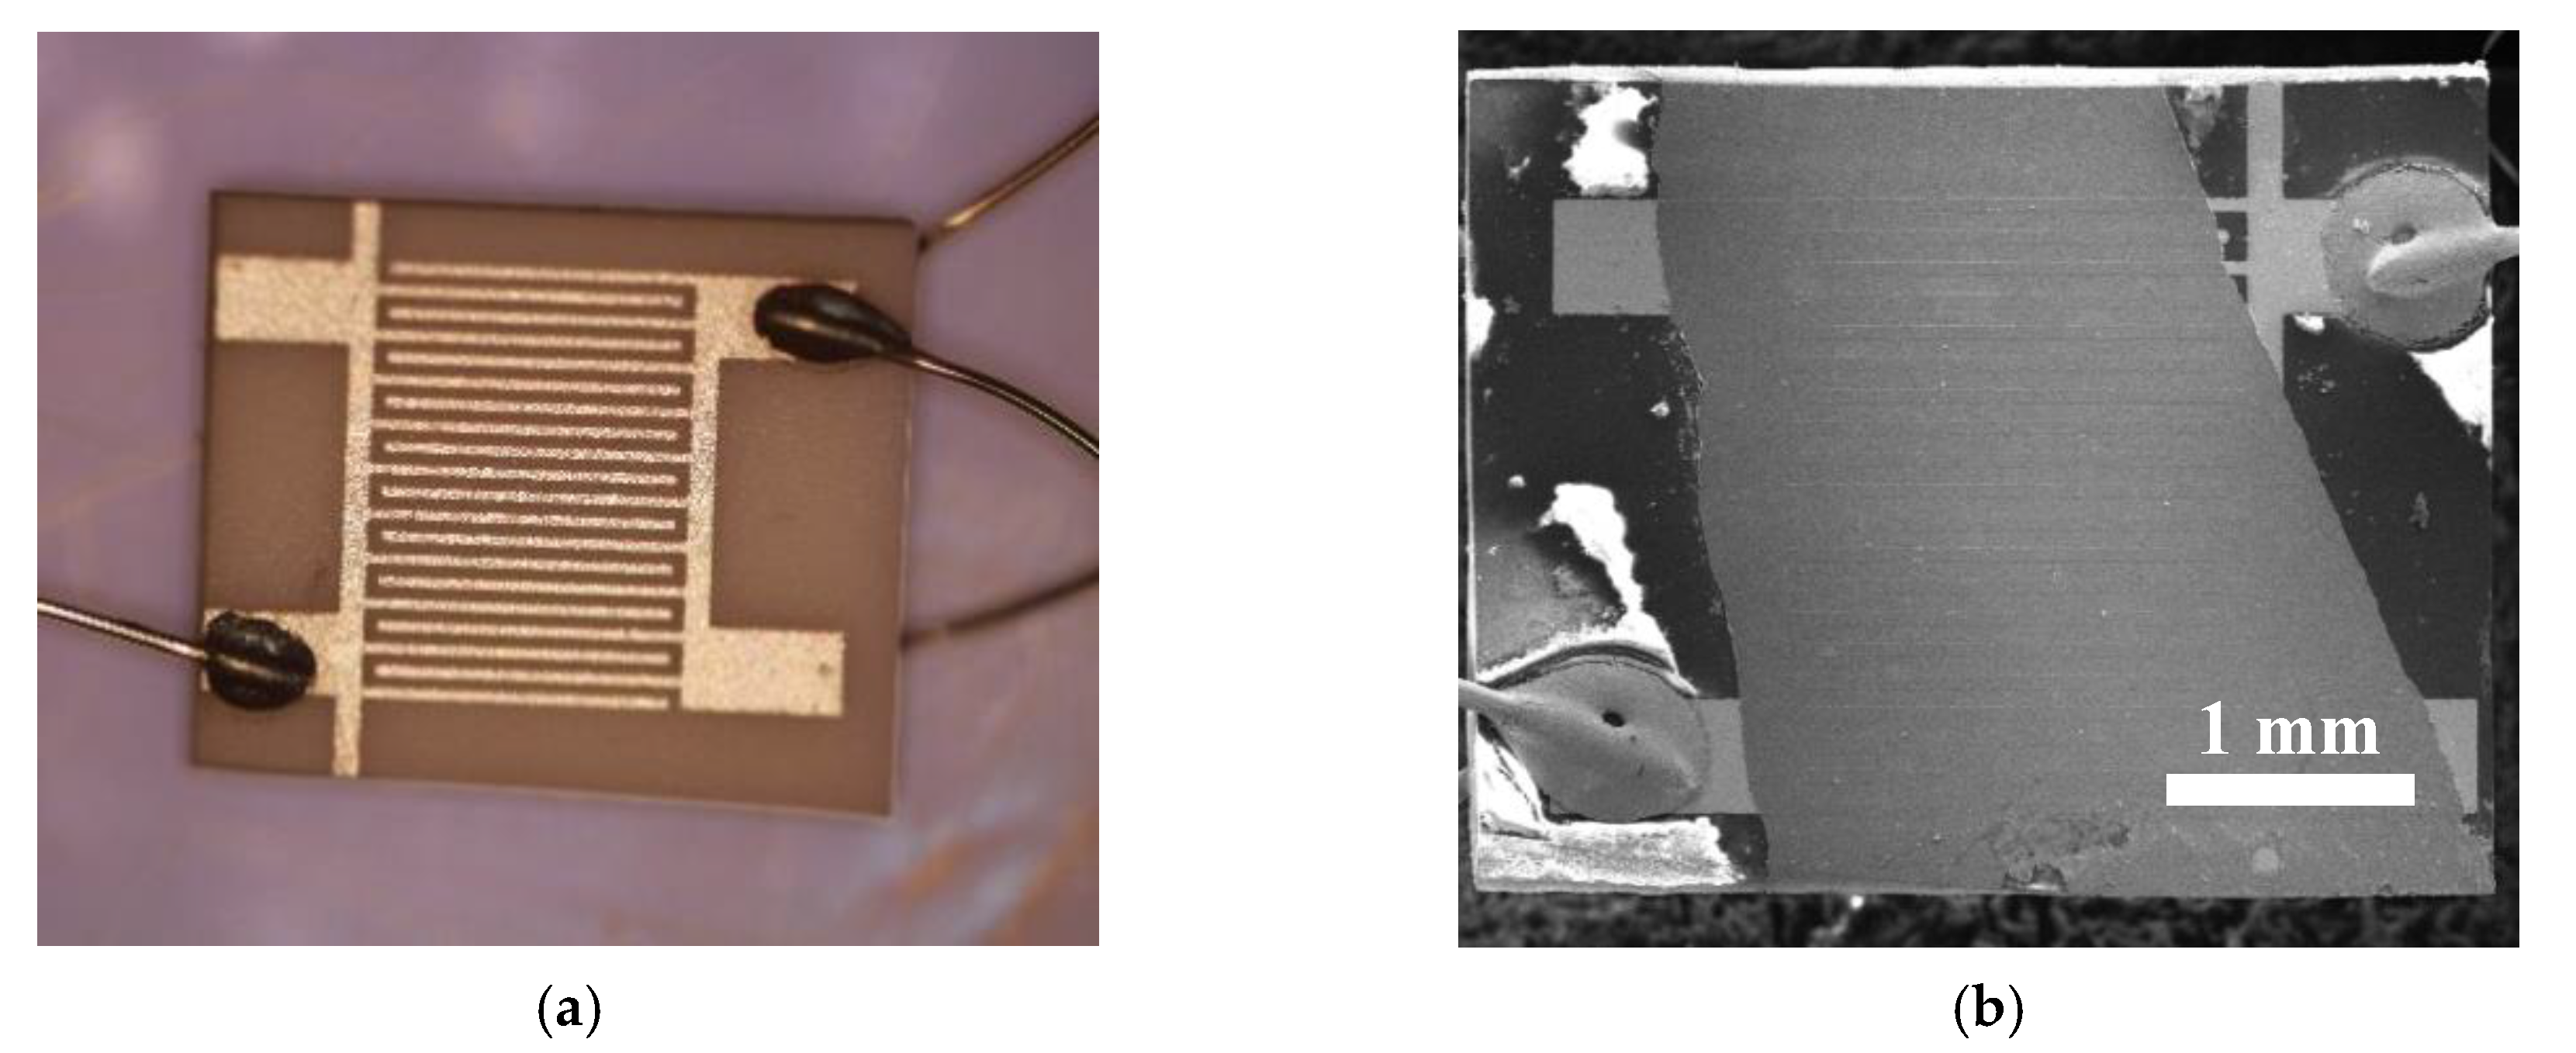
2.1. Synthesis of ZnO NRs and Fabrication of Sensors
2.2. Morphological and Structural Characterizations
2.3. In Situ NAP-XPS Characterizations
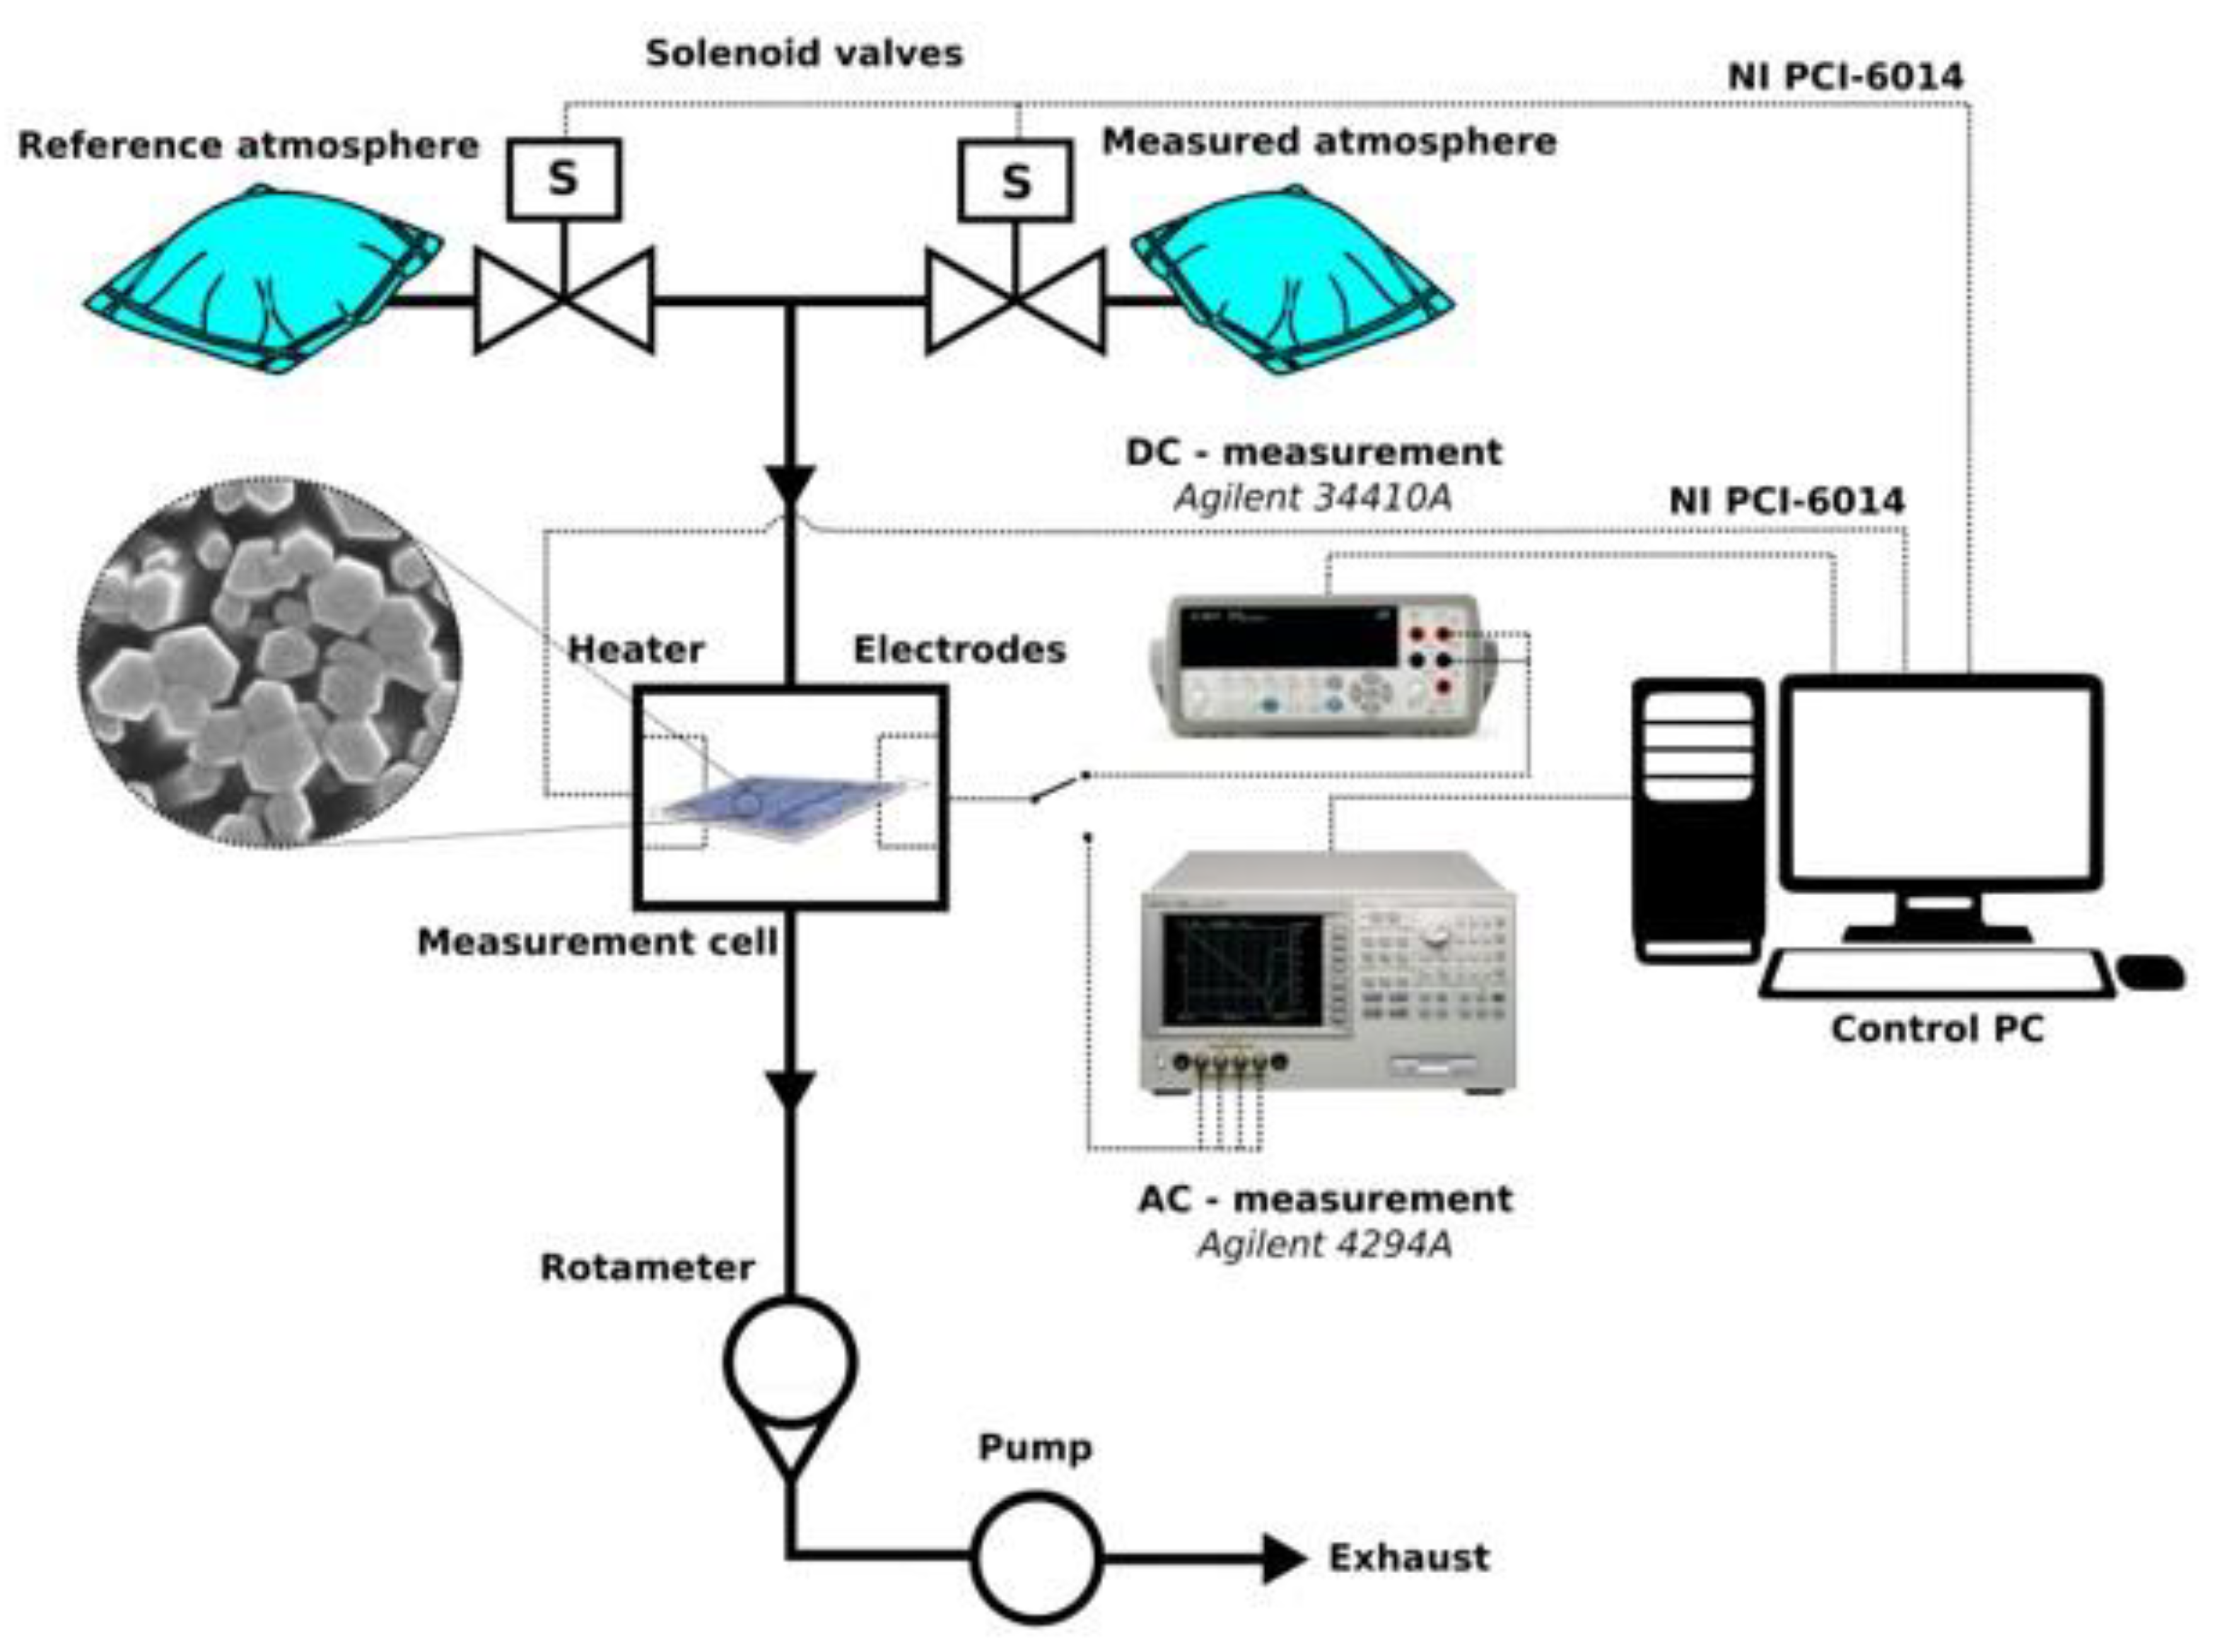
2.4. Instrumentation and Evaluation of Sensor Measurement in Dc- and Ac- Mode
3. Results and Discussion
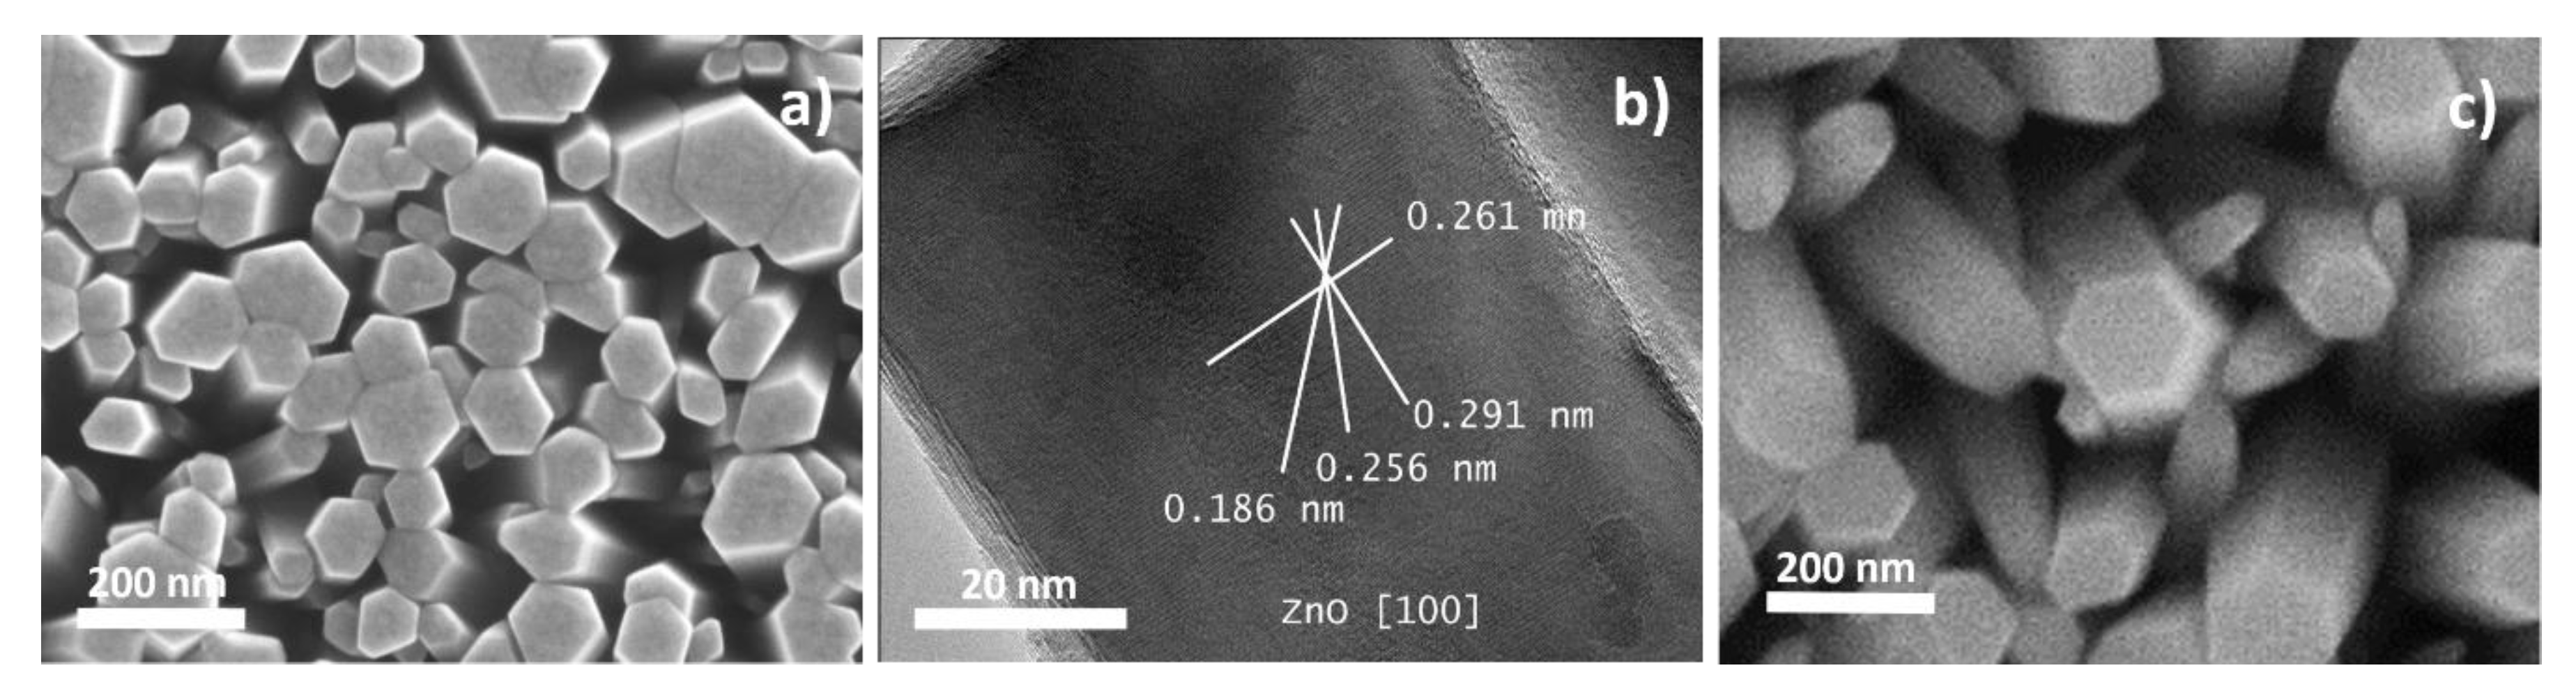
3.1. Structural and Morphological Analysis
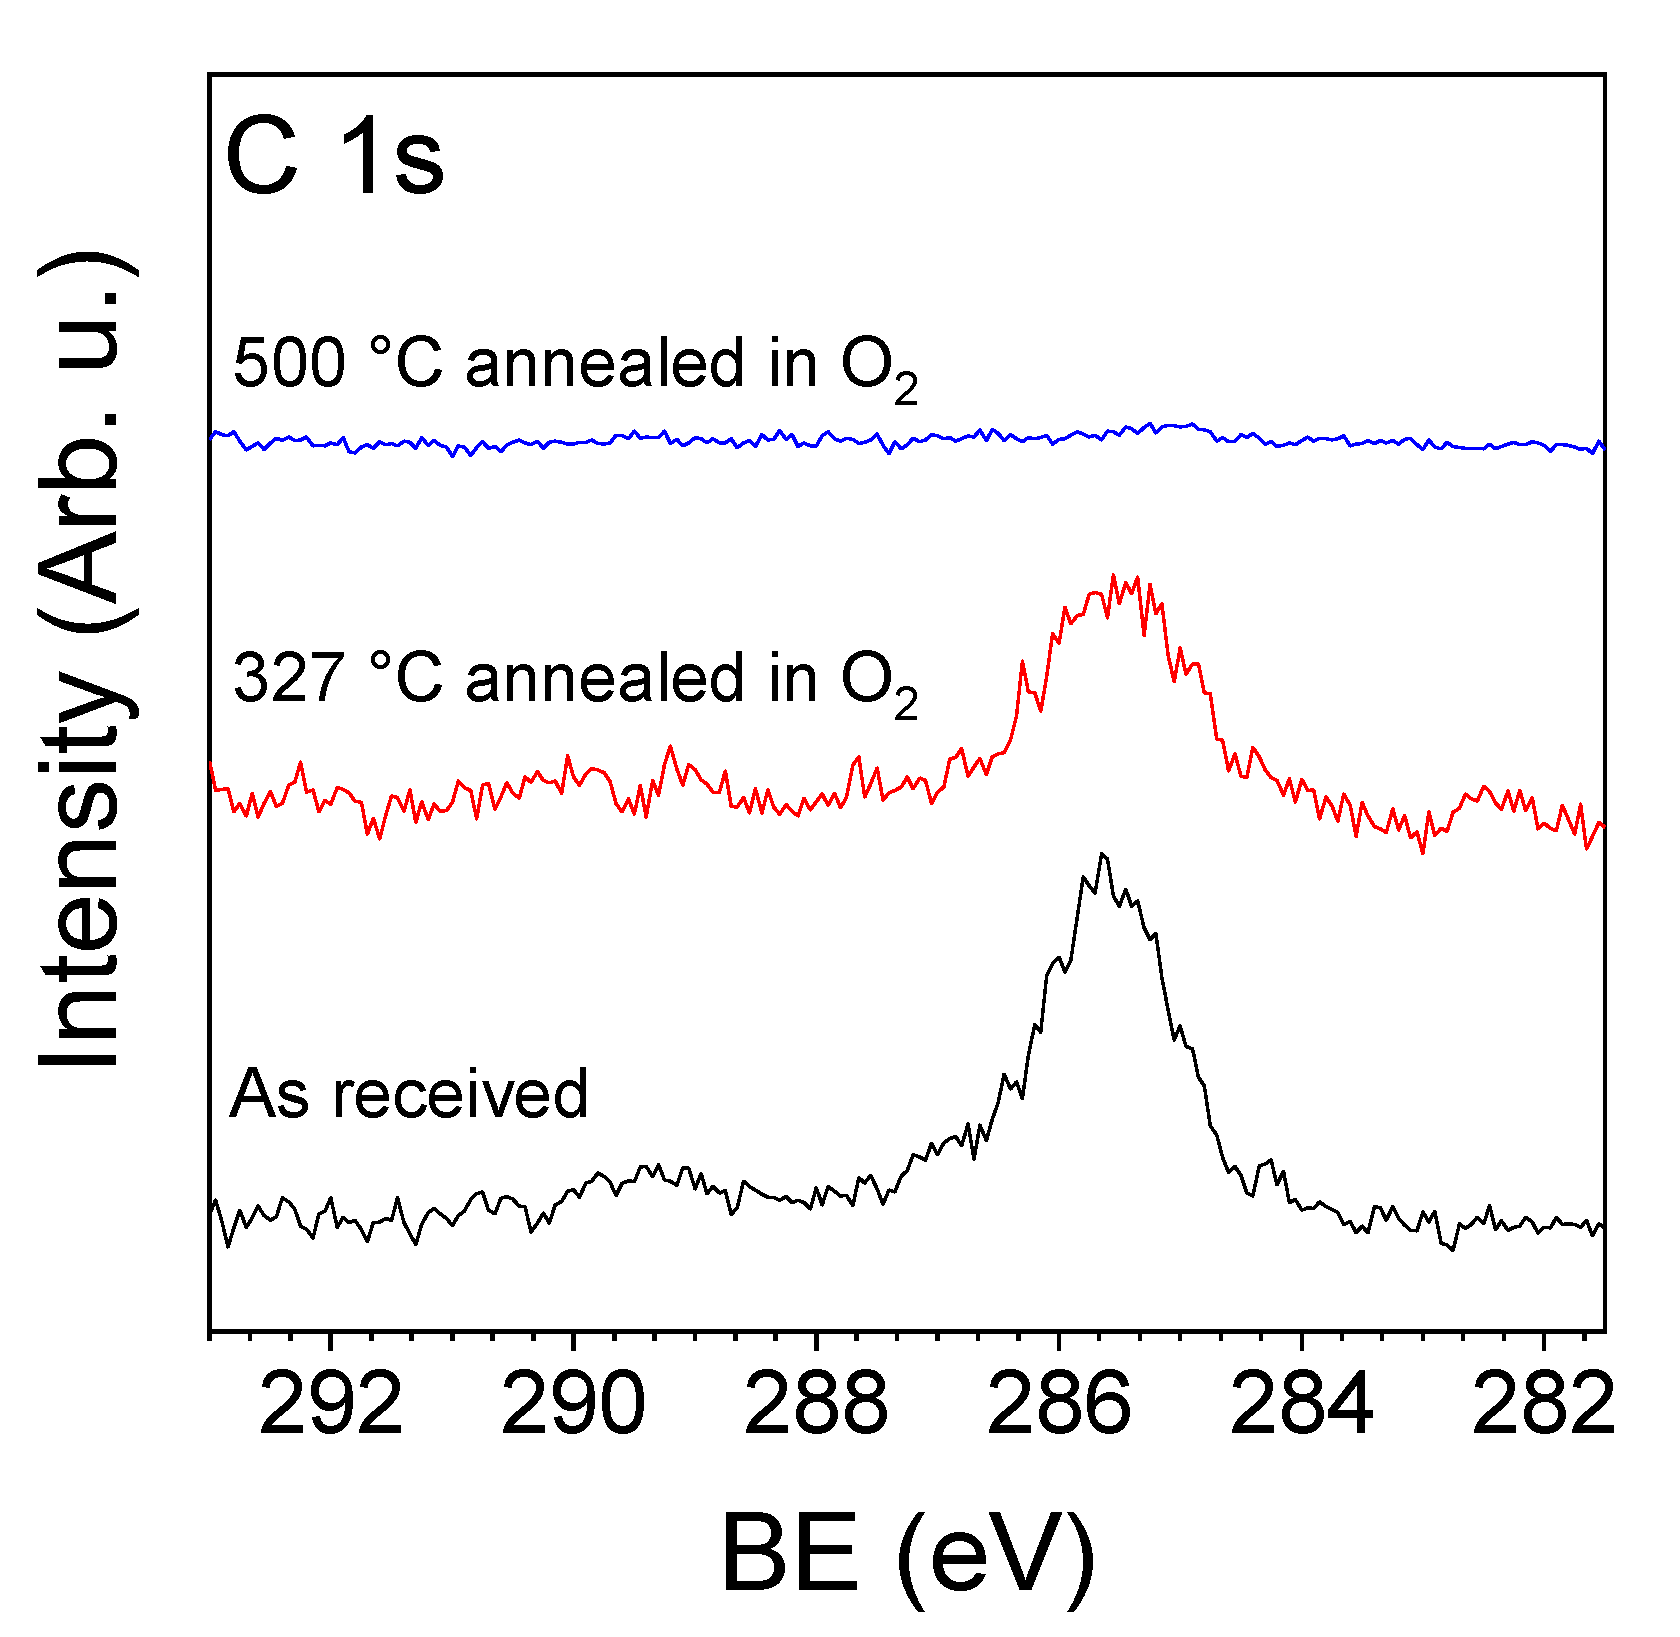
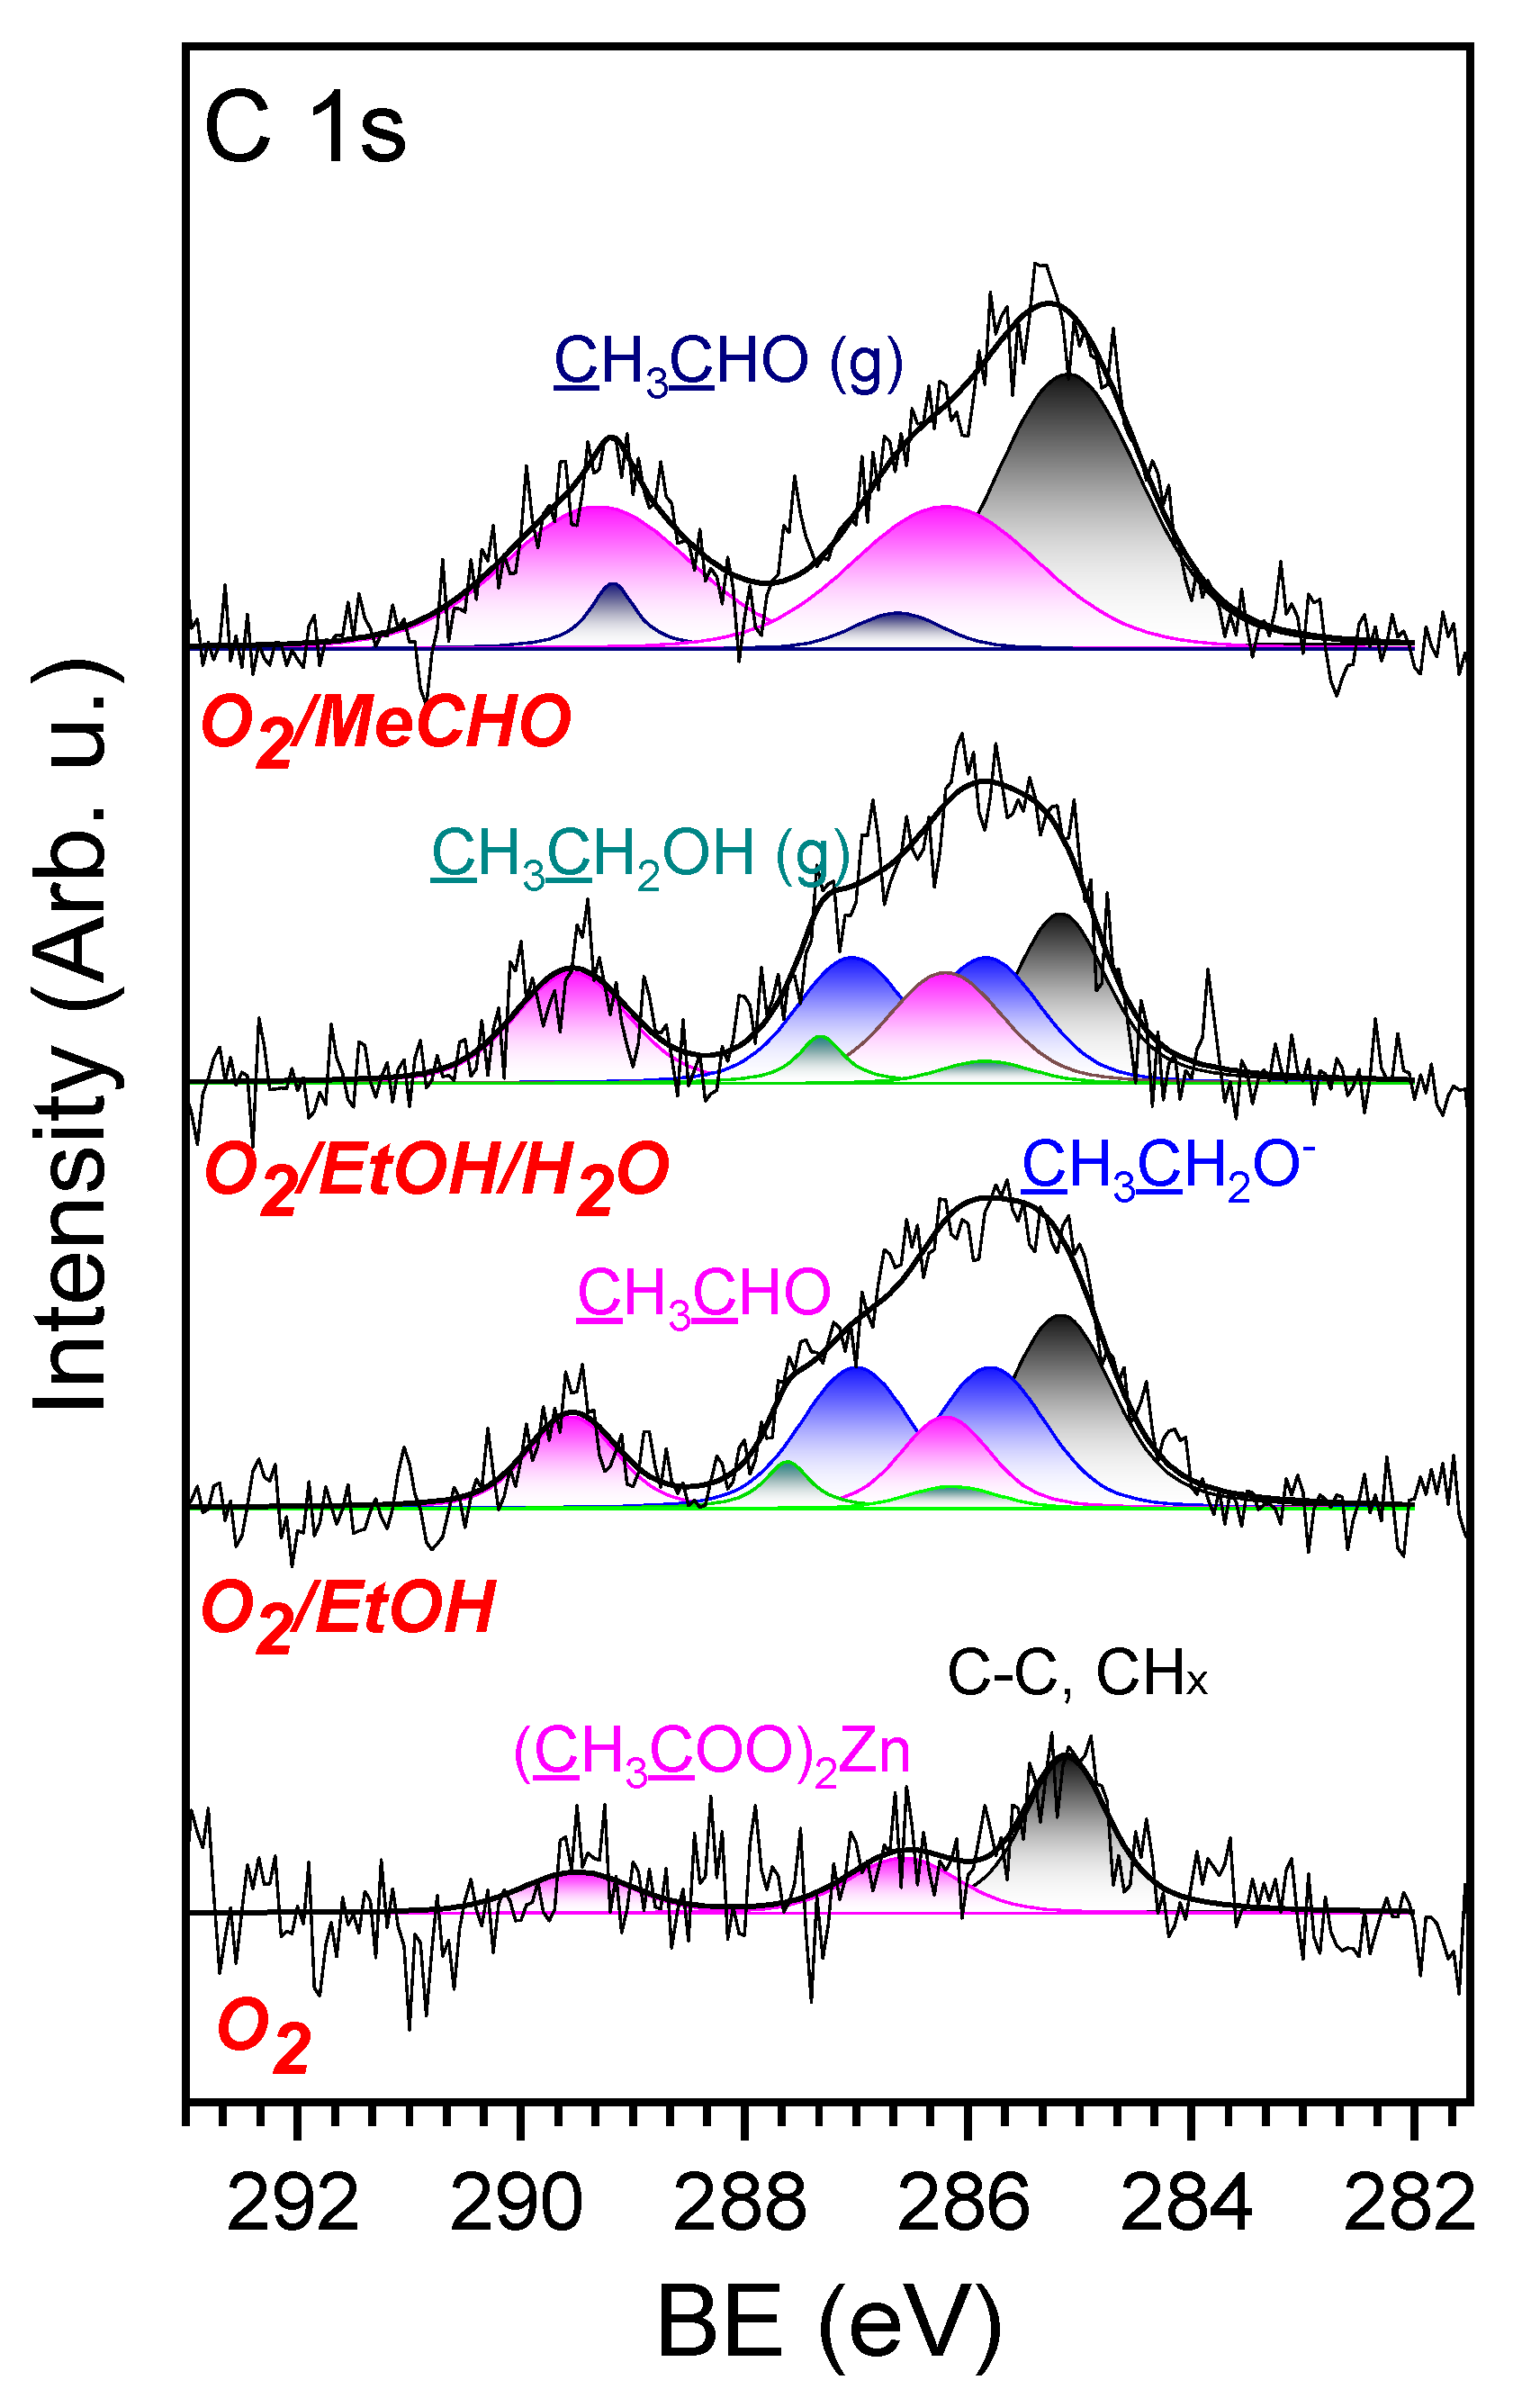
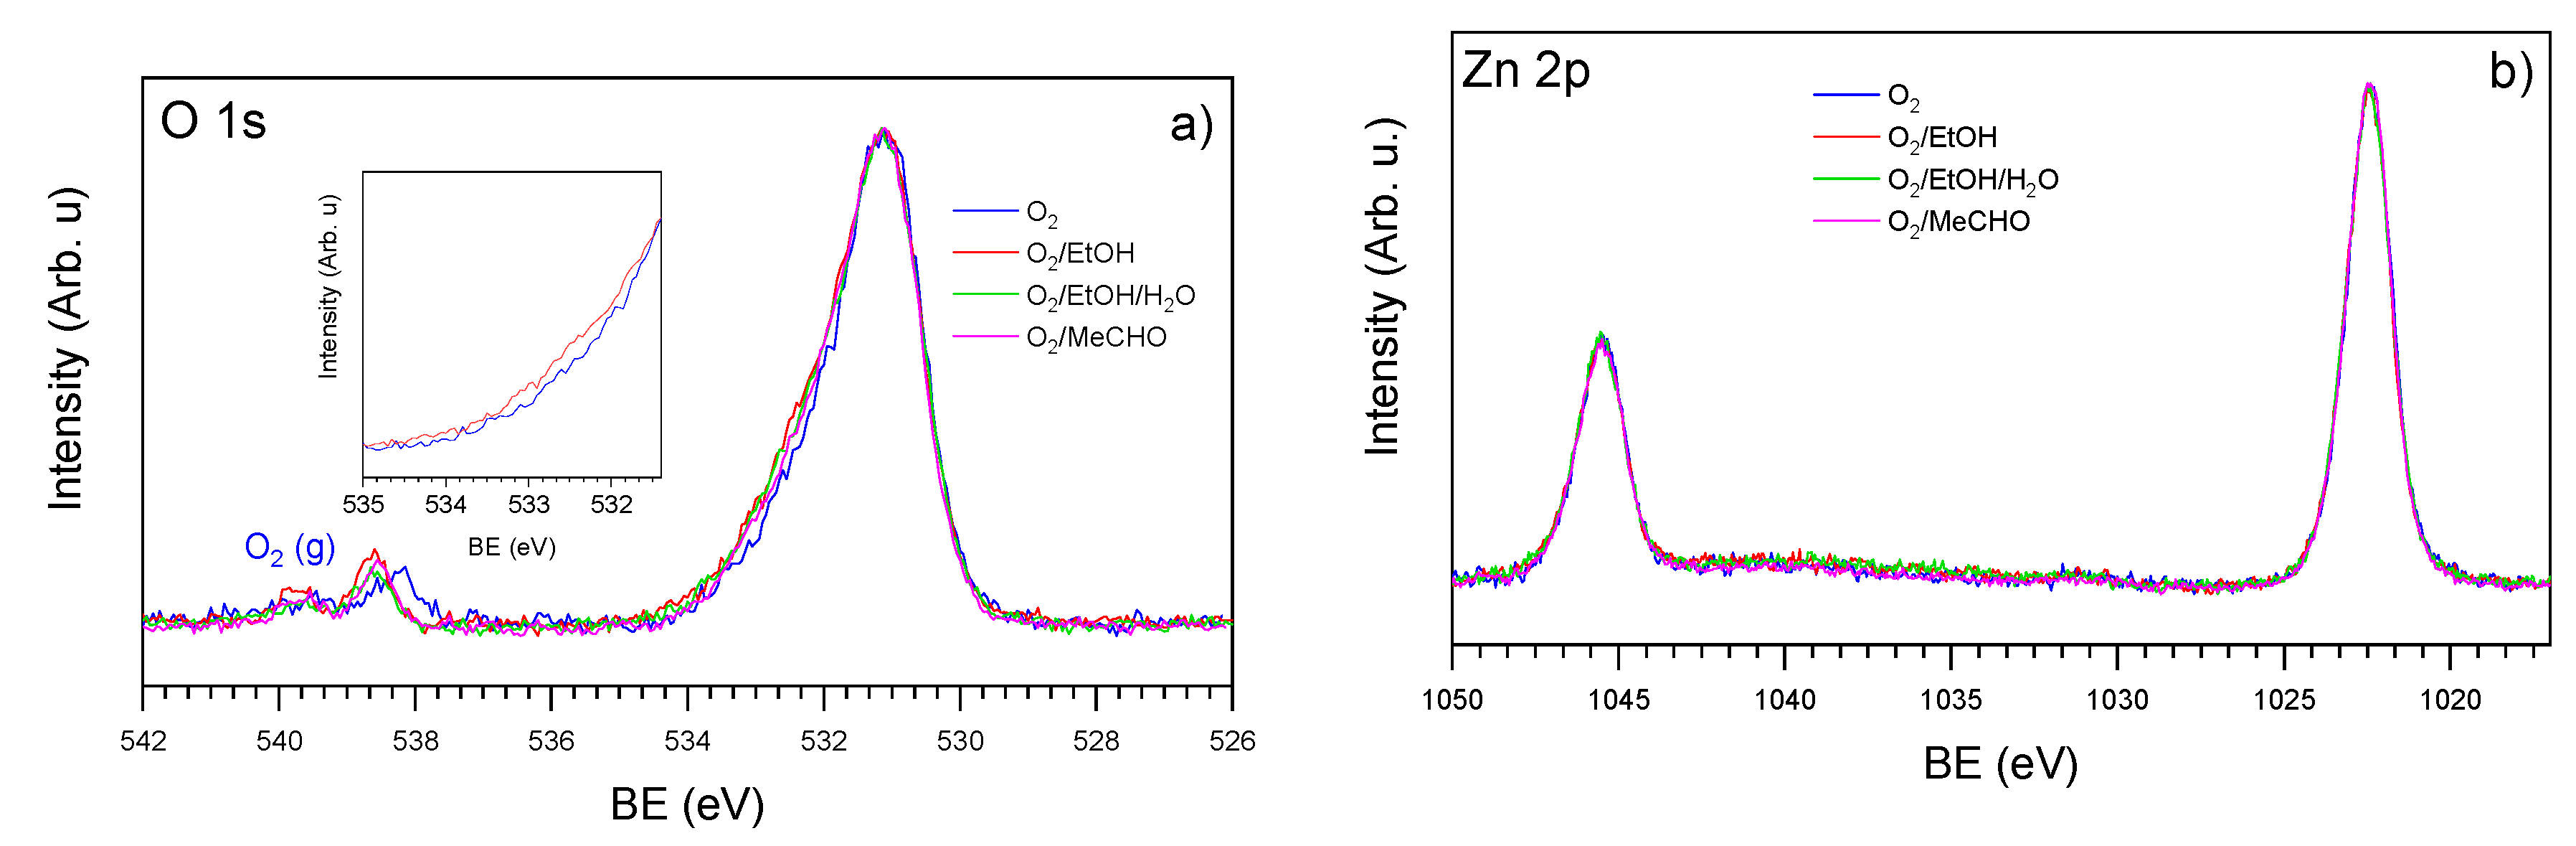
3.2. NAP-XPS Analysis
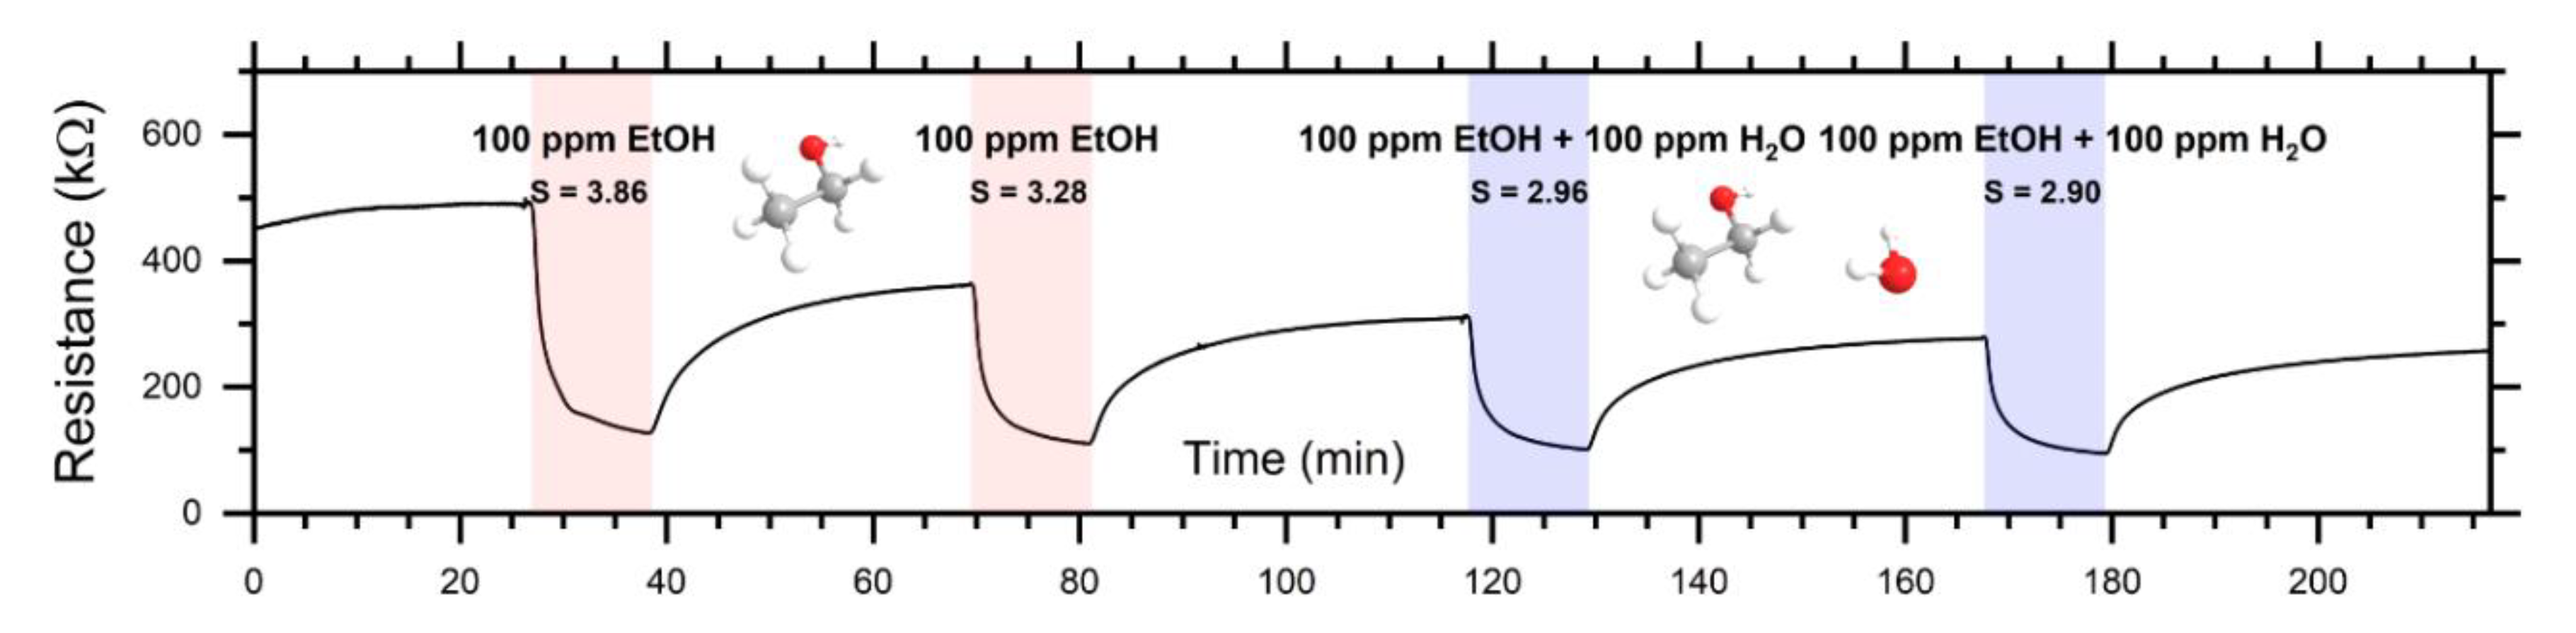
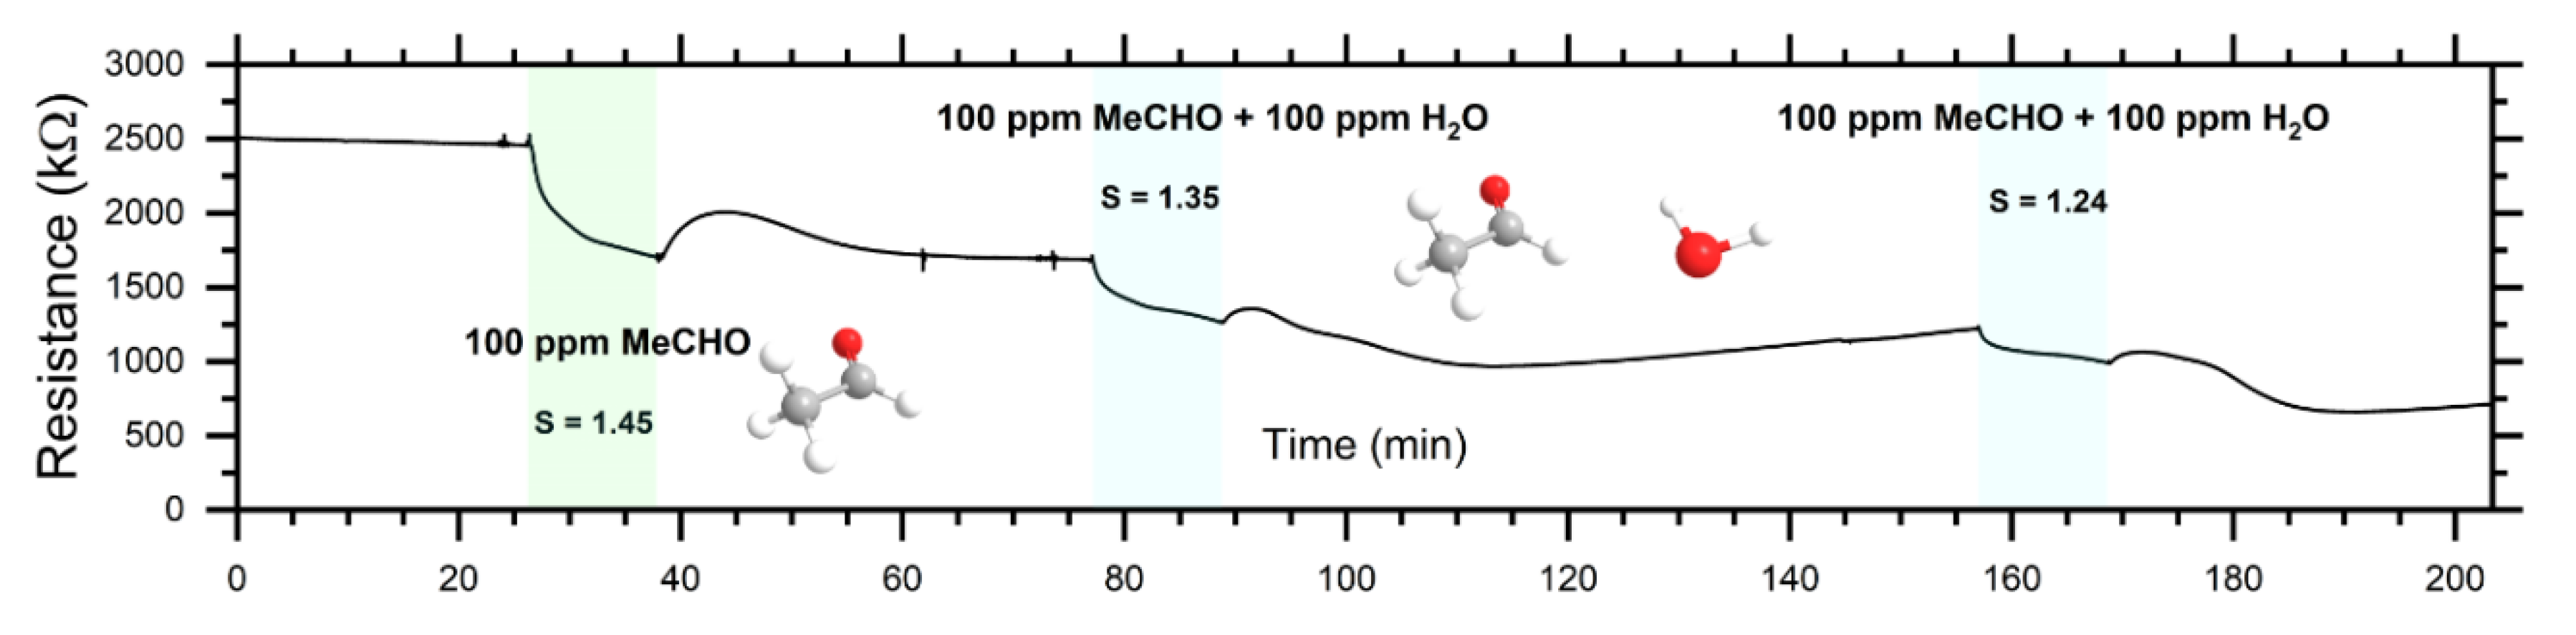
3.3. Response of Sensor in Dc- and Ac-Modes
4. Conclusions
Supplementary Materials
Author Contributions
Funding
Acknowledgments
Conflicts of Interest
References
- Norton, D.P.; Heo, Y.W.; Ivill, M.P.; Ip, K.; Pearton, S.J.; Chisholm, M.F.; Steiner, T. ZnO: Growth, doping and processing. Mater. Today 2008, 7, 34–40. [Google Scholar] [CrossRef]
- Kuld, S.; Thorhauge, M.; Falsig, H.; Elkjær, C.F.; Helveg, S.; Chorkendorff, I.; Sehested, J. Quantifying the promotion of Cu catalysts by ZnO for methanol synthesis. Science 2016, 352, 969–974. [Google Scholar] [CrossRef] [PubMed] [Green Version]
- Leschkies, K.S.; Divakar, R.; Basu, J.; Enache-Pommer, E.; Boercker, J.E.; Carter, C.B.; Kortshagen, U.R.; Norris, D.J.; Aydil, E.S. Photosensitization of ZnO nanowires with CdSe quantum dots for photovoltaic devices. Nano Lett. 2007, 7, 1793–1798. [Google Scholar] [CrossRef]
- Vittal, R.; Ho, K.C. Zinc oxide based dye-sensitized solar cells: A review. Renew. Sustain. Energy Rev. 2017, 70, 920–935. [Google Scholar] [CrossRef]
- Guo, J.; Zhang, J.; Zhu, M.; Ju, D.; Xu, H.; Cao, B. High-performance gas sensor based on ZnO nanowires functionalized by Au nanoparticles. Sens. Actuators B Chem. 2014, 199, 339–345. [Google Scholar] [CrossRef]
- Kumar, R.; Al-Dossary, O.; Kumar, G.; Umar, A. Zinc oxide nanostructures for NO2 gas–sensor applications: A review. NanoMicro Lett. 2015, 7, 97–120. [Google Scholar] [CrossRef] [Green Version]
- Maziarz, W.; Rydosz, A.; Pisarkiewicz, T.; Domański, K.; Grabiec, P. Gas-sensitive properties of Zno nanorods/nanowires obtained by electrodeposition and electrospinning methods. Procedia Eng. 2012, 47, 841–844. [Google Scholar] [CrossRef] [Green Version]
- Batzill, M.; Diebold, U. The surface and materials science of tin oxide. Prog. Surf. Sci. 2005, 79, 47–154. [Google Scholar] [CrossRef]
- Seiyama, T.; Kato, A.; Fujiishi, K.; Nagatani, M. A New Detector for Gaseous Components Using Semiconductive Thin Films. Anal. Chem. 1962, 34, 1502–1503. [Google Scholar] [CrossRef]
- Suzuki, T.T.; Ohgaki, T.; Adachi, Y.; Sakaguchi, I.; Nakamura, M.; Ohashi, H.; Aimi, A.; Fujimoto, K. Ethanol Gas Sensing by a Zn-Terminated ZnO(0001) Bulk Single- Crystalline Substrate. ACS Omega 2020. [Google Scholar] [CrossRef] [PubMed]
- Tharsika, T.; Thanihaichelvan, M.; Haseeb, A.S.M.A.; Akbar, S.A. Highly sensitive and selective ethanol sensor based on zno nanorod on SnO2 thin film fabricated by spray pyrolysis. Front. Mater. 2019, 6, 1–9. [Google Scholar] [CrossRef]
- Kaur, N.; Singh, M.; Comini, E. One-Dimensional Nanostructured Oxide Chemoresistive Sensors. Langmuir 2020, 36, 6326–6344. [Google Scholar] [CrossRef] [PubMed]
- Yamazoe, N. New approaches for improving semiconductor gas sensors. Sens. Actuators B Chem. 1991, 5, 7–19. [Google Scholar] [CrossRef]
- Gurlo, A. Interplay between O2 and SnO2: Oxygen ionosorption and spectroscopic evidence for adsorbed oxygen. ChemPhysChem 2006, 7, 2041–2052. [Google Scholar] [CrossRef] [PubMed]
- Abokifa, A.A.; Haddad, K.; Fortner, J.; Lo, C.S.; Biswas, P. Sensing mechanism of ethanol and acetone at room temperature by SnO2 nano-columns synthesized by aerosol routes: Theoretical calculations compared to experimental results. J. Mater. Chem. A 2018, 6, 2053–2066. [Google Scholar] [CrossRef]
- Shankar, P.; Rayappan, J.B.B. Room temperature ethanol sensing properties of ZnO nanorods prepared using an electrospinning technique. J. Mater. Chem. C 2017, 5, 10869–10880. [Google Scholar] [CrossRef]
- Chen, Y.; Zhu, C.L.; Xiao, G. Reduced-temperature ethanol sensing characteristics of flower-like ZnO nanorods synthesized by a sonochemical method. Nanotechnology 2006, 17, 4537–4541. [Google Scholar] [CrossRef]
- Bhati, V.S.; Hojamberdiev, M.; Kumar, M. Enhanced sensing performance of ZnO nanostructures-based gas sensors: A review. Energy Rep. 2020, 6, 46–62. [Google Scholar] [CrossRef]
- Leonardi, S.G. Two-dimensional zinc oxide nanostructures for gas sensor applications. Chemosensors 2017, 5, 17. [Google Scholar] [CrossRef] [Green Version]
- Zhu, L.; Zeng, W. Room-temperature gas sensing of ZnO-based gas sensor: A review. Sens. Actuators A Phys. 2017, 267, 242–261. [Google Scholar] [CrossRef]
- Wang, L.; Kang, Y.; Liu, X.; Zhang, S.; Huang, W.; Wang, S. ZnO nanorod gas sensor for ethanol detection. Sens. Actuators B Chem. 2012, 162, 237–243. [Google Scholar] [CrossRef]
- Roy, S.; Banerjee, N.; Sarkar, C.K.; Bhattacharyya, P. Development of an ethanol sensor based on CBD grown ZnO nanorods. Solid State Electron. 2013, 87, 43–50. [Google Scholar] [CrossRef]
- Mani, G.K.; Rayappan, J.B.B. ZnO nanoarchitectures: Ultrahigh sensitive room temperature acetaldehyde sensor. Sens. Actuators B Chem. 2016, 223, 343–351. [Google Scholar] [CrossRef]
- Nowicki, M. A modified impedance-frequency converter for inexpensive inductive and resistive sensor applications. Sensors 2019, 19, 121. [Google Scholar] [CrossRef] [PubMed] [Green Version]
- Bobkov, A.; Varezhnikov, A.; Plugin, I.; Fedorov, F.S.; Trouillet, V.; Geckle, U.; Sommer, M.; Goffman, V.; Moshnikov, V.; Sysoev, V. The multisensor array based on grown-on-chip zinc oxide nanorod network for selective discrimination of alcohol vapors at sub-ppm range. Sensors 2019, 19, 4265. [Google Scholar] [CrossRef] [Green Version]
- Gurlo, A.; Riedel, R. In situ and operando spectroscopy for assessing mechanisms of gas sensing. Angew. Chem. Int. Ed. 2007, 46, 3826–3848. [Google Scholar] [CrossRef] [PubMed]
- Hongsith, N.; Wongrat, E.; Kerdcharoen, T.; Choopun, S. Sensor response formula for sensor based on ZnO nanostructures. Sens. Actuators B Chem. 2010, 144, 67–72. [Google Scholar] [CrossRef]
- Geunjae, K.; Kijung, Y. Adsorption and reaction of ethanol on ZnO nanowires. J. Phys. Chem. C 2008, 112, 3036–3041. [Google Scholar]
- Xu, J.; Han, J.; Zhang, Y.; Sun, Y.; Xie, B. Studies on alcohol sensing mechanism of ZnO based gas sensors. Sens. Actuators B Chem. 2008, 132, 334–339. [Google Scholar] [CrossRef]
- Baikie, I.D.; Grain, A.; Sutherland, J.; Law, J. Near ambient pressure photoemission spectroscopy of metal and semiconductor surfaces. Phys. Status Solidi 2015, 12, 259–262. [Google Scholar] [CrossRef]
- Prosvirin, I.P.; Bukhtiyarov, A.V.; Bluhm, H.; Bukhtiyarov, V.I. Application of near ambient pressure gas-phase X-ray photoelectron spectroscopy to the investigation of catalytic properties of copper in methanol oxidation. Appl. Surf. Sci. 2016, 363, 303–309. [Google Scholar] [CrossRef]
- Wolfbeisser, A.; Kovács, G.; Kozlov, S.M.; Föttinger, K.; Bernardi, J.; Klötzer, B.; Neyman, K.M.; Rupprechter, G. Surface composition changes of CuNi-ZrO2 during methane decomposition: An operando NAP-XPS and density functional study. Catal. Today 2017, 283, 134–143. [Google Scholar] [CrossRef]
- Vorokhta, M.; Khalakhan, I.; Vondráček, M.; Tomeček, D.; Vorokhta, M.; Marešová, E.; Nováková, J.; Vlček, J.; Fitl, P.; Novotný, M.; et al. Investigation of gas sensing mechanism of SnO2 based chemiresistor using near ambient pressure XPS. Surf. Sci. 2018, 687, 284–290. [Google Scholar] [CrossRef]
- Hozák, P.; Vorokhta, M.; Khalakhan, I.; Jarkovská, K.; Cibulková, J.; Fitl, P.; Vlček, J.; Fara, J.; Tomeček, D.; Novotný, M.; et al. New Insight into the Gas-Sensing Properties of CuOx Nanowires by Near-Ambient Pressure XPS. J. Phys. Chem. C 2019, 123, 29739–29749. [Google Scholar] [CrossRef]
- Yatskiv, R.; Tiagulskyi, S.; Grym, J.; Vaniš, J.; Bašinová, N.; Horak, P.; Torrisi, A.; Ceccio, G.; Vacik, J.; Vrňata, M. Optical and electrical characterization of CuO/ZnO heterojunctions. Thin Solid Films 2020, 693, 137656. [Google Scholar] [CrossRef]
- Tomecek, D.; Hruska, M.; Fitl, P.; Vlcek, J.; Maresova, E.; Havlova, S.; Patrone, L.; Vrnata, M. Phthalocyanine Photoregeneration for Low Power Consumption Chemiresistors. ACS Sens. 2018, 3, 2558–2565. [Google Scholar] [CrossRef]
- Myslík, V.; Vysloužil, F.; Vrňata, M.; Rozehnal, Z.; Jelíinek, M.; Fryček, R.; Kovanda, M. Phase ac-sensitivity of oxidic and acetylacetonic gas sensors. Sens. Actuators B Chem. 2003, 89, 205–211. [Google Scholar] [CrossRef]
- Fitl, P.; Vrnata, M.; Kopecky, D.; Vlcek, J.; Skodova, J.; Bulir, J.; Novotny, M.; Pokorny, P. Laser deposition of sulfonated phthalocyanines for gas sensors. Appl. Surf. Sci. 2014, 302, 37–41. [Google Scholar] [CrossRef]
- Mudiyanselage, K.; Burrell, A.K.; Senanayake, S.D.; Idriss, H. XPS and NEXAFS study of the reactions of acetic acid and acetaldehyde over UO2(100) thin film. Surf. Sci. 2019, 680, 107–112. [Google Scholar] [CrossRef]
- Jacobs, G.; Keogh, R.A.; Davis, B.H. Steam reforming of ethanol over Pt/ceria with co-fed hydrogen. J. Catal. 2007, 245, 326–337. [Google Scholar] [CrossRef]
- Vohs, J.M.; Barteau, M.A. Formation of Stable Alkyl and Carboxylate Intermediates in the Reactions of Aldehydes on the ZnO(0001) Surface. Langmuir 1989, 5, 965–972. [Google Scholar] [CrossRef]
- Singh, M.; Kaur, N.; Drera, G.; Casotto, A.; Ermenegildo, L.S.; Comini, E. SAM Functionalized ZnO Nanowires for Selective Acetone Detection: Optimized Surface Specific Interaction Using APTMS and GLYMO Monolayers. Adv. Funct. Mater. 2020, 2003217, 1–12. [Google Scholar] [CrossRef]
- Zuo, J.; Erbe, A. Optical and electronic properties of native zinc oxide films on polycrystalline Zn. Phys. Chem. Chem. Phys. 2010, 12, 11467–11476. [Google Scholar] [CrossRef] [PubMed]
- Wang, C.; Yin, L.; Zhang, L.; Xiang, D.; Gao, R. Metal oxide gas sensors: Sensitivity and influencing factors. Sensors 2010, 10, 2088–2106. [Google Scholar] [CrossRef] [PubMed] [Green Version]
- Zimmermann, P.; Sobotík, P.; Kocán, P.; Ošt’Ádal, I.; Vorokhta, M.; Acres, R.G.; Matolín, V. Adsorption of ethylene on Sn and in terminated Si(001) surface studied by photoelectron spectroscopy and scanning tunneling microscopy. J. Chem. Phys. 2016, 145, 094701. [Google Scholar] [CrossRef]
- Rai, P.; Yu, Y.T. Citrate-assisted hydrothermal synthesis of single crystalline ZnO nanoparticles for gas sensor application. Sens. Actuators B Chem. 2012, 173, 58–65. [Google Scholar] [CrossRef]
- Saboor, F.H.; Khodadadi, A.A.; Mortazavi, Y.; Asgari, M. Microemulsion synthesized silica/ZnO stable core/shell sensors highly selective to ethanol with minimum sensitivity to humidity. Sens. Actuators B Chem. 2017, 238, 1070–1083. [Google Scholar] [CrossRef]
- Kunat, M.; Girol, S.G.; Burghaus, U.; Wöll, C. The Interaction of Water with the Oxygen-Terminated, Polar Surface of ZnO. J. Phys. Chem. B 2003, 107, 14350–14356. [Google Scholar] [CrossRef]


| Dc-Parameter | Ac-Parameter | ||
|---|---|---|---|
| Analyte | SDC | SAC40Hz | SPA-MAX [deg] at frequency [Hz] |
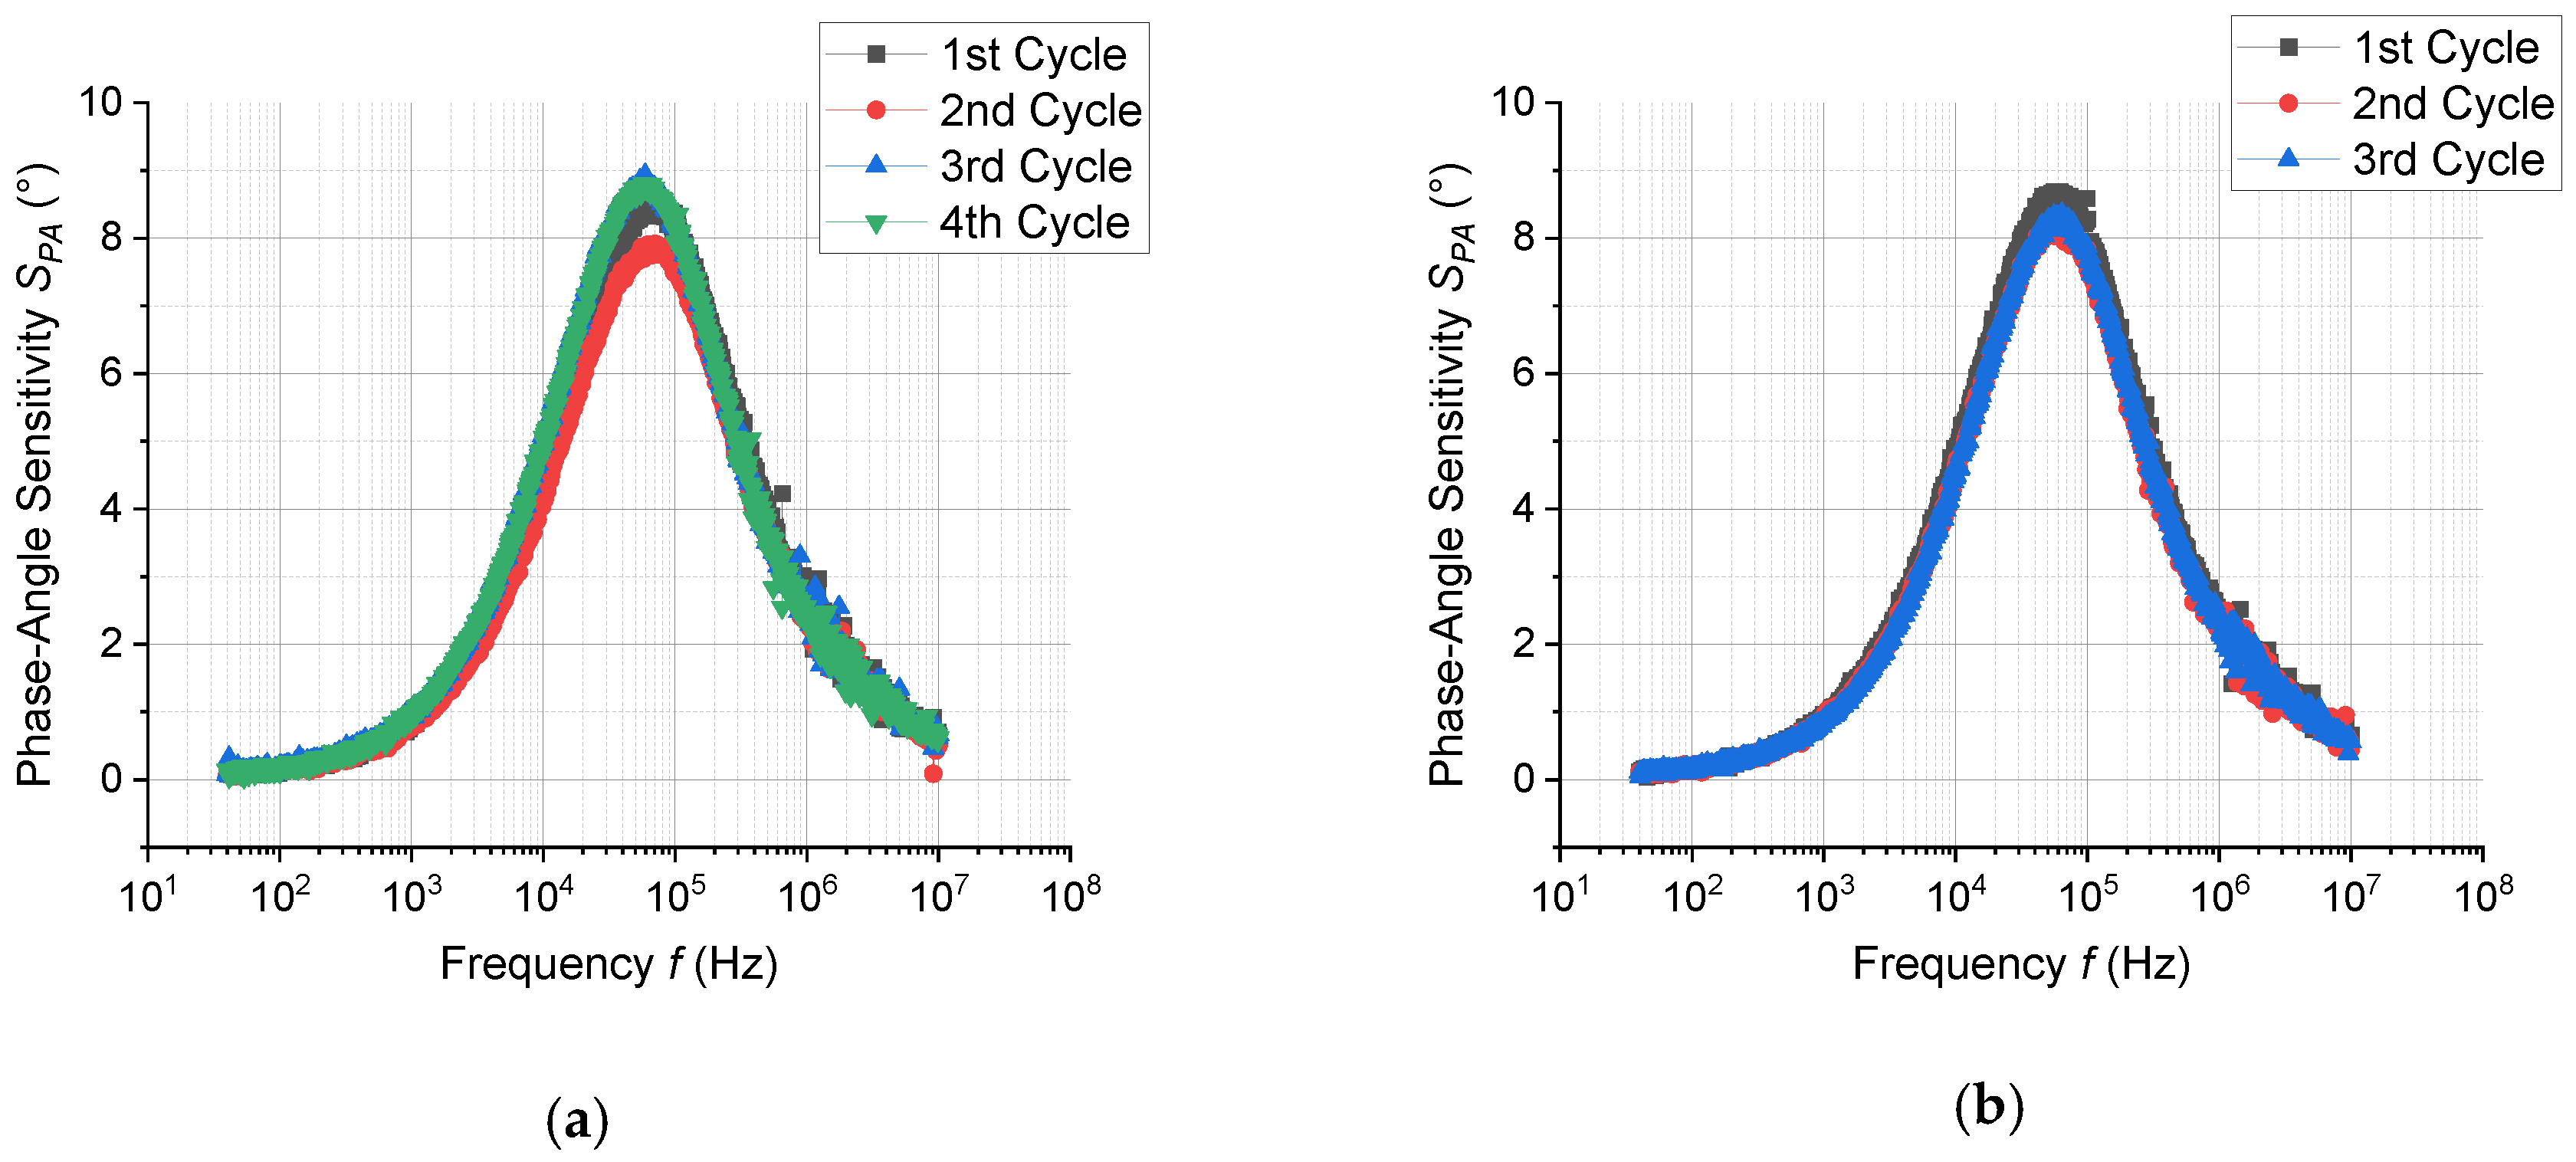
| EtOH (100 ppm) | 3.6 | 1.5 | 8.3 at 6 × 10⁴ Hz |
| EtOH (100 ppm) + H2O (100 ppm) | 2.9 | 1.5 | 8.5 at 6 × 10⁴ Hz |
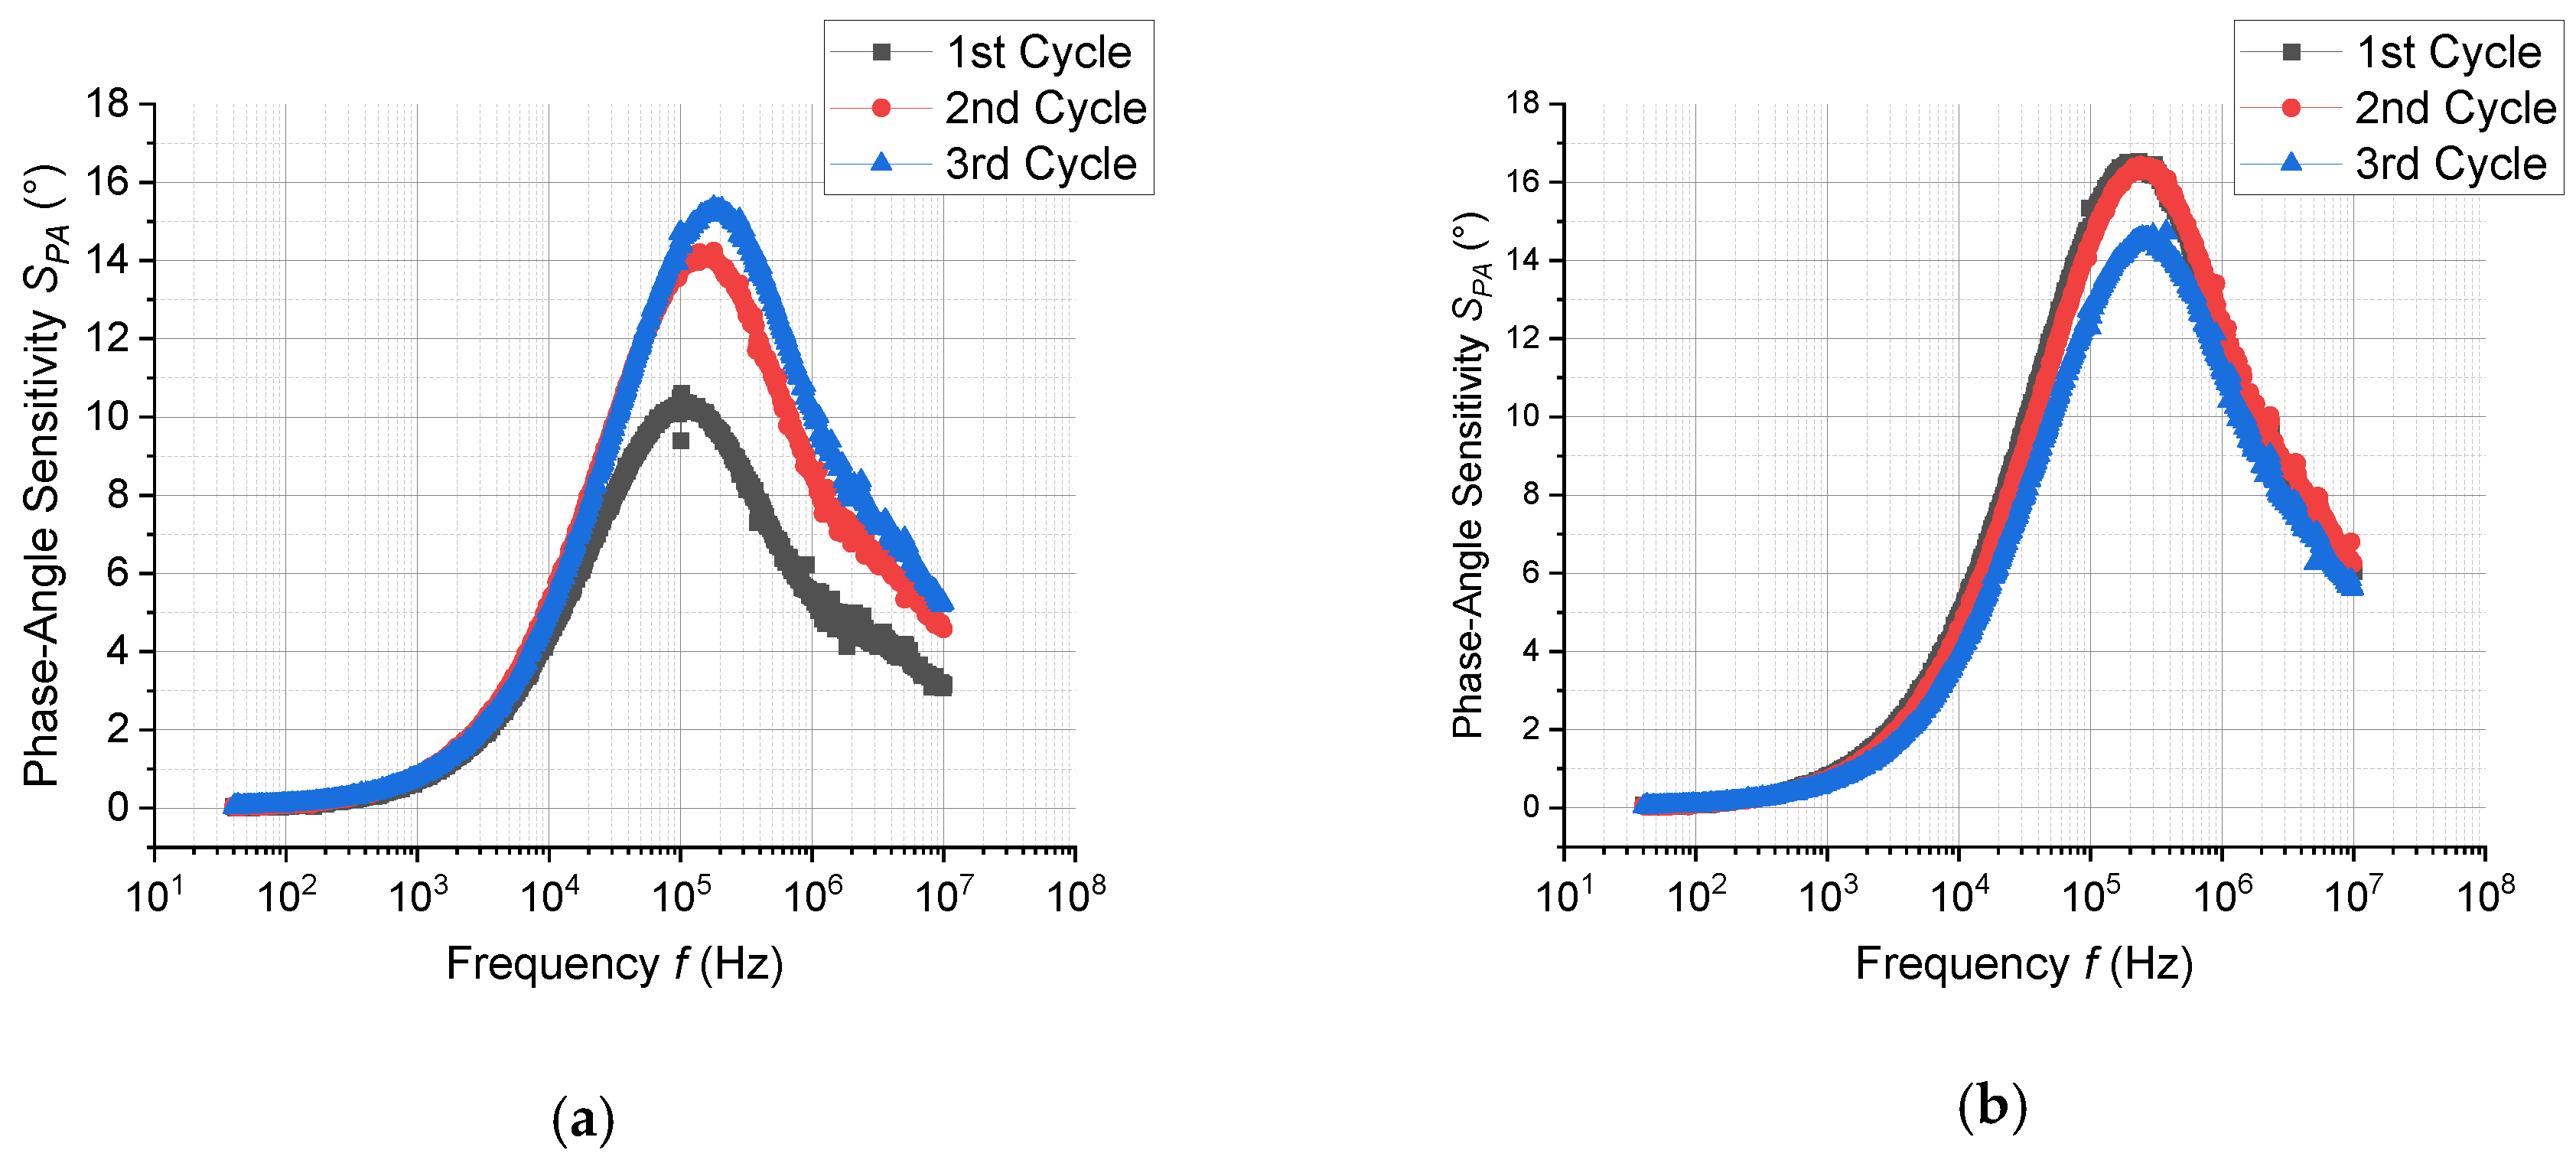
| MeCHO (100 ppm) | 1.5 | 2.2 | 12.5 at 2 × 10⁵ Hz |
| MeCHO (100 ppm) + H2O (100 ppm) | 1.3 | 2.6 | 15.5 at 2 × 10⁵ Hz |
© 2020 by the authors. Licensee MDPI, Basel, Switzerland. This article is an open access article distributed under the terms and conditions of the Creative Commons Attribution (CC BY) license (http://creativecommons.org/licenses/by/4.0/).
Share and Cite
Piliai, L.; Tomeček, D.; Hruška, M.; Khalakhan, I.; Nováková, J.; Fitl, P.; Yatskiv, R.; Grym, J.; Vorokhta, M.; Matolínová, I.; et al. New Insights towards High-Temperature Ethanol-Sensing Mechanism of ZnO-Based Chemiresistors. Sensors 2020, 20, 5602. https://doi.org/10.3390/s20195602
Piliai L, Tomeček D, Hruška M, Khalakhan I, Nováková J, Fitl P, Yatskiv R, Grym J, Vorokhta M, Matolínová I, et al. New Insights towards High-Temperature Ethanol-Sensing Mechanism of ZnO-Based Chemiresistors. Sensors. 2020; 20(19):5602. https://doi.org/10.3390/s20195602
Chicago/Turabian StylePiliai, Lesia, David Tomeček, Martin Hruška, Ivan Khalakhan, Jaroslava Nováková, Přemysl Fitl, Roman Yatskiv, Jan Grym, Mykhailo Vorokhta, Iva Matolínová, and et al. 2020. "New Insights towards High-Temperature Ethanol-Sensing Mechanism of ZnO-Based Chemiresistors" Sensors 20, no. 19: 5602. https://doi.org/10.3390/s20195602