1. Introduction
Collagen has been extensively studied as the dominant component of the extracellular matrix of animal and human bodies. Its chemistry and use were well described by Lasek [
1]. The collagen protein family is characterized by great diversity of structure, occurrence, and function. So far, 29 types of collagen proteins have been classified [
2].
Collagen consists of amino acids bound together to form an α helix, such that left-handed polyproline II-type helices join to form a single right-handed triple helix of elongated fibrils [
3]. This unique fibrous structure predisposes collagen to various applications. Collagen-based materials are widely used in reconstructive medicine, pharmaceuticals, cosmetics, tanning, and the food industry [
4]. The tissue regeneration capabilities of collagen-based biomaterials represent the future of medical soft and hard tissue development [
5] (e.g., in the fields of regeneration in the treatment of periodontal disease [
6], dental implants [
7], and repair of osteochondral defects [
8]). Collagen’s unique structure makes it useful as a protein carrier in drug delivery systems, especially in treating cancer and genetic diseases [
9].
Collagen and its derivatives, such as gelatin and hydrolyzed peptides, are consumable. Thanks to various functional and bioactive properties, they have great potential in the food industry (e.g., as food additives, food packaging and preservation materials, and functional food ingredients) [
10].
Over the past decades, hydrostatic pressure has been used to analyze the structural properties and phase behavior of protein systems [
11]. As a relatively new technology, ultra-high pressure (UHP) has attracted widespread interest in specific biotechnologies, such as food production [
12,
13]. UHP can also be an attractive alternative to traditional food preservation (heat pasteurization or sterilization). Its limited effects on covalent bonds and α-helix or β-sheet structures result in minimal nutritional value and sensory quality changes. UHP is a non-thermal food treatment that subjects liquid or solid foods to pressures between 50 and 1000 MPa [
14]. In addition, high pressure (HP) can enhance several processing operations, such as freezing, thawing, and extraction, thus providing new processing options.
Collagen is an integral part of raw food materials (such as muscle tissue from mammals, fish, and poultry); collagen can also be used as an edible film or coating. Therefore, studies of the effect of UHP on collagen structure and mechanical properties are of great value for using UHP technology in the food industry. UHP technology, in combination with chemical reagents, is widely used for obtaining gelatin from collagen [
15,
16]. The use of high pressure for the homogenization of micro/nano collagen fibers is also possible [
17].
Under high hydrostatic pressure, proteins can show changes in their native structure analogous to changes that occur at high temperatures. This effect relates to reversible and irreversible changes in the protein’s native structure [
18]. However, high pressure can also leave parts of the molecule unchanged, indicating that HP denaturation mechanisms are substantially different from those of high temperature [
19]. Tauscher [
20] reported that the secondary and tertiary/quaternary structures of most proteins are compromised by high pressures of 400 and 200 MPa, respectively.
Collagen can be extracted from natural products that remain after food production (e.g., feathers, animal hair, animal skin, crustacean shells, fish scales, and bones). However, the integrity of the extracted collagen-based materials (i.e., structural stability and resistance to various treatments (chemical, thermal, irradiation)) is influenced by the collagen source (animal genus, sex, age, breeding, etc.), the extraction method, and other treatments [
21].
The few papers published on UHP treatment of collagen have dealt with porcine (pig) [
22] and bullfrog [
23] collagen. One of the most important studies of UHP (up to 200 MPa) on porcine collagen structure (concentration of 1.5 mg/mL) was performed by Potekhin et al. [
22]. Their results showed that the thermal stability of collagen was significantly improved with increasing pressure, which is quite different from the effects on globular proteins, where structural stability is reduced after UHP. However, their study was based on microcalorimetric analyses done during real-time ultra-high-pressure treatment and a theoretical analysis derived from other proteins.
Nan et al. [
23] systematically analyzed the molecular structures and properties of a bullfrog collagen solution (5 mg/mL) using UHP up to 500 MPa. They used SDS-polyacrylamide gel electrophoresis, Fourier-transformed infrared spectroscopy, and circular dichroism measurements to characterize changes in collagen structure. They showed that at pressures less than 400 MPa, the dominant forces were perpendicular to the triple helix, while at pressures above 400 MPa, the dominant forces were along the axis of the helix.
This work aimed to demonstrate experimentally whether the structure and physical properties (viscoelastic, mechanical, and thermal) of bovine collagen are affected by UHP treatment at varying pressures up to 400 MPa and by different holding times (5 and 10 min). Collagenous gel subjected to UHP was based on type I bovine COL isolated from calf skin homogenized in water (7.44 wt.%), which is used to produce sausage casings.
This study aimed to analyze the changes in chemical composition (i.e., the concentration of water and amino acids) and structural parameters (i.e., the effect on the triple-helix and β-sheet, the ratio of mature/immature crosslinks, and fiber orientation). Additionally, we studied changes in the rheological, mechanical, and thermal properties of the collagenous gels after UHP. This study of collagen structures and physical properties after UHP has significant reference value for the use of UHP in the food industry and other applications.
2. Materials and Methods
2.1. Material
The studied collagenous material consisted of natural bovine collagen (type I) supplied by DEVRO, Ltd. (Jilemnice, Czech Republic), a company specializing in producing collagen casings. The original solution contained 7.44 wt.% of collagen. The collagen was extracted from mechanically and chemically pretreated bovine skin. Samples (≈100 g) were taken from a bag weighing approximately 10 kg. The samples were placed in bags made of double-layered polyethylene/polyamide (hereafter PE/PA). They were then vacuum sealed with a weld.
2.2. Apparatus
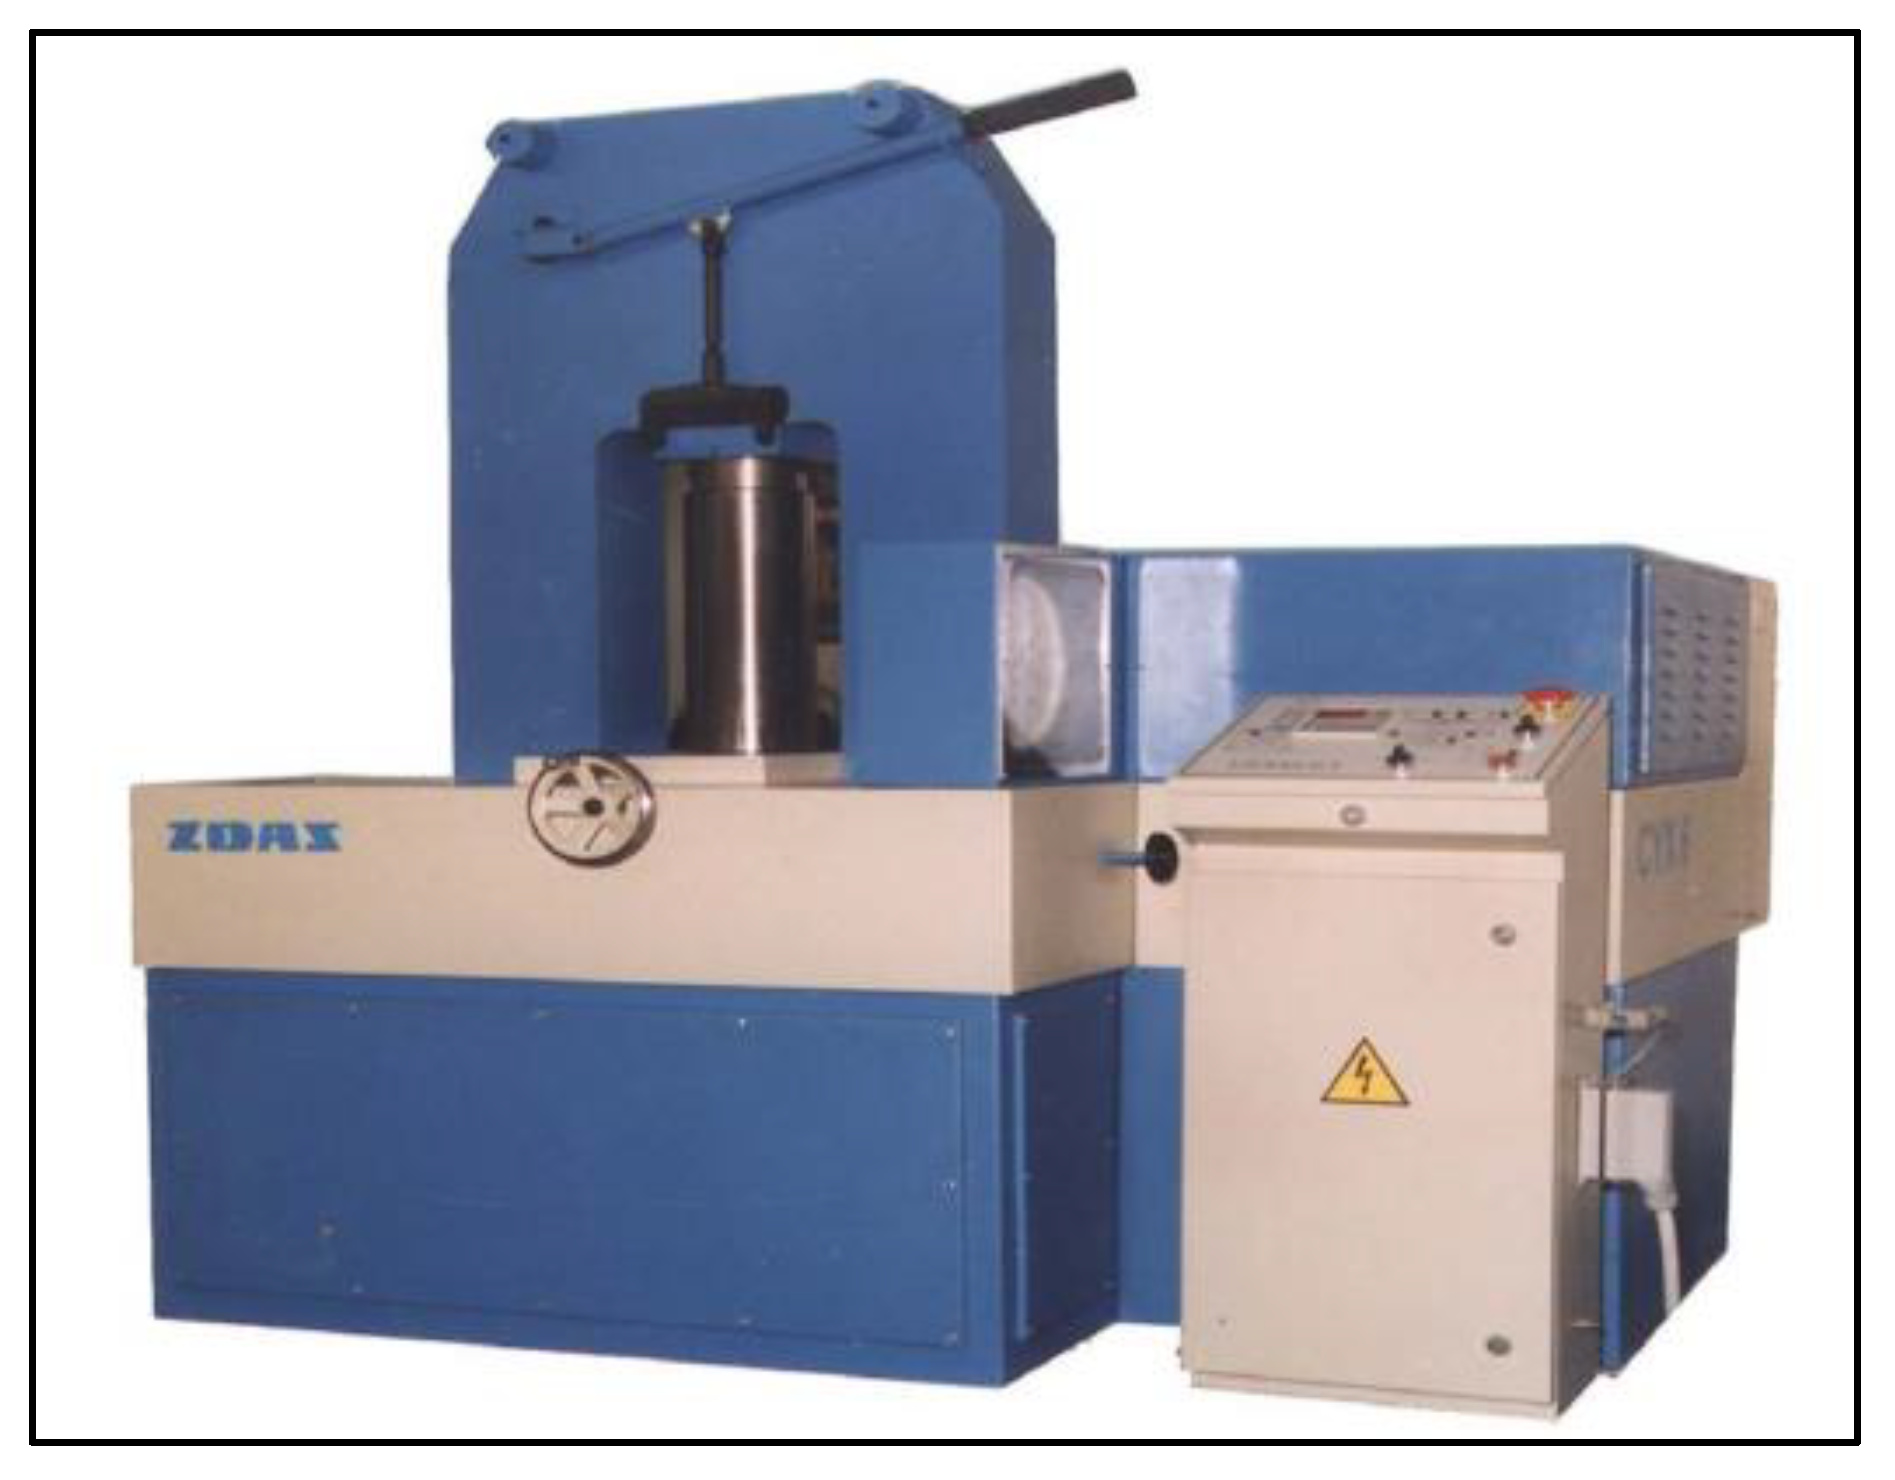
An isostatic press, CYX 6/103, manufactured by Žďas, a joint-stock company (Žďár nad Sázavou, Czech Republic), was used to treat collagen samples sealed in vacuum bags (see
Figure 1). The device is equipped with a high-pressure chamber with a volume of 2 L, where the pressure of the drinking water can reach up to 450 MPa. Pressure can be applied for different holding times (5–15 min); plastic bottles or PE/PA or PE/Al bags serve as packaging. The treatment takes place in the final package, which must be made of suitable plastic packaging (i.e., it must prevent tap water, under high pressure, from penetrating the packaging or the product from escaping the packaging and returning to its original shape after depressurization).
2.3. Pressurizing Samples
The prepared packaged samples were placed individually in the pressurization chamber of the device, which was previously filled with tap water at a temperature of about 17 °C. The chamber was closed, and an automated system was started to achieve the preselected pressures and durations. All samples were successively treated at pressures of 200, 300, and 400 MPa with holding times of 5 and 10 min. During pressurization, the sample is heated, but due to the capacity of the metal chamber, the energy is dissipated during the pressurization period. After depressurization, the sample cools down.
The temperature of the medium (i.e., the pressurizing water in the chamber) was measured before and after each treatment of each sample. After pressure treatment, the temperatures of the sample were also measured. The initial temperature of the pressurized water in the chamber was 20 °C during the first series of treatments. After treatment, the temperatures of the pressurized water in the chamber ranged from 18.5 to 19 °C. The temperatures of the samples after pressure treatment ranged from 17.3 to 17.9 °C.
During the second series of treatments of the same collagen material, the starting temperature of the pressurized water in the chamber was 19.3 °C. After treatment, the temperature of the pressurized water in the chamber ranged from 16.5 to 18.1 °C. The temperature of the samples after pressure treatment was constant (14.5 °C). It follows from the mentioned temperatures that the thermal transformation of collagen into gelatin could not occur during the pressure treatments used in our study.
2.4. Determination of Dry Matter
The dry matter of the collagen samples was determined by their weight in a hot air oven at a temperature of 105 °C after 24 h. Three weighings were always carried out, and the result was averaged.
2.5. Determination of pH
A Testo type 206 pH meter (Testo SE & Co. KGaA, Titisee-Neustadt, Germany) was used to measure pH. This device simultaneously measures the temperature of the material.
2.6. Rheological Measurement
Oscillatory rheological properties were measured using a method similar to that reported by Landfeld et al. [
24]. The measurement was taken on a Haake RS150 Rheostress rheometer (Thermo Fisher Scientific, Life Technologies Czech Republic Ltd., Prague, Czech Republic). Frequency oscillations ranged from 0.1 to 1.778 Hz, with a relative deformation of 0.04. The range was determined in advance based on an amplitude test in the linear viscoelastic region so that the elastic modulus does not change to this value while increasing the amplitude of oscillations at a constant frequency of 1 Hz. A plate-plate geometry was used for the measurements. The diameter of the top plate was 35 mm, and the gap between the plates was 2 mm. The measurement temperature was a constant 10 °C. Each measurement was performed five times; each repetition was with a new sample. The elastic modulus (G′) and loss modulus (G′′) and the phase angle δ were measured for each sample.
2.7. Measurement of Mechanical Properties
A TA/XT2 Texturometer from Stable Micro Systems (Surrey, UK), with a force-measuring probe capable of handling up to 50 N (manufacturer’s specification 5 kg) was used for the measurements. Collagen in the form of a cylinder with a diameter of 15 mm and an initial height of 20 mm was placed between two circular plates and compressed at a speed of 1 mm/second so that the relative deformation did not exceed 0.3. Forces (F) were converted to tension (Ϭ) by dividing by the area of the face of the roller, whose starting radius was R
0. A correction was made for the increasing diameter of the cylinder due to compression, which is valid under the assumption of the conservation of the cylinder volume:
where x = y/H
0, and “y” represents the axial deformation of the cylinder. Nine measurements were acquired for each pressurized sample time.
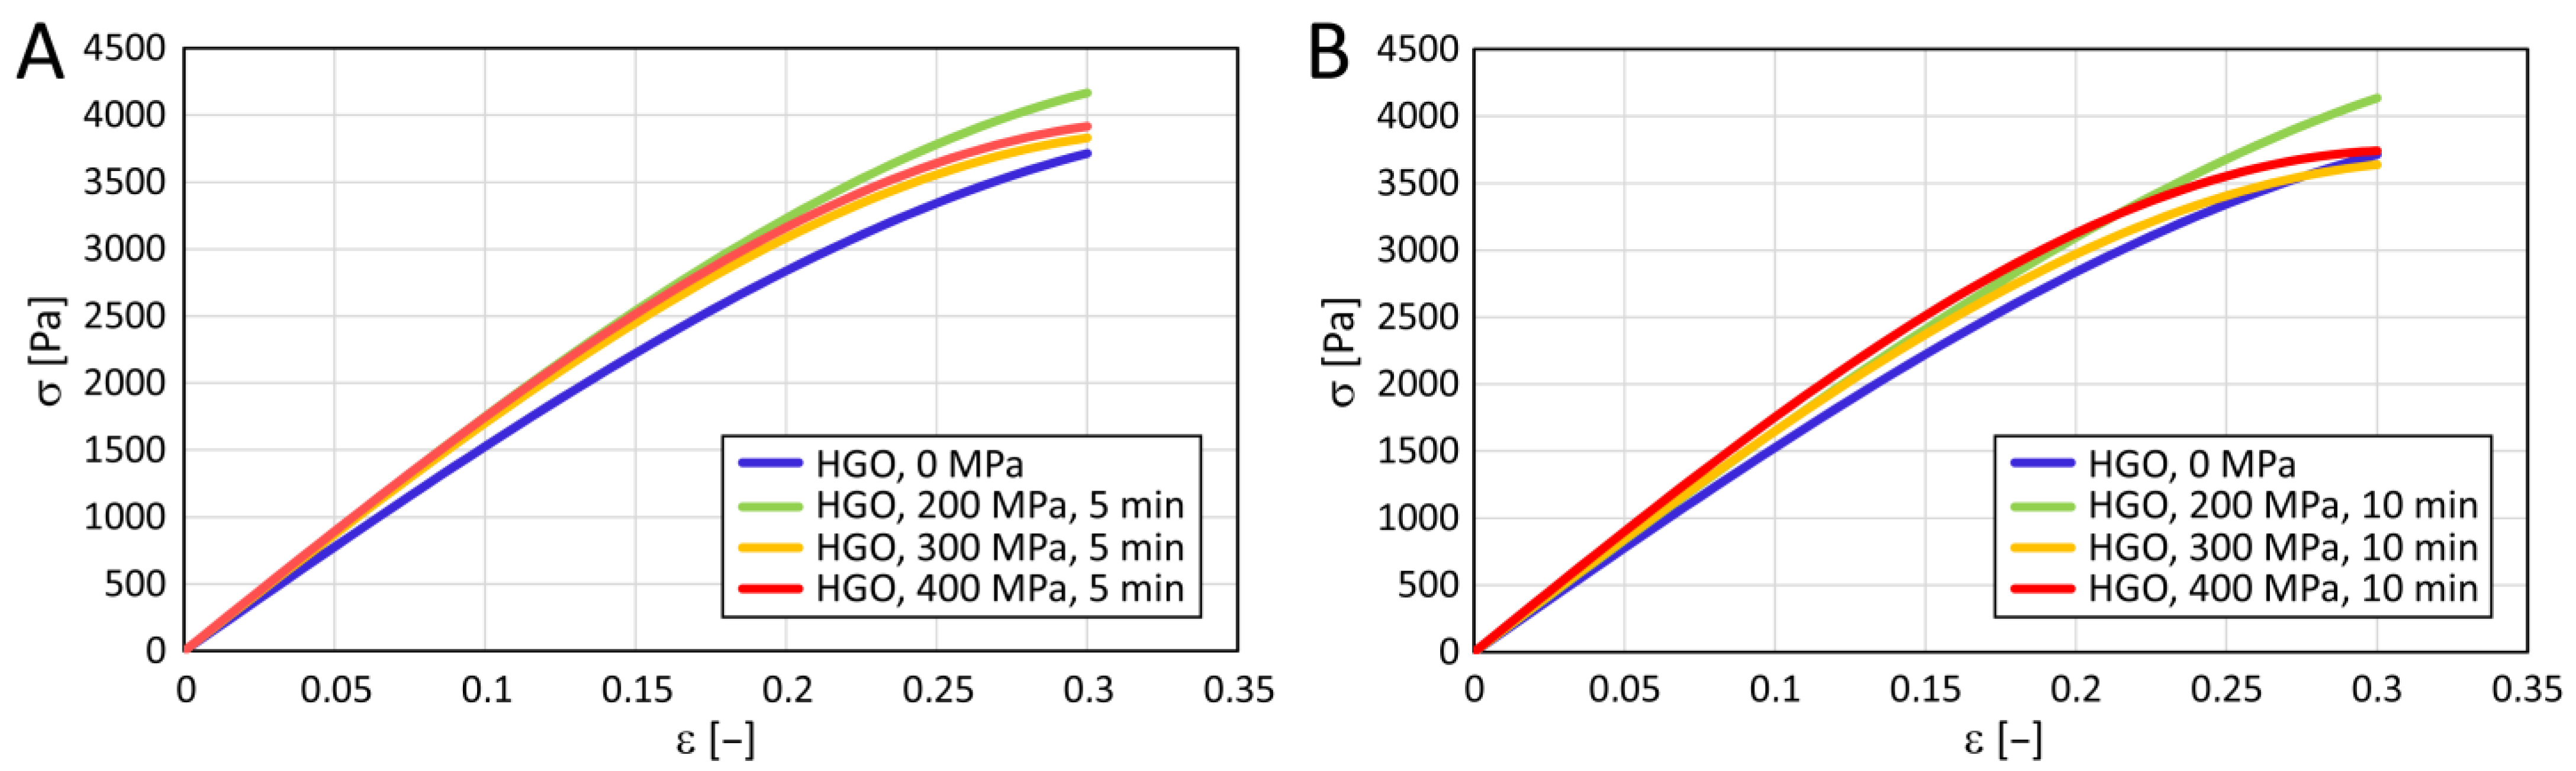
Our data can be described by almost any hyperelastic model (e.g., the Holzapfel–Gasser–Ogden three-parameter model (HGO) [
25]). For uniaxial loading where deformation is less than 0.3, the HGO model can be simplified to a two-parameter model:
In the case of very small deformations
ε or for
k1 = 0, the model reduces to the form of Hooke’s model, where
E represents the modulus of elasticity (or Young’s modulus when there is uniaxial tension). We have successfully used this approach to model the mechanical behavior of collagen gels in our previous studies (e.g., under uniaxial tension [
26]). For the identification of the HGO model and for calculating the associated statistics, the data were processed using MATLAB (The MathWorks, Inc., Natick, MA, USA).
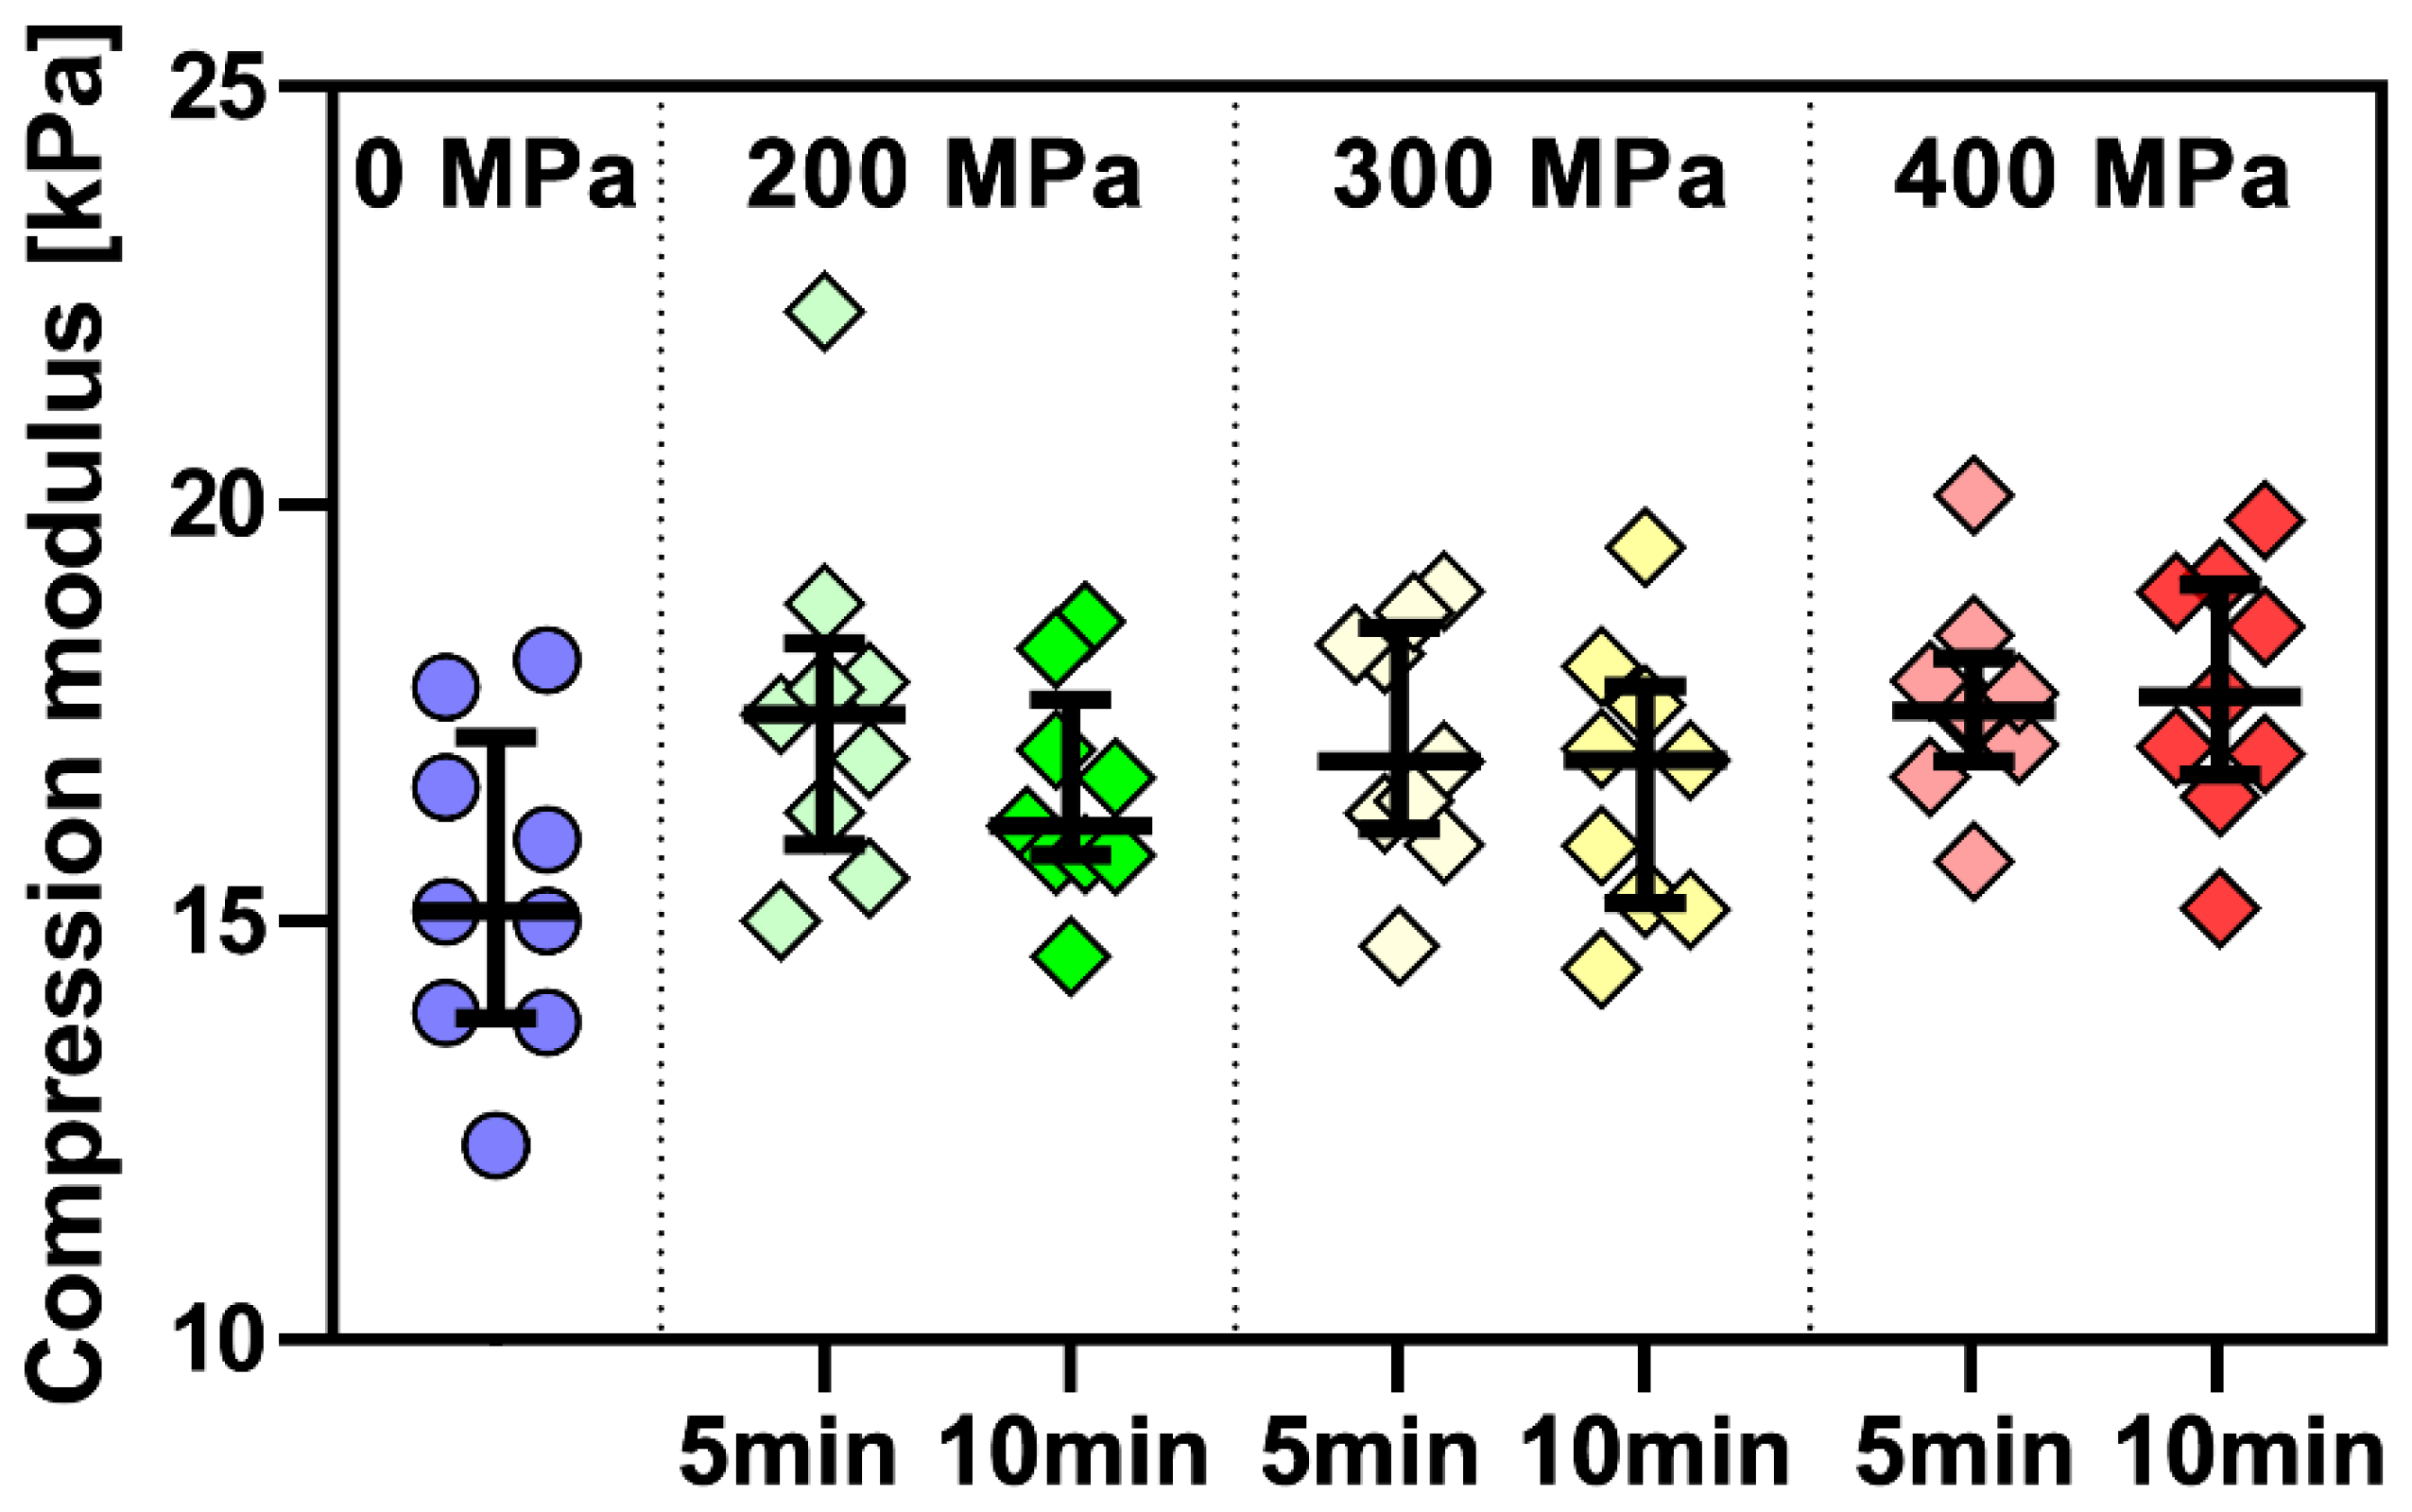
The cross-comparison of the collagen gels was carried out by comparing the HGO models using qualitative cluster analysis and, in particular, by comparing the potential changes in the stiffness characteristics of the collagen by comparing the compression moduli. The moduli of elasticity in compression were determined as the slope of the initial linear part of the stress-strain relationship (ε 0.05–0.15) for each sample (i.e., n = 9 in each group).
2.8. Measurement of Thermal Properties
A Perkin Elmer Diamond DSC (PE Systems Ltd., Prague, Czech Republic) differential scanning calorimetry device with an Intracooler 2P temperature unit was used for thermal measurements. The samples were placed in aluminum capsules with a collagen weight of 10–50 micrograms. The measurement was carried out while increasing the temperature of the capsule. Each measurement was repeated at least five times. The device software evaluates, from the measured energy consumption required to heat the sample, the temperature at the beginning of the peak Ton, the temperature at the peak Tpeak, the height of the peak Hpeak, and the value of the area under the peak (i.e., ΔH), which is proportional to the energy of the reaction caused by heating the sample.
2.9. Determination of Total Water Content
The determination of the free water and the interstitial water (directly bound to the triple-helix) [
27] was performed using the ISO 6496:1983 standard (Animal feedstuffs—Determination of the moisture content), that is, drying to 160 ± 2 °C for 4 h (dryer—Memmert GmbH + Co. KG, Büchenbach, Germany); scales—Mettler-Toledo Ltd. (Prague, Czech Republic).
2.10. Infrared Spectrometry (FTIR)
The secondary structure of the collagenous materials was analyzed using infrared spectrometry with an iS50 infrared spectrometer (Nicolet Instrument, Madison, WI, USA) in reflection mode (ATR) with a diamond crystal (GladiATR, PIKE Technologies, Madison, WI, USA). Collagens were scanned in a freeze-dried state after 400 MPa of pressure in a gel state for 5 and 10 min. The materials were measured 20 times (n = 20) to verify collagen homogeneity. ATR-FTIR spectra were recorded in the middle-spectral range of 4000–400 cm−1 via 64 scans at a resolution of 4 cm−1. Acquired spectra were processed using OMNIC version 9 software (Thermo Scientific, Madison, WI, USA). The areas of the amide I bands were deconvoluted using the same software and statistically evaluated.
2.11. Amino Acids by HPLC-DAD
Amino acid analysis was based on Agilent procedures (Amino Acid Analysis—Application Compendium), with some modifications [
28].
2.11.1. Chemicals and Solutions
Mobile phase A: aqueous buffer containing 10 mM Na2HPO4 (anhydrous), 10 mM Na2B4O7 (decahydrate), 5 mM NaN3, pH set to 8.2 (with conc. HCl), and filtered through 0.2 µm nylon filter. Mobile phase B: acetonitrile, methanol, water (45:45:10, v/v/v). Injection diluent: 100 mL mobile phase A and 0.4 mL H3PO4 (85%). Ortho-phthalaldehyde (OPA), 9-fluorenylmethyl chloroformate (FMOC), and the borate buffer (0.4 M in water, pH 10.2) provided by Agilent (in a kit). For hydrolysis, 0.1 M HCl, 6M HCl was purged with N2 for at least 30 min. Needle wash: mobile phase B. Reconstitution solution: 500 µmol/L IS (sarcosine, norvaline) in 0.05 M HCl. Calibration solutions (in 0.05 M HCl): 21 amino acids at 90, 225, and 900 µmol/L containing IS (500 µmol/L) prepared from an Agilent AA standard kit according to instructions and stored at −20 °C. Milli-Q HPLC-grade water (>18 MΩ). All chemicals were HPLC or ACS grade and were purchased from Merck Life Science Ltd. (Prague, Czech Republic), Lach-ner, Ltd. (Neratovice, Czech Republic), Agilent (Santa Clara, CA, USA, or Linde Gas join stock company (Prague, Czech Republic).
2.11.2. Collagen Hydrolysis
A 0.5 g sample of bovine collagen was weighed into a 15 mL Hungate anaerobic glass culture tube, 10 mL 6M HCl (purged with N2) was added, and the headspace was flushed with N2, vortexed (IKA®-Werke GmbH & Co. KG, Staufen, Germany) for 30 s, and put into a laboratory oven (BINDER GmbH, Tuttlingen, Germany) at 110 °C for 20 h, with occasional inversions to mix the contents. After hydrolysis, samples were cooled down to room temperature and vortexed for 30 s. Then, 300 µL of hydrolysate was evaporated in an HPLC vial under N2 at 60 °C for 15 min (BT Lab Systems, Saint Louis, MO, USA). To the dry residue, 1 mL of reconstitution solution was added, vortexed for 1 min, and filtered through a 0.2 µm nylon syringe filter into an HPLC glass vial with a silicone/PTFE screw cap (Chromservis Ltd., Prague, Czech Republic). Each sample was prepared in ten replicates.
2.11.3. HPLC-DAD
An Agilent (Santa Clara, CA, USA) type 1260 Infinity II HPLC consisting of a degasser, column oven (40 °C), autosampler (5 °C), and a DAD detector equipped with an Agilent Poroshell HPH-C18, 3 × 100 mm, 2.7 µm column with a guard column (HPH-C18, 3 × 5 mm; 2.7 µm), were used. Derivatization vials: borate buffer, OPA, FMOC, and injection diluent. On-line derivatization (autosampler) procedure: valve to bypass, needle wash for 10 s, wait 0.3 min, draw 2.5 µL borate buffer, draw 1 µL sample, needle wash 5 s, mix 3.5 µL in air 5 times, wait 0.2 min, draw 0.5 µL OPA, mix 4 µL in air 10 times, draw 0.4 µL FMOC, mix 4.4 µL in air 10 times, draw 32 µL from injection dilution sol., mix 20 µL in air eight times, needle wash 10 s, inject, wait 0.4 min, valve bypass. Gradient (only mobile phase B given): 0 min 2%, 0.45 min 2%, 13.5 min 57%, 13.6 min 100%, 17.6 min 100%, 18 min 2%, 23 min 2%. Mobile phase flow: 0.62 mL/min. A four-point calibration (including origin) using the two IS was drawn with R2 > 0.999 for each amino acid. Wavelengths: 338 nm for OPA derivatives (10 nm bw. 390 nm ref. and 20 nm ref. bw.) and 262 nm for FMOC derivatives (16 nm bw. 324 nm ref. and 8 nm ref. bw.).
2.12. Scanning Electron Microscopy (SEM) and the Characterization of the Orientation of the Collagen Fibrils
To visualize the morphology and orientation of the collagen fibrils of collagenous materials before and after pressure application, they were scanned using a STEM Apreo S2 microscope (Thermo Scientific, Madison, WI, USA), in high vacuum mode with an Everhart–Thornley detector in secondary electron mode at 5 and 10 keV. Several randomly selected samples were examined for inhomogeneity. The materials were fixed using Palay solution [
29] for 2 h at room temperature, followed by overnight fixation at 4 °C. The fixed samples were washed in a phosphate buffer and an ethanol and acetone dehydration series using a Leica EM TP tissue processor (Specion Ltd., Prague, Czech Republic) and dried on a Leica EM CPD300 critical point drier. The dried samples were then mounted on stubs using carbon adhesive stickers and sputter coated with Pt in an Ar atmosphere using the Leica EM ACE600 coating system. Overview electron micrographs were then taken at magnifications of 5000× and 10,000×.
2.13. Statistical Analysis
Statistical analysis (water content, FTIR, amino acid composition, and mechanical properties during compression) was performed in GraphPad Prism (ver. 9.5.0 (730), GraphPad Software, San Diego, CA, USA). The normality of the data was verified using Shapiro–Wilk’s test and the construction of Q-Q plots. The homoscedasticity was verified using Levene’s and Bartlett’s tests. Non-parametric analysis was employed since the assumption of normality or homoscedasticity was violated. The Kruskal–Wallis test for multiple comparisons was performed with a subsequent post hoc test based on Dunn’s test. The Mann–Whitney test was performed to compare differences between two independent samples. Statistical significance was accepted at p ≤ 0.05.
2.14. Rheological Measurement
All rheological parameters were measured repeatedly for pressurized collagen samples. Arithmetic means and standard deviations were calculated for all parameters. These values were plotted in all figures (bar segments represent mean values, and abscissas represent confidence intervals). Statistical evaluation of the data was performed using analysis of variance and statistical QC Expert 3.1 software (TriloByte Statistical Software, s.r.o., Pardubice, Czech Republic). For collagen, the following factors were investigated: pressure levels of 0, 200, 300, and 400 MPa, with 5 and 10 min holding times for each pressure level. The oscillation frequency was applied in the 0.1–1.778 Hz range, corresponding to an angular velocity
ω of 0.628–11.168 rad/s. All measurements were made at a temperature of 10 °C. The observed “real” parts G′ (storage moduli), that is, the “real” part of the complex modulus of elasticity G and the “imaginary” part G′′ (loss moduli), were correlated with the angular velocity
ω using the following linear viscoelasticity model of combined Kelvin–Voigt–Maxwell models (Barnes [
30]), as seen in
Figure 2 and Equations (3) and (4).
Remark: µi = Gi⋅τi
Viscosity η and the complex modulus of elasticity in shear G represent a parallel damper-spring combination (Kelvin Voigt model), while the viscosity µ represents series-connected dampers. A special case of this general viscoelastic model is the Maxwell model for zero damping viscosities (ηi = 0). The usual four-parameter Maxwell model (n = 2, ηi = 0) represents an excellent approximation of the storage modulus G′ but cannot describe the loss modulus G′′ due to the asymptotic properties at high frequencies (i.e., all Maxwellian G′′ terms approach zero at ω → ∞).
Therefore, a combined three-parameter Kelvin–Voigt–Maxwell model using non-zero parallel viscosity was tested as an alternative ηi for n = 1 (or a six-parameter model for n = 2). The parameters of the combined models could be adjusted to describe the plateau and the growing region (i.e., “G”).
Since elastic properties prevailed for small deformations in the tested collagen samples (G′ > G′′), only G′ data and a simple Maxwell model were used. Parameters for the two terms of the Maxwell model G
1, G
2, µ
1, and µ
2 were found using non-linear regressions of the G′ data using DataFit software version 6.1.10 (Oakdale Engineering, Pittsburgh, PA, USA) and Equation (3) simplified for η
1 = η
2 = 0 and
n = 2. Parameters of the Maxwell model G
1,2 and μ
1,2 were correlated relative to pressure P
I and holding time D
I. Relationships were examined using DataFit statistical software version 6.1.10. Parameters were correlated using linear relationships, as follows:
Statistical significance was assessed by comparing correlation coefficients and critical values for this parameter at a significance of α = 0.05 and degrees of freedom d
f = the number of experimental points minus the number of model parameters: 7 − 3 = 4; r
crit, 4 = 0.811. Data on critical values of correlation coefficients were taken from a publication by Štěpánek [
32].
2.15. Measurement of Mechanical Properties
The data of axial stresses, which depend on relative strain ϵ, was approximated by the least squares regression method using MATLAB (The MathWorks, Inc., Natick, MA, USA). software using Equation (2). As described above, this software determined the numerical values for coefficients E and k1 of Equation (2).
2.16. Measurement of Thermal Properties
From the data of nine replicates, mean values, standard deviations, and confidence intervals at the 0.05 significance level were calculated for all tested collagen samples. In addition, all thermal properties data were subjected to Analysis of Variance (ANOVA) (QC Expert Software, TriloByte Statistical Software, Ltd., Pardubice, Czech Republic) to determine whether there was a statistically demonstrable dependence of the measured thermal properties on the amount of applied pressure and duration of pressure.
4. Discussion
No rheological properties of UHP-treated bovine collagen measured in the small-amplitude linear viscoelastic region were found in the existing literature. Additionally, no mechanical properties of UHP-treated bovine collagen, measured by compressing collagen cylinders between two plates, or thermal properties of high-pressure-treated bovine collagen were found in the literature. However, these properties were found for porcine collagen (Potekhin et al. [
22]) and bullfrog skin collagen (Nan et al. [
23]).
Potekhin’s team measured thermal properties at pressures up to 200 MPa acting directly in a DSC calorimeter. They evaluated the mean temperature at denaturation transition T
m and denaturation energy ΔH. The T
m parameter increases with increasing pressure following a non-linear equation (p is pressure in MPa, T
m in °C), as follows:
This equation predicts a change in the mean temperature during collagen denaturation from 41.4 °C to 47.7 °C. The parameter T
m can be compared with the data T
peak in
Figure 9. Both the T
peak valid for the denaturation of frog collagen and the T
peak valid for bovine collagen increase with increasing pressure.
The denaturation energy ΔH, as presented in [
22], decreases slightly with increasing pressure by about 5%. Our data for this parameter are presented in
Figure 11. No downward trend can be established for pressures up to 200 MPa.
Nan et al. [
23] treated bullfrog skin collagen; the study aimed to determine the effect of ultra-high pressure on the structure and properties of collagen. Native collagen extracted from bullfrog skin was processed under different ultra-high pressure treatment conditions of 300, 400, and 500 MPa. The samples were prepared as solutions in acetic acid. The pressure medium was water, and the samples were treated at 10 °C for 15 min. After pressurization, the samples were frozen and lyophilized. Before thermal analysis using the DSC method, the samples were reconstituted again in an acetic acid solution. For these reasons, it is impossible to compare the absolute values of our measurements with the results of their work [
23]; instead, we can compare only the trends of dependence on the applied pressures.
The mean denaturation temperature varied from 35.4 °C for the non-pressurized collagen solution to 36.2 °C for the collagen solution pressurized to 500 MPa. The effect of pressure from 300 to 500 MPa was statistically inconclusive. The mean denaturation temperatures determined in our tests range from 35.3 to almost 36 °C, as seen in
Figure 10. These data show excellent agreement, despite the different origins of the collagen samples.
The denaturation enthalpy ΔH depends on the applied pressure value from 1.4 J/g for the unpressurized sample, then 1.9 J/g for 300 MPa, 1.1 J/g for 400 MPa, and 0.9 J/g for 500 MPa. The heat-treated sample had a value of ΔH = 0.5 J/g. It is clear from these data that the value of the denaturation enthalpy has a maximum of 300 MPa, but as pressure increases, there is a significant decrease in the denaturation energy.
If we compare our data in
Figure 11, we find a statistically significant increase from the untreated sample to the sample treated at a pressure of 200 MPa, but only for a holding time of 5 min. An increase in pressure to 300 MPa with a holding time of 10 min caused the ΔH value to reach a maximum. If a higher pressure was applied (i.e., 400 MPa), there was a decrease in the average value, although it is statistically inconclusive. Our values are considerably higher than those of the cited authors. The average value of ΔH reached approximately 4 J/g, whereas the average value for frog collagen was 1.3 J/g. The different sample origins could cause this almost threefold difference, but it is most likely caused by the different methods used to prepare the dry matter (i.e., the use of acetic acid solutions). It appears that the trends of dependence on the applied pressure are similar.
Gauza-Włodarczyk et al. [
41] studied the thermal properties of fish and beef collagen using the DSC method. Bovine collagen was prepared from the Achilles tendon and was used in a dry state. The denaturation temperature was 220 °C. This value is quite different from the values we found for bovine collagen. The reason may be that our collagen was in its natural state and had a dry weight of 7.44% compared to the dry state used by the authors of the cited work.
Zhang et al. [
42] studied bovine collagen and its properties, including denaturation temperatures, which reached a value of 37.5 °C. This temperature was very close to our measurements.
Lin and Cheng Liu [
43] studied type I collagen from bird feet (BF), bovine skin (BS), frog skin (FS), porcine skin (PS), and shark skin (SS) and compared their thermal stability. The thermal transition temperatures of type I collagen from different animals decreased as shown: BF > BS > PS > FS > SS. PS collagen had a higher extractable uronic acid/protein ratio and the lowest enzymatic sensitivity. In summary, collagen BF had a higher value of hydroxyproline (Hyp) + proline (Pro) and showed higher thermal stability; PS collagen contained a more significant amount of glycosaminoglycan, resulting in high enzyme resistance. However, BF and PS collagen should be used in biomaterials due to their better biostability.
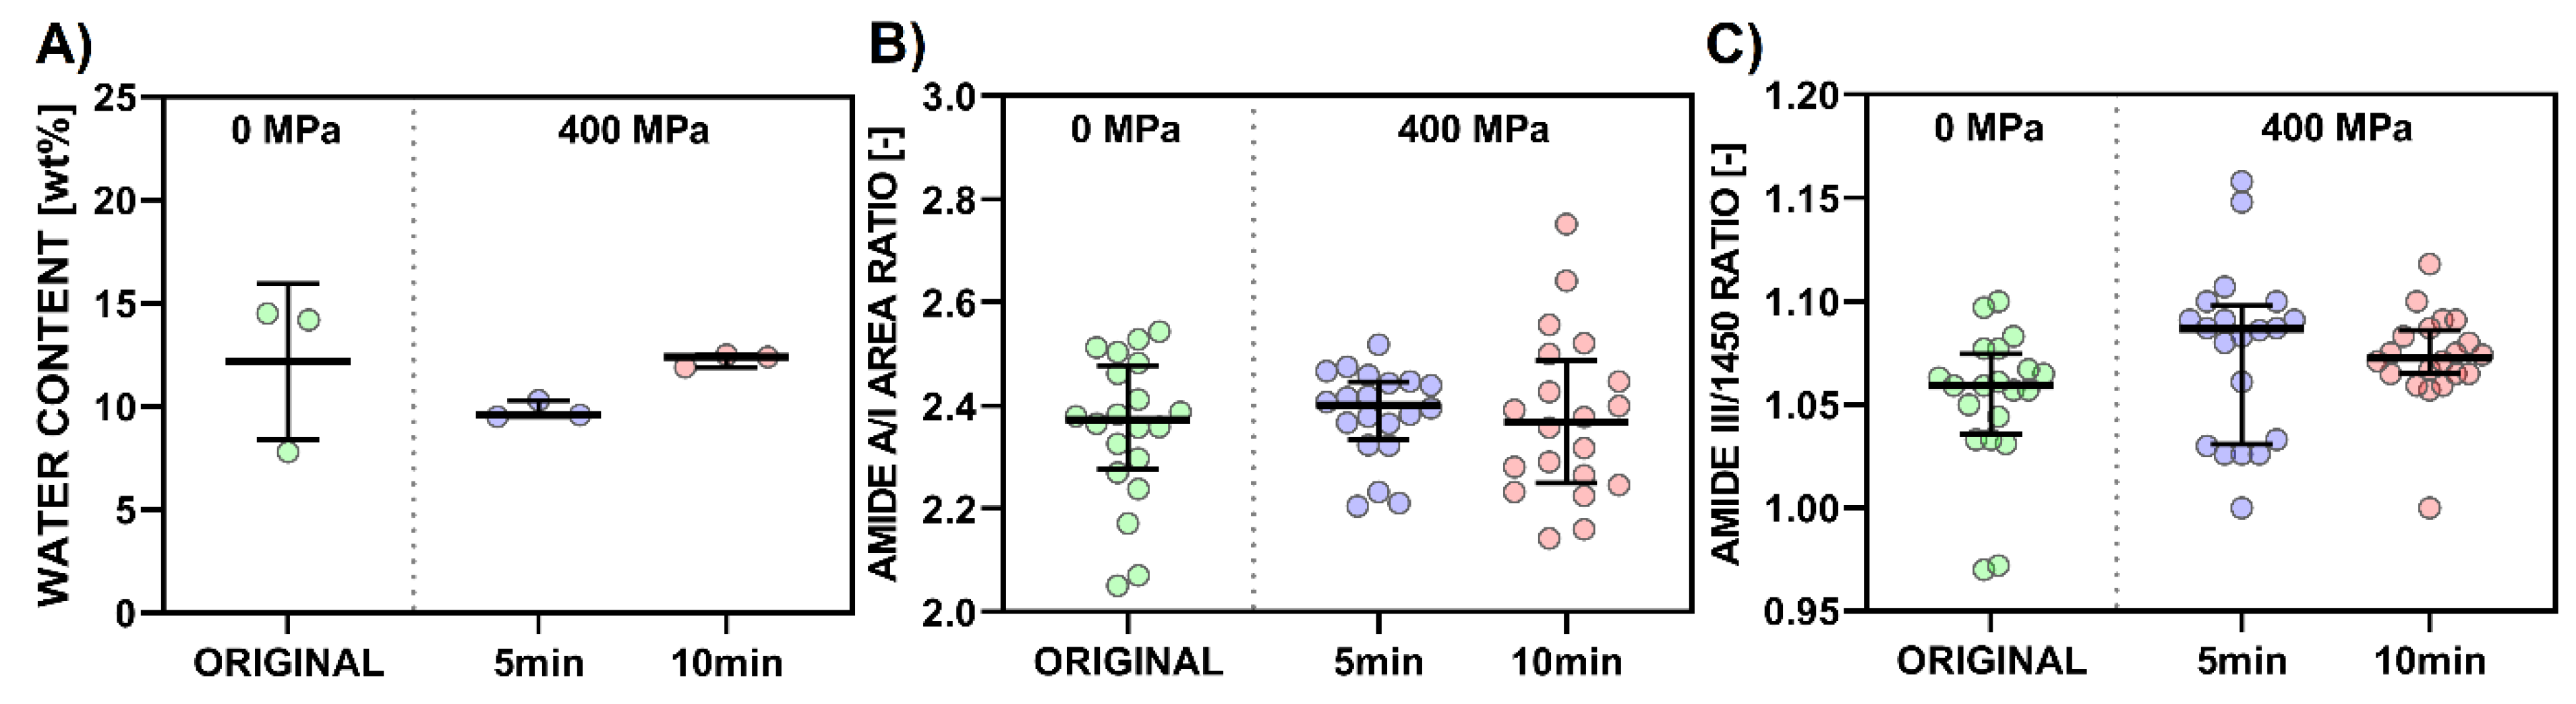
As seen in
Figure 13, collagen spectra after 400 MPa in a gel state do not show significant changes compared to the original states, regardless of the holding time. A/I ratios show no statistically significant differences, with the greater data scattering representing local inhomogeneities (
Figure 12B). The degree of crosslinking is comparable in all cases. Intensity ratios of amide III/1450 cm
−1 ranged from 0.97 to 1.15; these values correspond to collagen, while a ratio around 0.76 is typical for gelatin [
44]. No statistically significant differences were found (
Figure 12C). Collagen’s integrity, in gels, was not damaged even after 400 MPa for 5 and 10 min. Collagen’s triple helix structure, represented by the main band at 1660, can be used as a marker of collagen change. No statistically significant differences were determined in this area (
Figure 14C). Changes in other parameters range from 1 to 2%. The 1610 spectral band (
Figure 14A) can be assigned to the spectral manifestation of aromatic amino acids, which may be more spectroscopically active in disintegrated states of collagen (i.e., gelatin) [
45]. Band 1630 represents a denatured state of a collagen left-handed 3–10 helix (
Figure 14B), and band 1690 (
Figure 14D) represents β-turn and antiparallel β-sheet structures [
40]. Beta sheets consist of β-strands (chains are typically 3–10 amino acids long) that are connected laterally by hydrogen bonds, thus forming a twisted, pleated sheet. Two sub-bands in the amide I spectral peak, 1660 and 1690 cm
−1, are of particular interest (
Figure 14E).
The 1660/1690 ratio can be used to evaluate mature and immature collagen crosslinks [
46]. These crosslinks are present naturally in collagen and can be strongly influenced by parameters of the source animal (genus, sex, age).
Figure 14E shows that this ratio does not decrease after applying high pressure. Thus, there is no damage to the mature crosslinks initially present in the analyzed collagen matrix since mature trivalent interfibrillar crosslinks present in collagen are generally more resistant to various types of attack (chemical, thermal, radiation, etc.). Production of mature crosslinks starts at birth and gradually increases with age [
47]. It has been shown before [
41,
48] that mammalian collagen (e.g., bovine) is more stable than marine collagen. Our conclusions correlate with the published results of Nan et al. [
23], who studied the effect of high pressure on bullfrog collagen. They concluded that at low pressures (up to 400 MPa), the perpendicular pressure to the collagen axis dominates and leads to a tightening of the triple helix, while at high pressure (>400 MPa), forces acting parallel to the collagen axis dominate and triple helix tends to dissociate like a zipper. Heremans and Smeller [
49] state that high pressure rarely affects covalent bonds, and even α-helix and β-sheet structures appear almost incompressible. In aqueous solutions, pressure mainly affects tertiary and quaternary protein structures.
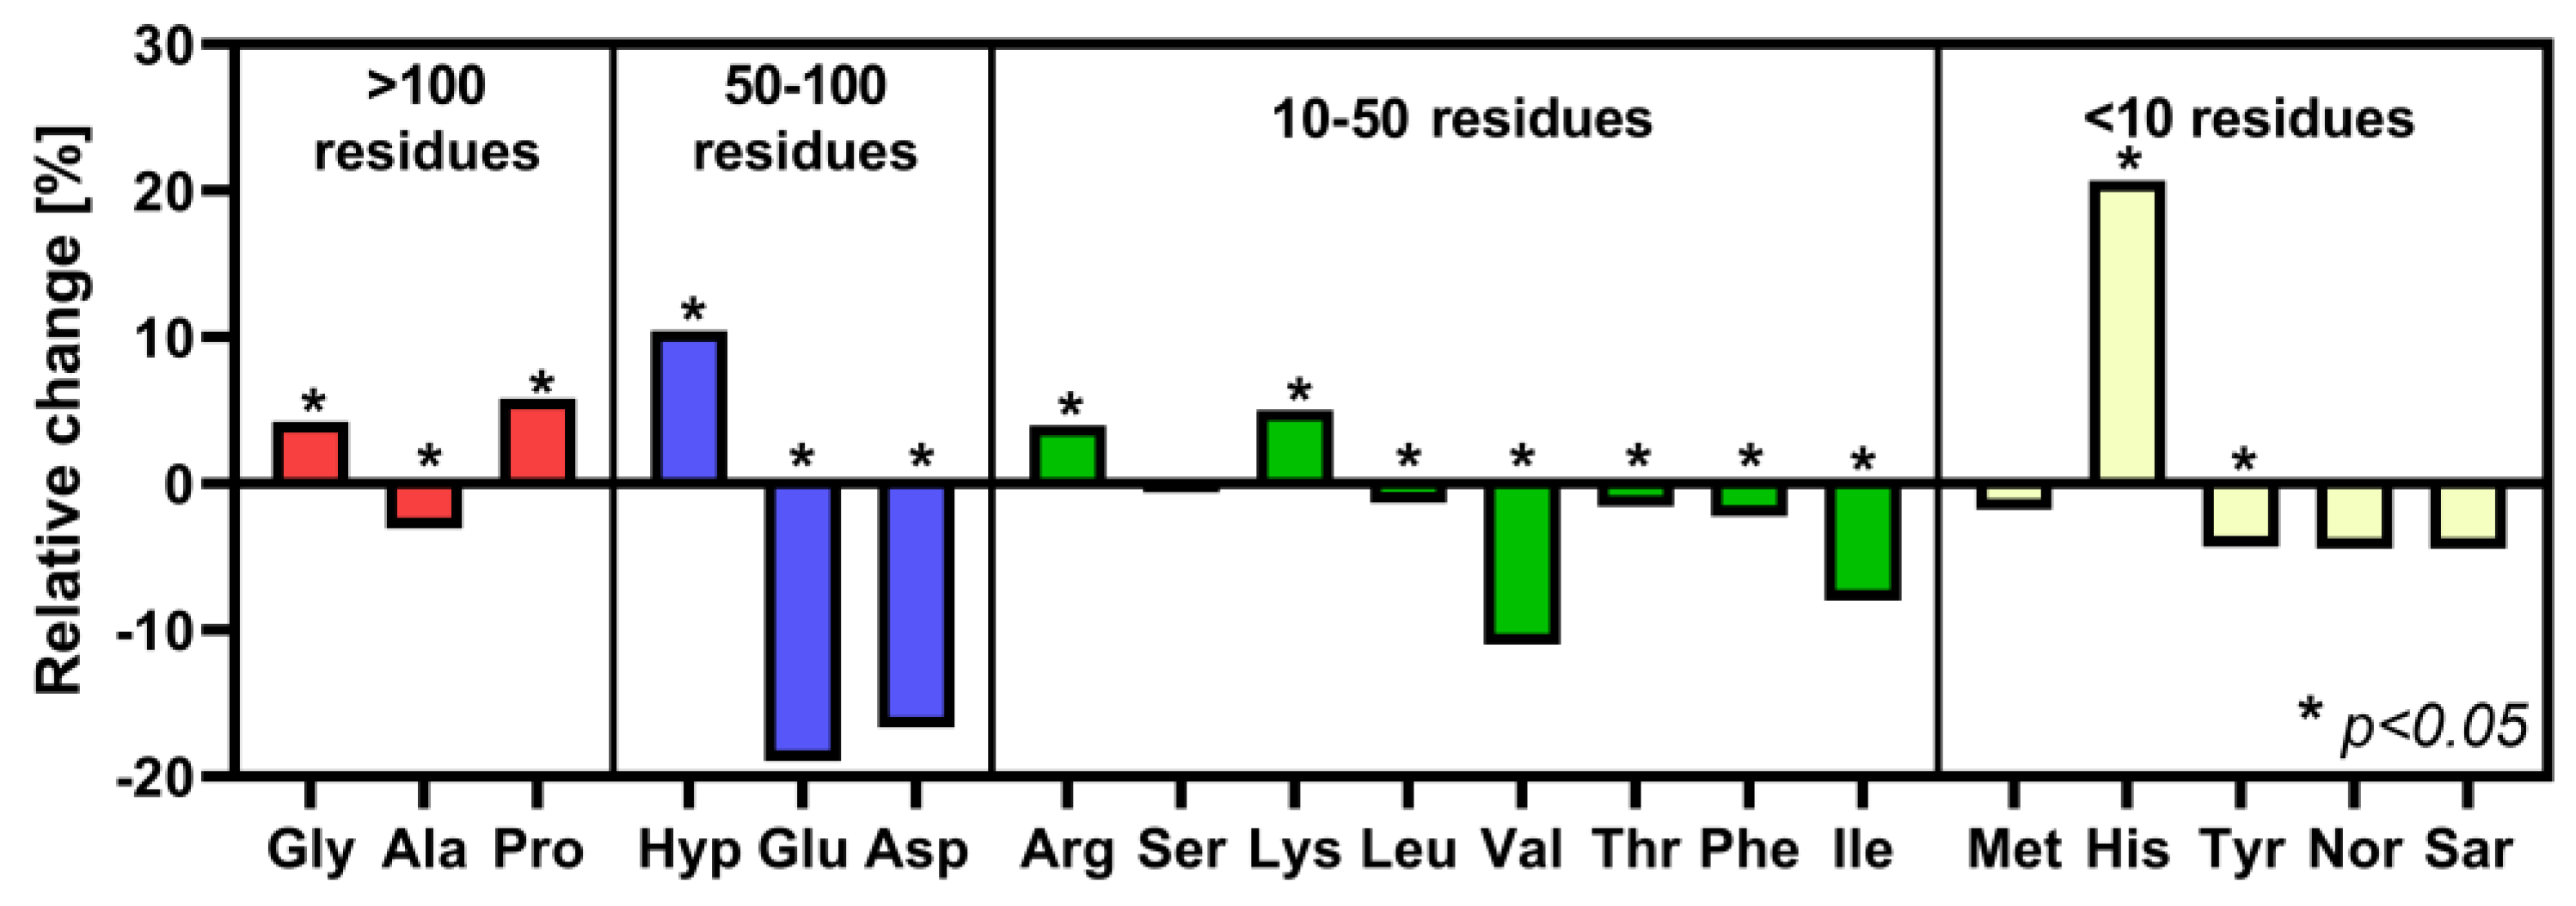
Our amino acids analysis cannot be compared with literature data because, to our knowledge, amino acid composition changes after high-pressure bovine collagen treatment have not been published. It is only possible to find scientific works that deal with the change in the concentration of amino acids in meat or other protein products after applying pressure, but not in collagen materials. These products contain a whole range of proteins, including non-collagenous ones, so these results are difficult to compare. The amino acid triplet Gly, Pro, and Hyp form repetitive sequences in collagen, and His shows an increase, therefore showing resistance to pressure. Hyp increases the stability of the collagenous triple-helix. The unique triple-helical motif (Gly-Pro-Hyp) is responsible for collagen higher-order assembly and mechanical strength [
50]. Histidine can be a part of mature crosslinks, which show high stability and resistance to various treatments [
47]. An increase in His concentration was also shown by Ahmed et al. [
51], following high-pressure treatment at 375 MPa for 20 min. The increase is apparently caused as compensation for the decrease in other amino acids.
In the absence of chemical agents or the formation of radicals by radiolysis, the conversion of amino acids into each other is unlikely. The Glu, Asp, Val, and Ile belong to aliphatic amino acids, show decreased concentration, and are more sensitive to UHP. The side chains of Glu and Asp have carboxylic acid groups whose pKas are low enough to lose protons, becoming negatively charged. Appropriate amounts of UHP cycling can disrupt hydrogen bonds, ionic bonds, and disulfide bonds [
52]. Opposite this, Val and Ile are non-polar with long carbon chains; consequently, they are hydrophobic. UHP strongly modifies the structure of water, which allows exposure of the non-polar surface to water and eventually completely stops hydrophobic interactions resulting in the reorganization of amino acid residues in peptide chains [
52]. SEM microscopy showed that 400 MPa for 10 min did not evoke significant changes in configuration and ordering over longer distances than the original collagenous gel. As shown by our previous studies [
29,
46], fibril bundle orientation (i.e., the tertiary and quaternary structure of collagen) plays a significant role in the mechanical properties of gels.
5. Conclusions
5.1. Rheological Properties
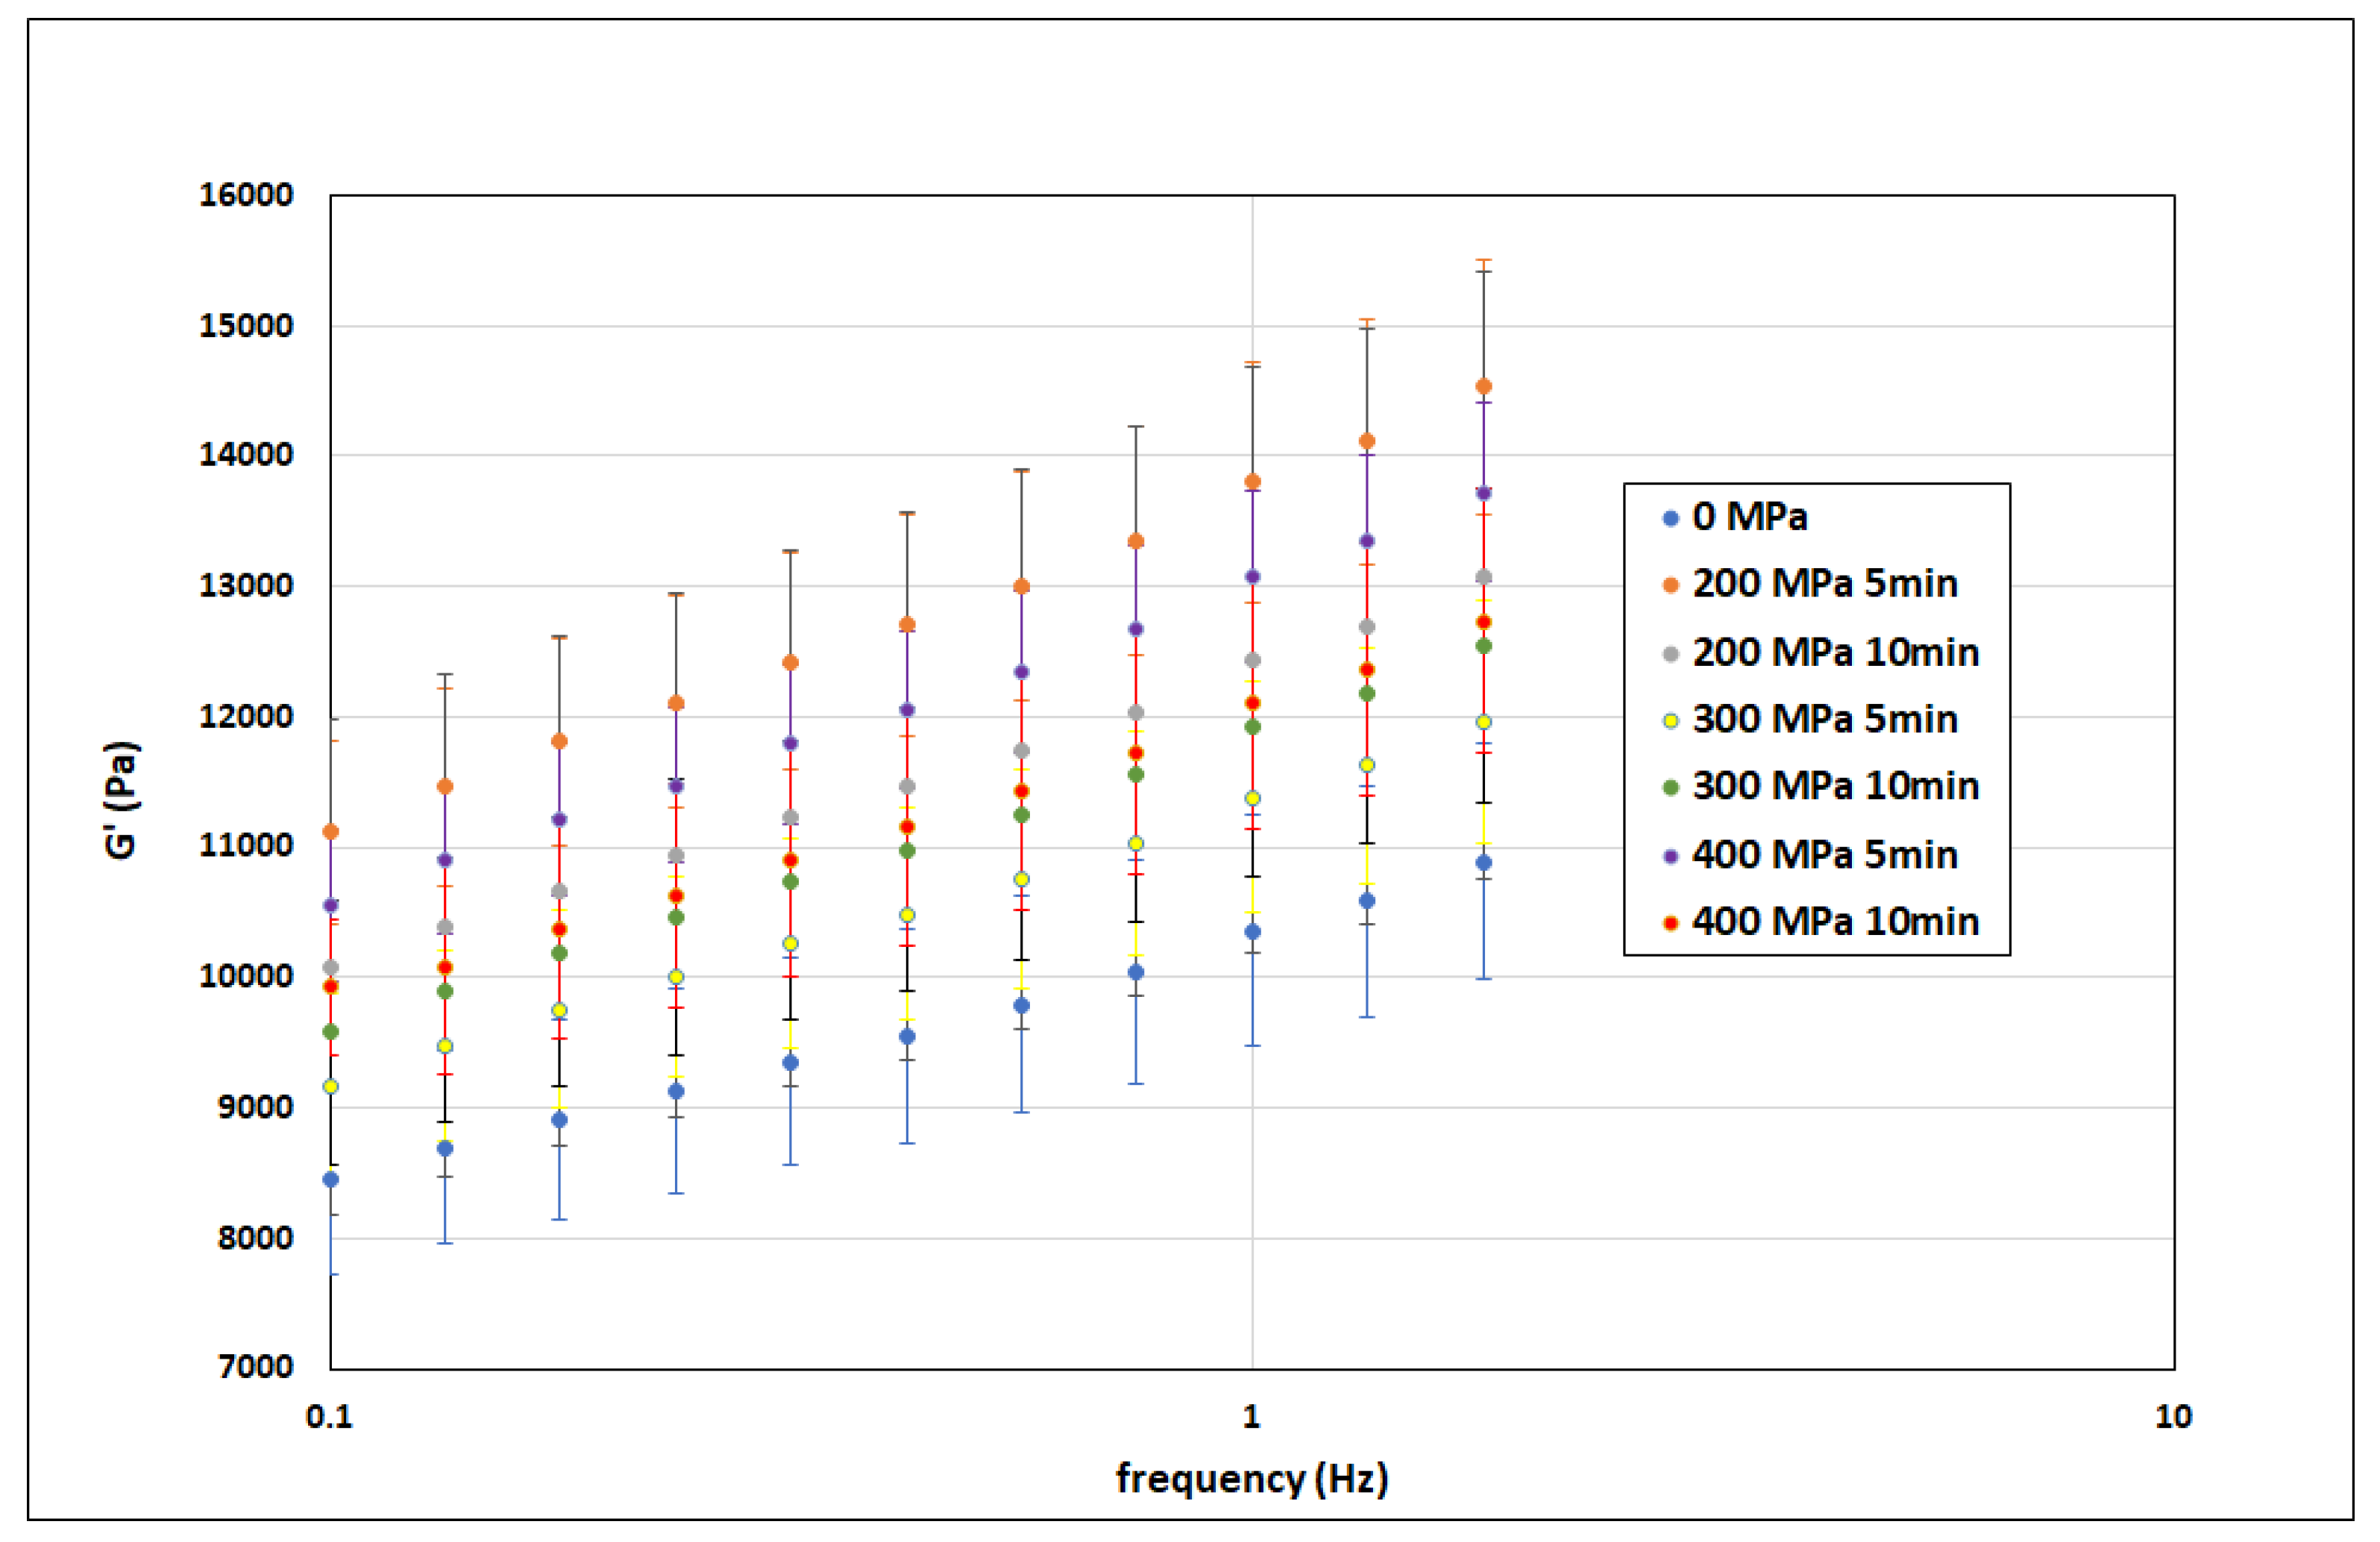
The viscoelastic properties of the measured bovine collagen sample can be characterized as the area of linear viscoelasticity at small oscillation amplitudes using the parameters G′ and G′′ for the measurement temperature of 10 °C and pH 2.13. The parameters G′ and G′′ increase with increasing frequency and the angular velocity of oscillations, respectively.
The elastic modulus G′ can be characterized by a simplified combined Kelvin–Voigt–Maxwell model (see Equation (3)). This equation statistically convincingly describes the experimental data valid for a given collagen sample. We tried to correlate the parameters of the simplified Kelvin–Voigt–Maxwell model G1 and G2 using Equations (5) and (6). It has been shown that these parameters do not depend statistically conclusively on the pressure or hold times in the range of the values used for these process parameters. The G1 value can be characterized by the constant a1 = 9804.4 Pa. The G2 value can be characterized by the constant d2 = 2246.5 Pa.
5.2. Mechanical Properties
The dependence of the stress Ϭ on the relative deformation ϵ can be described very well using Equation (2). The regression line representing this equation fits well with the experimental data. The effect of pressure on the elastic modulus measured by compressing cylinder-shaped collagen samples was statistically negligible.
5.3. Thermal Properties
Using a high-quality apparatus for determining the thermal properties of collagen, working on the principle of differential scanning calorimetry, numerical values of these properties were determined for collagen samples under different pressures.
By analyzing the variance of all experimental values, it was determined that the temperature at the beginning of the thermal reaction caused by the heating of the Ton collagen sample was statistically demonstrably dependent on the pressure and holding time. The ΔH parameter showed the same dependence. This parameter represents the area under the peak of the curve, which characterizes the energy required for the ongoing reaction caused by heating the collagen sample.
The Tpeak parameter shows a statistically significant dependence on the pressure but is independent of holding time. The Hpeak parameter, on the other hand, does not depend on pressure but statistically significantly depends on holding time.
5.4. Overall Rating, Limitations, and Practical Implications
The rheological properties measured as the area of linear viscoelasticity were not changed statistically significantly due to the influence of pressure or holding time. In addition, the mechanical properties measured by compression between two plates were not statistically significantly influenced by either the pressure or the hold time. The thermal properties Ton and ΔH measured using differential calorimetry depend on both pressure and hold time.
The results of amino acids and FTIR analysis showed that the exposure of the collagenous gels to high pressure of 400 MPa, regardless of hold time (5 and 10 min), caused only minor changes in the primary and secondary structure while preserving collagenous polymeric integrity. SEM analysis did not show changes in ordering and collagen fibrils orientation over longer distances after 400 MPa for 10 min.
As known from the literature (e.g., [
20]), UHP inactivates living microorganisms, a wide range of food pathogens, and endogenous enzymes that cause spoilage and extends shelf-life with a minimum impact on sensory and other quality parameters. This technology can be used for microbial stabilization of collagen without significant changes in its properties, as shown in this paper.
However, the results from this study relate to bovine collagen treated with 400 MPa for 10 min and cannot be applied to collagen in general. Collagen can be extracted from various animal sources and such natural material embodies high inhomogeneity. Collagen integrity, structure stability, and resistance to various treatments (chemical, thermal, irradiation, and UHP) are influenced by animal genus, sex, age, breeding, and so on, as well as extraction methods and other treatments.
There is a limit related to the source of collagen—only bovine collagen has a high mass fraction. The rheological properties are limited only to the linear viscoelasticity and range of used deformations. Mechanical properties were measured up to the limited allowable deformation.
Ultra-high-pressure (UHP) treatment is a technology applicable to food and biomaterial preservation. As shown by many publications, industry applications already exist. With any treatment, there is always a potential risk of adverse effects on the properties of treated materials. Our research confirmed that using UHP does not change the essential properties of treated products.
We found no changes in rheological properties affecting the transport or subsequent treatment of the product. No special or additional changes to the mechanical apparatuses are required. Since the mechanical properties of the product are not changed by UHP treatment, there are no reasons to expect changes in sensory properties concerning consumability (chewing and swallowing). Treated products can withstand the same mechanical load before and after UHP treatment. Thermal properties exhibited a change after UHP treatment, which must be considered before thermal treatment of the product.


 ,
, 


